

Abstract
Bacterial biofilms are assemblages of bacterial cells and extracellular matrix that result in the creation of surface-associated macrocolony formation. Most bacteria are capable of forming biofilms under suitable conditions. Biofilm formation by pathogenic bacteria on medical implant devices has been linked to implant rejection in up to 10% of cases, due to biofilm-related secondary infections. In addition, biofilm formation has been implicated in both bacterial persistence and antibiotic resistance. In this study, a method has been developed for the discovery of small molecule inhibitors of biofilm formation in Vibrio cholerae, through the use of high-throughput epifluorescence microscopy imaging. Adaptation of a strategy for the growth of bacterial biofilms in wellplates, and the subsequent quantification of biofilm coverage within these wells, provides the first example of an image-based 384-well format system for the evaluation of biofilm inhibition in Vibrio cholerae. Application of this method to the high-throughput screening of small molecule libraries has lead to the discovery of 29 biofilm lead structures, many of which eliminate biofilm formation without altering bacterial cell viability.
Introduction
Biofilm-associated infections are estimated to underpin over 60% of all bacterial infections in humans.1 This is of particular concern with regards to nosocomial infections, indwelling medical devices (such as catheters, stents, and pacemakers), and diseases, such as cystic fibrosis, urinary tract infections, and mid-ear infections, in which chronic infection due to biofilm formation complicates the original condition. In these instances, biofilm-associated bacterial growth continues to impact survival rates and recovery times for in-patient care.2, 3
Bacterial biofilms are defined as surface associated bacterial communities that are formed at solid-liquid or air-liquid interfaces. Biofilms consist of sessile bacterial cells enclosed in an extracellular matrix composed of exopolysaccharides (EPS), proteins, and extracellular DNA.4 Substantial effort has been made to understand the structural elements of bacterial biofilm formation since their discovery in 1933.5 These investigations have been aided by the development of imaging techniques, including confocal scanning laser microscopy (CSLM), which have been used in conjunction with flow cell systems to study hydrated environmental samples. Using these methods, researchers have described numerous elements of biofilm structure, including the architecture of the extracellular matrix, and the presence of fluid channel networks within biofilm surfaces.6 Although the lifestyle change from planktonic to sessile bacteria has been significantly underestimated as a component of the bacterial lifecycle in the past, today biofilm formation is considered a prevalent phenomenon among environmental and pathogenic bacterial species, which is a contributory factor to both their persistence and antibiotic resistance.
Bacteria in biofilm states have been shown to be 10-1,000 fold more resistant than planktonic cells to traditional antibiotics.7, 8 The precise mechanism behind this increase in antibiotic resistance remains unclear, however several complimentary elements are likely involved. The EPS matrix is capable of contributing to antibiotic resistance by either adsorbing or deactivating antibiotics, rendering them ineffective by decreasing the availability of active antibiotic species.9 In addition, many antibiotics are only effective against actively replicating cells. Cells encapsulated in these microcolonies have been found to exist in latent states, where drugs with growth-specific targets have little effect.10 Bacterial cells have been shown to demonstrate a distinct biofilm physiology, in which gene expression profiles are unique from the planktonic state. Variation of gene expression profiles in biofilm states reduces the susceptibility of bacterial cells to antibiotics that target cell replication pathways. These changes are also manifested through the expression of multidrug efflux pumps and antibiotic-modifying enzymes.11 Finally, due to the three-dimensional architecture of these macrocolonies, cells in different microenvironments are exposed to different nutrients and oxygen levels.12 These conditions lead to differentiation in cellular development such that, within a single macrocolony, smaller populations of cells can exist in different physiological states, which may have different susceptibilities to antibiotic treatment.13, 14
Biofilm-associated infections are of particular concern, because of this persistence, and resistance to traditional antibiotic therapies. The discovery of small molecule biofilm inhibitors represents a promising approach to the control and elimination of such infections. Inhibitors capable of preventing biofilm formation restrict cells to the planktonic state, where they are more susceptible to host immune responses and traditional antibiotics. Development of small molecule biofilm inhibitors therefore provides the opportunity to create combination therapies that contain both biofilm inhibitors, and antibiotics shown to be efficacious against planktonic bacterial states, in order to achieve bacterial clearance.
As noted in a recent review on biofilm resistance, “one of the main difficulties in treating biofilm infections arises from a lack of understanding of the characteristics of the biofilm mode of growth”.15 The discovery of small molecules capable of inhibiting biofilm formation is therefore not only valuable from a human health perspective, but also offers a unique platform from which to investigate biofilm regulation and physiology. Unlike genetic manipulations, which confer permanent modifications to target genes, chemical genetic probes can be applied to test systems in a selective, time-dependent manner. This permits the addition or removal of test compounds at defined points in the biofilm development process, and thus provides a unique opportunity to evaluate the role of specific biofilm-related proteins in the progression of biofilm formation.
Current Screening Methods
A number of methods exist for the evaluation of biofilm inhibition, several of which have recently been modified for use in high-throughput screening platforms (Table 1).16–19 Adaptation of the traditional crystal violet (CV) staining assay to a 96-well microtiter format has allowed for biofilm quantification using microtiter plate readers.18 However, expansion of this methodology to 384-well microtiter format has not been successful, due to a lack of well-to-well reproducibility. A novel, luminescence-based, assay to investigate biofilm formation in Pseudomonas aeruginosa has also recently been developed, which has proven more reproducible than traditional CV assays.19 This screen is designed such that biofilm formation occurs on solid pins suspended in liquid culture medium, which can subsequently be detached from pins and quantified using a luciferase-based reporter system. Using this platform, researchers developed and validated both attachment and detachment screens, which measure the disruption of biofilms by altering the timing of inoculation and compound addition to test wells.
Table 1.
Comparrison of current biofilm screening methods.
| Screen | Target Organism | Format | Advantages | Disadvantages |
|---|---|---|---|---|
| Traditional crystal violet staining assay | Pseudomonas aeruginosa, Staphylococcus aureus, Vibrio cholerae, Streptococcus pneumonia | Test tubes | - Differentiation can be visualized on the bench top - Inexpensive |
- Low throughput - Qualitative test |
| Modified crystal violet microtiter-plate test | Pseudomonas aeruginosa, Staphylococcus aureus, Vibrio cholerae, Streptococcus pneumonia | Test tubes or 96-well microtiter plates | - Quantitative measurement (OD600) - Medium throughput |
- No visualization of biofilm formation |
| Luminescence-based attachment assay | Pseudomonas aeruginosa | 384-well microtiter plates | - Quantitative - High throughput - Screens for both attachment and detachment |
- No visualization of biofilm formation - Specialized screening instrumentation required |
| PVA membrane biofouling fluorescence assay | Pseudomonas putida, Bacillus subtilis | 384-well microtiter plates | - Quantitative - High throughput - Vizualization and quantitation |
- Staining step required - Requires specialist substrate fabrication |
| Automated confocal microscopy assay | Pseudomonas aeruginosa | 96-well microtiter plates | - Visualization and quantitation. | - Time intensive - Expensive - Requires confocal HCS microscope system |
One disadvantage of current screening methods, such as crystal violet staining, is that biofilm coverage is quantified using indirect metrics. While suitable for quantifying the number of adhered cells in well plate chambers, these methods do not provide a true measure of biofilm disruption, as they do not quantify the architecture and structure of these complex heterogeneous biological assemblages. With the development of new technology in high-throughput fluorescence imaging, and more robust software for creating custom image analysis scripts, methods are emerging for the direct observation of phenotypic effects in biological systems, using high content screening (HCS) approaches. In this study, we present the application of epifluorescence high content microscopy as a tool for the automated fluorescence imaging of V. cholerae biofilms in 384-well microtiter plates.
Currently, there are few examples of the application of HCS methods to bacterial systems. In a recent screen developed by Brodin et al., fluorescence microscopy was used to image Mycobacterium tuberculosis infected macrophage cells in a 384-well format.20 A number of other HCS methods for bacterial systems have recently been published, including: a quantitative bacterial segmentation technology developed by Gross et al.21 and a technique developed for detecting bacilli in order to analyze sputum specimens for M. tuberculosis infections.22 During the preparation of this manuscript, the first report appeared describing the use of CSLM for the quantification of biofilm coverage in Pseudomonas aeruginosa.17 The authors reported the concurrent use of two fluorescent dyes, in conjunction with z-stack images of biofilm surfaces in 96-well plates, to quantify both the biovolume, and the ratio of live to dead cells within this biovolume, using 3D imaging methods. This screening approach provides a wealth of information about biofilm architecture and constitution, but requires the use of expensive reagents, and a specialized, expensive, automated confocal scanning laser microscope. By contrast, our GFP-based method for evaluating biofilm coverage is rapid and cheap to perform, and is suitable for any benchtop fluorescence microscopy system.
This new method offers several key advantages and developments over previous screening methods (Table 1). Unlike many current methods, this new technique employs both image-based analysis for the quantification of biofilm coverage, with the high-throughput 384-well format. In addition, this is the first example of image-based biofilm analysis in V. cholerae, and is the first reported example that quantifies non-biofilm phenotypes. We have used this method to identify novel biofilm inhibitors from a 3080-member small molecule library.
Known Biofilm Inhibitors
There have been few reported studies on the discovery of small molecule biofilm inhibitors to date. Current reported scaffolds include the marine natural products bromoageliferin,23 oroidin (1),23 brominated furones (2),24 and the ursene triterpenes25 as well as a number of homoserine lactone quorum sensing agents (3) (Figure 1).26 Of these, the oroidin and bromoageliferin scaffolds have been most extensively studied, with a large number of oroidin-like SAR libraries having been prepared. Modifications include: using only the bicyclic core of bromoageliferin to design compounds such as TAGE (4);27, 28 modification of the unsaturated oroidin amide linker;29–31 and development of SAR series around both the dibromopyrrole and aminoimidazole moieties.32–34 However, many of these compounds exhibit activities across order, class, and even phylum, raising questions about their utility as selective biofilm inhibitors.34 We were therefore motivated to develop a new HCS platform for the discovery of biofilm inhibitors for use as both therapeutic lead compounds, and chemical probes for investigating biofilm physiology.
Figure 1.
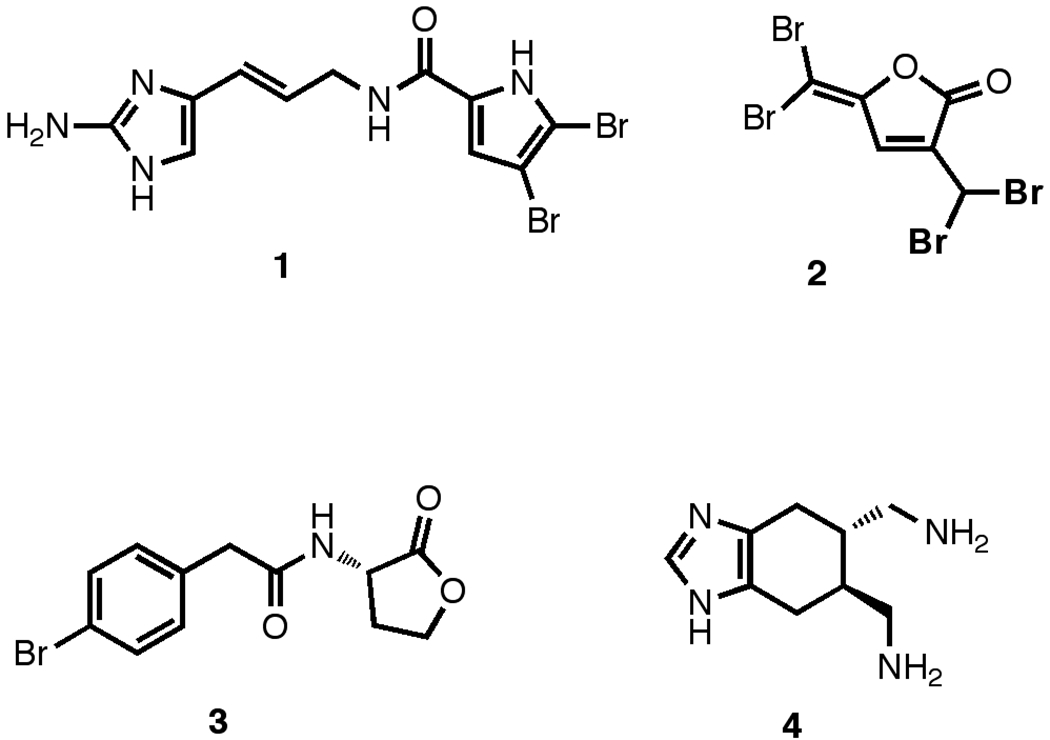
Known Small Molecule Biofilm Inhibitors.
Results and Discussion
In developing a new approach to biofilm quantification, we aimed to create a system that was rapid, accurate, and cost effective, and that could be performed with any standard epifluorescence high content screening microscopy system. Traditionally, vizualiation and analysis of biofilm structures is achieved using CSLM with continuous flow cell systems. Flow cell set-ups provide continuous replenishment of nutrients, with concomitant removal of waste and signaling molecules. Although this method provides detailed information about biofilm architecture via z-stack images, it requires large quantities of test compound for continuous infusion into the flow cell, and 6 – 8 hours of microscope time per sample, making it unsuitable for large sample sets.
Flow cells are most conducive for analysis of the growth and maintenance of biofilms in real time with using confocal microscopy but are less suitable for high-throughput approaches. Some V. cholerae strains, such as those used in the present study, have altered c-di-GMP signaling and form well-developed biofilms under static conditions. The biofilm forming capacities of such V. cholerae strains have been previously shown to display similar characteristics under static versus flow cell conditions.35 In order to screen larger compound libraries (>3000 members), we therefore elected to create a screening platform that could be performed under static culture conditions, and that was compatible with 384-well format microtiter plates, using a GFP-expressing rugose strain of V. cholerae.
Development of HCS Assay Protocol
Our initial studies focused on the examination of the potential for applying non-z-stack epifluorescence imaging to the quantification of biofilm coverage in microtiter plates. In order to explore this possibility, a single 384-well microtiter plate (tissue culture treated, black wall, clear bottom) was prepared, containing Luria Bertani (LB) medium inoculated with eight different strains of V. cholerae, all of which stably express GFP (Figure 2). Plates were incubated at 30°C for 4.5 hours, and imaged as described below.
Figure 2.
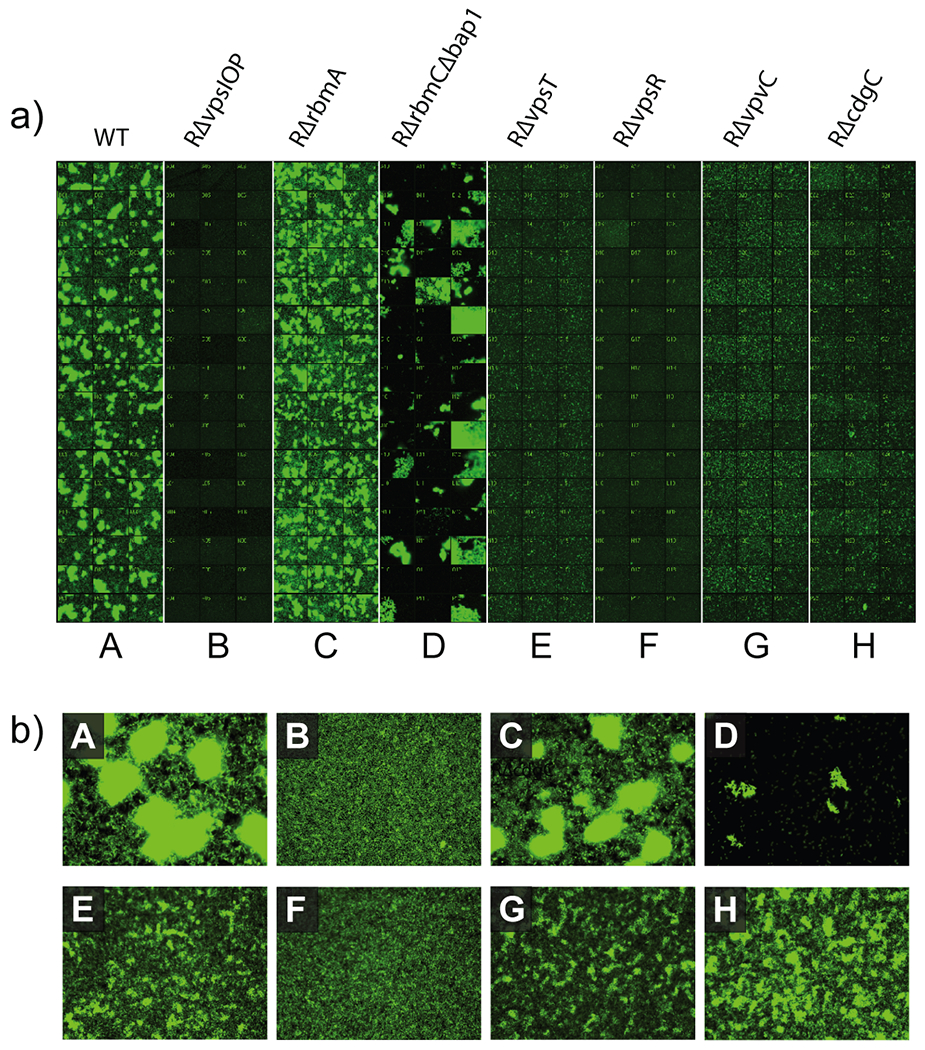
a) 384-well layout of single site images for all eight V. cholerae mutants (20x magnification). b) expanded images for each mutant (40x magnification). Descriptions of V. cholerae mutants are provided in the Supporting Information (Supplementary Table S1).
Strain A is a prototypical V. cholerae strain that forms mature biofilms readily under static growth conditions.36 Strain B is a mutant that cannot produce Vibrio polysaccharide (VPS) required to form mature biofilm structures.36, 37 As evidenced by the presence of biofilm aggregates containing very high densities of V. cholerae cells (bright patches in lane A), we can recapitulate this phenotype in a 384-well format. Strain C, is a mutant unable to produce biofilm matrix protein RbmA.38 This mutant forms shear sensitive biofilms and an altered biofilm phenotype that is mainly observable using flow cell methods. Strain D, is an RbmC, Bap1 double mutant that cannot produce critical matrix proteins predicted to be required for binding cells together or anchoring the biofilm and/or cells to surfaces. Biofilms of this mutant detach readily.39 Strain E and F are mutants unable to produce the regulatory proteins VpsT and VpsR respectively. Strains lacking VpsT have reduced capacity to form mature biofilms, while strains lacking VpsR are completely incapable of forming biofilms.40, 41 Strain G represents a mutant defective in the cyclic-di-GMP signaling pathway that is responsible for enhanced biofilm formation by the rugose strain.37, 42 We were able to recapitulate expected biofilm phenotypes of all these mutants in a 384-well format. We have previously shown, and further confirmed in a 384-well assay format, that growth rate of the strains discussed above are similar.
After incubation for 4.5 hours at 30 °C, eight images (20x magnification) were acquired at fixed positions for every well, providing 20% overall coverage of the total surface area of the well. The prototypical rugose V. cholerae strain formed biofilms in the 384-well assay format that were similar to those formed in chambers under static conditions conducted previously.36 In both chamber and 384-well assay formats, biofilms were composed of aggregate-associated bacteria and individual cells adhered to the substratum between aggregates. In contrast to the rugose wild-type strain, the RΔvpsI operon deletion strain (strain B) was unable to form elaborate three-dimensional mature biofilm structures and instead formed a monolayer of cells on the surface. These results are similar to those observed previously in both static and a flow-cell systems43 and are consistent with the observation that vps genes are required for biofilm formation in V. cholerae under static and flow-cell conditions.36, 43 RΔrbmA in the 384-well assay formed biofilms that were less developed and more dispersed than that of the wild-type rugose strain, similar to previous comparisons of RΔrbmA to rugose wild type in a flow-cell system.38 The RΔrbmCΔbap1 strain showed detached or partially attached aggregates when compared to wild type in a 384-well assay format. These observations are similar to those observed in a flow-cell system where both RbmC and Bap1 are involved in maintaining biofilm architecture.39 RΔvpsT and RΔvpsR strains exhibited dramatically reduced biofilm structure when compared to rugose wild-type. These observations are also similar to results observed previously under flow-cell conditions.40 Biofilms of RΔvpsT consisted of single cells or small microcolonies, while RΔvpsR biofilms consisted of single cells on the substratum. These results are consistent with the idea that both VpsT and VpsR are strong transcriptional activators of vps expression.40, 41, 44 RΔvpvC formed numerous small aggregates on the substratum in contrast to the large three-dimensional structures formed by the rugose wild type.37 Ultimately, RΔvpvC (strain G) was chosen as the positive control because it consistently lacked the capacity to form biofilm columns in the 384-well microtiter plate system.37 It has previously been shown that VpvC is required for increased biofilm formation capacity in the rugose variant of wild type V. cholerae.37 Furthermore, we have shown that VpvC alters biofilm formation through the intracellular signaling system involving cyclic di-GMP. Cyclic di-GMP signaling has been shown to be a global signaling factor controlling the major cellular processes of biofilm formation, motility and virulence in V. cholerae and many other bacteria. Since VpvC is a key factor in inducing biofilm formation and repressing motility, the RΔvpvC mutant mimics disruption of pathways central to biofilm development, and is therefore an optimal control strain for this study.
Image Analysis Algorithm
Each well was quantified by the acquisition of 8 images at 20x magnification, and 8 images at 40x magnification. The combined 20x images encompass ~20% of the total surface area of each well, which is critical for the reproducible and accurate quantification of biofilm coverage. 40x images are valuable for secondary, fine-scale quantification of non-biofilm phenotypes (see below). The 20x images were quantified using MetaXpress image analysis software (Molecular Devices) in a three stage process (Figure 3). Firstly, biofilm columns were identified using a modified version of the existing ‘count nuclei’ script, typically used for identifying nuclei in eukaryotic cell imaging. This script uses a comparison of the intensity of each pixel in the image to identify uniformly bright regions of the image above a user-defined upper threshold (Figure 3b), which are assigned as biofilm columns. The size of these clusters is governed by high- and low-limit areas, based on experimental values, which limit the size of regions that can be defined as biofilm columns. In instances where columns are larger than the upper area limit, contiguous biofilm regions can be observed (Figure 3b). Application of this image analysis strategy afforded a Z’-factor score of 0.58 when comparing wild type (wt) V. cholerae to the RΔvpvC positive control (Figure 5a). The quality of the Z’-factor score is limited by both the heterogeneity of the biofilm columns formed during the incubation, and the definition of biofilm regions by the computational annotation algorithm. Further minaturization of this screen to 1536-well format would require the development of new methods to standardize biofilm growth in well plates, as well as new approaches for the computational annotation of resultant images.
Figure 3.
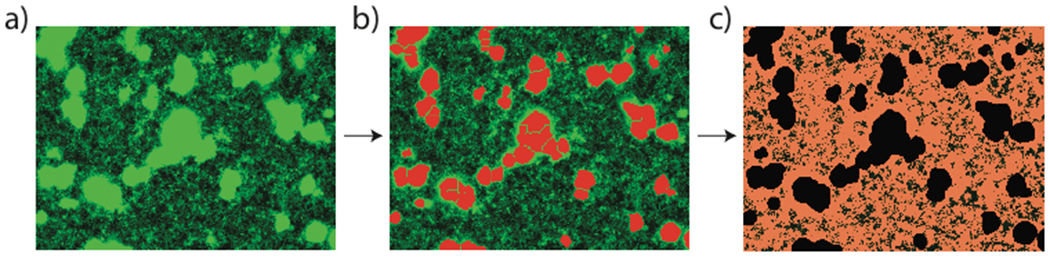
Image quantification strategy. a) raw GFP fluorescence image of wt V. cholerae (20x magnification) b) biofilm quantification using modified ‘count nuclei’ script. Assigned biofilm regions highlighted in red c) quantification of non-biofilm image coverage with biofilm mask applied. Remaining assigned cells highlighted in pink.
Figure 5.
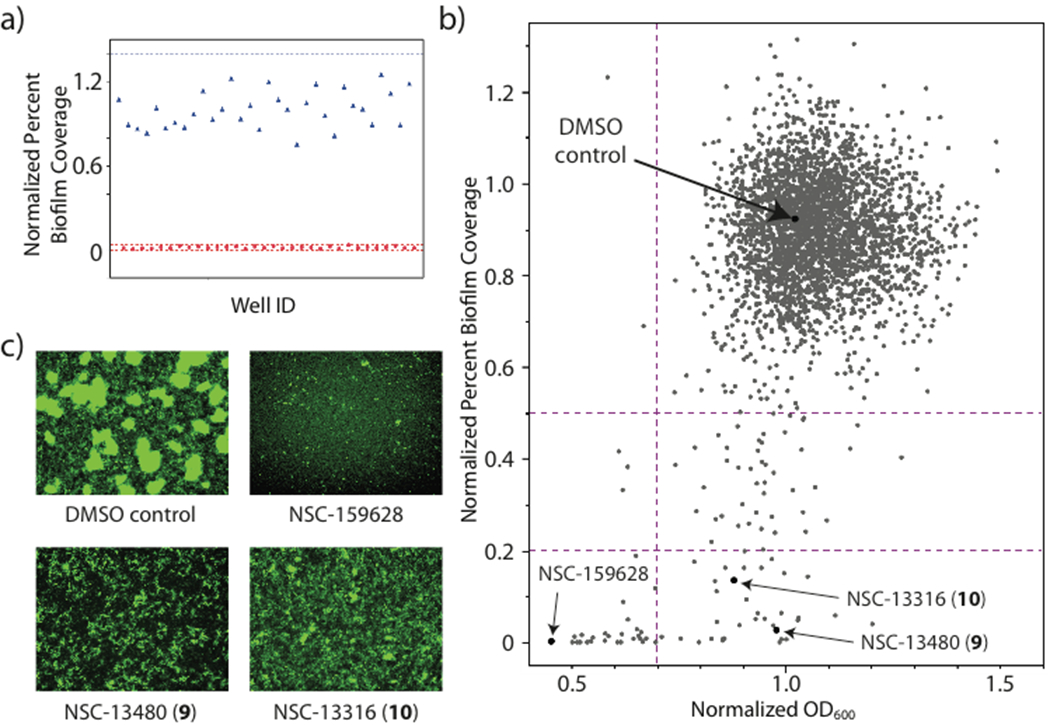
a) Z’-factor measurement for positive and negative controls (RΔvpvC, red circles, and wt V. cholerae with DMSO vehicle, blue triangles) b) plot of normalized OD600 vs normalized percent biofilm coverage for 3080 member NCI screening libraries c) Images of negative DMSO control, example antibiotic (NSC-159628) and biofilm inhibitors (9 + 10).
Non-biofilm phenotypes can also be examined using this platform. To successfully quantify monolayers, biofilm regions are first masked, to remove high intensity unfocused halos that exist at the edges of each region (Figure 3c). This mask is created by radial expansion of the defined biofilm region by a fixed distance (10 pixels). These unfocused regions are an effect of acquiring these images in a single focal plane, and would otherwise skew non-biofilm quantification. Non-biofilm, monolayer coverage is then quantified by counting the number of pixels above an experimentally determined lower threshold, to give a numerical representation of the percentage coverage of cells not associated with biofilm columns. Both upper and lower thresholds are determined by manual evaluation and optimization of each screening plate, based on control wells. Representative phenotypes and masked quantifications of these images are shown in Figure 7, and discussed in more detail below.
Figure 7.
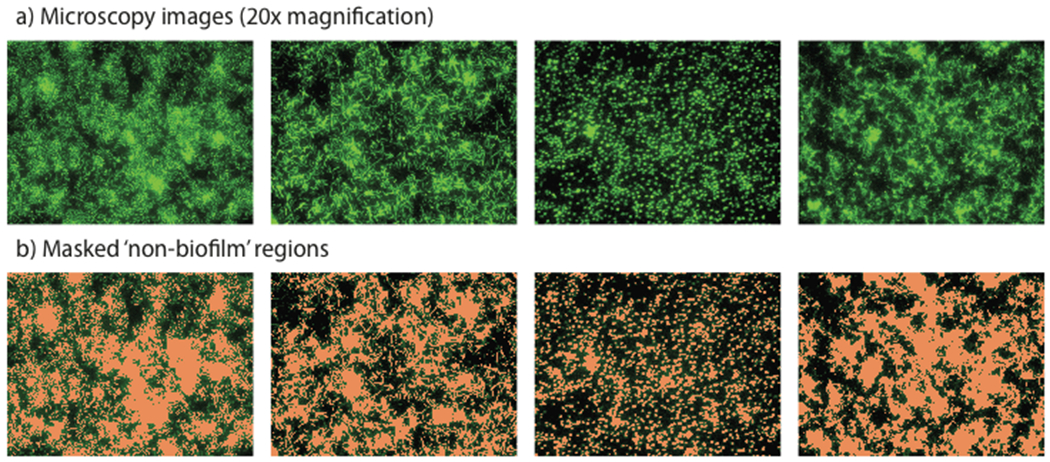
Non-biofilm phenotypes, showing a) raw GFP fluorescence images and b) non-biofilm phenotype analysis by thresholded pixel intensity quantification.
Assay protocol
Compound screening was performed as outlined in Figure 4. In brief, screening plates were plated with liquid culture of V. cholerae (Figure 4a), and DMSO stock solutions of test compounds pinned into each well (Figure 4b). After incubation at 30 °C for 4.5 hours, OD600 values were obtained in triplicate for all wells (Figure 4c). Plates were subsequently washed with PBS, and imaged by epifluorescence microscopy without further fixing or staining (Figure 4d). Finally, images were analyzed using our custom image analysis script (Figure 4e), and analyzed to identify putative inhibitors (Figure 4f), as described below.
Figure 4.
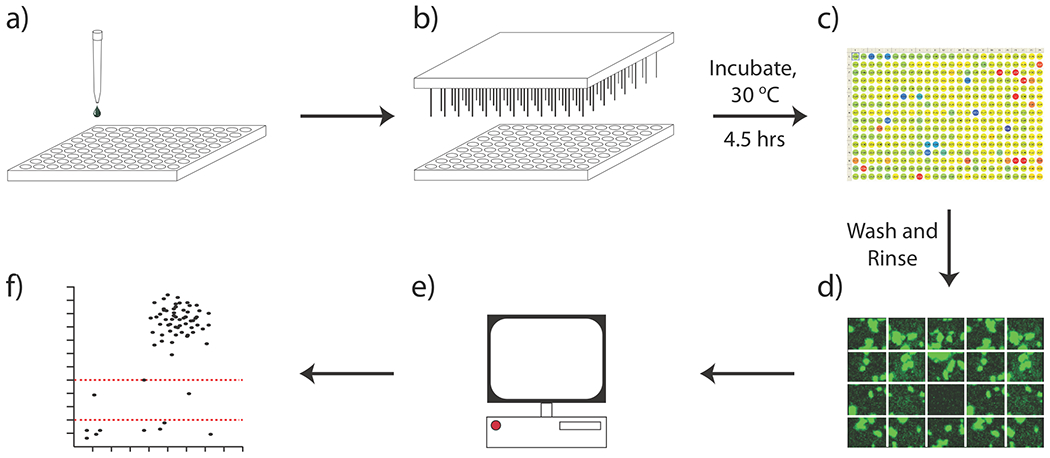
Biofilm screening workflow. a) dispense V. cholerae culture into wellplates b) pin test compounds into screening plates c) post-incubation, measure OD600 values for all wells d) post-rinse, image biofilm coverage using HCS system e) computational analysis of image output f) plot of screening output.
Quantification of percentage biofilm coverage for each well provides a direct measure of biofilm inhibition for test compounds, which has not previously been possible using the CV assay. To identify lead compounds, median values for percentage biofilm coverage for each well were normalized against negative control wells, and plotted against normalized pre-rinse OD600 values (Figure 5b). Biofilm inhibitors were defined as those where biofilm formation was less than 20% of that observed for negative control wells, with OD600 values greater than 0.7. Pre-rinse optical densities are an important consideration when evaluating screening hits, as bacteriocidal compounds that result in total cell clearance from test wells will display low percentage biofilm coverage, which could be falsely interpreted as biofilm inhibitors without consideration of total cell viability.
Biofilm Inhibitors
Figure 5b displays the screening results for the analysis of a 3080-member NCI screening library. From this plot, two key regions were defined: biofilm inhibitor leads (normalized percent biofilm coverage < 0.2, OD600 > 0.7) and bacteriocidal/bacteriostatic antibiotics (normalized percent biofilm coverage < 0.2, OD600 < 0.7). Compounds that lie in the 20 – 50% region typically display reduced biofilm coverage, often in conjunction with unusual non-biofilm phenotypes in the adherent background monolayers (see below).
Screening of the 3080-member NCI library revealed a total of 36 hits, of which 29 are organic small molecules (Supporting Information). A selection of the most promising biofilm inhibitors (5 – 16) is presented in Figure 6, which indicate a high degree of structural variation within this panel of hits. Of these, analogues of the FDA approved antimalarial drug mefloquine (9 + 10) are of particular interest. Mefloquine analogues have previously been reported as antibiotics against Gram positive organisms including Streptococcus pneumoniae and Enterococcus faecium,45 but have not shown efficacy against Gram negative species. Our results are consistent with these previous observations, with both 9 and 10 displaying comparable optical density values to control wells, but total clearance of biofilm coverage (0.5 and 1.8% biofilm coverage for 9 and 10 respectively; untreated wells ≈ 20%). Similarity structure searches revealed 14 members of this structural class within the screening library, of which only three showed biofilm inhibitory activity (Supplementary Figure S10), suggesting a structure-dependence to the observed antibiofilm activities of this compound series. Compounds 5 and 6 are also of interest, as they possess structural similarity to the antileishmanial agent miltefosine, which is currently approved for human clinical use in Germany, India and the Sudan.
Figure 6.
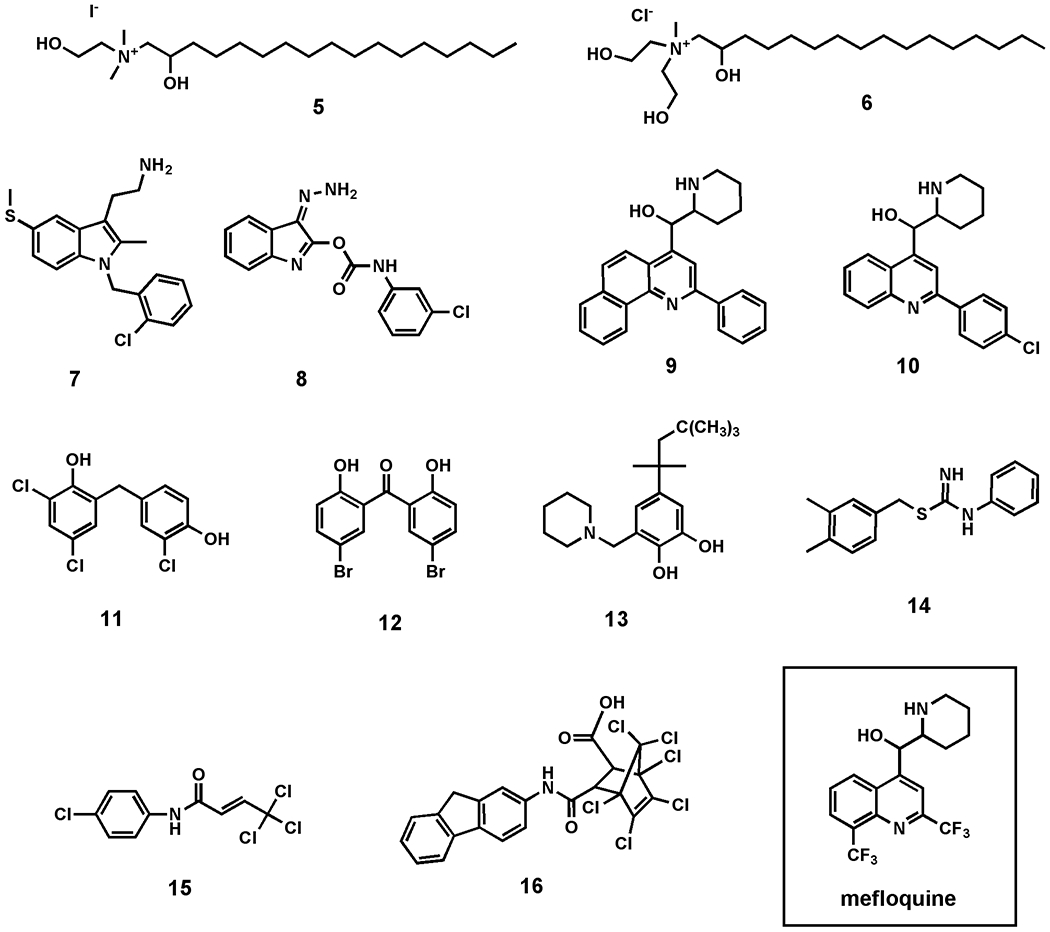
Selected inhibitors of biofilm formation in Vibrio cholerae from NCI mechanistic, structural, natural products, and diversity screening libraries.
Not shown are a number of organometallic species, including tin- and mercury-containing compounds, which, while having limited potential as therapeutics, nevertheless displayed some of the most consistent biofilm inhibition observed using this screening method.
Non-Biofilm Phenotypes
In addition to the identification of biofilm inhibitors, this screening platform can be used to identify small molecules that induce more subtle phenotypic variations (Figure 7). Current in vitro screening platforms against prokaryotic targets rely almost exclusively on ‘death/no death’ outputs to quantify the biological activities of small molecules. While these methods have proven very successful at identifying antibiotic lead compounds, they offer no measure of the biological effect of selective chemical genetic probes if these probes do not result in cell death. The true value of chemical genetic probes is therefore being lost in most screening programs, because many of these phenotypes do not impact cell growth rates, and would be indistinguishable using standard plate reader methods. Figure 7 provides examples of the range of phenotypes that are readily observable using this methodology. These include variations in cell size and shape, microcolony size, surface coverage, and cell aggregation. Development of second-generation methods for the delineation of these more subtle phenotypes based on morphological analysis is currently ongoing in our laboratory.
Methods
Bacterial Strains and Media
Descriptions of the V. cholerae stains used in this study are available in Supplementary Table S1. All strains were developed from the reference strain V. cholerae O1, El Tor A1552, rugose variant (Fy_Vc_2). GFP tagging of V. cholerae strains were performed as described previously.46 Briefly, triparental matings were carried out between V. cholerae strains and two E. coli XX7-1λpir strains carrying pUX-BF13 and pMCM11. Conjugants were selected on TCBS agar with Gm at 50 μg mL−1. The original strain (FY_Vc_2) is the rugose variant, and was selected for this study because it produces robust biofilms, due to the high expression of vps genes.36 V. cholerae cultures were grown in LB media (1% tryptone, 0.5% yeast extract and 1% NaCl, pH 7.5) with aeration at 30 °C or on solid LB plates (1% agar).
High Content Screening
All robotic liquid handling, compound transfer, plate reading, and epifluorescence HCS microscopy imaging was performed at the UCSC Chemical Screening Center, using the NCI compound libraries ‘Structural Diversity Set’, ‘Challenge Set’, ‘Natural Products Set’, and ‘Mechanistic Diversity Set’ (3080 compounds total). Primary screening of all compounds was performed at 20 μM.
Biofilm Inhibition Assay Protocol
Bacterial strains were stored at −80 °C in 25% glycerol. Two days prior to screening, the V. cholerae strain Fy_Vc_240 was streaked onto solid media (LB agar), and incubated at 30 °C. After 24 hrs, five colonies were inoculated into 5 mL LB broth, and incubated at 30 °C for 16 hrs. Finally, the liquid culture was inoculated at a 1:100 dilution into fresh LB broth, and dispensed into 384-well microtiter plates (40 µL, black-walled clear-bottom 384-well microtiter plate (Corning 3712)) using a WellMate peristaltic microplate dispenser (Matrix). Before dispensing, WellMate tubing was sterilized with 70% EtOH, and rinsed with sterile LB medium. Tubing was primed three times with culture to ensure even dispensing within the plate. Agitation of the culture while dispensing is essential to ensure uniform distribution of cells within the plate. Plates were centrifuged for 1 min at 1200 rpm to remove air bubbles and bring the culture down from the walls of the plate, and DMSO stocks of test compounds (200 nL, 10 mM) pinned into the screening plates (Janus MDT, PerkinElmer) to give a final concentration of 20 μM. Pinned cultures were then incubated for 4.5 hours at 30 °C. Following incubation, OD600 readings were collected in triplicate, to evaluate cell viability (EnVision plate reader, PerkinElmer). Plates were agitated vigorously and washed three times with 1% phosphate buffered saline (PBS) (ELx405 microplate washer, BioTek); this removes planktonic V. cholerae and loosely associated biofilms, while retaining stable, well attached cells and biofilms on the plate surface. Plates were imaged in PBS by epifluorescence microscopy, (ImageXpress, Molecular Devices) at both 20x and 40x magnification. Eight sites (distributed throughout the well) were imaged for each well in the 384-well microtiter plate. MetaXpress software (Molecular Devices) was used to create an automated pipeline for measuring intensity and surface area coverage of GFP signals within each image. Data collected for each site were averaged for each well, and normalized based on negative control wells.
Conclusions
We have developed the first example of an epifluorescence-based high-throughput imaging system for the direct quantification of biofilm inhibition in V. cholerae. This new method can be performed in 384-well format, using standard automated high content epifluorescence microscopy systems, and provides a rapid and flexible method for the screening of large compound libraries. Image analysis affords not only a direct quantification of biofilm coverage for each screening well, but also reveals more subtle phenotypes, which provide future opportunity for the development of chemical genetic tools for studying biofilm formation and development.
Screening of a 3080-member library of small molecules from the NCI collection has lead to the identification of several new classes of biofilm inhibitors, of which the quinoline-containing class of mefloquine analogues are of particular interest. This is the first reported example of quinoline-based biofilm inhibitors, and offers the opportunity for the development of new classes of inhibitors based on this scaffold. It is anticipated that application of this method will prove valuable in evaluating screening libraries, such as microbial natural products extracts, for the discovery of additional classes of biofilm inhibitors. In addition, variation in the timing of compound addition offers the opportunity to adapt this screening approach to the study of biofilm dispersal/detachment, which is another keen area of interest in the field of biocontrol of biofilm colonization. This method therefore provides both a new avenue for the discovery of small molecule tools for controlling biofilm formation, and future opportunity for the study of detachment phenotypes.
Supplementary Material
Acknowledgements
We thank P. Gedraitis (Molecular Devices) for technical assistance with journal scripting, and D. Winslow and M. Jacox for assistance with statistical analysis. Financial support was provided by UCSC Committee on Research Special Research Grant (RGL and FY), NIH grant AI-055987 (FY) the Civilian Research and Development Foundation Grant Assistance program (GTR-G7-044, RGL and RSL), and instrumentation support from NIH grant 1-S10-RR022455-01A1 (RSL).
Footnotes
Electronic Supplementary Information (ESI) available: [table of V. cholerae mutants, tables, plots, and structures for screening libraries. Structures and screening results for mefloquine lead series].
Notes and References
- 1.Fux CA, Costerton JW, Stewart PS and Stoodley P, Trends Microbiol, 2005, 13, 34–40. [DOI] [PubMed] [Google Scholar]
- 2.Adal KA and Farr BM, Nutrition, 1996, 12, 208–213. [DOI] [PubMed] [Google Scholar]
- 3.Costerton JW, Stewart PS and Greenberg EP, Science, 1999, 284, 1318–1322. [DOI] [PubMed] [Google Scholar]
- 4.Musk DJ and Hergenrother PJ, Curr. Med. Chem, 2006, 13, 2163–2177. [DOI] [PubMed] [Google Scholar]
- 5.Henrici AT, Bacteriol J, 1933, 25, 277–287. [DOI] [PMC free article] [PubMed] [Google Scholar]
- 6.Lawrence JR, Korber DR, Hoyle BD, Costerton JW and Caldwell DE, J. Bacteriol, 1991, 173, 6558–6567. [DOI] [PMC free article] [PubMed] [Google Scholar]
- 7.Luppens SBI, Reij MW, van der Heijden RWL, Rombouts FM and Abee T, Appl. Environ. Microbiol, 2002, 68, 4194–4200. [DOI] [PMC free article] [PubMed] [Google Scholar]
- 8.Rasmussen TB and Givskov M, Int. J. Med. Microbiol, 2006, 296, 149–161. [DOI] [PubMed] [Google Scholar]
- 9.Kumon H, Tomochika K, Matunaga T, Ogawa M and Ohmori H, Microbiol. Immunol, 1994, 38, 615–619. [DOI] [PubMed] [Google Scholar]
- 10.Spoering AL and Lewis K, J. Bacteriol, 2001, 183, 6746–6751. [DOI] [PMC free article] [PubMed] [Google Scholar]
- 11.Anderl JN, Franklin MJ and Stewart PS, Antimicrob. Agents Chemother, 2000, 44, 1818–1824. [DOI] [PMC free article] [PubMed] [Google Scholar]
- 12.Debeer D, Stoodley P, Roe F and Lewandowski Z, Biotechnol. Bioeng, 1994, 43, 1131–1138. [DOI] [PubMed] [Google Scholar]
- 13.Hoiby N, Bjarnsholt T, Givskov M, Molin S and Ciofu O, Int. J. Antimicrob. Agents, 2010, 35, 322–332. [DOI] [PubMed] [Google Scholar]
- 14.Landini P, Antoniani D, Burgess JG and Nijland R, Appl. Microbiol. Biotechnol, 2010, 86, 813–823. [DOI] [PubMed] [Google Scholar]
- 15.Davies D, Nat. Rev. Drug Discovery, 2003, 2, 114–122. [DOI] [PubMed] [Google Scholar]
- 16.Peng FB, Hoek EMV and Damoiseaux R, J. Biomol. Screen, 2010, 15, 748–754. [DOI] [PubMed] [Google Scholar]
- 17.Musken M, Di Fiore S, Dotsch A, Fischer R and Haeussler S, Microbiol.-Sgm, 2010, 156, 431–441. [DOI] [PubMed] [Google Scholar]
- 18.O’Toole GA and Kolter R, Mol. Microbiol, 1998, 28, 449–461. [DOI] [PubMed] [Google Scholar]
- 19.Junker LM and Clardy J, Antimicrob. Agents Chemother, 2007, 51, 3582–3590. [DOI] [PMC free article] [PubMed] [Google Scholar]
- 20.Christophe T, Jackson M, Jeon HK, Fenistein D, Contreras-Dominguez M, Kim J, Genovesio A, Carralot JP, Ewann F, Kim EH, Lee SY, Kang S, Seo MJ, Park EJ, Skovierova H, Pham H, Riccardi G, Nam JY, Marsollier L, Kempf M, Joly-Guillou ML, Oh T, Shin WK, No Z, Nehrbass U, Brosch R, Cole ST and Brodin P, PLoS Path, 2009, 5, e1000645. [DOI] [PMC free article] [PubMed] [Google Scholar]
- 21.Gross CA, Reddy CK and Dazzo FB, Microb. Ecol, 2010, 59, 400–414. [DOI] [PubMed] [Google Scholar]
- 22.Forero MG, Sroubek F and Cristobal G, Real-Time Imaging, 2004, 10, 251–262. [Google Scholar]
- 23.Yamada A, Kitamura H, Yamaguchi K, Fukuzawa S, Kamijima C, Yazawa K, Kuramoto M, Wang GYS, Fujitani Y and Uemura D, Bull. Chem. Soc. Jpn, 1997, 70, 3061–3069. [Google Scholar]
- 24.Han Y, Hou S, Simon KA, Ren D and Luk YY, Bioorg. Med. Chem. Lett, 2008, 18, 1006–1010. [DOI] [PubMed] [Google Scholar]
- 25.Hu JF, Garo E, Goering MG, Pasmore M, Yoo HD, Esser T, Sestrich J, Cremin PA, Hough GW, Perrone P, Lee YSL, Le NT, O’Neil-Johnson M, Costerton JW and Eldridge GR, J. Nat. Prod, 2006, 69, 118–120. [DOI] [PubMed] [Google Scholar]
- 26.Geske GD, Wezeman RJ, Siegel AP and Blackwell HE, J. Am. Chem. Soc, 2005, 127, 12762–12763. [DOI] [PubMed] [Google Scholar]
- 27.Huigens RW, Ma LY, Gambino C, Moeller PDR, Basso A, Cavanagh J, Wozniak DJ and Melander C, Mol. Biosyst, 2008, 4, 614–621. [DOI] [PubMed] [Google Scholar]
- 28.Huigens RW, Richards JJ, Parise G, Ballard TE, Zeng W, Deora R and Melander C, J. Am. Chem. Soc, 2007, 129, 6966–6967. [DOI] [PubMed] [Google Scholar]
- 29.Ballard TE, Richards JJ, Aquino A, Reed CS and Melander C, J. Org. Chem, 2009, 74, 1755–1758. [DOI] [PubMed] [Google Scholar]
- 30.Ballard TE, Richards JJ, Wolfe AL and Melander C, Chem. Eur. J, 2008, 14, 10745–10761. [DOI] [PubMed] [Google Scholar]
- 31.Richards JJ, Ballard TE and Melander C, Org. Biomol. Chem, 2008, 6, 1356–1363. [DOI] [PubMed] [Google Scholar]
- 32.Richards JJ, Ballard TE, Huigens RW and Melander C, ChemBioChem, 2008, 9, 1267–1279. [DOI] [PubMed] [Google Scholar]
- 33.Richards JJ, Reed CS and Melander C, Bioorg. Med. Chem. Lett, 2008, 18, 4325–4327. [DOI] [PubMed] [Google Scholar]
- 34.Rogers SA and Melander C, Angew. Chem. Int. Ed, 2008, 47, 5229–5231. [DOI] [PubMed] [Google Scholar]
- 35.Yildiz FH, Liu XS, Heydorn A and Schoolnik GK, Mol. Microbiol, 2004, 53, 497–515. [DOI] [PubMed] [Google Scholar]
- 36.Yildiz FH and Schoolnik GK, PNAS, 1999, 96, 4028–4033. [DOI] [PMC free article] [PubMed] [Google Scholar]
- 37.Beyhan S and Yildiz FH, Mol. Microbiol, 2007, 63, 995–1007. [DOI] [PubMed] [Google Scholar]
- 38.Fong JCN, Karplus K, Schoolnik GK and Yildiz FH, J. Bacteriol, 2006, 188, 1049–1059. [DOI] [PMC free article] [PubMed] [Google Scholar]
- 39.Fong JCN and Yildiz FH, J. Bacteriol, 2007, 189, 2319–2330. [DOI] [PMC free article] [PubMed] [Google Scholar]
- 40.Beyhan S, Bilecen K, Salama SR, Casper-Lindley C and Yildiz FH, J. Bacteriol, 2007, 189, 388–402. [DOI] [PMC free article] [PubMed] [Google Scholar]
- 41.Casper-Lindley C and Yildiz FH, J. Bacteriol, 2004, 186, 1574–1578. [DOI] [PMC free article] [PubMed] [Google Scholar]
- 42.Beyhan S, Odell LS and Yildiz FH, J. Bacteriol, 2008, 190, 7392–7405. [DOI] [PMC free article] [PubMed] [Google Scholar]
- 43.Fong JCN, Syed KA, Klose KE and Yildiz FH, Microbiol.-Sgm, 2010, 156, 2757–2769. [DOI] [PMC free article] [PubMed] [Google Scholar]
- 44.Yildiz FH, Dolganov NA and Schoolnik GK, J. Bacteriol, 2001, 183, 1716–1726. [DOI] [PMC free article] [PubMed] [Google Scholar]
- 45.Kunin CM and Ellis WY, Antimicrob. Agents Chemother, 2000, 44, 848–852. [DOI] [PMC free article] [PubMed] [Google Scholar]
- 46.Lim B, Beyhan S, Meir J and Yildiz FH, Mol. Microbiol, 2006, 60, 331–348. [DOI] [PubMed] [Google Scholar]
Associated Data
This section collects any data citations, data availability statements, or supplementary materials included in this article.