

Summary:
Diagnostic and therapeutic electrical stimulation are increasingly utilized with the rise of neuromodulation devices. However, systematic investigations that depict the practical clinical stimulation paradigms (bipolar, 2-electrode configuration) to determine the safety limits are currently lacking. Further, safe charge densities that were classically determined from conical sharp electrodes are generalized for cylindrical (depth) and flat (surface grid) electrodes completely ignoring geometric factors that govern current spreading and trajectories in tissue. This work reports the first investigations comparing stimulation limits for clinically used electrodes in two mediums: in benchtop experiments in saline and in vivo in a single acute experiment in the pig brain. We experimentally determine the geometric factors, the water electrolysis windows, and the current safety limits from voltage transients, for the sEEG, depth and surface strip electrodes in both mediums. Using 4-electrode and 3-electrode configuration measurements and comprehensive circuit models that accurately depict our measurements, we delineate the various elements of the stimulation medium, including the tissue-electrode interface impedance spectra, the medium impedance and the bias-dependent change in the interface impedance as a function of stimulation parameters. Significantly, our results suggest that safe currents determined in vivo can be as much as 24 times smaller than those determined from benchtop experiments (for depth electrodes at a 1ms pulse duration). Our detailed circuit modeling attributes this drastic difference in safe limits to the greatly dissimilar electrode/tissue and electrode/saline impedances. Consequently, we argue that electrochemical limits and currents are unique for each electrode, should be measured in vivo according to the protocols established in this work, and should be accounted for while setting the stimulation parameters for clinical applications including for chronic applications.
Introduction:
Pulsed electrical stimulation is the gold standard for perturbing neuronal activity in intact brain tissue for diagnostic and therapeutic applications. Electrical stimulation is used in functional and pathological mapping during neurosurgical resection and in neuromonitoring (Viventi et al., 2011; Branco et al., 2003; Fonoff et al., 2009). Deep brain stimulation is widely used to treat many neurological and neuropsychiatric disorders such as Parkinson’s disease, tremor (Kuncel and Grill, 2004; Lozano et al., 2002), obsessive-compulsive disorder and depression (Mallet et al., 2008; Jiménez et al., 2013). Electrical stimulation is also used in epilepsy treatment, by directly administering electrical pulses in the epileptogenic zone to reduce or eliminate seizures (Ojemann et al., 2008; Boon et al., 2009).
Despite their widespread use and clinical effectiveness, systematic studies to understand the electrochemical properties of clinical electrodes and their safety limits are uncommon. Primarily, the Shannon’s equation, which relates the charge injected per phase during stimulation to the injected charge density, has been widely used for determining tissue damage thresholds for clinical practice (Shannon, 1992). A 2016 study by Cogan et al. investigated the adequacy of Shannon’s equation in determining the safety thresholds for stimulation in micro and macroelectrodes (Cogan et al., 2016). The study concluded that while Shannon’s equation might serve as a useful reference, it has limitations since it restricts itself to empirically derived relations between charge density and charge per phase. Thus, there is a need to explore the role of other parameters such as electrode geometry, pulse width and stimulation setup. The effect of stimulation frequency in establishing tissue damage thresholds was investigated by McCreery et al. (McCreery et al., 1995; McCreery et al., 1997) and Butterwick et al. (Butterwick et al., 2007). Their results suggest that increasing the stimulation frequency lowers the threshold for damage. Another common stimulation threshold for tissue damage is a charge density of 30 μC/cm2, which arises from studies performed by McCreery et. al (McCreery et al., 1990) and has subsequently been used for macroelectrodes of areas typically around 0.06 cm2. However, in these studies, the voltage drops across the tissue and the electrode-tissue interface were not delineated to accurately assess these safety limits and to explain the differences between limits obtained by electrochemical assessment in benchtop testing and in vivo (Cogan, 2006; Han et al., 2012).
Traditionally, Electrochemical Impedance Spectroscopy (EIS) is used in the 3-electrode configuration to quantify the electrode-medium interface (Merrill, Bikson and Jefferys, 2005). However, most clinical stimulation paradigms utilize a 2-electrode setup with a common counter and reference electrode. This makes it vital to delineate the impedance of each element of the stimulation setup, medium, and interfaces to understand their impact on the safety limits. Tissue damage thresholds and benchtop experiments use a 3-electrode configuration in determining the limits for safe charge densities and current amplitudes, whereas clinical stimulation protocols are usually bipolar in nature (Cogan et al., 2006; Meyer et al., 2001) and use a 2-electrode configuration. The presence of a third reference electrode eliminates the effect of the impedance at the tissue-electrode interface for the counter electrode. As a result, the measured overpotentials in bipolar stimulation will, in the in vivo context, consist of potential drops at both the working and counter electrode, measured with respect to a global ground which serves as the reference. To understand this effect and accurately assess the voltage drop across the electrode-tissue interface that is directly relevant to the safety of stimulation, we first need to delineate the individual impedance components of the stimulation circuit, which is possible with impedance spectroscopy using 2-, 3- and 4-electrode configurations. Such impedance spectroscopy studies should be performed not only in their typical benchtop setting, but also in vivo to develop accurate and validated circuit models (Grill and Mortimer, 1995).
In vivo, tissue damage due to stimulation can occur due to a variety of mechanisms including the electrochemical generation of reaction products, metabolic overstimulation and mechanical implantation damage (Straka et al., 2018; Hänzi et al., 2010; Seaton et al., 2020; Ojemann et al., 2008; Somann et al., 2018). Further, the electrochemical impedance spectra of an electrode is known to show significant variations in-vivo, in both acute and chronic settings, and in benchtop (Wei and Grill, 2009; Musa et al., 2009; Cogan, 2006; Alba et al., 2015; Bai and Prinz, 2011; John et al., 2019; Chen et al., 2016; Janegitz et al., 2017). This manuscript provides a comprehensive assessment of the electrochemical factors involved in brain tissue stimulation, presents detailed circuit models for the tissue and tissue-electrode impedances, and evaluates the potential drops across each of these elements. We compare the electrochemical limits established by the water electrolysis window to the tissue damage limit developed empirically by Shannon (Bullara et al., 1988).
The water electrolysis window outlines the limits at which tissue damage may occur during stimulation due to the formation of irreversible reaction products at the electrode/tissue interface. Typically, charge injection at the electrode/tissue interface occurs through both capacitive and faradaic processes. Faradaic processes lead to the formation of both reversible and irreversible reaction products. The reversible reaction products are formed in reactions with fast kinetics that allow large currents to flow at small excursions from the equilibrium potential and can be reabsorbed onto the electrode by reversing the direction of the current flow. In contrast, irreversible reaction products arise due to faradaic processes with slow kinetics which cannot be reversed by reversing the direction of current flow. These irreversible reaction products include the hydrogenation of water at negative cathodal voltages and the oxygenation of water at positive anodal voltages and are therefore associated with the water electrolysis window (Brummer, McHardy and Turner, 1977). These changes in the neighboring chemical environment can potentially create harmful chemical species that can be damaging to the tissue or the electrode (Eles et al., 2018; Robblee et al., 1983; Turner and Brummer, 1977; Hudak, Mortimer and Martin, 2010; Sahyouni et al., 2017; Clavilier et al., 1990). The electrochemical safety limit is based on charge density that leads to a potential build-up at the electrode-tissue interface, which can cause the injection of oxygen radicals (in the anodal limit) or the alteration of the pH of the tissue (in the cathodal limit), causing a permanent change at the electrode surface and potential tissue damage. The charge density at this limit is referred to as the charge injection capacity (CIC). We provide a concrete explanation for the discrepancy between CIC values in benchtop and in-vivo setting and provide numerical bounds for the electrochemical safety limits – based on the water electrolysis window – for clinical stimulation in strip and depth electrodes. We benchmark our electrochemical safety limits and the clinically utilized stimulation currents to the Shannon limit and provide guidelines for establishing safe medical stimulation paradigms.
Experimental Setup:
We used a Gamry Interface 1000E system to carry out both the benchtop and the in-vivo experiments reported here. We used three standard clinical electrodes commonly used for stimulation, two for depth studies and one for surface cortical studies. We used the PMT sEEG Depthalon electrode, which has a 2 mm contact length, 0.8 mm outer diameter and 3.5 mm contact spacing, and the AdTech Medical Spencer Depth Probe Electrode, which has a 2.41mm contact length with 1.12 mm diameter and 5 mm contact spacing, for depth studies. For the surface cortical studies, the AdTech Medical Subdural Electrode, which has a 2.3 mm diameter and 10 mm inter-contact spacing, was used. All 3 electrodes have Platinum contacts. The benchtop testing is done using a Sigma-Aldrich Phosphate Buffered Solution (PBS) consisting of 0.022M Na2HPO4 (pH=7.2±0.2).
Fig.1 (d)–(f) show the implanted electrode in the cortex of a 6-month-old female pig. The acute recordings were performed over a duration of 2 hours per electrode, amounting to 6 hours for the entire study. The protocol for the animal studies was approved by the UC San Diego Institutional Animal Care and Use Committee (IACUC) protocol # S19030. Briefly, a juvenile Yucatan pig was premedicated with intramuscular Ketamine (25mg/Kg), Xylazine (2.0 mg/kg), and Atropine (0.05 mg/Kg) by a trained veterinarian. After induction, the animal was intubated and maintained using oxygen and a mechanical ventilator at a rate of 8–14 breaths per minute. Vitals were recorded every 15 minutes and a heating blanket was used to maintain body temperature. The animal was given maintenance fluids at a rate of 5–10 cc/kg/hr. Anesthesia was maintained using an infusion of propofol (6–9 mg/kh/hr), with the rate based on cardiopulmonary state of the animal. Once sedated, the animal’s head was mounted into an aluminum head holder, and, using sterile technique, experienced neurosurgeons opened a cranial window of approximately 2 cm × 4 cm over the proposed site of the sensorimotor cortex. Depth and surface electrodes were subsequently implanted for the experimental procedures. Depth electrodes were advanced through the brain parenchyma until the appropriate number of contacts were covered. Surface electrodes were placed on top of the brain and covered gently with a saline-soaked cotton sponge. Acute in vivo experiments were performed over a duration of 2 hours per electrode, amounting to 6 hours for the entire study. After all experiments were concluded, the animal was deeply anesthetized with Ketamine and Xylazine, and a fatal dose of pentobarbital was then administered by IV infusion.
Figure 1:

Experimental configurations for the electrochemical assessment and the subdural electrode placement in the pig’s brain. W-Working electrode, WS- Working Sense electrode, R- Reference electrode, C- Counter electrode. (a) 2-electrode impedance breakout (b) 3-electrode impedance breakout (c) 4-electrode impedance breakout (d) sEEG electrode placement (e) Depth electrode insertion and placement (f) Strip electrode insertion and placement. Grayed box and text indicate negligible contribution.
Fig. 1 (a)–(c) show the circuit impedance breakouts for three electrode contact setups used for conducting the experiments. The system is connected to the earth ground, and all measurements are referenced to this constant earth ground, allowing us to establish a consistent reference between experiments. Fig. 1(a) shows the impedance as seen by the system for a 2-electrode setup. This setup uses two contacts on the electrodes- the first contact serves as the working electrode. The second electrode contact serves as both the counter electrode for the return current path, and as the voltage sensing electrode for electrical potential measurements. This setup represents the conditions seen commonly in bipolar stimulation. The absence of a dedicated reference electrode means that the electrode-tissue interface now plays a role at both the working and the counter electrodes. Fig. 1(b) shows the impedance as seen by the system in a 3-electrode setup with a working, counter and reference electrodes. In this configuration, the measured impedance, (VWS − VR)/Iinj, will be comprised of the tissue-electrode interface impedance at the working electrode and of the medium impedance. In this case, the reference contact will not observe a voltage drop across the electrode-tissue interface, (VR = 0), since no current flows through the reference contact. Fig. 1(c) shows the setup for a 4-point tissue resistivity measurement setup (Robillard and Poussart, 1977). This configuration uses 4 electrodes to completely isolate the medium resistance, by injecting current through the two outermost contacts and measuring the potential across the two inner electrodes.
Using these three setups, we can perform Electrochemical Impedance Spectroscopy to analyze the electrode-tissue interface and obtain the parameters for the circuit model we use to simulate the electrode performance (Chang and Park, 2010). All measurements are further referenced against the open circuit potential (Eoc) of the system. The open circuit potential establishes the equilibrium potential of the setup which is considered as the starting point for each measurement, allowing us to compare the overpotentials from multiple measurements. Our measurements are subsequently referenced to this value. Cyclic Voltammetry (CV) measurements are carried out to investigate the electrochemical reactions occurring at the electrode and the electrochemical current surges associated with these electrochemical reactions. This helps establish the water window for the safe limits of electrode stimulation (Kissinger and Heineman, 1983). Next, we measure the voltage transients for the electrodes to study the potential build-up at the electrode interface and establish the safety limits for current stimulation.
Results:
The electrochemical impedance spectra for the in vivo and benchtop tests are plotted in Fig. 2. The plots indicate that the impedances of each of the three types of electrodes are consistently lower in saline as compared to that in the brain tissue, particularly at the higher frequencies of interest (1kHz-10kHz) (Lempka et al., 2009). These differences in the impedance spectra are associated with the observed differences in the charge injection capacity between the in-vivo and benchtop tests as will be further elaborated with electrode circuit models.
Figure 2:

Electrochemical impedance spectroscopy composed to impedance magnitude (top panel) and phase (bottom panel) in the pig (a,c,e) and saline (b,d,f) for the sEEG electrode (a,b), for the depth electrode (c,d) and the strip electrode (e,f).
We used the 4-electrode configuration to extract the tissue and saline medium resistivity (Fig.1(c)). This setup is equivalent to the 4-point measurement setup for resistivity commonly used for semiconductor material resistivity measurements (Fuller and Ditzenberger, 1956). This technique has also been previously used to determine the dielectric properties of tissue (Steendijk et al., 1993; Chong and Tan, 2008; Tsai et al., 2000). This helps us isolate the potential build-up across the tissue from that at the electrode interface (Fig.4(c)). To extract the specific tissue and saline resistivity values from the 4-electrode measurement data, we need to calibrate the measurement for specific geometries of each electrode type. Therefore, we calculated the geometric correction factor by plotting the measured resistance – using 4-point probe measurements – for solutions of known resistivity. This geometric factor, G, accounts for non-uniform current spreading in between the contacts in the medium and is a function of the intercontact spacing (Rymaszewski, 1969; Zimney et al., 2007) and can be expressed as, ρ = (4πR)/G. Here ρ is the resistivity of the solution under test, and R is the measured impedance of the solution. The term G/4π. is calculated from the inverse of the slope of the ρ-R curve as shown in Fig. 3(a) for the three different electrodes. In Fig. 3(a), we used NaCl solutions of different concentrations in the range of (0.1–2% weight/volume) and known resistivities. The geometric correction factors for the sEEG, depth, and strip electrodes in our measurements were, 0.474cm−1, 0.316cm−1 and 0.43cm−1, respectively.
Figure 4:

Approximate circuit model for the (a) 2-electrode (b) 3-electrode (c) 4-electrode measurement configurations used for simulations in Cadence Spectre. The inset for the Constant Phase Element is an approximate circuit model used for simulations. An RC ladder with 10 RC branches was used in our circuit model. The measured and simulated voltage transients in the pig cortical tissue (d–f) and saline (g–i) for (d,g) sEEG, (e,h) depth, and (f,i) strip electrodes are plotted for the verification of our model.
Figure 3:
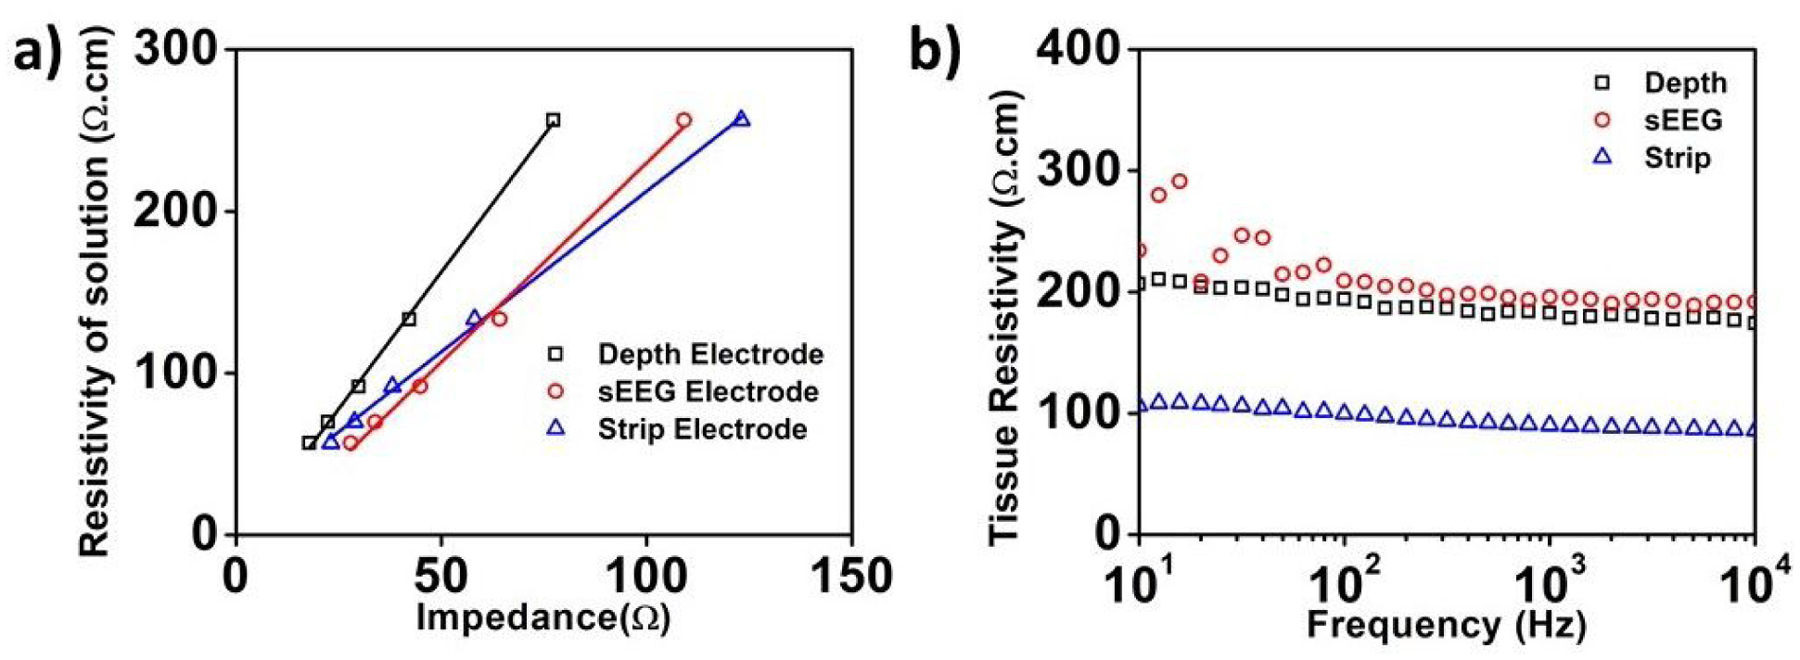
(a) Extraction of the electrode geometric correction factor for the three types of electrodes used in this study. (b) Extracted tissue resistivity for the pig’s brain as a function of frequency using the 4-point probe measurements for the three different electrodes.
Fig. 3(b) presents the extracted cortical tissue resistivity values as a function of frequency from the 4-point probe measurements. The values of tissue resistivity calculated agree well with previously reported values from literature (Latikka et al., 2001; Kay and Schwan, 1956). The tissue resistivity observed by the strip electrode is significantly lower. This is consistent with previously reported data for lower resistivity in gray matter than in the white matter (Geddes and Baker, 1967; Stoy, Foster and Schwan, 1982; Stoy, Foster and Schwan, 1982; Gabriel, Lau and Gabriel, 1996; Bao, Lu and Hurt, 1997; Pethig, 1987). This indicates that the insertion style-electrodes- sEEG and depth, are in contact with the white matter in the brain, and the strip subdural electrode is in contact with the gray matter, though measurements of electrode penetration depth were not performed in these experiments. However, we cannot fully exclude the possibility of surface shunting through the CSF layer for the strip electrode placement. Nevertheless, since the placement is identical to the intended clinical use of the strip electrodes, we believe that the forthcoming results are valid.
With the tissue impedance isolated, we proceeded to evaluate the electrode-tissue interface impedance and voltage transients by the electrochemical impedance spectroscopy and cyclic voltammetry. Figure 4 illustrates the circuit diagrams for the different measurement configurations used in this work. The 2-electrode configuration in Fig. 4(a) shall be used for the voltage-transient measurements and includes the electrode-tissue interface impedances at the two contacts in addition to the tissue impedance in between. The circuit model used in Fig. 4(a–b) is a close approximation for conventional electrode-tissue models (Shoar Abouzari et al., 2009). The reactive impedance at the electrode-tissue (or saline) interface is modeled with a Randles type equivalent cell circuit model (Randles, 1947). The reactive impedance at the interface has two branches. One branch represents the double layer capacitance, which is modeled using a Constant Phase Element (CPE). The second parallel branch includes a resistance RP, which models the direct charge (electron) transfer, and another CPE to model the diffusion of byproducts near the interface (Franks et al., 2005) manifested at low frequencies and typically modeled in saline by a Warburg type impedance. However, in tissue, a more accurate technique to depict this low frequency diffusion is a CPE-restricted linear diffusion model (Bisquert et al., 1998). The non-linear behavior of the CPE is portrayed with an equivalent model composed of an RC ladder (Shoar Abouzari et al., 2009; Valsa and Vlach, 2013; Cheng et al., 1979; Wang, 1987). The tissue impedance and the current flow in the bulk tissue can be either intracellular or extracellular. The extracellular current flow path is primarily resistive, whereas the intracellular path is a combination of resistive and capacitive elements (Huang, Huang and Cheng, 2013). Fig. 4(a) and Fig. 4(b) show the circuit models for the 2-electrode and 3-electrode measurements. The 2-electrode measurement setup is used to measure the voltage transients. The value of the tissue impedance is calculated from the 4-electrode impedance measurements. We then subtract this impedance from the overall measured impedance in the 3-electrode configuration to isolate the electrode-tissue interface impedance using the circuit model of Fig. 4(b). Similarly, by subtracting the measured 4-electrode tissue impedance from the measured 2-electrode impedance according to Fig. 4(a), we obtain the combined impedances of the two electrode-tissue interfaces.
Using the impedance values measured both in vivo and in benchtop experiments, we construct the circuit model for numerical simulations. These values are reported in Table S1. To verify our circuit model, we ran the simulations for voltage transients using Cadence Spectre, a SPICE-based circuit simulator. The simulation results are overlaid with good agreement over the measured voltage transients in Fig. 4(d–i), demonstrating the accuracy of our models.
Next, we focus on determining the safety limits from voltage transients using different stimulation parameters. To determine the water window, we quantified the voltages at which Hydrogen (cathodal) and Oxygen (anodal) evolution occur evidenced by a current surge in the CV measurements and accompanied by gas bubbling in the saline solution. Figure S1 and S2 show the cyclic voltammetry plots for the 2- and 3-electrode configurations. The water window limit for the 2-electrode and 3-electrode configurations were – −1.77V to 1.14V, −1.15V to 1.44V and −1.47V to 1.65V (2-electrode) and − 0.78 V to 0.84 V, −0.6 V to 0.75V and − 0.91 to 0.88V (3-electrode) for the sEEG, depth and the strip electrodes (Table S2 and S3). We use the water window limit extracted from the 2-electrode configuration because this configuration replicates the experimental setup during clinical stimulation.
We evaluate the charge injection capacity using the following procedure. For each tested current amplitude, we change the pulse width in the range of 100μs-1ms and extract the voltage build-up at the electrode tissue interface. We then plot the cathodal and anodal excitation potentials, commonly referred to as excursion potentials or overpotentials, as a function of current. The intercept of this plot with the Hydrogen evolution (cathodal) or the Oxygen evolution (anodal) potentials determines the maximum safe current and subsequently the CIC that can be used for stimulation.
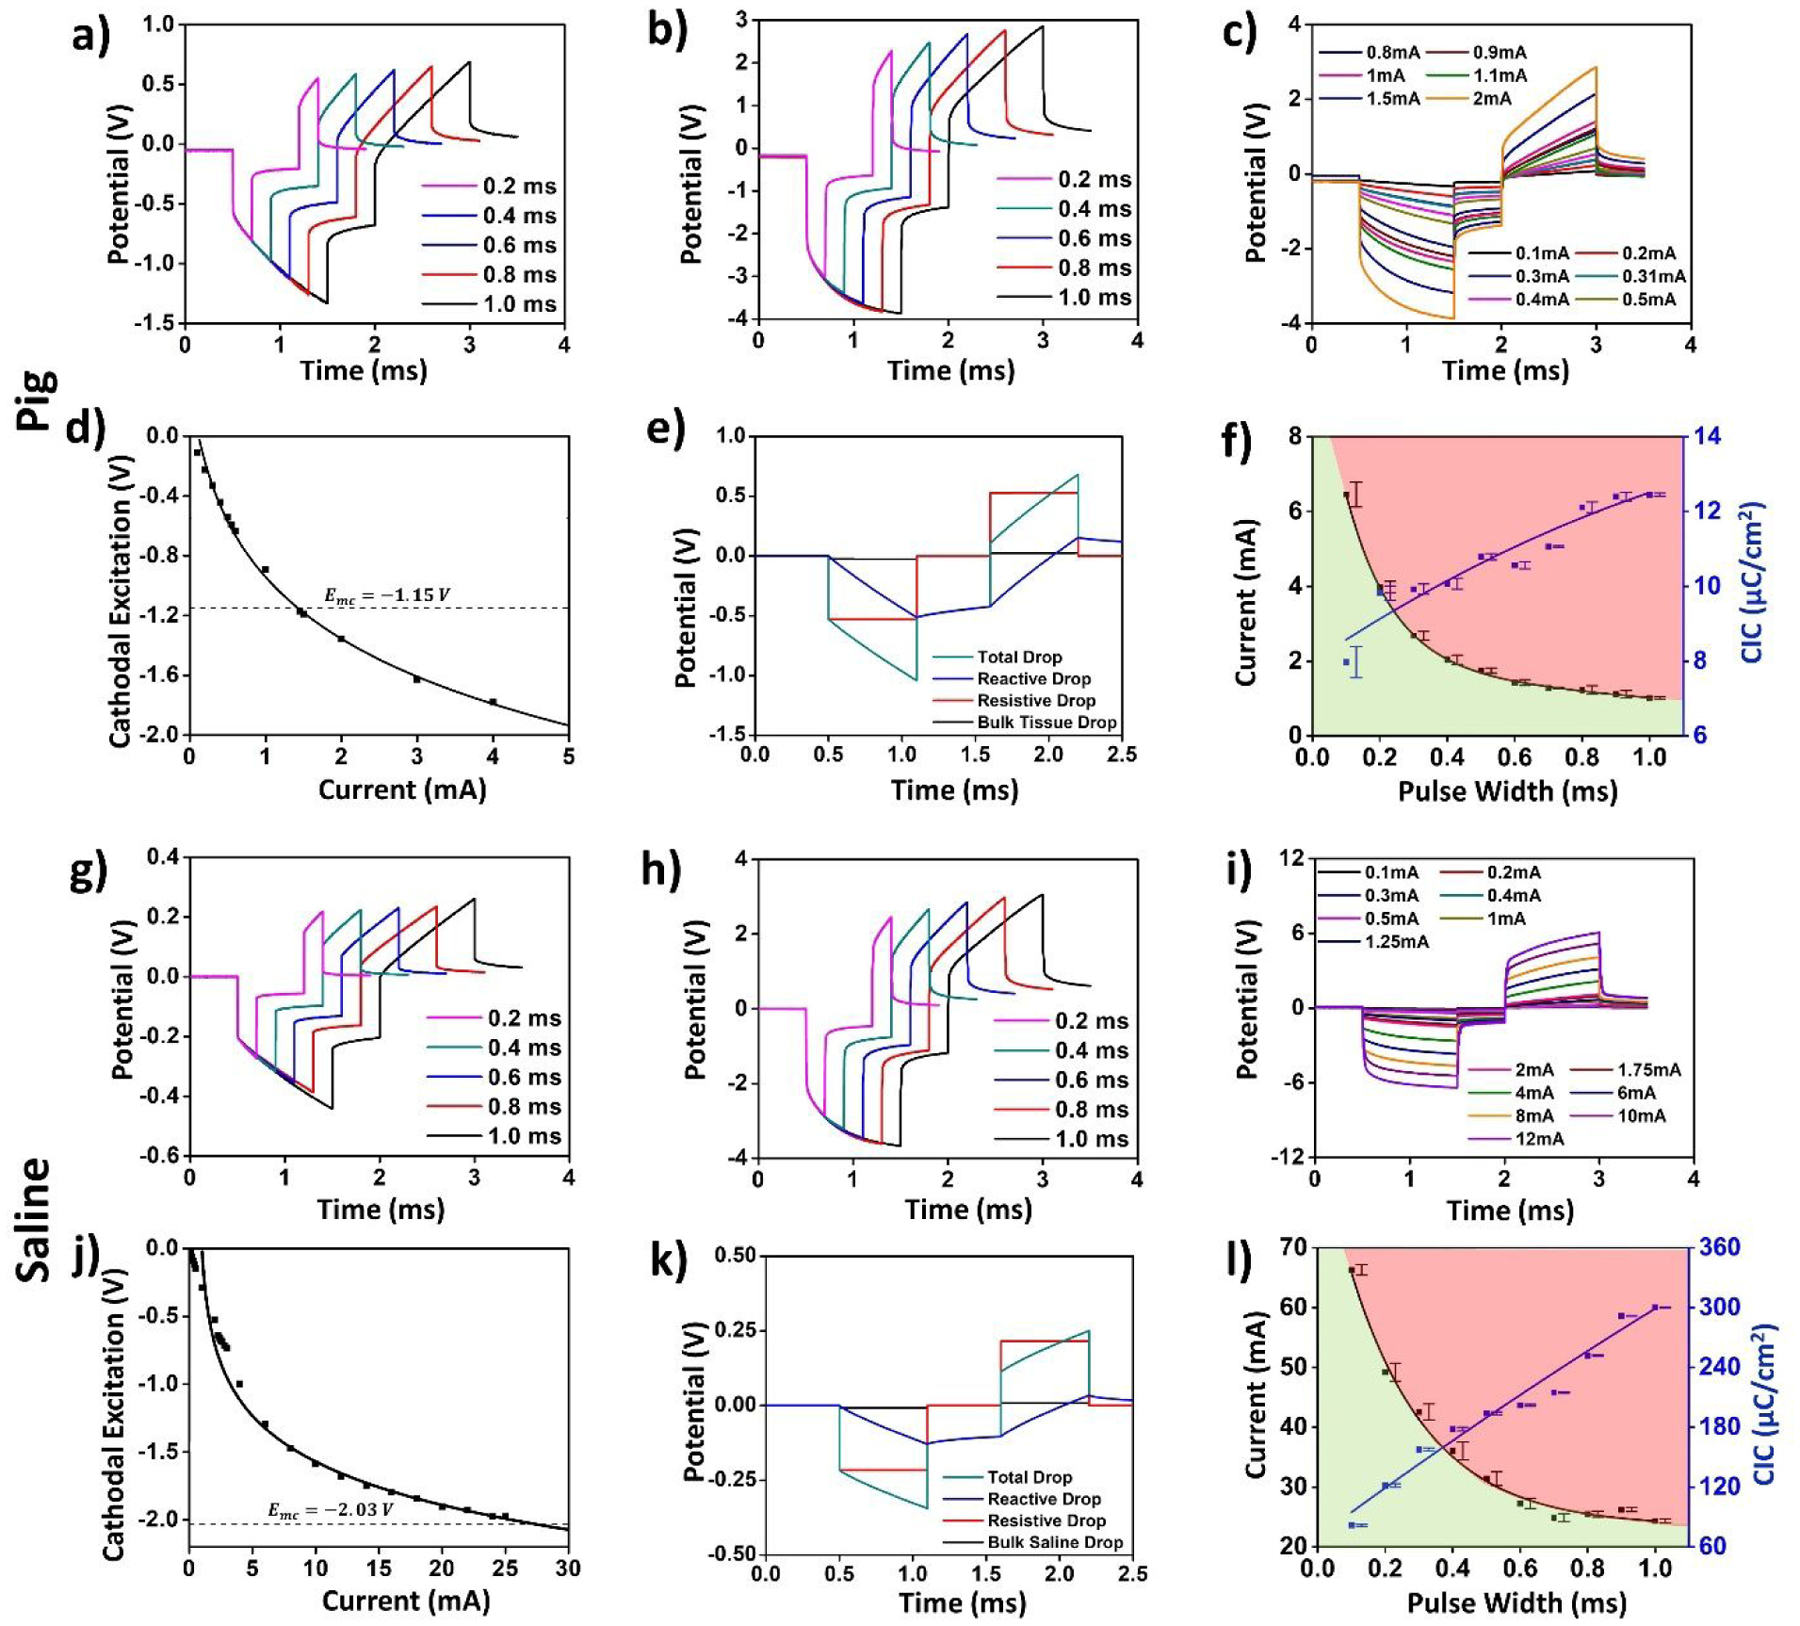
Figs. 5–7 present the results of our measurements in vivo (panels a–f) and in benchtop (panels g–l), for each of the 3 electrodes investigated- sEEG, depth and strip respectively. Panels a and g show the voltage transients across the electrode contact for a 0.5mA current pulse (below the current that leads to water electrolysis) for different pulse widths. After an instantaneous potential drop across the resistive elements of the circuit, there is a potential build-up across the reactive elements of the electrode-tissue interface. Panels b and h show the voltage transients across the same contact for a 2mA current (approaching the current that leads to water electrolysis in-vivo) for different pulse widths. The non-linear potential buildup within the pulse illustrates the contribution of Faradaic reactions to the charge exchange at the electrode-tissue interface. This phenomenon is further illustrated in panels c and i, which plots the measured voltage transients for a 600μs wide pulse for different current amplitudes, we observe a gradual transition from a linear to a non-linear potential profile with increasing current amplitude.
Figure 5: Voltage transients, current, and charge injection limits in the pig’s brain.

(a)–(f) and saline (g)–(l) for the sEEG electrode. (a), (g) The voltage transients for a 0.5 mA injected current at varying pulse-widths. (b), (h) Voltage transients for a 2mA injected current at varying pulse widths. (c), (i) Voltage transients for a 600μs pulse width for varying current amplitudes. (d), (j) Plot the cathodal excitation as a function of the injected current for a 600μs pulse width. (e), (k) Total and individual potential drops across the resistive and reactive elements of the electrode-tissue interface, and across the tissue. (f), (l) Variation in the safe current injection level and CIC with pulse width, with the green shaded area representing the safe stimulation regime. Error bars in panels (f) and (l) represent the normalized root-mean square error from the curve fitting of the cathodal excitation as a function of current.
Figure 7: Voltage transients, current, and charge injection limits in the pig’s brain.

(a)–(f) and saline (g)–(l) for the strip electrode. (a), (g) The voltage transients for a 0.5 mA injected current at varying pulse-widths. (b), (h) Voltage transients for a 2mA injected current at varying pulse widths. (c), (i) Voltage transients for a 600μs pulse width for varying current amplitudes. (d), (j) Plot the cathodal excitation as a function of the injected current for a 600μs pulse width. (e), (k) Total and individual potential drops across the resistive and reactive elements of the electrode-tissue interface, and across the tissue. (f), (l) Variation in the safe current injection level and CIC with pulse width, with the green shaded area representing the safe stimulation regime. Error bars in panels (f) and (l) represent the normalized root-mean square error from the curve fitting of the cathodal excitation as a function of current.
Panels d and j show the measured cathodal excitation potentials as a function of the injected current, for a single pulse of width 600μs. We observe non-linear current-voltage characteristics at the electrode interface due to the contribution of Faradaic reactions. This can be observed from the linear dependence of the voltage as a function of currents for small currents, in panels c and j. We observe a smaller slope for the voltage change beyond this current level and below the water window. The measured cathodal excitation potentials as a function of the injected currents for 0.2, 0.4, 0.6, 0.8, and 1 ms are shown in Fig. 8 where the same excursion potential is reached at smaller currents for larger pulse widths, as expected.
Figure 8:

Cathodal Excitation as a function of the injected current for different pulse widths for each electrode in-vivo and in saline.
As noted earlier, the charge injection limits are established by CV measurements in both in-vivo and benchtop experiments (Fig. S1 and S2). We determine the maximum allowed cathodal excitation (Emc) before irreversible reaction products are formed where we observe an exponential rise in the current beyond this potential. Using the circuit models, we consequently demonstrate the reactive and resistive potential drops due to the injected current in panels e and k. Our simulation results indicate that the potential build-up occurs mainly at the reactive interface of the electrode. For each pulse width, we injected pulses of different amplitudes and use the extraction procedure shown in panels d and j to calculate the maximum current value for water electrolysis and the associated charge injection capacity.
Our measurements show that increasing the pulse width decreases the safe current amplitude limit. However, this decrease is not linear and plateaus for larger pulse widths, leading to increased CIC values as can be seen in panels f and l. The most surprising observation in this experiment is the large difference in the extracted CIC values between benchtop and in vivo testing, where the latter limit is up to an order of magnitude lower. This is a direct consequence of the difference in the electrode-tissue and electrode-saline impedance, as well as the difference in the electrochemical water electrolysis windows in the two cases.
Discussion:
Currently, safety thresholds for stimulation in the clinical context are most often defined by the Shannon Equation, which relates the injected charge density with the actual charge injected per phase, as follows:
where, D is the charge density per phase or the charge injection capacity, and Q is the charge per phase. Based primarily on an analysis of the work performed by McCreery et al., the tissue damage threshold was established by Shannon et al. as a k value between 1.5 and 2, and it is common to use a safety limit of k=1.85. This criterion has generally supplanted the earlier safety stimulation limits for clinical Pt electrodes based only on charge density of 50 μC/cm2 by Kelliher et al. (Kelliher and Rose, 1987). These values of k are higher than the electrochemical safety limits established in this work for the strip and the depth electrode. For the sEEG electrode, we observe that the electrochemical limits are higher than those for the strip and depth electrodes but vary significantly with the pulse width. This indicates that there exists a range of electrochemical safety limits for stimulation that is dependent of the specific electrode geometric factor and current spreading characteristics.
Fig. 9 shows the comparison of the electrodes studied in this work with common electrodes previously used to establish the in-vivo stimulation safety limits (Yuen et al., 1981; Brown et al., 1977; Agnew, Yuen and McCreery, 1983; Britton, 2018). For the depth electrode, we observed that the stimulation limit should in fact be set at k=0.9 for a pulse width of 0.2ms. This limit is corroborated by a recent study that implemented stimulation protocols for chronically implanted Iridium electrodes and limited their k to 0.55 (Eles et al., 2018). It is important to note that for practical experimental reasons, it is much easier to obtain a highly accurate measurement of the threshold for electrolysis than for tissue damage. Measurement of electrolysis is essentially scanning through parameters in a physical chemistry experiment where the endpoint is completely defined and observable; measurement of tissue damage requires chronic implantation of multiple groups of animals and histological examination which may not address all of the possible biological effects and whose sensitivity is limited by natural variability and incidental damage caused by chronic implantation.
Figure 9:

Shannon Limit for the extracted CIC compared against previously reported tissue damage thresholds, marked with open symbols. Filled squares represent the electrochemical safety limits obtained in the present study. The dashed line for k=1.85 represents the tissue damage threshold from prior studies, and the dashed line for k=0.9 represent the electrochemical safety limit for depth electrode obtained in this study. Multiple data points from tissue damage thresholds and electrochemical safety limits fall below the k=1.85 established tissue damage threshold by the Shannon equation.
Our stimulation experiments demonstrated lower stimulation thresholds in-vivo compared to benchtop experiments as summarized in Figs. 9(a–c). We have previously argued that these differences arise primarily due to the differences in the reactive components of the electrode-tissue and electrode-saline interfaces, specifically the double layer capacitance modeled using the constant phase element, CPE2, and the Faradaic branch modeled using Rp and CPE1, as shown in Fig. 4(a). For relatively low stimulating currents, the linear voltage transients indicate that the charging behavior at the interface is largely capacitive (arising from the relationship ). From the extracted CPE2 values shown in Table S1, we observe that CPE2, which models the double layer capacitance at the interface, has a consistently lower capacitance in-vivo (which results in higher reactance/lower admittance). Being the higher reactive/impeding element, this branch dominates at low stimulating currents leading to the observed linear charging behavior. However, at higher levels of stimulation, we observe a marked departure from this behavior. The charging at the interface becomes increasingly non-linear, indicating that the influence of the CPE2 reactance begins to reduce at the emergence of influence of the Faradaic branch. Rp, which models the resistance to direct charge transfer is inherently field-dependent and naturally decreases with bias (Hauch and Georg, 2001). CPE1 which models diffusion of electrolyzed ions that remain in a close proximity to the electrode, will become field-dependent such that its definition as a constant phase element starts to break down. The double layer capacitance, CPE2, will also gradually ceases to exist due to electrolysis of the adsorbent solvent molecules. As a consequence, we observe lower impact of the reactive impedance at higher biases. The impedance spectra used here for modeling the interface were measured near equilibrium potential (zero open circuit potential). To validate these hypotheses, we measured the impedance spectra as a function of the applied potential at the electrode to understand the impact of high potential build-up at the electrode-interface during stimulation (as shown in Fig. 10). We observed consistently lower impedances at higher biases, and the phase changed from predominantly capacitive near equilibrium, to predominantly resistive at higher biases. As the built-up potentials exceeded the water window, we observed that the impedance became almost entirely resistive (zero phase), and at these potentials, irreversible reactions begin to take place. The ratio of the in-vivo to benchtop stimulation thresholds also vary significantly between different electrodes with the depth electrode exhibiting the highest differences. The complex interplay between the interface elements consequently makes it challenging to develop a single predictive model for all electrodes at all stimulation levels.
Figure 10:
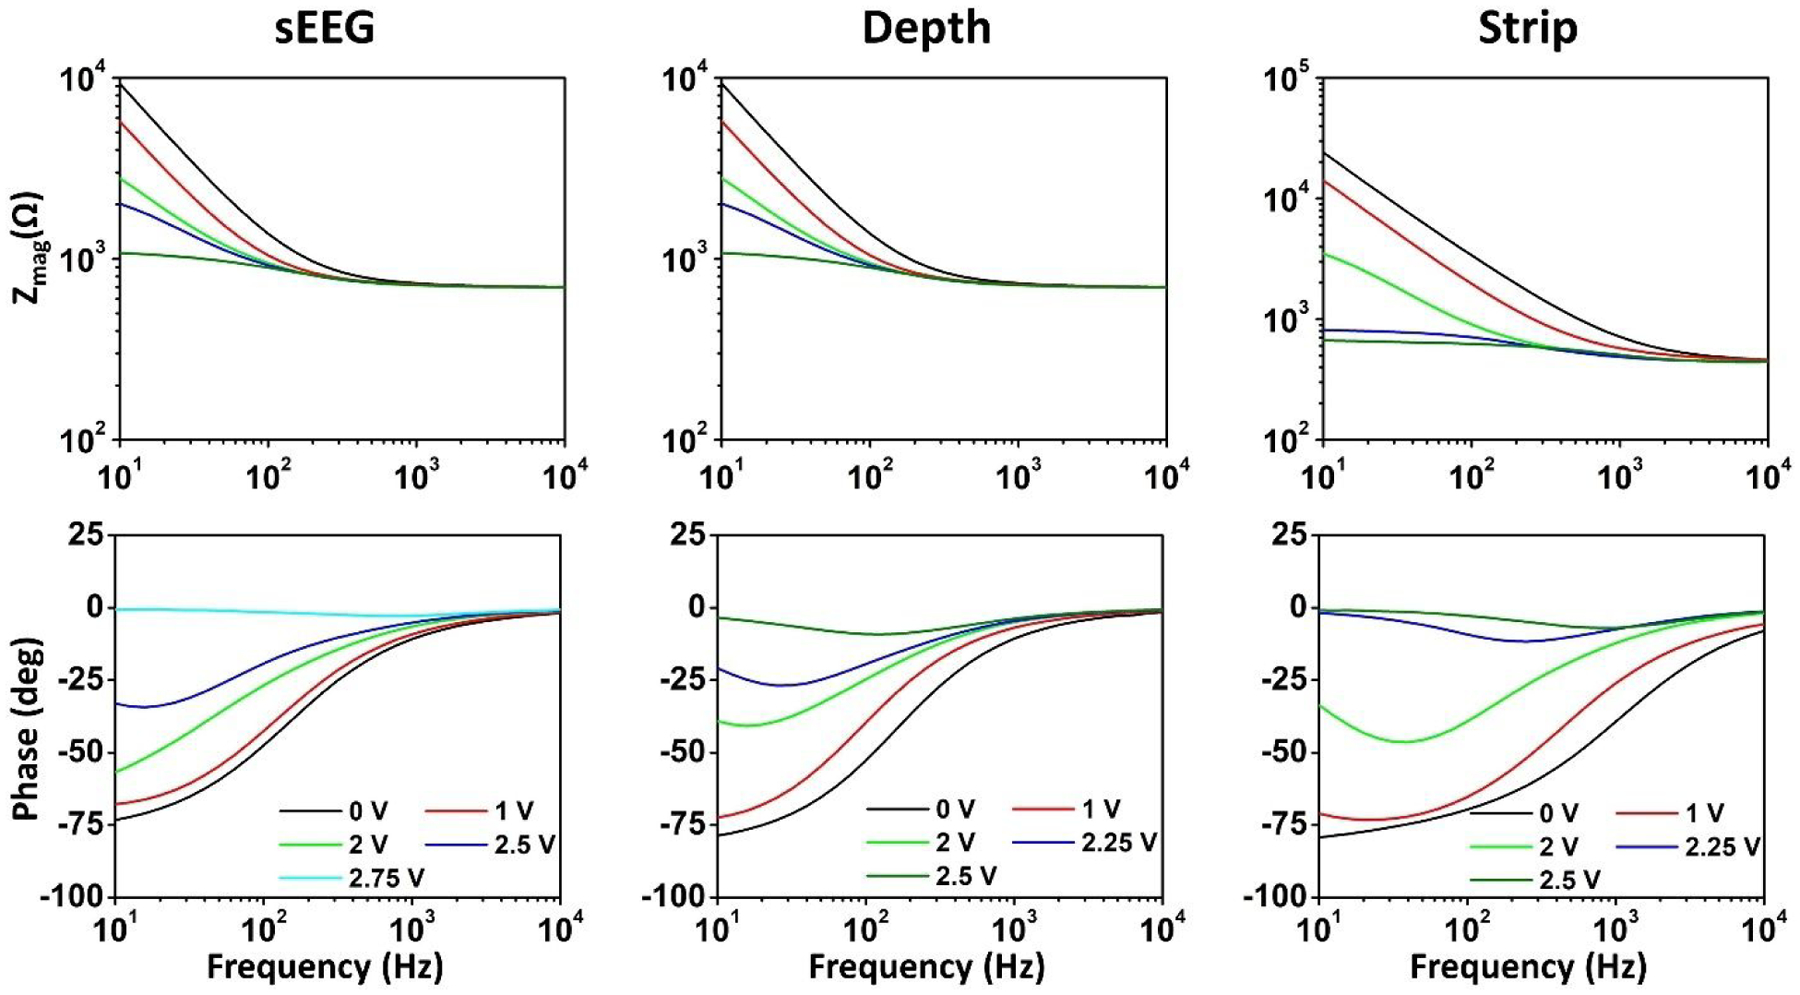
Measured impedance spectra as a function of the applied potential bias on the working electrode for the three types of electrodes in benchtop experiments.
Although these experiments were performed in an acute setting, it is also important to extend this analysis to chronic experiments. Post implantation, biofouling due to the placement of electrodes causes the encapsulation of electrode with tissue, which alters the nature of the electrochemical electrode/tissue interface, and will consequently affect the stimulation limits (Grill and Thomas Mortimer, 1994; Hsu et al., 2009; Campbell and Wu, 2018). This makes it important to perform the measurements outlined in this work for the 2, 3 and 4-electrode configurations to determine the CIC, which will naturally become a dynamic function of this change in the electrochemical environment.
Limitations:
The current study measures the threshold levels of stimulation parameters for water electrolysis. While these measures are higher accuracy and more rigorous by virtue of using a 4-electrode approach and quantitative modeling and are more realistic by virtue of using clinical electrodes in vivo, they nonetheless have several technical limitations. Measurements were made across a range of durations and currents, but more could have been assessed as well as the effects of stimulus waveform. Clinical stimulation can be acute in a single setting (e.g., to map eloquent cortex) or chronic for many years (e.g., DBS for epilepsy, Parkinson’s and depression). However, we only tested during one acute experiment. Our intraparenchymal measures did not distinguish between gray and white matter which have substantially different impedances. We only tested a small sample of clinical electrodes; we did not evaluate in vivo how consistent their characteristics were across different samples of the same model, or if they change over the course of implantation. The variation we found in this limited sample between models strongly suggests that more should be quantitatively examined.
Beyond these technical considerations, the underlying issue of defining a safe limit to stimulation cannot be fully answered without reference to both the clinical context and biological considerations. While electrolysis is generally accepted as a primary cause for tissue damage and electrode erosion from electrical stimulation, we did not conduct histological measures. Indeed, electrical stimulation below the electrolysis threshold induces chronic changes in the neurobiological and electrical characteristics of nearby neurons, as well as the networks they participate in, just as behavioral activation does. Whether such changes are harmful depends on their precise nature. Thus, the electrolysis limits determined by our studies should be considered a tentative upper bound for stimulation of the electrodes we tested within the ranges of parameters explored.
Conclusion:
We investigated the performance of three platinum based clinical electrodes commonly used for stimulation and established the electrochemical stimulation safety windows. The charge injection capacity of the electrodes increases non-linearly with pulse width, because of the non-linear charge build-up over the capacitive elements at the electrode-tissue interface. Hence, longer duty cycles allow a higher CIC. Further, fundamental deviations in the interface properties between the in vivo and benchtop characterization indicates that the water electrolysis limits need to be established for the two cases, and benchtop saline experiments alone cannot be used to predict the in vivo electrode performance.
We further investigated the electrochemical safety limits against the established tissue damage thresholds predicted by the Shannon’s limit for macroelectrodes which does not account for several important parameters such as electrode material, electrode-tissue interface chemistry and pulse width of stimulation. The cathodal excitation observed is a function of each of these three parameters, and as such, any safety threshold must include them all. We observe that the empirical Shannon equation can potentially over-estimate the safety thresholds for clinical macroelectrodes, and stimulation limits may need to be set more conservatively, based on the type of electrode used, and the stimulation parameters considered (2-electrode vs 3-electrode, duration of pulse width).
Supplementary Material
Figure 6: Voltage transients, current, and charge injection limits in the pig’s brain.
(a)–(f) and saline (g)–(l) for the depth electrode. (a), (g) The voltage transients for a 0.5 mA injected current at varying pulse-widths. (b), (h) Voltage transients for a 2mA injected current at varying pulse widths. (c), (i) Voltage transients for a 600μs pulse width for varying current amplitudes. (d), (j) Plot the cathodal excitation as a function of the injected current for a 600μs pulse width. (e), (k) Total and individual potential drops across the resistive and reactive elements of the electrode-tissue interface, and across the tissue. (f), (l) Variation in the safe current injection level and CIC with pulse width, with the green shaded area representing the safe stimulation regime. Error bars in panels (f) and (l) represent the normalized root-mean square error from the curve fitting of the cathodal excitation as a function of current.
Figure 11:

A summary of the stimulation limits calculated from in-vivo experiments in pig cortical tissue and benchtop experiments in saline for the (a) sEEG, (b) Depth and (c) Strip electrodes. We observe significant reduction in the in-vivo stimulation limits for all three types of electrodes.
Table 1:
Current safety limits for the three types of electrodes.
| Pulse Width | 0.2ms | 0.4ms | 0.6ms | 0.8ms | 1ms | |
|---|---|---|---|---|---|---|
| sEEG Electrochemical | Tissue | 7.04 | 4.94 | 3.84 | 3.06 | 2.47 |
| Saline | 34.61 | 17.68 | 13.63 | 10.59 | 8.74 | |
| Depth Electrochemical | Tissue | 3.97 | 2.04 | 1.43 | 1.23 | 1.01 |
| Saline | 49.22 | 36.06 | 27.28 | 25.48 | 24.32 | |
| Strip Electrochemical | Tissue | 3.87 | 2.15 | 1.87 | 1.41 | 1.2 |
| Saline | 10.22 | 7.17 | 5.75 | 4.36 | 3.65 |
References:
- Agnew WF, Yuen TGH and McCreery DB (1983) ‘Morphologic changes after prolonged electrical stimulation of the cat’s cortex at defined charge densities’, Experimental Neurology, 79(2), pp. 397–411. doi: 10.1016/0014-4886(83)90221-2. [DOI] [PubMed] [Google Scholar]
- Alba NA et al. (2015) ‘In vivo electrochemical analysis of a PEDOT/MWCNT neural electrode coating’, Biosensors, 5(4), pp. 618–646. doi: 10.3390/bios5040618. [DOI] [PMC free article] [PubMed] [Google Scholar]
- Bai SJ and Prinz FB (2011) ‘In vivo electrochemical impedance measurement on single cell membrane’, Microelectronic Engineering, 88(10), pp. 3094–3100. doi: 10.1016/j.mee.2011.06.003. [DOI] [Google Scholar]
- Bao JZ, Lu ST and Hurt WD (1997) ‘Complex dielectric measurements and analysis of brain tissues in the radio and microwave frequencies’, IEEE Transactions on Microwave Theory and Techniques, 45(10 PART 1), pp. 1730–1741. doi: 10.1109/22.641720. [DOI] [Google Scholar]
- Bisquert J et al. (1998) ‘Impedance of constant phase element (CPE)-blocked diffusion in film electrodes’, Journal of Electroanalytical Chemistry, 452(2), pp. 229–234. doi: 10.1016/S0022-0728(98)00115-6. [DOI] [Google Scholar]
- Boon P et al. (2009) ‘Electrical Stimulation for the Treatment of Epilepsy’, Neurotherapeutics, 6(2), pp. 218–227. doi: 10.1016/j.nurt.2008.12.003. [DOI] [PMC free article] [PubMed] [Google Scholar]
- Branco DM et al. (2003) ‘Functional variability of the human cortical motor map: Electrical stimulation findings in perirolandic epilepsy surgery’, Journal of Clinical Neurophysiology, 20(1), pp. 17–25. doi: 10.1097/00004691-200302000-00002. [DOI] [PubMed] [Google Scholar]
- Britton JW (2018) ‘Electrical stimulation mapping with stereo-EEG electrodes’, Journal of Clinical Neurophysiology, 35(2), pp. 110–114. doi: 10.1097/WNP.0000000000000443. [DOI] [PubMed] [Google Scholar]
- Brown WJ et al. (1977) ‘Tissue reactions to long term electrical stimulation of the cerebellum in monkeys’, Journal of Neurosurgery, 47(3), pp. 366–379. doi: 10.3171/jns.1977.47.3.0366. [DOI] [PubMed] [Google Scholar]
- Brummer SB, McHardy J and Turner MJ (1977) ‘Electrical stimulation with pt electrodes: Trace analysis for dissolved platinum and other dissolved electrochemical products1’, Brain, Behavior and Evolution, 14(1–2), pp. 10–22. doi: 10.1159/000124611. [DOI] [PubMed] [Google Scholar]
- Bullara LA et al. (1988) ‘Comparison of neural damage induced by electrical stimulation with faradaic and capacitor electrodes.’, Annals of biomedical engineering, 16(5), pp. 463–481. Available at: http://www.ncbi.nlm.nih.gov/pubmed/3189974. [DOI] [PubMed] [Google Scholar]
- Butterwick A et al. (2007) ‘Tissue damage by pulsed electrical stimulation’, IEEE Transactions on Biomedical Engineering, 54(12), pp. 2261–2267. doi: 10.1109/TBME.2007.908310. [DOI] [PubMed] [Google Scholar]
- Campbell A and Wu C (2018) ‘Chronically implanted intracranial electrodes: Tissue reaction and electrical changes’, Micromachines, 9(9), pp. 1–14. doi: 10.3390/mi9090430. [DOI] [PMC free article] [PubMed] [Google Scholar]
- Chang BY and Park SM (2010) ‘Electrochemical impedance spectroscopy’, Annual Review of Analytical Chemistry, 3(1), pp. 207–229. doi: 10.1146/annurev.anchem.012809.102211. [DOI] [PubMed] [Google Scholar]
- Chen SH et al. (2016) ‘Influence of roughness on in-vivo properties of titanium implant surface and their electrochemical behavior’, Surface and Coatings Technology, 302, pp. 215–226. doi: 10.1016/j.surfcoat.2016.06.007. [DOI] [Google Scholar]
- Cheng HY et al. (1979) ‘In vivo Electrochemistry: Behavior of Micro Electrodes in Brain Tissue’, 100, pp. 23–31. [Google Scholar]
- Chong CE and Tan YL (2008) ‘A new geometric factor for in situ resistivity measurement using four slender cylindrical electrodes’, IEEE Transactions on Biomedical Engineering, 55(2), pp. 594–602. doi: 10.1109/TBME.2007.903704. [DOI] [PubMed] [Google Scholar]
- Clavilier J et al. (1990) ‘Study of the conditions for irreversible adsorption of lead at Pt(h,k,l) electrodes’, Journal of Electroanalytical Chemistry, 293(1–2), pp. 197–208. doi: 10.1016/0022-0728(90)80063-C. [DOI] [Google Scholar]
- Cogan SF (2006) ‘In vivo and in vitro differences in the charge-injection and electrochemical properties of iridium oxide electrodes’, Annual International Conference of the IEEE Engineering in Medicine and Biology - Proceedings, pp. 882–885. doi: 10.1109/IEMBS.2006.259654. [DOI] [PubMed] [Google Scholar]
- Cogan SF et al. (2006) ‘Potential-biased, asymmetric waveforms for charge-injection with activated iridium oxide (AIROF) neural stimulation electrodes’, IEEE Transactions on Biomedical Engineering, 53(2), pp. 327–332. doi: 10.1109/TBME.2005.862572. [DOI] [PubMed] [Google Scholar]
- Cogan SF et al. (2016) ‘Tissue damage thresholds during therapeutic electrical stimulation’, Journal of Neural Engineering, 13(2). doi: 10.1088/1741-2560/13/2/021001. [DOI] [PMC free article] [PubMed] [Google Scholar]
- Doña Rodríguez JM, Melián JAH and Peña JP (2000) ‘Determination of the Real Surface Area of Pt Electrodes by Hydrogen Adsorption Using Cyclic Voltammetry’, Journal of Chemical Education, 77(9), pp. 1195–1197. doi: 10.1021/ed077p1195. [DOI] [Google Scholar]
- Eles JR et al. (2018) ‘In vivo imaging of neuronal calcium during electrode implantation: Spatial and temporal mapping of damage and recovery’, Biomaterials, 174, pp. 79–94. doi: 10.1016/j.biomaterials.2018.04.043. [DOI] [PMC free article] [PubMed] [Google Scholar]
- Fonoff ET et al. (2009) ‘Functional mapping of the motor cortex of the rat using transdural electrical stimulation’, Behavioural Brain Research, 202(1), pp. 138–141. doi: 10.1016/j.bbr.2009.03.018. [DOI] [PubMed] [Google Scholar]
- Franks W et al. (2005) ‘Impedance characterization and modeling of electrodes for biomedical applications’, IEEE Transactions on Biomedical Engineering, 52(7), pp. 1295–1302. doi: 10.1109/TBME.2005.847523. [DOI] [PubMed] [Google Scholar]
- Fuller CS and Ditzenberger JA (1956) ‘Diffusion of donor and acceptor elements in silicon’, Journal of Applied Physics, 27(5), pp. 544–553. doi: 10.1063/1.1722419. [DOI] [Google Scholar]
- Gabriel S, Lau RW and Gabriel C (1996) ‘The dielectric properties of biological tissues: II. Measurements in the frequency range 10 Hz to 20 GHz’, Physics in Medicine and Biology, 41(11), pp. 2251–2269. doi: 10.1088/0031-9155/41/11/002. [DOI] [PubMed] [Google Scholar]
- Geddes LA and Baker LE (1967) ‘The specific resistance of biological material-A compendium of data for the biomedical engineer and physiologist’, Medical and biological engineering, 5(3), pp. 271–293. doi: 10.1007/BF02474537. [DOI] [PubMed] [Google Scholar]
- Grill WM and Mortimer JT (1995) ‘Stimulus Waveforms for Selective Neural Stimulation’, IEEE Engineering in Medicine and Biology Magazine, 14(4), pp. 375–385. doi: 10.1109/51.395310. [DOI] [Google Scholar]
- Grill WM and Thomas Mortimer J (1994) ‘Electrical properties of implant encapsulation tissue’, Annals of Biomedical Engineering, 22(1), pp. 23–33. doi: 10.1007/BF02368219. [DOI] [PubMed] [Google Scholar]
- Han M et al. (2012) ‘In vivo validation of custom-designed silicon-based microelectrode arrays for long-term neural recording and stimulation’, IEEE Transactions on Biomedical Engineering, 59(2), pp. 346–354. doi: 10.1109/TBME.2011.2172440. [DOI] [PMC free article] [PubMed] [Google Scholar]
- Hauch A and Georg A (2001) ‘Diffusion in the electrolyte and charge-transfer reaction at the platinum electrode in dye-sensitized solar cells’, Electrochimica Acta, 46(22), pp. 3457–3466. doi: 10.1016/S0013-4686(01)00540-0. [DOI] [Google Scholar]
- Hsu JM et al. (2009) ‘Encapsulation of an integrated neural interface device with parylene C’, IEEE Transactions on Biomedical Engineering, 56(1), pp. 23–29. doi: 10.1109/TBME.2008.2002155. [DOI] [PubMed] [Google Scholar]
- Huang YJ, Huang EY and Cheng KS (2013) ‘The correlation between extracellular resistance by electrical biopsy and the ratio of optical low staining area in irradiated intestinal tissues of rats’, BioMedical Engineering Online, 12(1), pp. 1–13. doi: 10.1186/1475-925X-12-23. [DOI] [PMC free article] [PubMed] [Google Scholar]
- Hudak EM, Mortimer JT and Martin HB (2010) ‘Platinum for neural stimulation: Voltammetry considerations’, Journal of Neural Engineering, 7(2). doi: 10.1088/1741-2560/7/2/026005. [DOI] [PubMed] [Google Scholar]
- Janegitz BC et al. (2017) ‘The application of graphene for in vitro and in vivo electrochemical biosensing’, Biosensors and Bioelectronics, 89, pp. 224–233. doi: 10.1016/j.bios.2016.03.026. [DOI] [PubMed] [Google Scholar]
- Jiménez F et al. (2013) ‘Electrical stimulation of the inferior thalamic peduncle in the treatment of major depression and obsessive compulsive disorders’, World Neurosurgery, 80(3–4), p. S30.e17–S30.e25. doi: 10.1016/j.wneu.2012.07.010. [DOI] [PubMed] [Google Scholar]
- John SE et al. (2019) ‘In Vivo Impedance Characterization of Cortical Recording Electrodes Shows Dependence on Electrode Location and Size’, IEEE Transactions on Biomedical Engineering, 66(3), pp. 675–681. doi: 10.1109/TBME.2018.2854623. [DOI] [PubMed] [Google Scholar]
- Kay CF and Schwan HP (1956) ‘Specific resistance of body tissues.’, Circulation research, 4(6), pp. 664–670. doi: 10.1161/01.res.4.6.664. [DOI] [PubMed] [Google Scholar]
- Kelliher EM and Rose TL (1987) ‘Evaluation of Charge Injection Properties of Thin Film Redox Materials for use as Neural Stimulation Electrodes’, MRS Proceedings, 110(May), pp. 23–27. doi: 10.1557/proc-110-23. [DOI] [Google Scholar]
- Kissinger PT and Heineman WR (1983) ‘Cyclic voltammetry’, Journal of Chemical Education, 60(9), pp. 702–706. doi: 10.1021/ed060p702. [DOI] [Google Scholar]
- Kuncel AM and Grill WM (2004) ‘Selection of stimulus parameters for deep brain stimulation’, Clinical Neurophysiology, 115(11), pp. 2431–2441. doi: 10.1016/j.clinph.2004.05.031. [DOI] [PubMed] [Google Scholar]
- Latikka JA et al. (2001) ‘The conductivity of brain tissues: Comparison of results in vivo and in vitro measurements’, Annual Reports of the Research Reactor Institute, Kyoto University, 1, pp. 910–912. doi: 10.1109/iembs.2001.1019092. [DOI] [Google Scholar]
- Lempka SF et al. (2009) ‘In vivo impedance spectroscopy of deep brain stimulation electrodes’, Journal of Neural Engineering, 6(4). doi: 10.1088/1741-2560/6/4/046001. [DOI] [PMC free article] [PubMed] [Google Scholar]
- Lozano AM et al. (2002) ‘Deep brain stimulation for Parkinson’s disease: Disrupting the disruption’, Lancet Neurology, 1(4), pp. 225–231. doi: 10.1016/S1474-4422(02)00101-1. [DOI] [PubMed] [Google Scholar]
- Mallet L et al. (2008) ‘Subthalamic Nucleus Stimulation in Severe Obsessive–Compulsive Disorder’, New England Journal of Medicine, 359(20), pp. 2121–2134. doi: 10.1056/nejmoa0708514. [DOI] [PubMed] [Google Scholar]
- McCreery DB et al. (1990) ‘Charge density and charge per phase as cofactors in neural injury induced by electrical stimulation’, IEEE Transactions on Biomedical Engineering, 37(10), pp. 996–1001. doi: 10.1109/10.102812. [DOI] [PubMed] [Google Scholar]
- McCreery DB et al. (1995) ‘Relationship between stimulus amplitude, stimulus frequency and neural damage during electrical stimulation of sciatic nerve of cat’, Medical & Biological Engineering & Computing, 33(3), pp. 426–429. doi: 10.1007/BF02510526. [DOI] [PubMed] [Google Scholar]
- McCreery DB et al. (1997) ‘A characterization of the effects on neuronal excitability due to prolonged microstimulation with chronically implanted microelectrodes’, IEEE Transactions on Biomedical Engineering, 44(10), pp. 931–939. doi: 10.1109/10.634645. [DOI] [PubMed] [Google Scholar]
- Merrill DR, Bikson M and Jefferys JGR (2005) ‘Electrical stimulation of excitable tissue: Design of efficacious and safe protocols’, Journal of Neuroscience Methods, 141(2), pp. 171–198. doi: 10.1016/j.jneumeth.2004.10.020. [DOI] [PubMed] [Google Scholar]
- Meyer RD et al. (2001) ‘Electrodeposited iridium oxide for neural stimulation and recording electrodes’, IEEE Transactions on Neural Systems and Rehabilitation Engineering, 9(1), pp. 2–11. doi: 10.1109/7333.918271. [DOI] [PubMed] [Google Scholar]
- Musa S et al. (2009) ‘In vitro and in vivo electrochemical characterization of a microfabricated neural probe’, Proceedings of the 31st Annual International Conference of the IEEE Engineering in Medicine and Biology Society: Engineering the Future of Biomedicine, EMBC 2009, pp. 7143–7146. doi: 10.1109/IEMBS.2009.5335362. [DOI] [PubMed] [Google Scholar]
- Ojemann G et al. (2008) ‘Cortical language localization in left, dominant hemisphere. An electrical stimulation mapping investigation in 117 patients. 1989.’, Journal of neurosurgery, 108(2), pp. 411–421. doi: 10.3171/JNS/2008/108/2/0411. [DOI] [PubMed] [Google Scholar]
- Pethig R (1987) ‘Dielectric properties of body tissues’, Clinical Physics and Physiological Measurement, 8(4A), pp. 5–12. [DOI] [PubMed] [Google Scholar]
- Randles JEB (1947) ‘Kinetics of Rapid Electrode Reactions’, Discussion of the Faraday Society, 1(11). [Google Scholar]
- Robblee LS et al. (1983) ‘Electrical stimulation with Pt electrodes. VII. Dissolution of Pt electrodes during electrical stimulation of the cat cerebral cortex’, Journal of Neuroscience Methods, 9(4), pp. 301–308. doi: 10.1016/0165-0270(83)90062-6. [DOI] [PubMed] [Google Scholar]
- Robillard PN and Poussart Y (1977) ‘Specific-impedance measurements of brain tissues’, Medical & Biological Engineering & Computing, 15(4), pp. 438–445. doi: 10.1007/BF02457999. [DOI] [PubMed] [Google Scholar]
- Rymaszewski R (1969) ‘Relationship between the correction factor of the four-point probe value and the selection of potential and current electrodes’, Journal of Physics E: Scientific Instruments, 2(2), pp. 170–174. doi: 10.1088/0022-3735/2/2/312. [DOI] [Google Scholar]
- Sahyouni R et al. (2017) ‘Functional and Histological Effects of Chronic Neural Electrode Implantation’, Laryngoscope investigative otolaryngology, 2(2), pp. 80–93. doi: 10.1002/lio2.66. [DOI] [PMC free article] [PubMed] [Google Scholar]
- Seaton BT et al. (2020) ‘Mitigating the Effects of Electrode Biofouling-Induced Impedance for Improved Long-Term Electrochemical Measurements in Vivo’, Analytical Chemistry, 92(9), pp. 6334–6340. doi: 10.1021/acs.analchem.9b05194. [DOI] [PMC free article] [PubMed] [Google Scholar]
- Shannon RV (1992) ‘A Model of Safe LEvels for Electrical Stimulation’, IEEE Transactions on Biomedical Engineering, 39(4), pp. 424–426. Available at: http://marefateadyan.nashriyat.ir/node/150. [DOI] [PubMed] [Google Scholar]
- Shoar Abouzari MR et al. (2009) ‘On the physical interpretation of constant phase elements’, Solid State Ionics, 180(14–16), pp. 922–927. doi: 10.1016/j.ssi.2009.04.002. [DOI] [Google Scholar]
- Somann JP et al. (2018) ‘Chronic cuffing of cervical vagus nerve inhibits efferent fiber integrity in rat model’, Journal of Neural Engineering, 15(3). doi: 10.1088/1741-2552/aaa039. [DOI] [PMC free article] [PubMed] [Google Scholar]
- Steendijk P et al. (1993) ‘The Four-Electrode Resistivity Technique in Anisotropic Media: Theoretical Analysis and Application on Myocardial Tissue in Vivo’, IEEE Transactions on Biomedical Engineering, 40(11), pp. 1138–1148. doi: 10.1109/10.245632. [DOI] [PubMed] [Google Scholar]
- Stoy RD, Foster KR and Schwan HP (1982) ‘Dielectric properties of mammalian tissues from 0.1 to 100 MHz; a summary of recent data’, Physics in Medicine and Biology, 27(4), pp. 501–513. doi: 10.1088/0031-9155/27/4/002. [DOI] [PubMed] [Google Scholar]
- Straka MM et al. (2018) ‘Characterizing longitudinal changes in the impedance spectra of in-vivo peripheral nerve electrodes’, Micromachines, 9(11), pp. 1–21. doi: 10.3390/mi9110587. [DOI] [PMC free article] [PubMed] [Google Scholar]
- Tsai JZ et al. (2000) ‘Dependence of apparent resistance of four-electrode probes on insertion depth’, IEEE Transactions on Biomedical Engineering, 47(1), pp. 41–48. doi: 10.1109/10.817618. [DOI] [PubMed] [Google Scholar]
- Turner MJ and Brummer SB (1977) ‘Electrochemical Considerations for Safe eElectrical Stimulation of the Nervous System with Platinum Electrodes’, IEEE Transactions on Biomedical Engineering, 24(1), pp. 59–63. [DOI] [PubMed] [Google Scholar]
- Valsa J and Vlach J (2013) ‘RC models of a constant phase element’, International Journal of Circuit Theory and Applications, 41(October 2011), pp. 59–67. doi: 10.1002/cta. [DOI] [Google Scholar]
- Viventi J et al. (2011) ‘Flexible, foldable, actively multiplexed, high-density electrode array for mapping brain activity in vivo’, Nature Neuroscience, 14(12), pp. 1599–1605. doi: 10.1038/nn.2973. [DOI] [PMC free article] [PubMed] [Google Scholar]
- Wang JC (1987) ‘Realizations of Generalized Warburg Impedance with RC Ladder Networks and Transmission Lines’, Journal of The Electrochemical Society, 134(8), pp. 1915–1920. doi: 10.1149/1.2100789. [DOI] [Google Scholar]
- Wei XF and Grill WM (2009) ‘Impedance characteristics of deep brain stimulation electrodes in vitro and in vivo’, Journal of Neural Engineering, 6(4). doi: 10.1088/1741-2560/6/4/046008. [DOI] [PMC free article] [PubMed] [Google Scholar]
- Yuen TGH et al. (1981) ‘Histological Evaluation of Neural Damage from Electrical Stimulation Considerations for the Selection of Parameters for Clinical Application’, Neurosurgery, 9(3), pp. 292–299. [PubMed] [Google Scholar]
- Zimney EJ et al. (2007) ‘Correction factors for 4-probe electrical measurements with finite size electrodes and material anisotropy: A finite element study’, Measurement Science and Technology, 18(7), pp. 2067–2073. doi: 10.1088/0957-0233/18/7/037. [DOI] [Google Scholar]
Associated Data
This section collects any data citations, data availability statements, or supplementary materials included in this article.