Abstract
Debris strikes on operational spacecraft are becoming more common due to increasing numbers of space objects. Sample return missions indicate hundreds of minor strikes, but rigorous analysis is often only performed when a strike causes an anomaly in spacecraft performance. Developing techniques to identify and assess minor strikes that do not immediately cause anomalous behavior can help to validate models for debris populations, perform risk assessments, and aid in the attribution of future anomalies. This study introduces debris strikes to a spacecraft dynamics simulation and assesses the effect on spacecraft telemetry. Various signal processing and change detection techniques are used to identify strikes in noisy telemetry and estimate strike parameters. Matched filter wavelets are developed to identify the effects on state telemetry, where errors are autonomously corrected by the spacecraft attitude control system. A bank of matched filters is used to estimate the parameters of the strike based on a priori knowledge of the spacecraft’s response characteristics. A sequential probability ratio test is used to highlight abrupt changes in the spacecraft’s angular momentum. Monte-Carlo analyses are conducted to characterize the performance of these algorithms. The results of the various techniques are compared in terms of correctly identifying the debris strikes and accurately estimating the strike parameters. Developing the capability to catalog and characterize minor debris strikes allows any spacecraft to be used as an in situ debris sensor.
Keywords: Debris strike, Perturbation, Attitude, Telemetry, Change detection, Space environment management
1. Introduction
The population of trackable fragmentation debris has more than doubled in the past 25 years [1]. This is especially concerning because while trackable debris can be avoided by maneuvering satellites, most fragmentation events also release clouds of debris too small to track. The Space Surveillance Network tracks debris down to around 10 cm in LEO and 70 cm in GEO [2], but a piece of debris smaller than 1 cm can cause mission-ending damage to a spacecraft if it hits a sensitive component [3,4]. As of February 2020, there are approximately 34,000 debris objects greater than 10 cm in orbit; but there are approximately 900,000 objects between 1 cm and 10 cm [5]. Therefore, well under 10% of the potentially hazardous debris population is tracked.
The modeling and measurement situation is especially dire in GEO where many valuable satellites are located. Objects smaller than around 70 cm are untracked, and the small debris models are inherently limited due to a lack of capability to obtain data. NASA’s state-of-the-art debris environment model, ORDEM3.1, only models GEO debris down to 10 cm, and even that is an extrapolation from available data on debris 30 cm and larger [6,7]. Thus, very little is known about the GEO small debris environment. While collisions tend to be slower in GEO than LEO an object inclined 15° will cross an equatorial orbit at approximately 800 m/s relative velocity, which is still more than fast enough for a small object to cause significant damage [8].
While data for GEO small debris models is lacking the LEO models benefit from radar and occasional in situ measurement data, which is typically from sample return missions. However, there have been some indications that current LEO debris models may be overly conservative. This is burdensome for ongoing programs as it makes it difficult to show compliance with debris mitigation standards. A 2017 study by the NASA Engineering and Safety Center (NESC) [9] found that NASA’s debris risk assessment process overpredicted the likelihood of failure by a significant amount in multiple case studies, often showing low probabilities of consistency between model predictions and on-orbit data. In one example the models predicted between 24 and 160 perturbation events while seven were reported. In another 11.3 tank or battery failures were predicted while two were recorded.
These discrepancies are likely due to a variety of factors. The predictions were often better for objects in the well-characterized 400 km orbit, where most in situ measurements have occurred, indicating that ORDEM’s accuracy may suffer at higher altitudes. ORDEM is also just one piece of the risk assessment process. Radar and optical measurements correspond to an object’s size, while the object’s mass is more relevant to assessing damage potential. Correlating the two requires assumptions regarding shape and density. Anomalies are also notoriously under-reported, and there is always a potential for misattribution of an anomaly’s root cause which may affect the number of recorded debris-related anomalies.
Two recent events illustrate the potential effects of strikes from untracked debris. In August of 2016, the Sentinel-1A spacecraft experienced an anomaly consisting of an abrupt attitude perturbation (Fig. 1) coupled with a slight orbit change and simultaneous decrease in solar power output. On-board cameras confirmed a debris strike on the solar array. However, the solar array strike was non-catastrophic and operations continued nominally [10]. A year later, in August of 2017, Telkom-1 experienced an abrupt anomaly where ground-based sensors captured a sudden fragmentation event liberating several debris pieces, culminating in the total loss of the satellite. The event appeared to be consistent with a pressurized vessel rupture [11], although since the satellite was not recovered it is difficult to attribute the anomaly’s root cause definitively. The ground-based sensors that observed the event are capable of identifying objects down to about 10 cm [12], so a smaller object impacting the satellite would not have been observed.
Fig. 1.
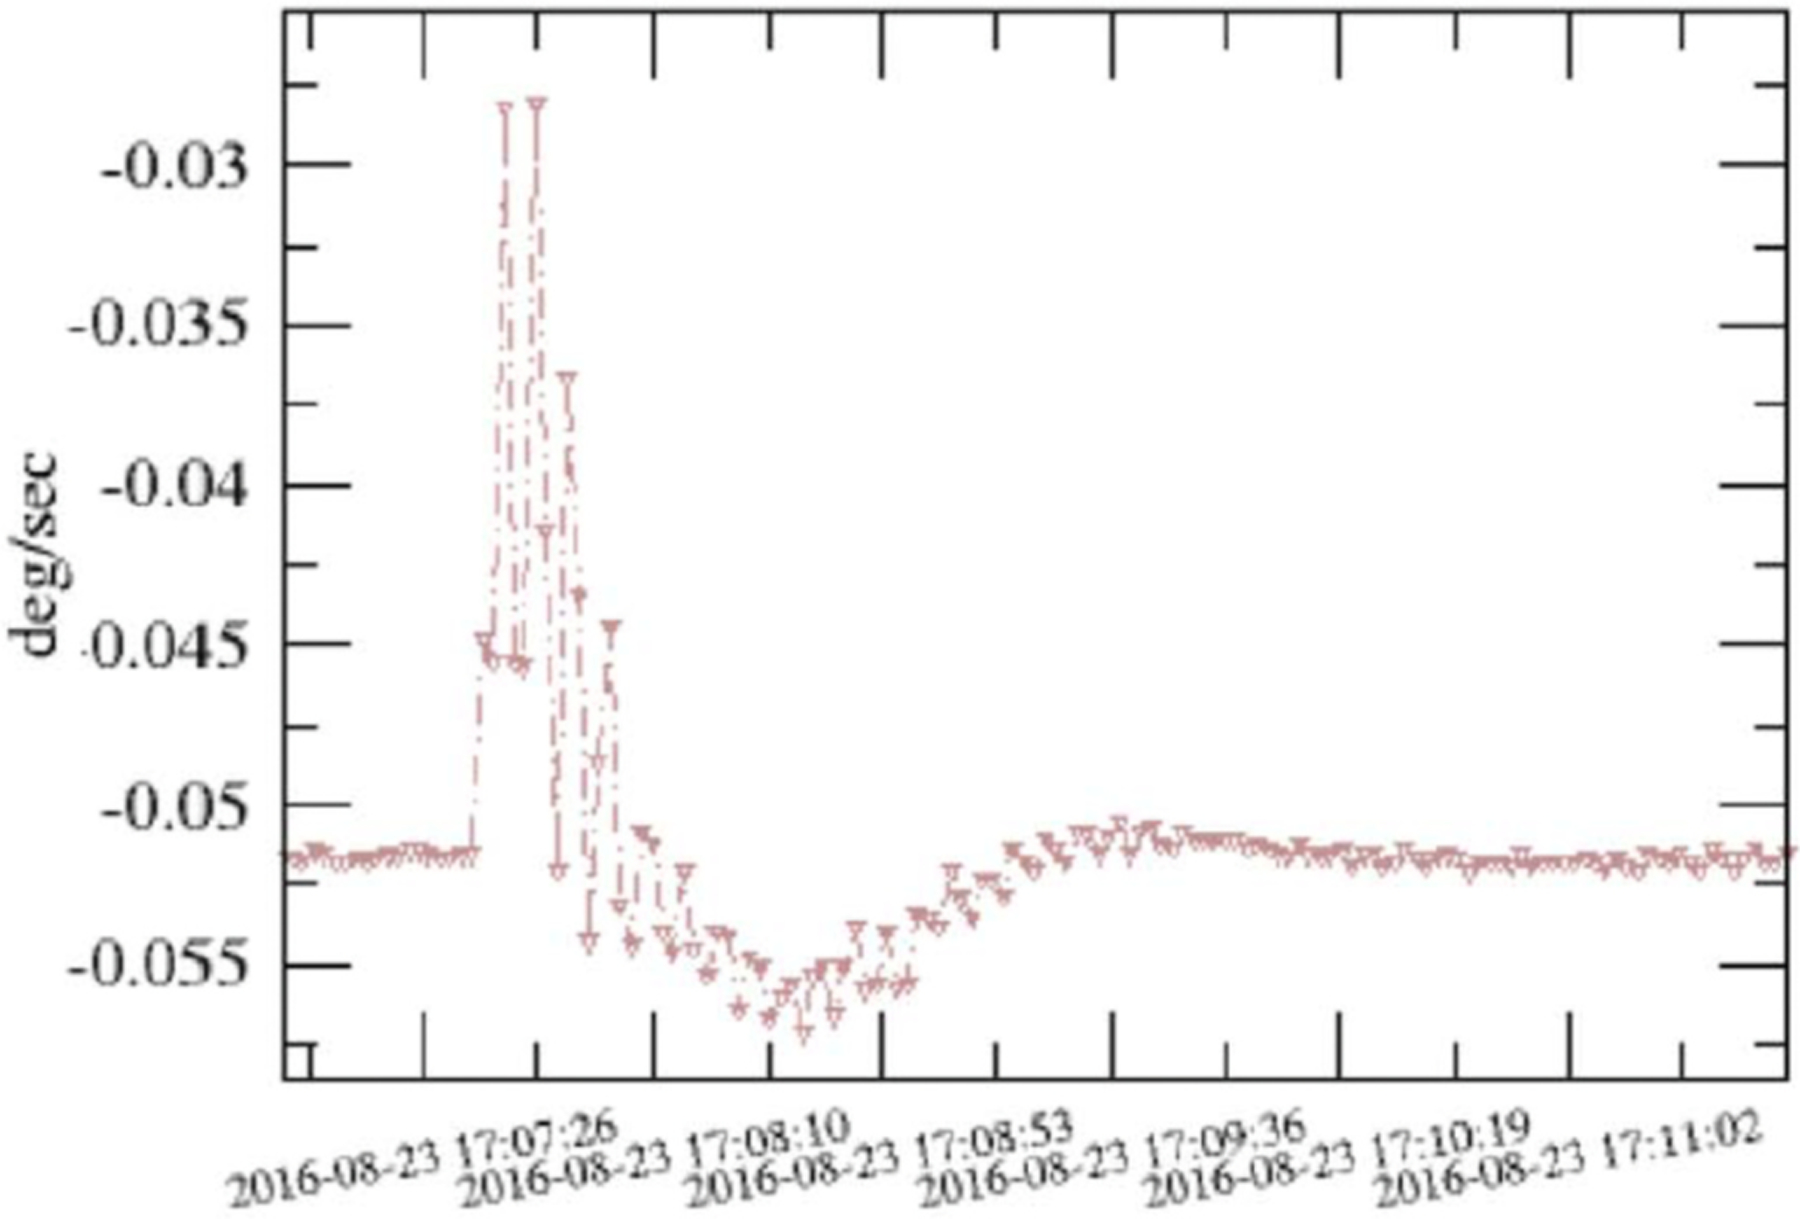
Rate gyro measurements from Sentinel-1A anomaly show an abrupt spike in rate which is corrected by the attitude control system [10].
In aggregate, the above information indicates that there is a significant population of untracked debris which can impact a spacecraft with various effects, ranging from benign perturbations to mission-ending damage. There is reason for concern about the accuracy of debris risk assessment methods which is likely due to a variety of factors. Key contributions include uncertainties in correlating radar measurements to damage potential and a lack of data in many orbits. Additional measurements of hazardous non-trackable debris populations would help to reduce these uncertainties, especially if the measurements provide information relevant to characterizing the damage potential of the debris flux. This paper investigates a robust and effective method to obtain in situ measurements of debris that is too small to track but still large enough to affect a spacecraft. It accomplishes this by applying digital signal processing (DSP) and change detection (CD) techniques to spacecraft attitude control system (ACS) telemetry to identify and assess subtle indications of debris strikes.
Most prior work on detecting particle strikes involves the assessment of a specific event or mission. Similar to the Sentinel-1A anomaly, a recent particle strike on NASA’s Magnetospheric Multiscale (MMS) constellation caused anomalous behavior but was fully recoverable [13]. The strike, which may have been debris or a micrometeoroid, was observed as a loss of one shunt resistor and a spike in the ambient plasma coupled with a dynamic event. On the spin-stabilized MMS spacecraft the dynamic event caused ringing in the accelerometer telemetry, excitation of boom vibration resulting in atypical nutation of the transverse rotation rates, and temporary loss of valid startracker attitude fix. In both the Sentinel-1A and the MMS events the strike caused anomalous (but recoverable) behavior which resulted in a thorough investigation of the telemetry. A smaller strike with more subtle indicators may go unnoticed.
There have been several papers on the results of sample return missions [14,15] or on custom hardware which is flown specifically to detect debris [16–18]. There are several studies which use data from non-purpose-built hardware to detect dust impacts on spacecraft via the induced plasma cloud [19–21], but the majority of dust impacts have masses around 10−9 g or less [22] so the ability of this population to harm spacecraft is limited. This paper investigates strikes large enough to perturb the spacecraft dynamics, since the hazard is from debris pieces large enough to cause damage if impacting sensitive components.
Some key work has been done by ExoAnalytic Solutions on detecting ‘momentum impulse transfer events’ on GEO spacecraft using their global telescope network. They have proven a capability to detect orbit perturbations with in-track velocity changes of 0.2–10 mm/s [23]. Some of these are explained with rigorous high-fidelity modeling of solar radiation pressure, but others remain unexplained and could be caused by on-board systems or, potentially, debris impacts.
A similar concept is discussed in the 2017 NESC report evaluating risk predictions with on-orbit assets [9]. This report compares the predicted vs. reported failures for ISS radiators and pressurized modules and for three LEO satellite systems. For one LEO constellation, seven events had been observed where satellites experienced sudden unexpected movements thought to be caused by debris. These movements consisted of abrupt changes in satellite mean altitude and/or rotation rates. A recommendation of the NESC report is to collect data on satellite orbital perturbations and momentum changes. This paper develops algorithms to accomplish that using DSP/CD techniques to enhance the ability to identify subtle strikes in telemetry.
A June 2019 paper by the Institute for Defense Analyses (IDA) [24] describes the methods used in the NESC report to correlate observed orbit perturbations to debris impact events and discusses a framework for reporting these events. A database of perturbation events is suggested as a tool to improve the characterization of the debris environment and therefore the debris risk assessment process. The paper emphasizes the need for additional orbital debris environment data, particularly mm-size debris at higher LEO altitudes, for use in improving orbital debris environmental models.
The concept of the IDA paper is similar to this work and the methods are highly complementary. While the IDA paper focuses on orbit perturbations and reporting frameworks, this paper focuses on detecting attitude perturbations via telemetry. Since the end goal is to capture sufficient data to improve understanding of the debris environment both methods have value. Both are capable of detecting strikes that the other method misses, and they can be used in tandem to validate subtle perturbations and improve estimation of strike parameters.
This research effort, which is also motivated by the NESC study, leverages established techniques from other fields to aid in characterizing the untrackable debris population. Algorithms are developed to monitor the attitude telemetry of spacecraft for subtle perturbations indicative of minor debris strikes. In approaching the problem from the reverse direction, identifying subtle strikes instead of responding to anomalous behaviors as they occur, it allows spacecraft operators and the debris community to proactively improve models and methods for assessing debris risks and attributing anomalies. Monitoring perturbation events offers a unique optic for characterizing the small debris environment since the measurement depends explicitly on the mass of the particle which is more closely correlated to the damage potential than the size measurements obtained via traditional radar and optical systems.
A spacecraft dynamics simulation is used to model the effect of debris strikes on ACS telemetry. The numerical simulation models a 3-axis controlled rigid-body spacecraft with four reaction wheels maintaining pointing along a reference trajectory (Section 2.1). Debris strikes are applied to the simulation per Section 3.1, while noise obfuscates the spacecraft’s response to the strikes. Section 3.2 investigates the ability of matched filters to identify the ‘signals’ produced in spacecraft state telemetry during a debris strike. This includes developing thresholds for detection (Section 3.2.2), developing methods to estimate strike parameters (Section 3.2.3), and using a Monte-Carlo analysis to assess algorithm performance (Section 3.2.4). Section 3.3 applies CD techniques to the momentum telemetry, which exhibits lasting changes when a debris strike produces a change in the spacecraft’s inertial angular momentum.
This paper’s core development is applying processing algorithms to simulated telemetry to compare the performance of various algorithms against known perturbations allowing a definitive assessment of each algorithm’s accuracy. A key element of maturing these techniques is applying them to on-orbit telemetry, and some preliminary results on NASA spacecraft are discussed in Ref. [25]. Another factor is investigating how the effectiveness changes based on changes in the spacecraft parameters and telemetry noise parameters, and an initial study of these trades is presented in Ref. [26]. Other approaches, such as machine learning, may also offer promising solutions; but machine learning tends to be more of a ‘black box’ approach and often struggles to develop adequate verification and validation methods for space applications. The algorithms selected for this paper are chosen based on a survey of canonical digital signal processing (DSP) and change detection (CD) techniques. These canonical techniques are chosen because this research effort is intended to develop a robust, well-understood, and well-characterized method for an initial study in applying this concept.
2. Methods for simulation and telemetry processing
2.1. Spacecraft simulation
A numerical spacecraft dynamics simulation is used to investigate a spacecraft’s response to debris strikes. The simulated spacecraft is configured as a rigid-body 3-axis controlled inertially-pointing GEO satellite with four reaction wheels (RWs). The state vector consists of the spacecraft’s attitude and rate along with the rotation speeds of the four reaction wheels. A Runge-Kutta fourth-order integrator is used to integrate the equations of motion given in Equations (1)–(3) [27, ch.8]. Note that Equations (2) and (3) must be solved simultaneously.
| (1) |
| (2) |
| (3) |
The spacecraft’s rotation rate, ω, is the rate of the body frame relative to an inertial frame, and is expressed in body frame coordinates. The attitude quaternion of the body relative to inertial is q, and Ω is an N× 1 matrix of wheel speeds for N reaction wheels. The external torque applied by the debris strike is Lext while is the unit vector of the spin axis of the ith reaction wheel. The transverse directions are and , and the [Gs] matrix is defined as . The spacecraft inertia (with reaction wheels included) is given as [Isc], and the spin-axis inertia of each reaction wheel is Iws. An identity matrix is denoted as [IN×N], and the applied control torques for each reaction wheel are specified in us. These control torques are calculated as shown in Equation (4) to apply a desired torque, Ldes, which is calculated per Equation (5).
| (4) |
Note that the Modified Rodrigues Parameters (MRPs) [28–30], denoted as σ, are used as the attitude coordinate for the control law and represent the attitude error between the current body frame and the desired reference frame. Similarly, δω represents the difference between ω and the desired reference angular velocity, ωr [27].
| (5) |
The proportional control gain on attitude error is denoted as K, and [P] must be a positive definite matrix to guarantee stability via Lyapunov functions.
State noise is added to the system at each timestep in a Gaussian random walk. Gaussian measurement noise is added to ω and σ when calculating the control torques and is also added to the torque command. The state is saved throughout the simulation and then truncated to a lower rate to represent downlinked telemetry. Gaussian measurement noise is added to this telemetry prior to processing. Table 1 contains the parameters used in this simulation. All noise is zero mean.
Table 1.
Parameters used in spacecraft dynamics simulation.
| Parameter | Value | Unit |
|---|---|---|
| S/C Inertia xx | 3000 | kg.m2 |
| S/C Inertia yy | 2500 | kg.m2 |
| S/C Inertia zz | 3500 | kg.m2 |
| RW Inertia | 0.16 | kg.m2 |
| RW max torque | 0.2 | N.m |
| RW 1 pointing vector | [1, 0, 0] | – |
| RW 2 pointing vector | [0, 1, 0] | – |
| RW 3 pointing vector | [0, 0, 1] | – |
| RW 4 pointing vector | [1, 1, 1] | – |
| State noise in attitude | σ = 1E-8 | – |
| State noise in rate | σ = 1E-8 | rad/s |
| Meas. noise in attitude sim | σ = 1E-6 | – |
| Meas. noise in rate sim | σ = 1E-6 | rad/s |
| Noise in applied torque | σ = 0.001 | N.m |
| Meas. noise in attitude tlm. | σ = 7E-5 | – |
| Meas. noise in rate tlm. | σ = 2E-4 | rad/s |
| Meas. noise in RW speed tlm. | σ = 0.25 | rad/s |
The spacecraft’s inertial angular momentum is calculated from the noisy state telemetry via
| (6) |
| (7) |
where BH is the spacecraft angular momentum in the body-fixed frame, [BW]i is the direction cosine matrix to go from the ith wheel’s coordinate frame to the body frame, [NB] is the direction cosine matrix to go from the body frame to the inertial frame, and NH is the spacecraft’s inertial angular momentum. Note that the momentum telemetry does not have any noise added to it, but it incorporates the noise from the attitude telemetry, rate telemetry, and wheel speed telemetry.
2.2. Digital signal processing techniques
Matched filters are used on the rate and attitude telemetry to identify debris strikes, since the spacecraft’s dynamic response to the strike produces a known ‘signal’ in the telemetry. A matched filter will maximize the output signal-to-noise ratio (SNR) for a known signal in independent and identically distributed Gaussian noise.
A matched filter functions by taking a known wavelet (the anticipated signal) and cross-correlating it with a sequence of measurements [31, ch.5]. The filter output will increase when the signal is present in the noise, as shown in Fig. 5.
To determine the threshold for detecting a debris strike based on filter output, a receiver operating characteristic (ROC) curve is developed empirically and a desired probability of false alarm, α, is selected. The ROC curve shows the probability of false alarm (PFA) vs. the probability of detection (PD), which is based on two probability density functions (pdfs) (Fig. 2). The first pdf characterizes the filter output when no debris strike is present (i.e., the null hypothesis, ). The second pdf characterizes the filter’s peak when a certain debris strike is present .
Fig. 2.

Probability density functions of filter output with no strikes present and during a small strike.
Note that in order to decrease the PFA the threshold is moved to the right, but that necessarily decreases the PD for that strike and increases the probability of a missed detection, PMD. Thus, selection of a desired PFA is a design choice for a given application. A low PFA will detect significant perturbations with little risk of false alarms, but will miss small but detectable perturbations. A higher PFA will produce more false alarms but will also catch the small, subtle perturbations. Also note that while Gaussian pdfs are shown in the figure they will only generate accurate thresholds if the data is Gaussian. Therefore, the distribution of the data should always be checked and appropriate pdfs selected before applying this method.
From the PFA and PD the ROC curves in Fig. 3(a) are developed. A desired PFA is selected, and the slope of the ROC curve at the point where PFA = α is the threshold for the likelihood ratio test, τthresh. The likelihood ratio test, , is also based on the two pdfs of the filter output where
| (8) |
where is the probability of y given hypothesis . The resulting is compared to the threshold τthresh from the ROC curve and the appropriate hypothesis is selected. This threshold is mapped back to the filter output by finding the point at which τthresh intersects the line and choosing the corresponding ythresh as the filter output threshold (Fig. 3(b)).
| (9) |
Fig. 3.
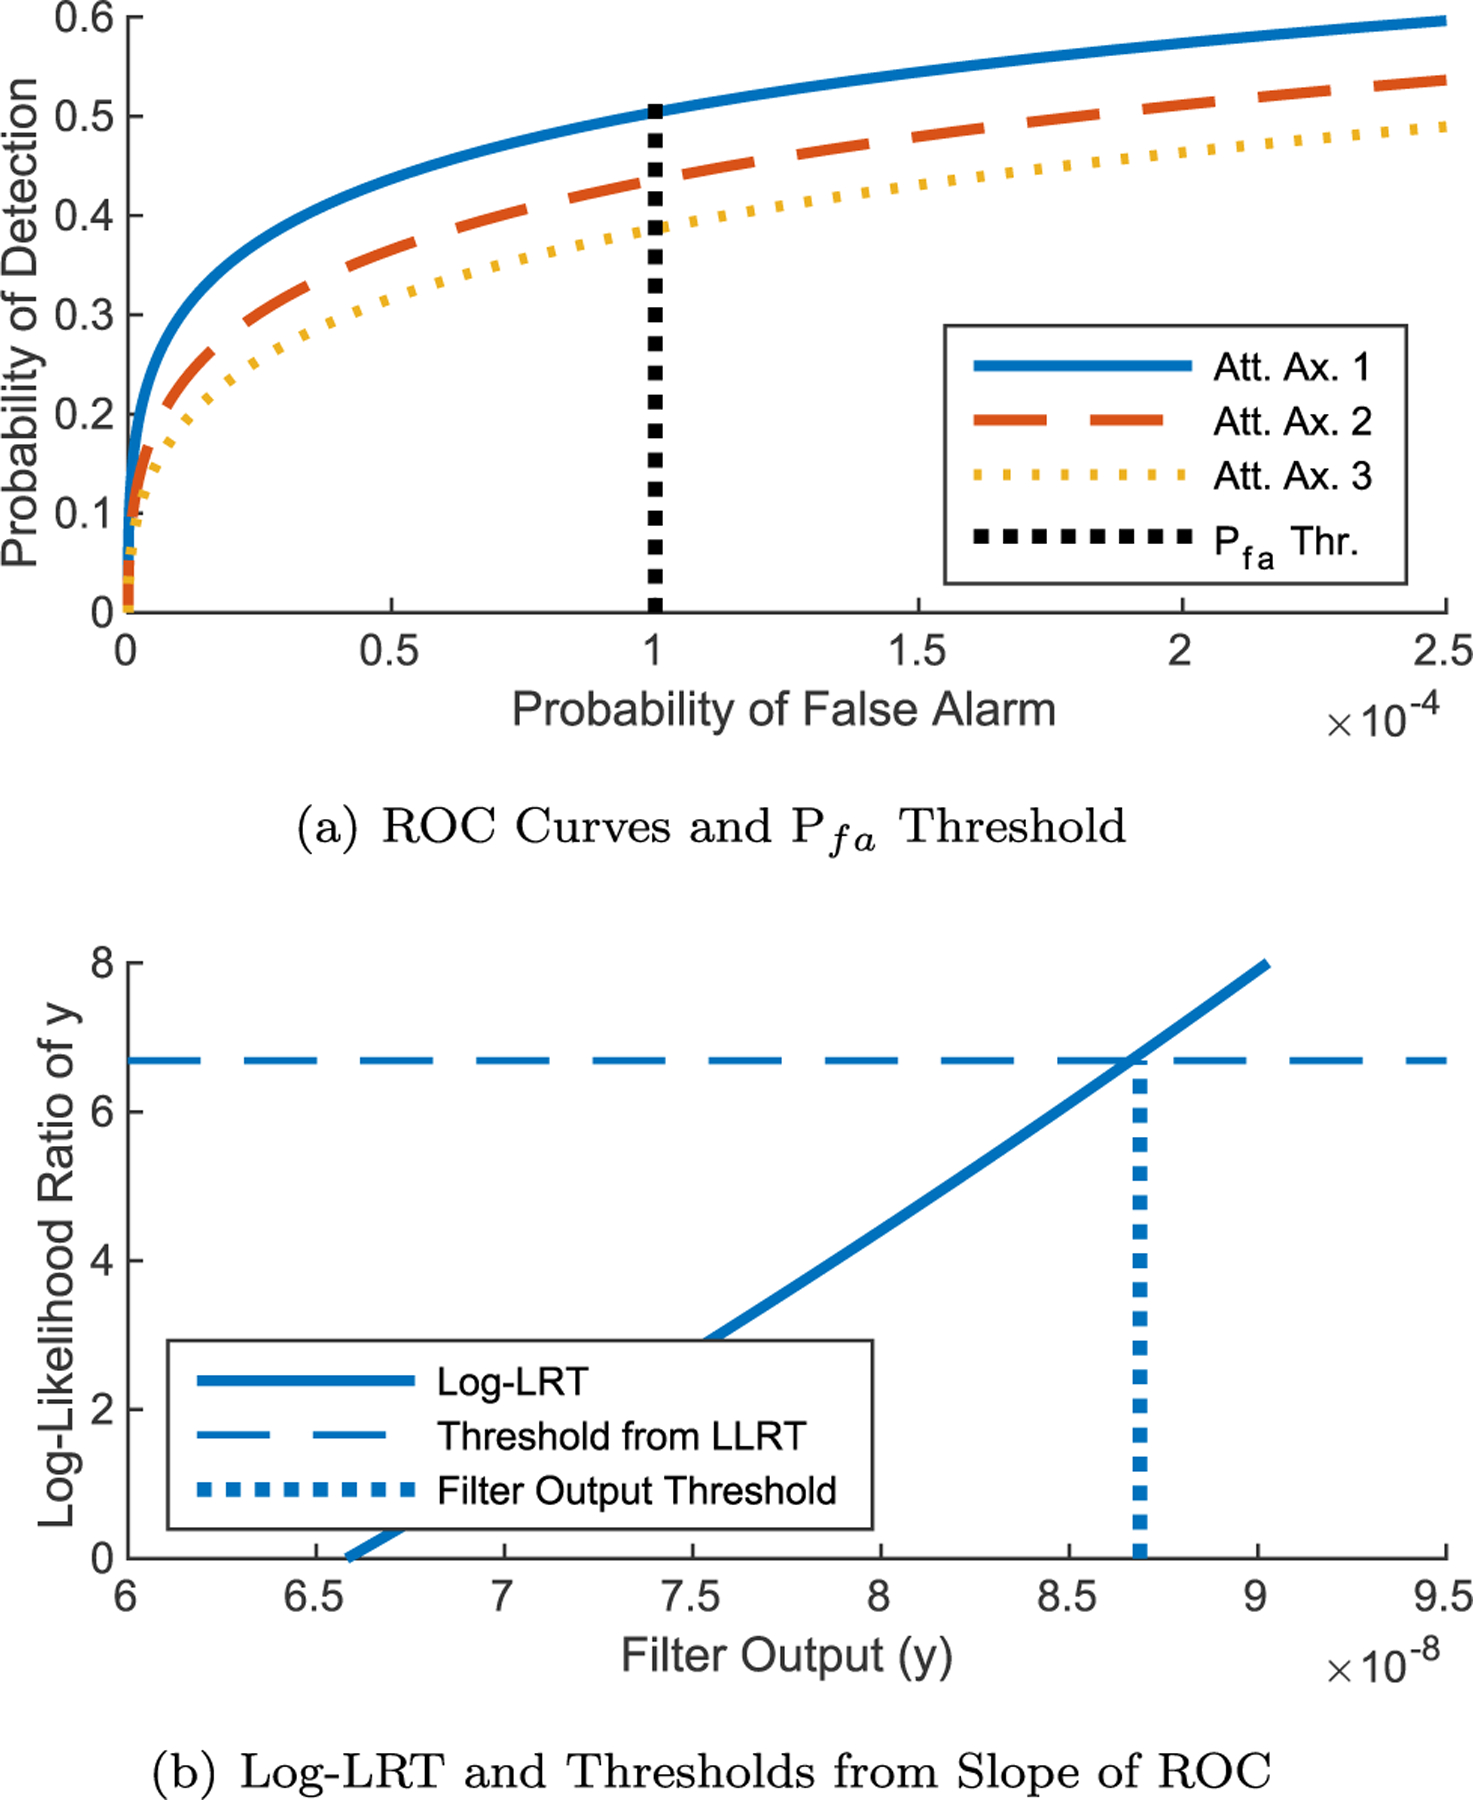
Development of filter thresholds via ROC curve and LRT.
Note that the log of the likelihood ratio test (LLRT) is plotted along with the log of the threshold since the numbers become large. Under the Neyman-Pearson Lemma, this is the most powerful test that maximizes PD under the constraint PFA = α[32, ch.2]. For the purposes of debris strike detection the filter output is compared to the threshold ythresh. If the filter output is above this threshold then a strike is declared and the strike parameters are estimated.
2.3. Change detection techniques
The inertial angular momentum of a spacecraft is quiescent in the absence of external forces, but a debris strike imparts an abrupt change in the momentum. Three techniques for detecting changes in quiescent but noisy data are applied to the spacecraft momentum: a simple summation filter, a more refined cumulative sum (CUSUM) sequential probability ratio test (SPRT), and a Shiryaev SPRT.
The simple summation filter detects changes by adding the sum of all datapoints after zeroing the data to the expected average. For zero-mean noise, this sum trends to zero over time so that a value above a certain threshold indicates that a fault (or change) has occurred.
The CUSUM algorithm utilizes the log of the likelihood ratio test from equation (8), summed sequentially to give the test statistic Sn [31, ch.9].
| (10) |
The parameter Sn trends negative when the samples, as a whole, are more likely to be from than , and trends positive when they are more likely from . This change in drift is detected through
| (11) |
where Wn stays close to zero while Sn trends downward, then grows if it trends upward.
The multi-hypothesis Shiryaev SPRT is implemented for m alternative hypotheses per Malladi and Speyer [33]. They define
| (12) |
where Fki is the cumulative distribution function (CDF) expressing the probability that, at datapoint k, hypothesis i is true. is the a priori probability that a transition to hypothesis i occurs. Fk+1,i is computed recursively given each new datapoint xk+1 via equation (13), where fi(xk+1) is the pdf given hypothesis i evaluated at xk+1
| (13) |
The CDFs are initialized to Foi, which is the probability that a transition to hypothesis i has already occurred.
3. Algorithm development
3.1. Applying debris strike to simulation
The debris strike is applied to the spacecraft attitude dynamics simulation as a brief torque L, computed as follows. The net change in momentum imparted by the debris strike is denoted as Hstrike where Rd/s is the location of the strike relative to the spacecraft center of mass, md is the mass of the debris, and Vd/s is the velocity of the debris relative to the spacecraft.
| (14) |
| (15) |
The torque, L, is applied in the simulation for one time step, and the torque magnitude in each axis is calculated such that the total change in momentum, Hstrike, is as specified in the problem setup. For convenience, the traded debris strike variables are the direction of Hstrike and the mass of the debris. The velocity of the debris is fixed at 8 km/s normal to Rd/s, which is 1 m. The mass of the debris is traded to investigate different magnitudes of debris strike, and is generally between 1 and 100 mg. Note that the 8 km/s and 1 m are placeholders, not assumptions. The rotational momentum of a strike at 8 km/s and 1 m is equivalent to a strike at 4 km/s and 2 m, or 1 km/s and 8 m, etc. These placeholders are simply convenient to provide some intuition about the sizes of debris strikes that are being discussed, not an assumption on which the analysis depends.
In reality the velocity of debris would be dependent on the debris (or micrometeoroid) population it originates from, and the strike could be anywhere on the spacecraft. The variables are fixed for simplicity and clarity since this paper focuses on modeling the effect on the spacecraft and developing detection methodologies, not on modeling the debris population. Table 2 lists a variety of impacting particles in various orbit regimes which would impart angular momentum equivalent to a 10 mg particle striking 1 m off the center of mass (CoM) at 8 km/s with normal incidence, imparting 80 mN.m.s of angular momentum to the satellite.
Table 2.
Particle impact events which impart 80 mN.m.s of angular momentum (assuming normal incidence).
| Object | Density | Size |
|---|---|---|
| Case #1: 100 mg particle impacting 2 m from CoM at 400 m/s, MEF = 1 (i.e, GEO) | ||
| MLI squarea | 0.04269 g/cm2 | 1.53 cm |
| CFRP squareb | 1.8 g/cm3 | 0.75 cm |
| Mylar squarec | 0.0032 g/cm2 | 5.59 cm |
| Case #2: 3.64 mg particle impacting 1 m from CoM at 11 km/s, MEF = 2d(i.e, LEO) | ||
| Al. sphere | 2.7 g/cm3 | 1.37 mm dia. |
| Steel sphere | 8.05 g/cm3 | 0.95 mm dia. |
| Copper wiree | 8.96 g/cm3 | 1.29 cm |
| CFRP squareb | 1.8 g/cm3 | 1.42 mm |
| Mylar squarec | 0.0032 g/cm2 | 1.07 cm |
Square of multi-layer insulation, areal density of standard JPL blanket per reference [34].
Square of carbon fiber reinforced polymer, 1 mm thick, density per [35].
Double aluminized perforated Mylar, single outer blanket layer per [34].
MEF based on findings in reference [36].
Length of copper wire 0.2 mm diameter.
It is important to note that a strike which breaks through a solar array will impart less momentum than the total relative momentum of the debris, while a hypervelocity strike which breaks up on the surface will cause a plume of ejecta in the reverse direction which can increase the imparted momentum by a factor of two or more [36]. This phenomenon is referred to as the momentum enhancement factor (MEF) and is included in Table 2, but is assumed to be one throughout the developments in this paper. While this effect is critical for accurately assessing impact events, the emphasis in this paper is on developing detection techniques, not debris population modeling. When these techniques are applied to on-orbit telemetry and used to estimate parameters in real debris strikes these effects must be accounted for.
When a debris strike is applied to a truth simulation with no noise, the results are as shown in Fig. 4. The strike induces a rotation in the spacecraft which is corrected by the attitude control system. It manifests as a spike in the spacecraft rate, a drift and correction in the spacecraft attitude, and a net increase spacecraft momentum.
Fig. 4.
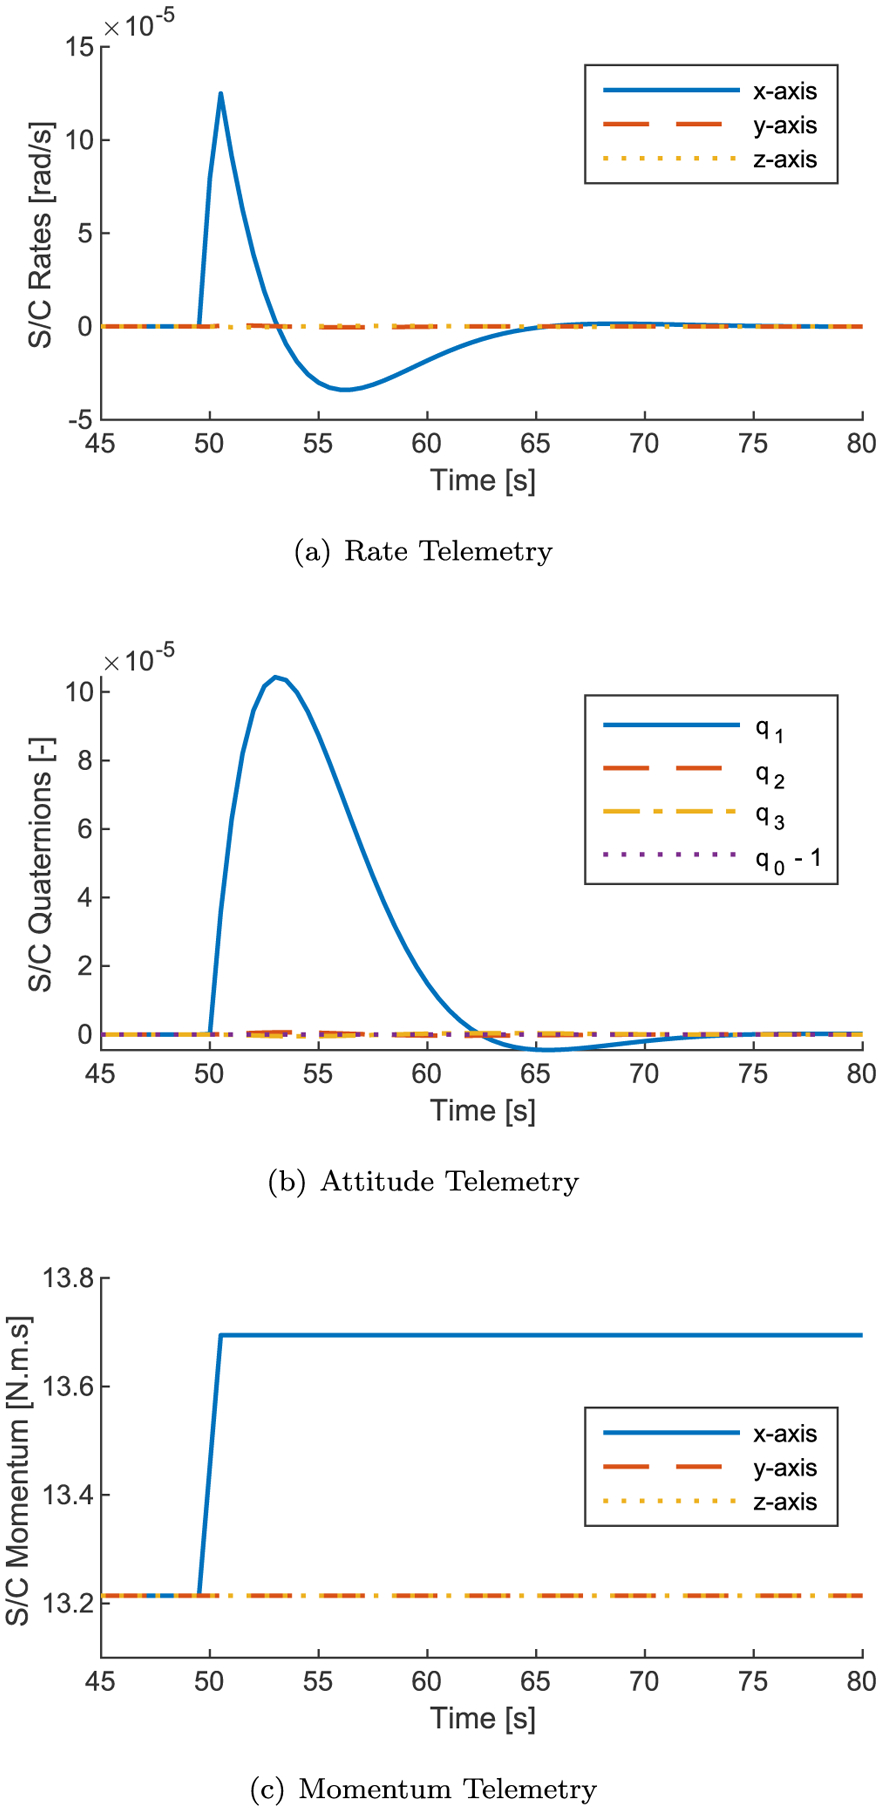
Response of spacecraft to simulated debris strike (60 mg at 8 km/s, 1 m from CoG, applied at t = 50 s Hstrike = 0.48 N m s). Note similarity between rate telemetry and Sentinel-1A telemetry (Fig. 1).
3.2. Matched filter development
3.2.1. Develop filters to identify strikes
The truth simulation is used to develop matched filters for the spacecraft rate and attitude. To obtain the strike detection wavelet the simulation is run with the largest debris strike that does not saturate the RW torque capability. Since the frequency of the spacecraft’s response is the same when correcting any strike too small to saturate the RWs, this largest wavelet envelopes the response of the spacecraft to smaller strikes. A filter with this wavelet produces a comparable SNR to a wavelet that matches the size of the strike, and thus only one detection wavelet needs to be run on each axis. A strike which saturates the wheel torques is detectable without a closely matched wavelet due to its large magnitude. Fig. 5 shows the wavelet developed for the spacecraft rate applied to noisy telemetry, with the filter output showing a spike at the corresponding time.
Fig. 5.
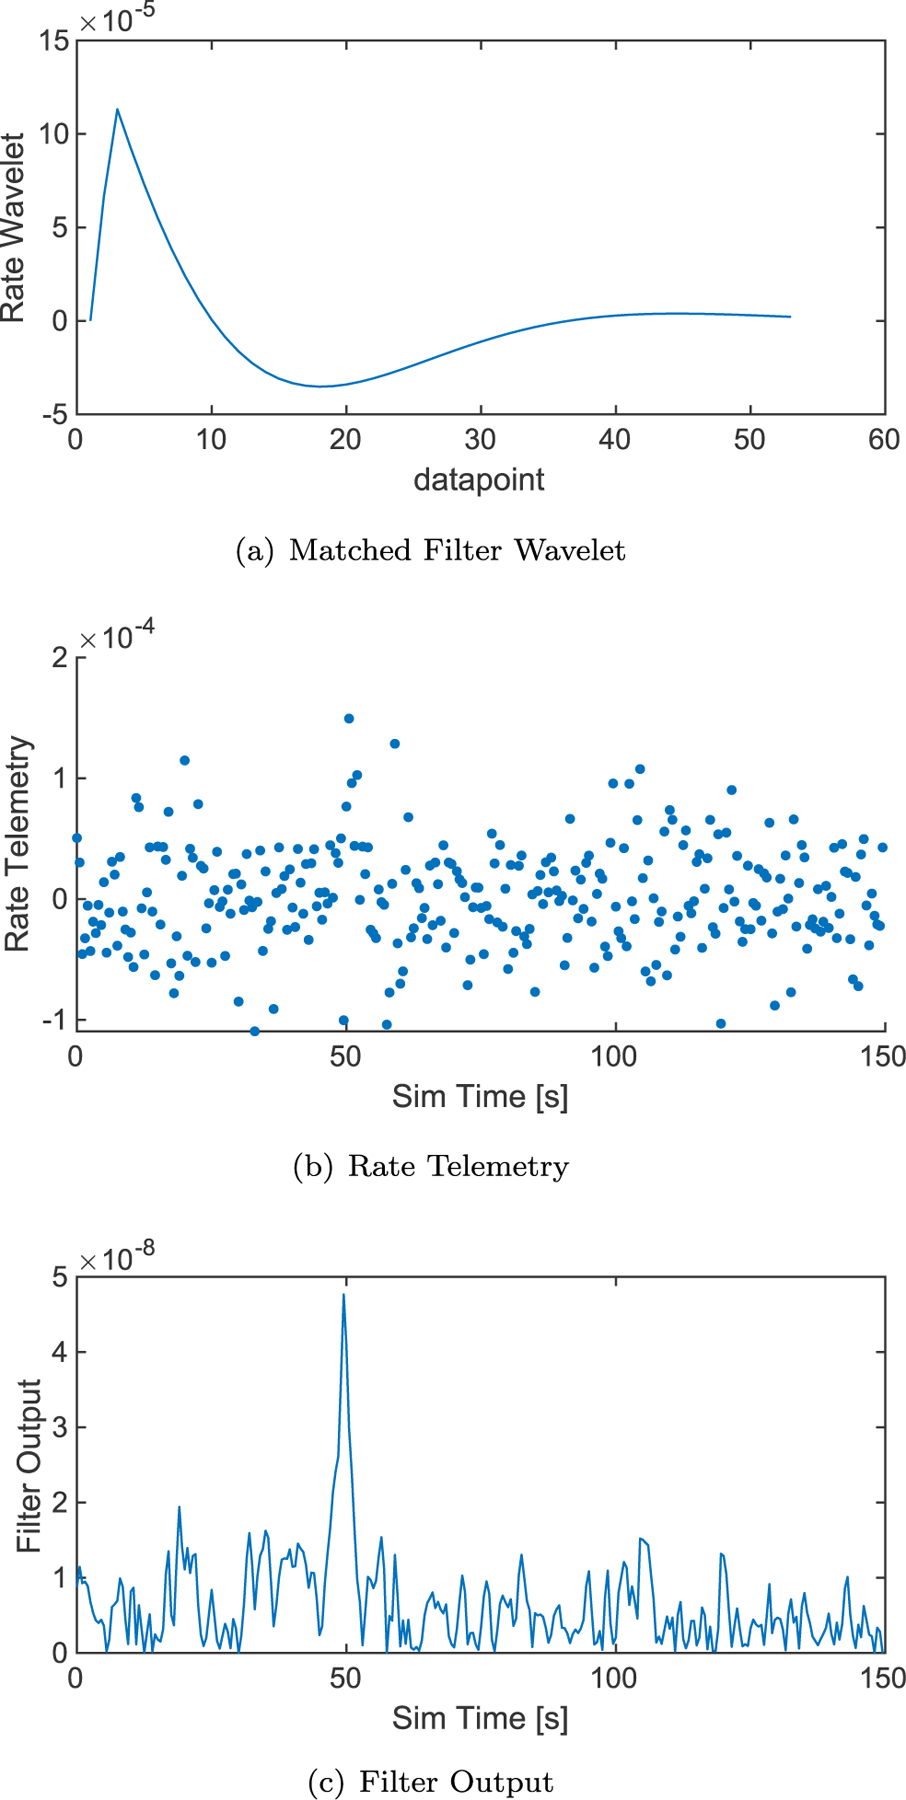
Example of matched filter accentuating a 50 mg debris strike applied at t = 50 s. Note that when the strike is applied the telemetry increases slightly for a few points then decreases slightly, but it is difficult to see in the raw telemetry as it is beneath the noise floor. However, the filter produces a distinct spike in response.
To develop wavelets for a real spacecraft, the developmental spacecraft dynamics simulation can be used to determine initial wavelets. Once the satellite is in orbit, the spacecraft’s response to other momentum-changing events can be used to tune the wavelets. For example, a spacecraft’s response to a slight angular momentum imparted during a small maneuver has similar characteristics to the response to a debris strike. Fig. 6 shows some telemetry from NASA’s Solar Dynamics Observatory (SDO) recovering its attitude after a maneuver.
Fig. 6.
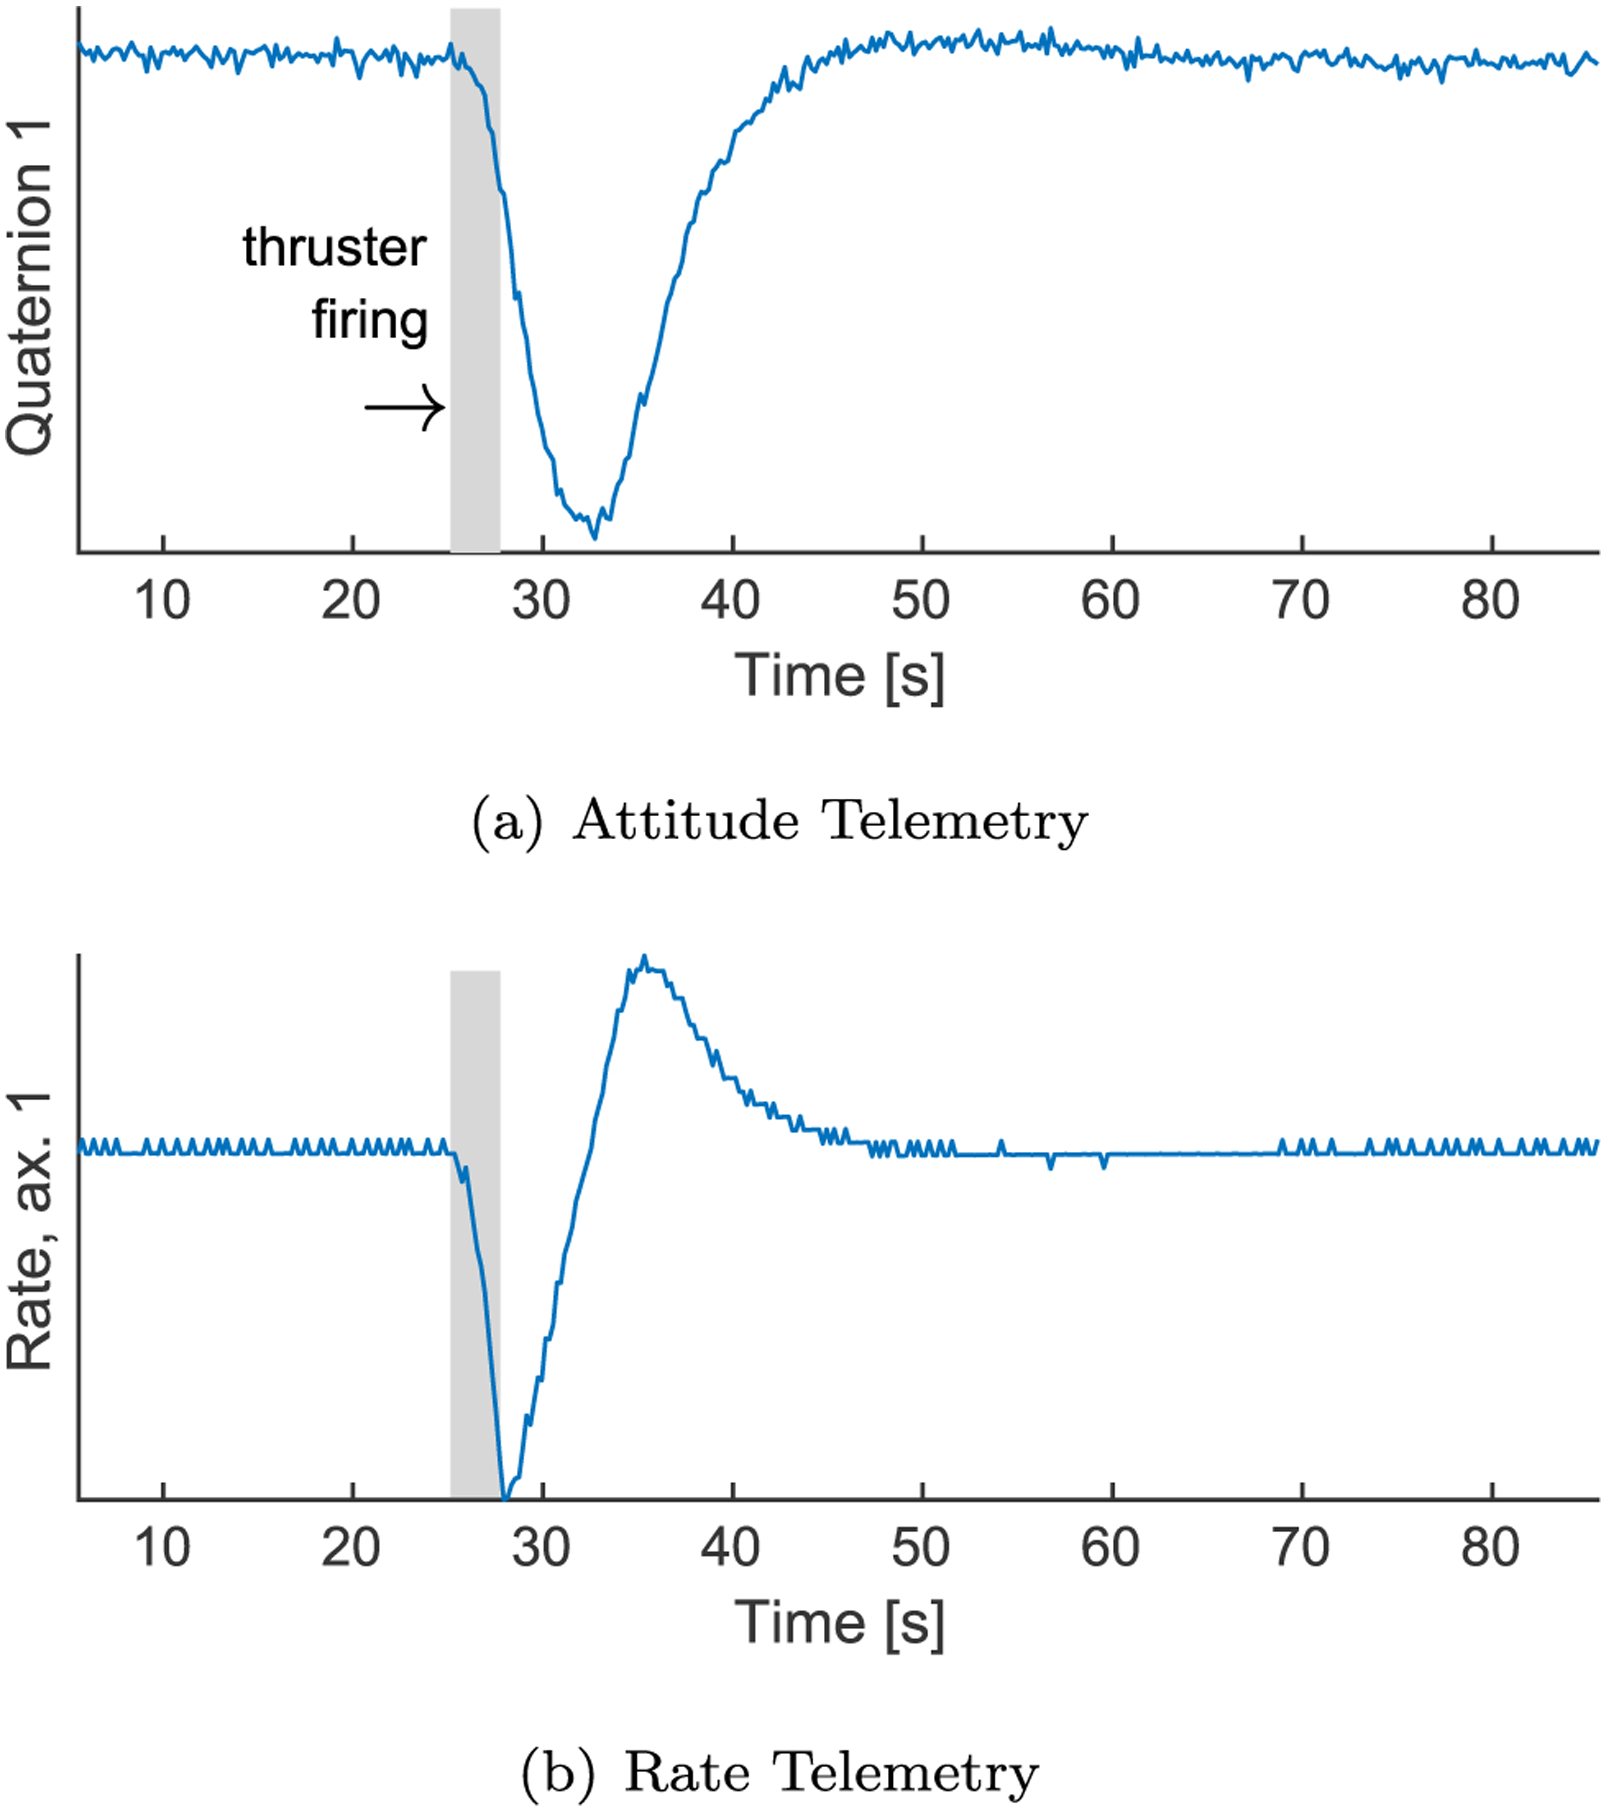
Example of spacecraft correction after a small maneuver imparts a slight rotation. Note similarities to simulated debris strike response.
Note that the attitude wavelets are only run on the vector components of the error quaternion, since the scalar component will always be close to one for small errors. Under the small angle approximation, the scalar component will remain near one but the vector components will vary linearly with , where φ is the angle of the error in each axis.
3.2.2. Developing filter thresholds
The filter thresholds are developed using a Receiver Operating Characteristic (ROC) curve. To develop this curve, pdfs of the filter output are developed empirically. The first pdf is the filter output with no strikes present, to characterize the noise in the filter. Then a specified strike is applied to the simulation 1000 times and the filter response to each strike is logged and used to generate a pdf of filter response to that strike. The strike size is selected such that the center of the bell curve is in the vicinity of the desired threshold on the no-strike pdf. To achieve this, 30 mg strikes are applied to generate the filter response for attitude thresholds, and 40 mg strikes are applied to generate the filter response for rate thresholds. From the two pdfs the ROC curves are generated, and the slope of the ROC curve at PFA = 0.01% corresponds to the threshold for the likelihood ratio test [32]. The likelihood ratio test is applied to possible filter outputs and the filter output at which the likelihood ratio test exceeds the threshold from the ROC curve is selected as the filter output threshold for strike detection. See Fig. 3 for a graphical representation of this process.
3.2.3. Determining strike parameters
Once a debris strike is detected using the matched filter output and associated threshold, the task is to assess the magnitude of the debris strike. This is accomplished using a bank of matched filter wavelets and determining which filter wavelet shows the closest match to the telemetry. Then the size of strike used to generate that wavelet is selected as the estimated strike size. Refer to Section 3.1 and Table 2 for a detailed discussion on the relationship between strike size as traded in this paper and debris strike parameters.
Four methods are compared to determine which wavelet is closest to the telemetry. The first method takes the root-sum-squared error (RSSE) between the telemetry and each wavelet then selects the wavelet where this is a minimum. The second takes the minimum mean-squared error (MMSE), the third the minimum absolute error (MAE), and the fourth the sum of the absolute value of the error cubed (‘Cubic’). The results show that the MMSE and RSSE have identical performance, which makes sense since the errors are penalized identically in both methods - as a function of the square of the error. The absolute error is penalized linearly while the fourth method penalizes the error cubed. Across 1000 Monte-Carlo runs with randomized debris strikes, the error in estimated strike magnitude for each method is shown in Table 3. Note that these errors are for accurately detected strikes only, Section 3.2.4 discusses the overall detection performance of the algorithm. Based on these results, the MMSE is selected as the estimation method for the remainder of this study. Fig. 7 shows a wavelet bank, simulated telemetry with the true state overlaid, and the results of each estimation method along with the true strike size.
Table 3.
Comparing error in estimated strike magnitude for each estimation method.
| Estimation Method | Mean Error | Standard Dev. |
|---|---|---|
| Using Attitude | ||
| MMSE | 1.4 mg | 8.7 mg |
| RSSE | 1.4 mg | 8.7 mg |
| MAE | 2.0 mg | 10.9 mg |
| Cubic | 1.5 mg | 9.1 mg |
| Using Rate | ||
| MMSE | −4.46 mg | 13.1 mg |
| RSSE | −4.46 mg | 13.1 mg |
| MAE | −2.95 mg | 14.3 mg |
| Cubic | −4.50 mg | 13.2 mg |
Fig. 7.
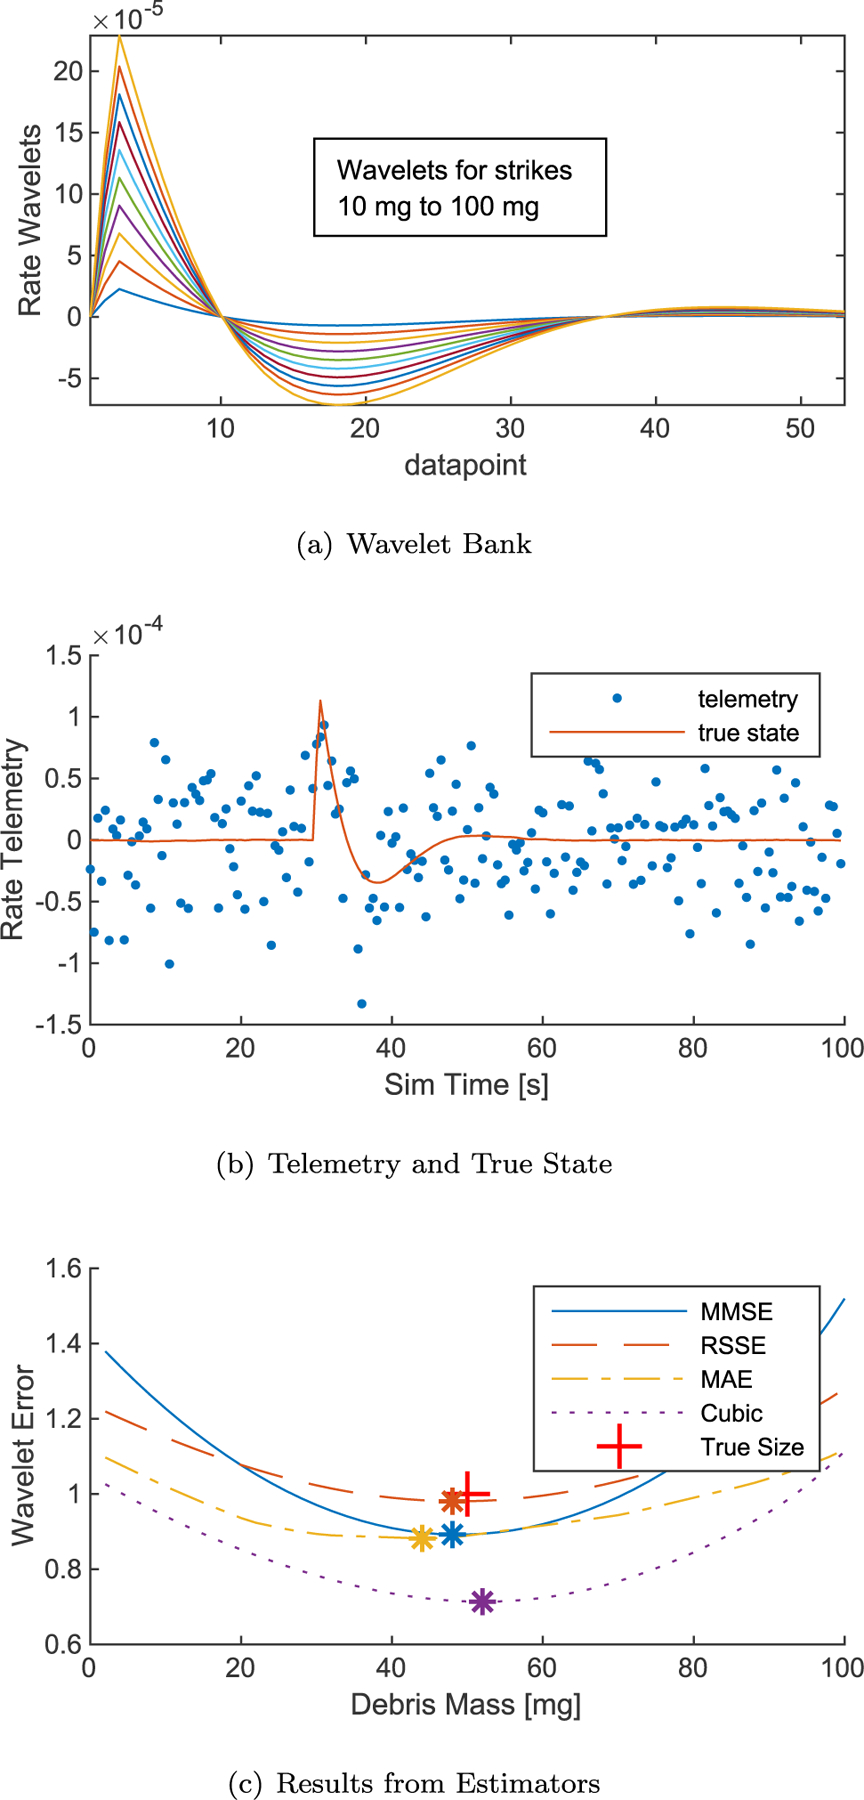
Wavelet bank and results from running filters against a 50 mg strike at t = 30 s. Minimum error is selected as most probable strike size (48 mg). Results from each estimator are compared.
3.2.4. Assessing algorithm performance
To assess the algorithm’s performance, a 1000 run Monte-Carlo is conducted randomizing the strike time, size, and direction. The enveloping matched filters from Section 3.2.1 are run against the telemetry to detect strikes per the thresholds developed in Section 3.2.2. When they detect a strike the wavelet bank is run at that time and the MMSE is computed. The closest-matching wavelet is selected as the strike’s estimated size, and that result is compared to the true size. The results, shown in Fig. 8, indicate that the attitude filter consistently detects strikes larger than 60 mg, while the rate filter consistently detects strikes larger than 80 mg. Both filters also detect smaller strikes, but the percentage detected decreases with smaller strikes. The estimated strike sizes cluster in the vicinity of the true strike sizes, but vary by around ± 20 mg. A fair number of outliers are under-predicted by more than that, especially via the rate telemetry.
Fig. 8.
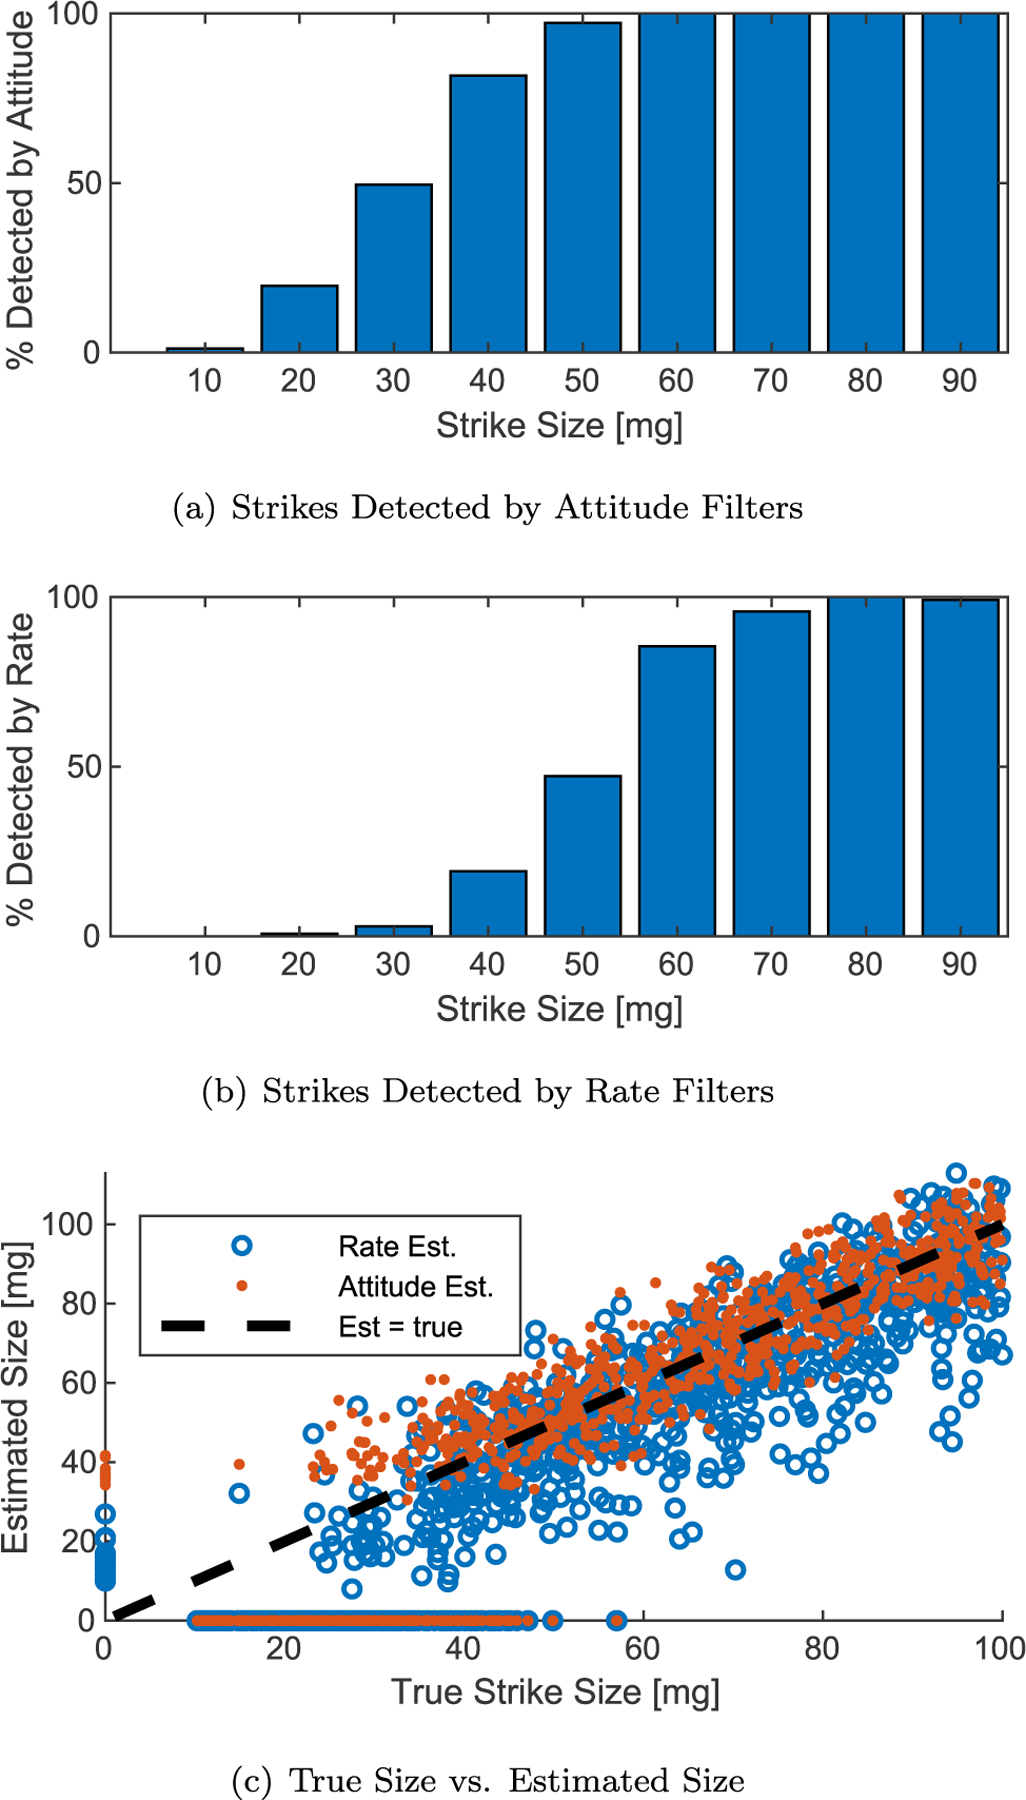
Detection results per attitude matched filter and rate matched filter, and plot of estimated vs. true size. Non-detected strikes and false alarms shown as zeros on each axis.
3.3. Sequential probability ratio tests (SPRTs)
Three SPRTs are implemented on the angular momentum telemetry, as the inertial angular momentum is theoretically quiescent in the absence of external torques while a debris strike produces an abrupt change in momentum. SPRTs compare the noisy output data to an expected probability distribution and the filter output increases when a prolonged deviation from the expected output occurs. Since the momentum changes gradually due to effects like solar radiation pressure the parameters of the expected distribution change over time. To apply SPRTs to the debris strike problem a sliding window filter is used. This sliding window incorporates a ‘pre-window’ which is used to compute the expected distribution parameters, providing a fading estimate of the most recent distribution parameters. In the ‘post-window’ the SPRT algorithms are applied to detect changes from the distribution characterized in the pre-window. This causes the filters to peak at the debris strike time, when all data in the pre-window is before the strike and all data in the post-window is after the strike.
The simple summation filter subtracts the average of the pre-window from the post-window data and then sums the zeroed post-window data. When the mean of the post-window is similar to the mean of the pre-window the filter output, ysum, is near zero. When a change occurred at the junction between the windows the filter output reaches a maximum. For m datapoints,
| (16) |
The CUSUM algorithm sums the likelihood ratio of each datapoint given the μ and σ calculated from the pre-window compared to two alternative hypotheses: a displacement of Δμ N.m.s in either the positive or negative direction. Then the test statistic Wn from Equation (11) is used as the filter output. This also produces a maximum at approximately the time of the strike.
The Shiryaev algorithm applies the recursive relation in Equation (13) to each data point for j alternative hypotheses, where each is a displacement of nΔμ N.m.s from the μ of the pre-window and n is a 1D array of integers from −10 to 10. The final CDFs (Fj,end) at the end of the post window are used as a weights to produce the following weighted sum as the estimated change in μ based on the entire post-window measurement sequence
| (17) |
Fig. 9 shows the inertial angular momentum telemetry with a small, subtle debris strike. The change in distribution is not readily apparent from the raw data, but the highlights in Fig. 9(b) show that the distribution underlying the noisy data has changed abruptly. This telemetry shows a 10 mg strike, and Figs. 10 and 12 show that the filters respond favorably even to subtle changes like this.
Fig. 9.
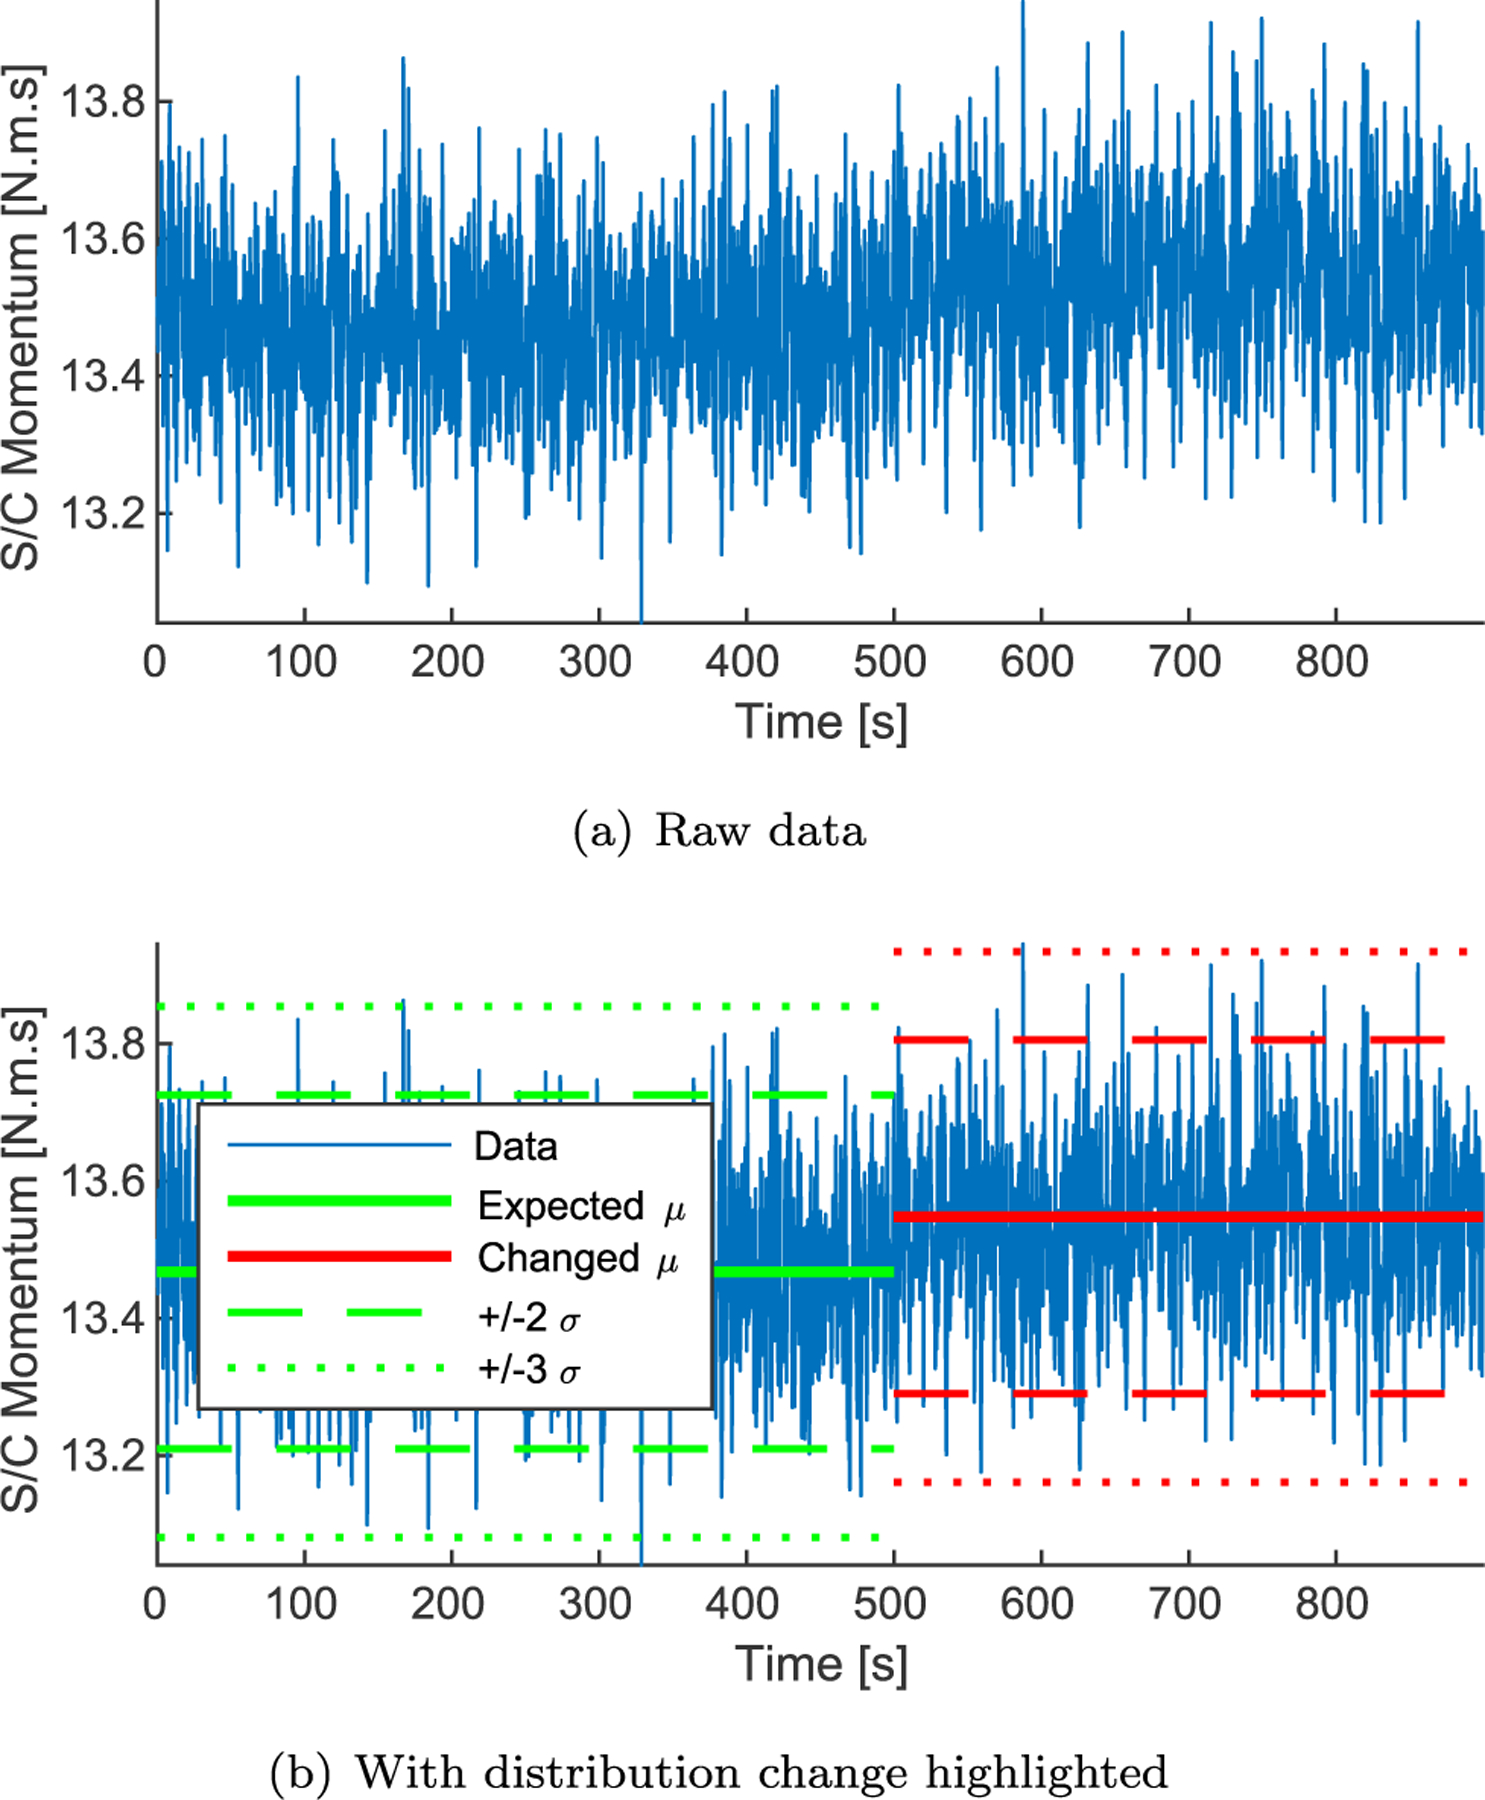
Raw momentum telemetry with 10 mg strike at t = 500 s.
Fig. 10.
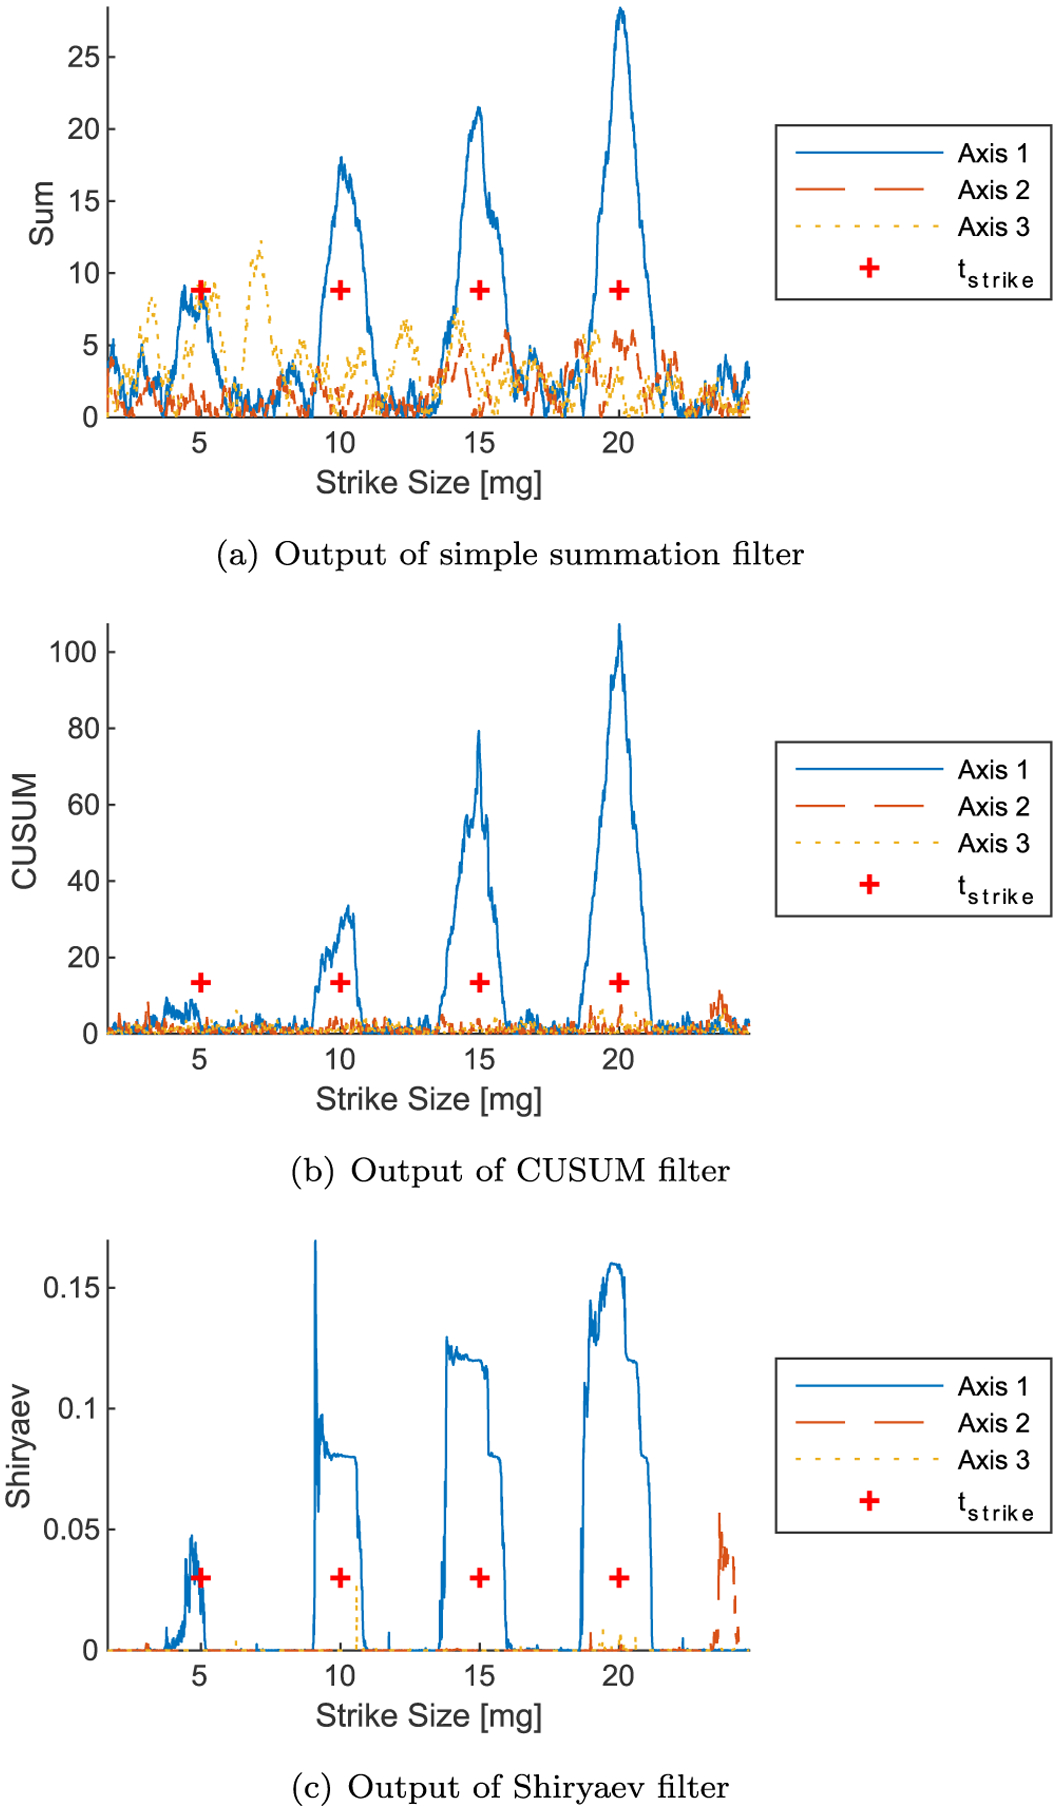
Output of SPRT filters with 5, 10, 15, and 20 mg strikes applied to the x-axis.
Fig. 12.
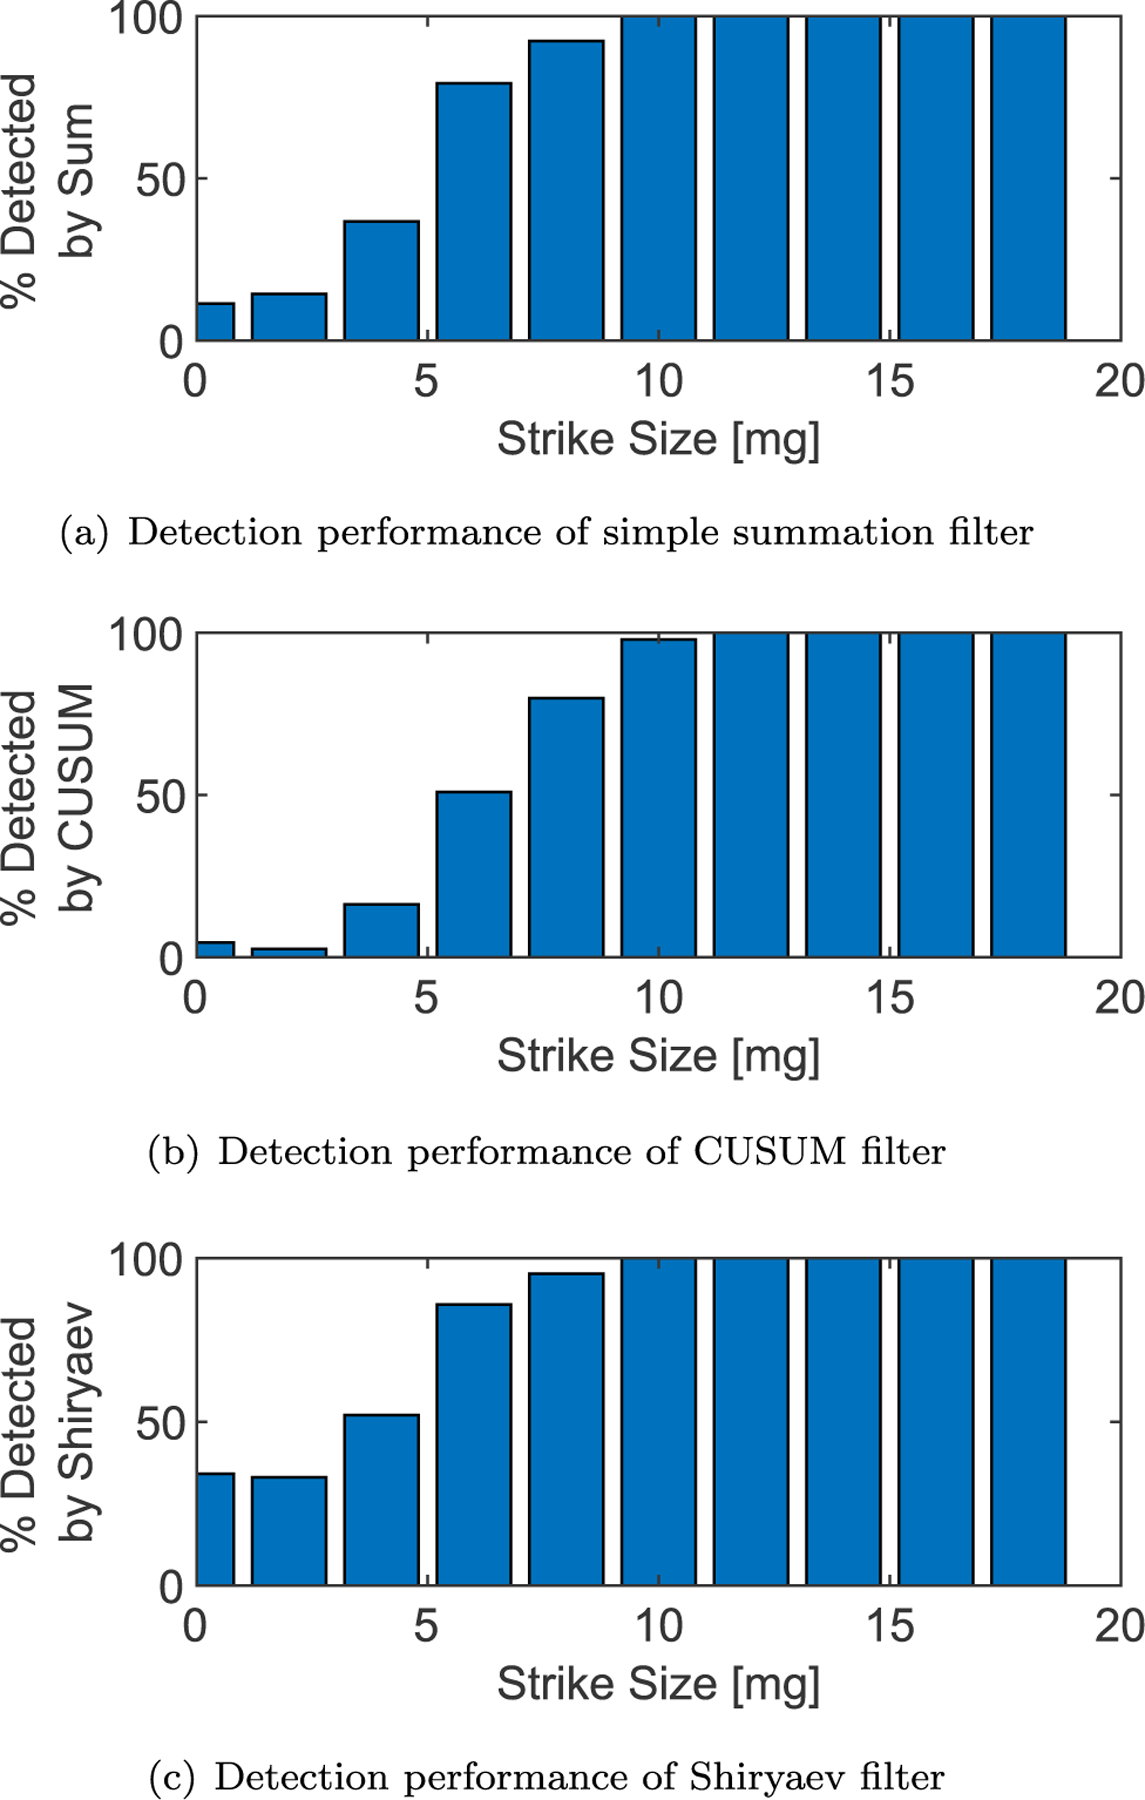
Detection performance of each filter on 1000 randomized strikes.
3.3.1. Selecting filter parameters
The performance of each of the SPRTs is dependent on the filter parameters such as the length of the windows and the choice of Δμ. The length of the pre-window is fixed at 200 datapoints and the post-window at 180 datapoints to allow reasonable computation times during long Monte-Carlo runs. The a priori probability of change for the Shiryaev algorithm, , is fixed at 1 × 10⁻⁶.
A Δμ of 0.1 N m s is chosen for the CUSUM algorithm, which corresponds to a 12.5 mg strike. This threshold could be lowered to detect smaller strikes, but that would result in additional noise in the absence of strikes. Selection of the Δμ threshold is a design choice for a given application, depending on whether it is desirable to detect any potential small strikes with a higher probability of false alarm or preferable to detect only the larger strikes with more confidence. The Shiryaev Δμ array is chosen to achieve the desired granularity in strike size estimates. A granularity of 5 mg in strike size is selected as the granularity for the Shiryaev algorithm, which corresponds to a Δμ of 0.04 N m s.
With these parameters, the filters produce the results shown in Fig. 10 when strikes with magnitudes 5, 10, 15, and 20 mg are applied in the x-axis. As shown, the filters struggle to detect the 5 mg strike but the 10 mg strike and higher are clear. The CUSUM algorithm and summation filter both show peaks at approximately the time of the strike, but the Shiryaev algorithm tends to have a plateau in the vicinity of the strike. This is because this algorithm is developed to provide quick change detection, and estimates the parameters directly. As soon as the end of the post window starts incorporating the change the algorithm begins predicting that the change has occurred, then the estimates for the change are refined, becoming less noisy as more of the post-window includes the change. When the window passes the point of the change the estimates for the change drop off as the pre-window starts incorporating the change in its fading assessment of the parameters. The simple summation algorithm has a noticeable peak for the smallest strike, while the CUSUM does not because it is well below its detection threshold. However, the noise in the simple summation algorithm is nontrivial, while the CUSUM has an excellent SNR for the three larger strikes. The Shiryaev algorithm seems to have a high SNR, but it also has false alarms just within this short run - a large false alarm on axis 2 at the end of the run, and a small spike on axis 3 that doesn’t quite cross the threshold just after the 10 mg strike.
3.3.2. Developing filter thresholds
To develop detection thresholds the pdf of filter output is used, similar to Section 3.2.2. However, the filter output for the SPRT filters is not always Gaussian like the matched filter output, so each algorithm’s threshold development is tailored to accommodate its unique output distribution parameters. The noise distribution for the output of each algorithm when no debris strikes are present is developed using a simulation with 40,000 filtered datapoints, while the noise distribution for the output when a strike is present is developed by applying a 10 mg strike to the simulation 1000 times and measuring the peak response. Fig. 11 shows the Q-Q plots of the filtered data using distributions specific to each algorithm.
Fig. 11.
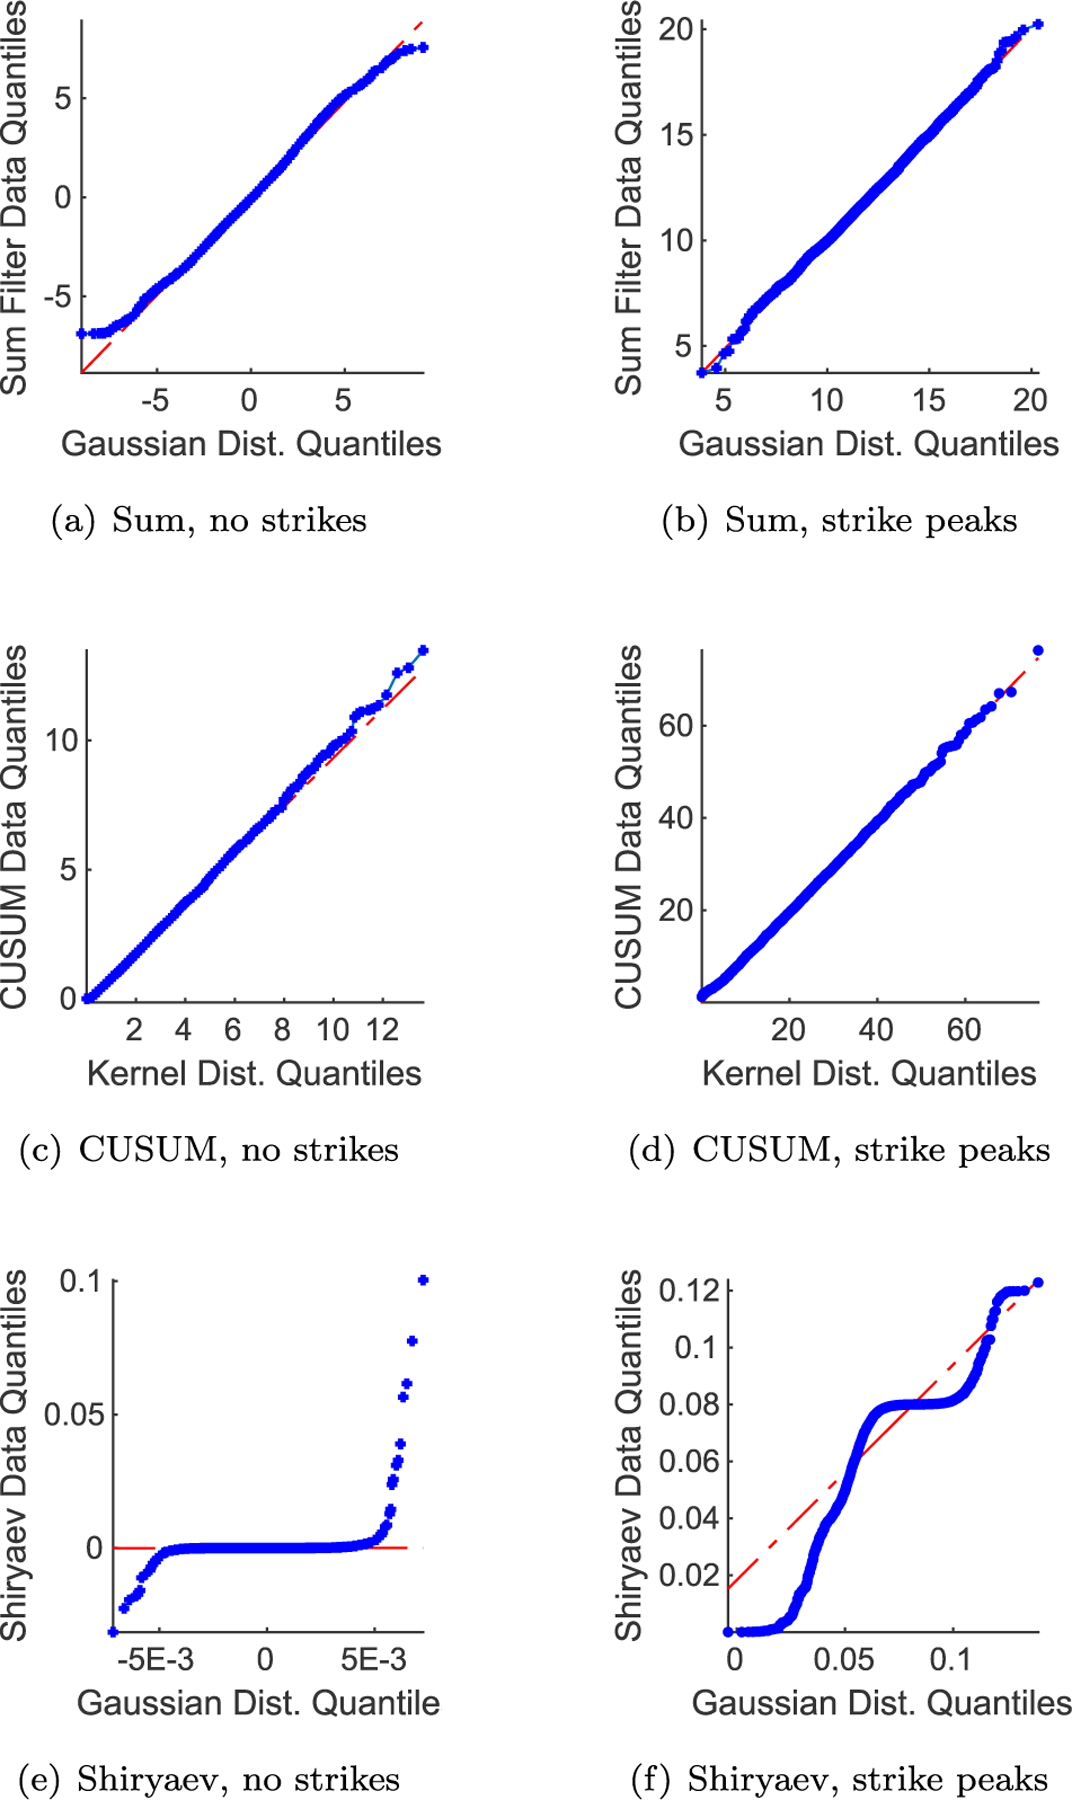
Q-Q plots illustrating results when fitting various distributions to filter output.
3.3.2.1. Summation filter output distributions.
The output of the summation filter with no debris strikes is modeled fairly well by a Gaussian distribution. The filter’s output has slightly lighter tails than a Gaussian distribution, so the thresholds developed using a Gaussian are somewhat conservative in terms of false alarm rate. The peak of the filter output when a debris strike is applied is also fairly Gaussian, so the method outlined in Section 2.2 is used to develop thresholds for strike detection using a desired PFA of 0.01%. Based on the ROC curve, the selected threshold for the summation filter is 8.8.
3.3.2.2. CUSUM output distributions.
The CUSUM algorithm has a one-sided output and thus requires a one-sided pdf. However, standard one-sided pdfs have lighter tails than the data from the CUSUM algorithm producing more false alarms than desired. To avoid this, a kernel distribution is used. When a debris strike is present the variation in the peak of the CUSUM algorithm is two-sided but skewed, and a kernel distribution is also used for that model. The pdfs generated by these distributions are used to develop the detection thresholds for the CUSUM algorithm per Section 2.2. This results in a threshold of 13.4 for the CUSUM algorithm. Note that 10 mg is slightly below the size of strike that the CUSUM algorithm is tuned to detect, so the output is variable resulting in a broad pdf.
3.3.2.3. Shiryaev output distributions.
The Shiryaev algorithm’s output is highly non-normal and defied all attempts to model it with standard pdfs. This applies to both the no-strike noise parameters and the output during debris strikes. Therefore, instead of using a poorly-fitted and non-representative ROC curve the thresholds are developed empirically from the no-strike noise data. Based on this data, a threshold of 0.03 N m s, or 75% of the smallest strike the algorithm is tuned to detect is selected. This threshold produced a PFA of 0.4% in one long simulation, but the threshold’s true PFA is not assessed analytically due to the lack of accurate pdfs characterizing the data.
3.3.3. Assessing detection performance
A 1000-run Monte-Carlo is conducted to assess each algorithm’s ability to detect debris strikes using the thresholds developed in Section 3.3.2. The Monte-Carlo randomizes the strike magnitude and direction, so it is applied on any combination of the three axes. Fig. 12 shows the detection accuracy of each algorithm for various strike sizes. These results indicate that detection performance is excellent for all three algorithms for strikes greater than 10 mg. Note that strike direction is randomized as well as strike magnitude, so each axis sees only a fraction of each strike.
The detection results for the CUSUM algorithm taper off more quickly than the Shiryaev or summation filter results, but this is likely due to the filter being tuned to detect strikes slightly larger than 10 mg. If the filter were tuned to detect smaller strikes it would likely perform a little better, as the SNR is exemplary as shown in Fig. 10. However, the filter output noise would increase if it were tuned to detect smaller strikes so the current tuning is maintained as a conservative and reliable filter.
The Shiryaev and summation filters show an ability to detect some strikes even in the < 3 mg range. It is likely that some of these strikes are false alarms. In a run with no strikes and 20,000 datapoints the Shiryaev filter produced eight false alarms while the summation filter produced one and the CUSUM filter produced zero. In a run the length of this Monte-Carlo simulation there would likely be well over 100 false alarms for Shiryaev and a dozen or so for the summation filter, although many of those would be hidden within the response to real strikes.
3.3.4. Estimating strike parameters
When a strike is detected by the simple cumulative sum filter or the CUSUM algorithm an estimate of strike parameters is obtained by comparing the average of the pre-window data to the average of the post-window data for each axis. The difference in averages is used as an estimate of the momentum imparted by the strike. With the Shiryaev algorithm’s weighted sum the output of the filter corresponds to the estimated strike size, so the filter output is used as an estimate of strike parameters. Fig. 13 shows the accuracy of each filter’s estimate of strike magnitude by plotting the true vs. estimated strike size. Non-detected strikes are shown on the x-axis. These results show that both methods do an exemplary job of estimating strike parameters. The estimates from the Sum and CUSUM algorithms tend to be more accurate, with nearly all the errors within ± 5 mg. The results from the Shiryaev algorithm are good as well but have significantly more outliers with poor estimates.
Fig. 13.
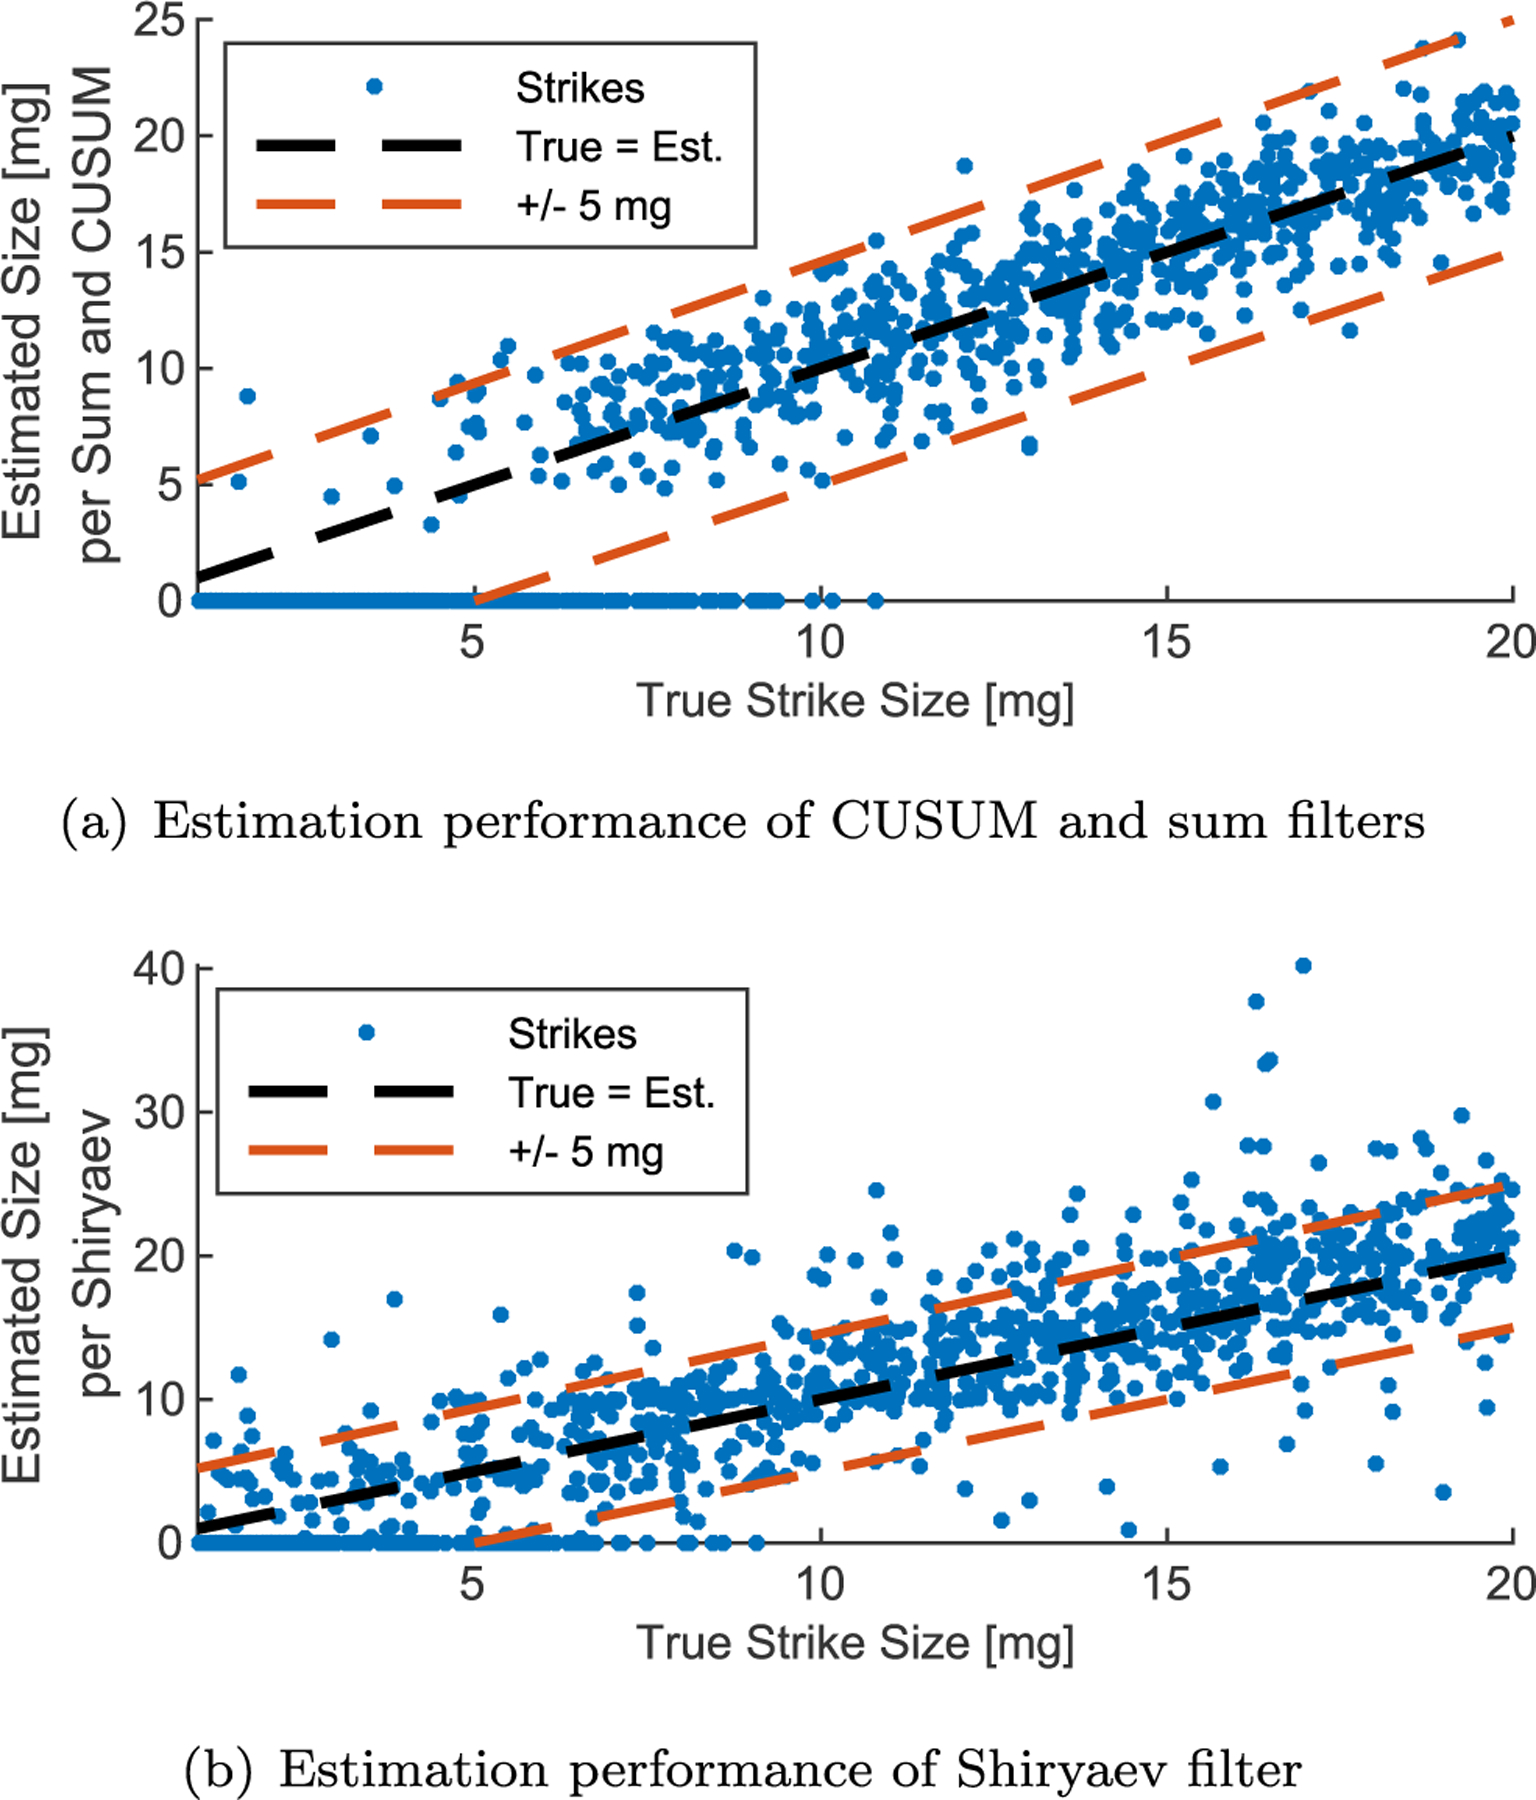
True size of each strike in 1000 run Monte-Carlo compared to estimated size using two estimation methods.
4. Results
The matched filters perform well for detecting strikes larger than about 40 mg, and can estimate the strike size to within around ± 20 mg. Matched filters offer the advantage of Gaussian filter output which allows high confidence in the filter’s false alarm rate. This is key when these methods are used to evaluate debris populations using on-orbit telemetry, since the level of confidence in the results must be understood to evaluate whether the measured strikes are reasonable based on the modeled fluxes.
Note that the exact filter thresholds and estimation accuracy are dependent on the spacecraft parameters and telemetry noise parameters used in this assessment, and will vary with different parameters for different spacecraft. Reference [26] discusses some preliminary results when trading spacecraft parameters. This work indicates that smaller spacecraft are capable of detecting smaller strikes with equivalent telemetry noise, but they also have a smaller collection area. Also recall that the thresholds are expressed in mg here to provide a straightforward and intuitive comparison between methods, but the angular perturbations are estimated in N.m.s. Table 2 provides examples of a variety of potential impacting particles with equivalent angular momentum transfer.
The performance of the SPRT methods run against the inertial angular momentum telemetry is outstanding. They are able to detect debris strikes reliably down to 10 mg and occasionally down to 3 mg or less. Their estimation performance is also excellent, generally estimating strike magnitudes to within ± 5 mg. This excellent performance compared to the matched filters is especially noteworthy because the momentum telemetry is calculated from the noisy attitude, rate, and wheel speed telemetry, whereas the matched filters only see either rate or attitude noise. This shows that the SPRT algorithms’ ability to identify subtle changes in noisy telemetry is exceptional.
Each SPRT algorithm has unique strengths and weaknesses. The summation algorithm offers extremely low computational requirements, and very little tuning or a priori knowledge is required to run it effectively. Its noise parameters are also fairly well modeled which allows the selection of thresholds with predictable false alarm rates. A drawback is that it has the lowest SNR of any of the algorithms which may degrade its performance on orbit when the measurement and state noise is not necessarily Gaussian. However, its extreme computational simplicity offers a potential on-board application. State-of-health telemetry is typically downlinked at substantially lower rates than on-board data processing to conserve bandwidth. Higher rate data could assist with accurate detection of small strikes. This simple algorithm could be used to screen for strikes using the high-rate on-board telemetry, and buffered telemetry could be downlinked at a higher rate if a probable strike is detected. This would offer more information to definitively establish if a strike has occurred and to assess any effects of the strike.
The CUSUM algorithm offers consistent performance and a very high SNR, with noise parameters that, while not Gaussian, did allow modeling via kernel distributions. One feature of this algorithm is its tunability: it allows a design choice about the size of strike to detect which must be balanced against the risk of false alarms. A drawback is that it has a non-trivial computational burden as the likelihood ratios must be computed for every datapoint in every sliding window. However, for running on telemetry as it is downlinked or running on historical telemetry it performs very well.
The Shiryaev algorithm is challenging in its highly non-Gaussian distribution parameters which make it difficult to assess the false alarm rate for a given threshold. It has very good performance but is more finicky than the CUSUM algorithm, and it is difficult to determine the time of the strike precisely. This could be a detraction if trying to identify the effects of the strike in multiple telemetry streams. However, this difficulty is partly due to its rapid response to strikes, which could be an asset in some applications where only a small window of data is usable or when quick strike detection is desired. Additional tuning may help to improve the false alarm characteristics of this algorithm by adjusting and experimenting with various distributions for strike size hypotheses.
5. Discussion
Applying these techniques to on-orbit telemetry is a non-trivial challenge, as the noise and events experienced by a real spacecraft can trip the detection algorithm thresholds even when no strike is present. While the theoretical inertial angular momentum is perfectly quiescent in the absence of external forces, the reality is more variable. A drift in the inertial angular momentum will be interpreted as a debris strike by the SPRTs if it produces a significant change between the pre-window and post-window. Therefore, the windows must be kept short enough that any unmodeled drift in momentum is small relative to the size of debris strike that the filters are tuned to detect. Accommodating these unmodeled drifts must take into account varying solar activity, gravity gradient torques and atmospheric drag for LEO orbits, and any changing conditions encountered by satellites in elliptical orbits.
Spacecraft events which trip the detectors need to be accommodated in any algorithms applied to on-orbit telemetry. Planned events can be accommodated either by blanking results during occasional events like thruster firings, or the SPRTs could be run on a residual generated by a spacecraft model that includes all on-board events which change the measured angular momentum, such as solar array tracking. This would highlight any subtle unexpected perturbations.
However, other unexpected perturbations may be interpreted as particle impacts. For example, Bogorad showed that an electrostatic discharge (ESD) event can impart momentum to the discharging object [37]. This is especially difficult to mitigate as a hypervelocity impact can also create an ESD event, so differentiating an ESD event that causes momentum transfer from a debris strike that causes ESD is a unique challenge. Spacecraft that are prone to ESD may struggle to separate strikes from other events, but well-built spacecraft with little risk of ESD could use the plasma generated by an impact as validation that an impact has occurred. In either case, the data should be examined for correlation between probable strike events and solar activities or orbit location/charging conditions to determine if ESD is a probable cause of any detected perturbations. Similarly, a satellite may experience a dynamic event due to thermal changes as it enters or exits eclipse which could manifest as a change in the observed inertial angular momentum. Fortunately eclipse dynamics are easy to screen for in an algorithm based on distinct changes in other telemetry (i.e., solar array power).
Another complication is the fact that spacecraft are not actually rigid bodies. In the Sentinel-1A debris strike (Fig. 1) the spacecraft rate telemetry exhibited a significant amount of ‘ringing’ which was probably due to the fundamental frequency of the solar array being excited by the strike. A similar phenomenon was observed in the MMS strikes [13,25]. This ringing obfuscates the effects of the strike as the calculated spacecraft momentum oscillates instead of showing an abrupt change, and this feature has an effect on the SPRT algorithms’ output. However, the oscillation itself might also provide an effect that could be detected with the right filter. A spring-mass-damper appendage could be added to the simulation for detailed assessment of the effects of appendage vibration.
Additional telemetry types should be considered for their contributions to identifying and assessing debris strikes. If a debris strike is large enough to change the orbit measurably the linear momentum may be estimated, which can be combined with the angular momentum to estimate the strike location on the spacecraft. Alternately, hypervelocity impacts produce a change in the ambient plasma surrounding a spacecraft [21], and mm-size impacts on solar arrays cause degradation in the power generation capabilities [38]. These and related features may be detectable.
Alternate data processing strategies may also prove useful for detecting impact events. For example, various research efforts continue to investigate the practicality of machine learning approaches for various space applications [39]. As mentioned in Section 1, machine learning techniques may be one interesting approach to solving this problem, but at present they often suffer from a lack of clear methods to verify and validate their performance. For this initial development, canonical techniques are used to provide a well-understood and well-characterized methodology for solving the problem, rather than a ‘black box’ solution which may include unknown undocumented features.
An essential element of validating the data returned by these methods is to compare the strikes predicted via models to detected strikes, and to compare results between spacecraft. This model comparison should take into account micrometeoroid populations as well as debris. This method returns the angular momentum of the strike, so a small and fast micrometeoroid would manifest similarly to a slower and larger piece of orbital debris. The effects of the time-variant flux density should also be considered when evaluating these methods. Polar regions are expected to exhibit higher debris fluxes for LEO spacecraft and ‘rush hours’ are anticipated for GEO spacecraft [40]. The flux of micrometeoroids also shows some variation throughout the year [41], and preliminary results indicate that these methods may be able to observe these variations [25].
There are additional complications even after a debris strike is detected and the change in momentum is estimated. As discussed in Section 2.1, the momentum imparted by the debris to the spacecraft is only a fraction of the momentum of the debris relative to the spacecraft if the impactor breaks through. However, if the impactor is stopped by the structure the plume of ejecta can cause the imparted angular momentum to exceed the relative momentum of the debris by a factor of two or more [36]. This highlights the importance of examining other telemetry, such as solar array power output, for indications of the strike. If the strike’s location can be identified and any damage assessed it can improve the ability to determine whether the estimated strike parameters are overpredicting or underpredicting the actual relative momentum of the debris.
There are of course several relevant elements of the hazardous non-trackable debris population that are not entirely captured in various types of debris measurement. An impactor’s mass, size, density, and shape all play a role in its potential to damage spacecraft and the evolution of its orbit. Radar cross section is the primary debris data collection technology for small debris in LEO, but the measurement corresponds to an object’s size rather than its mass, and the performance falls off at higher altitudes. Per the 2017 NESC report [9] the uncertain relationship between debris mass and size is likely a nontrivial contributor to discrepancies between modeled risks and observed events on orbit.
Therefore, this measurement methodology offers two unique contributions to small debris modeling and measurement. For one, the impactor’s mass is directly related to the momentum imparted to the spacecraft in an impact. Collecting measurements of perturbations from benign debris impacts offers a unique capability to generate measurements which correspond to the mass flux of hazardous non-trackable debris. Understanding this mass flux is a critical element of improving models and risk assessments. Also, this collection method can produce data in GEO, which has a significant population of critical satellite infrastructure but severely limited methods for collecting data on small debris populations [42].
Improving debris models and risk assessment methods is critical to ensuring that effective space environment management is performed as the global space industry enters the NewSpace era. Historically, when most space missions were exquisite government-funded one-offs, there was room for substantial conservatism in debris risk assessment methods. As commercial players launch large constellations and product-line satellites the debris environment will be increasingly stressed while the more rigorous debris mitigation standards are often only enforced on government missions [43]. To incentivize responsible behaviors among commercially-driven NewSpace actors, accurate models are a necessity. Overly conservative models with questionable accuracy will not be sufficient to promote responsible behaviors among commercial players. Fortunately, the burgeoning population of constellations and product-line satellites is a great fit for this type of debris data collection solution, with an inherent capability to substantially enhance knowledge of the local debris environment.
6. Conclusions
This study develops practical and effective methods for identifying subtle indications of debris strikes using standard spacecraft telemetry. It provides a powerful tool for spacecraft operators to employ satellite-as-a-sensor methods [44] to gain insight into the debris environment for their spacecraft’s orbit. Additional insight will be critical to enable the increasing use of all Earth orbits by burgeoning populations of space objects. Substantial populations of debris that can harm a spacecraft are untracked and accurately modeling these populations is challenging, especially for higher orbits. Leveraging active satellites as in situ debris sensors with inherent ability to detect minor strikes would revolutionize the space industry’s understanding of the untrackable debris environment to improve debris modeling, anomaly attribution and response, and debris risk assessments for future missions.
Acknowledgements
This work was supported by a NASA Space Technology Research Fellowship, NASA grant number 80NSSC18K1142.
Footnotes
Declaration of competing interest
The authors declare that they have no known competing financial interests or personal relationships that could have appeared to influence the work reported in this paper.
References
- [1].Monthly number of objects in Earth orbit by object type, Orb. Debris Quart. News 23 (1&2) (May 2019). [Google Scholar]
- [2].Shell J, Optimizing orbital debris monitoring with optical telescopes, in: Advanced Maui Optical and Space Surveillance Technologies Conference, 2010. Maui, HI. [Google Scholar]
- [3].Squire M, Micrometeoroid and Orbital Debris Testing on Composite Overwrapped Pressure Vessels, Applied Space Environments Conference, 2019. May. [Google Scholar]
- [4].Christiansen E, Lyons F, Davis B, Lear D, Reaction of spacecraft batteries to hypervelocity impact, Orb. Debris Quart. News 21 (1) (2017). February. [Google Scholar]
- [5].Space debris by the numbers. https://www.esa.int/Our_Activities/Space_Safety/Space_Debris/Space_debris_by_the_numbers.
- [6].Krisko P, The new NASA orbital debris engineering model ORDEM 3.0, in: 2014 Astrodynamics Specialist Conference, NASA Technical Report JSC-CN-30742, San Diego, CA, 2014. [Google Scholar]
- [7].Matney M, Manis A, Anz-Meador P, Gates D, Seago J, Vavrin A, The NASA orbital debris engineering model 3.1: development, verification, and validation, in: First International Orbital Debris Conference, 2019. Sugarland, TX. [Google Scholar]
- [8].Anderson PV, Schaub H, Methodology for characterizing high-risk orbital debris in the geosynchronous orbit regime, Adv. Space Res 57 (2) (2016) 604–619, 10.1016/j.asr.2015.11.004. [DOI] [Google Scholar]
- [9].Evaluation of Micrometeoroid and Orbital Debris (MMOD) Risk Predictions with Available On-Orbit Assets, NASA Engineering and Safety Center Technical Assessment Report NESC-RP- 14–01000, NASA Engineering and Safety Center, 2017. October. [Google Scholar]
- [10].Krag H, Serrano M, Braun V, Kuchynka P, Catania M, Siminski J, Schimmerohn M, Marc X, Kuijper D, Shurmer I, O’Connell A, Otten M, Muñoz I, Morales J, Wermuth M, McKissock D, A 1 cm space debris impact onto the Sentinel-1A solar array, Acta Astronaut. 137 (2017) 434–443, 10.1016/j.actaastro.2017.05.010. [DOI] [Google Scholar]
- [11].Cunio PM, Bantel M, Flewelling BR, Therien W, Jeffries MW, Butler R, Hendrix D, Photometric and Other Analyses of Energetic Events Related to 2017 GEO RSO Anomalies, Advanced Maui Optical and Space Surveillance Technologies Conference, 2017. [Google Scholar]
- [12].Henry C, ExoAnalytic Video Shows Telkom-1 Satellite Erupting Debris, SpaceNews, 2017. August. [Google Scholar]
- [13].Williams T, Sedlak J, Shulman S, Magnetospheric Multiscale mission micrometeoroid/orbital debris impacts, in: Spacecraft Anomalies and Failures Workshop, Chantilly, VA, 2017. [Google Scholar]
- [14].Humes D, Large Craters on the Meteoroid and Space Debris Impact Experiment, Tech. Rep, N92–23309, NASA Langley Research Center. [Google Scholar]
- [15].Graham G, McBride N, Kearsley A, Drolshagen G, Green S, McDonnell J, Grady M, Wright I, The chemistry of micrometeoroid and space debris remnants captured on hubble space telescope solar cells, Int. J. Impact Eng 26 (1–10) (2001) 263–274, 10.1016/S0734-743X(01)00087-2. [DOI] [Google Scholar]
- [16].Tuzzolino A, McKibben R, Simpson J, BenZvi S, Voss H, Gursky H, The Space Dust (SPADUS) instrument aboard the Earth-orbiting ARGOS spacecraft: I—instrument description, Planet. Space Sci 49 (7) (2001) 689–703, 10.1016/S0032-0633(01)00012-5. [DOI] [Google Scholar]
- [17].Bauer W, Romberg O, Putzar R, Experimental verification of an innovative debris detector, Acta Astronaut. 117 (2015) 49–54, 10.1016/j.actaastro.2015.07.008. [DOI] [Google Scholar]
- [18].Anz-Meador P, Ward M, Manis A, Nornoo K, Dolan B, Claunch C, Rivera J, The space debris sensor experiment, in: 1st International Orbital Debris Conference, 2019. NASA Technical Report JSC-E-DAA-TN74830, Sugarland, TX. [Google Scholar]
- [19].Mann I, Nouzák L, Vaverka J, Antonsen T, Fredriksen Å, Issautier K, Malaspina D, Meyer-Vernet N, Pavlů J, Sternovsky Z, Stude J, Ye S, Zaslavsky A, Dust observations with antenna measurements and its prospects for observations with parker solar probe and solar orbiter, Ann. Geophys. Discuss (2019), 10.5194/angeo-2019-94, 1–39. [DOI] [Google Scholar]
- [20].Kellogg PJ, Goetz K, Monson SJ, Dust impact signals on the wind spacecraft, J. Geophys. Res.: Space Phys 121 (2) (2016) 966–991, 10.1002/2015JA021124. [DOI] [Google Scholar]
- [21].Andersson L, Weber TD, Malaspina D, Crary F, Ergun RE, Delory GT, Fowler CM, Morooka MW, McEnulty T, Eriksson AI, Andrews DJ, Horanyi M, Collette A, Yelle R, Jakosky BM, Dust observations at orbital altitudes surrounding Mars, Science 350 (6261) (2015), 10.1126/science.aad0398aad0398-aad0398. [DOI] [PubMed] [Google Scholar]
- [22].Landgraf M, Baggaley WJ, Grün E, Krüger H, Linkert G, Aspects of the mass distribution of interstellar dust grains in the solar system from in situ measurements, J. Geophys. Res.: Space Phys 105 (A5) (2000) 10343–10352, 10.1029/1999JA900359. [DOI] [Google Scholar]
- [23].Flewelling B, Hendrix D, Bantel M, Cunio PM, Therien W, Jeffries M, Clark C, Explained and unexplained momentum impulse transfer events, in: 7th European Conference on Space Debris, ESA Space Debris Office, Darmstadt, Germany, 2017. [Google Scholar]
- [24].Williamsen J, Pechkis D, Balakrishnan A, Ouellette S, Characterizing the Orbital Debris Environment Using Satellite Perturbation Anomaly Data, Tech. Rep. IDA Document NS D-10643, Institute for Defense Analyses, 2019. June. [Google Scholar]
- [25].Bennett AA, Schaub H, Identifying and assessing debris strikes in NASA spacecraft telemetry, in: First International Orbital Debris Conference, 2019. Sugarland, TX. [Google Scholar]
- [26].Bennett AA, Schaub H, Effect of spacecraft parameters on identification of debris strikes in GN&C telemetry, in: Guidance Navigation and Control Conference, American Astronautical Society, Breckenridge, CO, 2020. [Google Scholar]
- [27].Schaub H, Junkins JL, Analytical Mechanics of Space Systems, third ed. Edition, AIAA Education Series, American Institute of Aeronautics and Astronautics, Inc, Reston, Virginia, 2014. [Google Scholar]
- [28].Wiener TF, Theoretical Analysis of Gimballess Inertial Reference Equipment Using Delta-Modulated Instruments, Ph.D. dissertation, Department of Aeronautics and Astronautics, Massachusetts Institute of Technology, Cambridge, MA, 1962. March. [Google Scholar]
- [29].Marandi SR, Modi VJ, A preferred coordinate system and the associated orientation representation in attitude dynamics, Acta Astronaut. 15 (11) (1987) 833–843. [Google Scholar]
- [30].Shuster MD, A survey of attitude representations, J. Astronaut. Sci 41 (4) (1993) 439–517. [Google Scholar]
- [31].Moulin P, Veeravalli VV, Statistical Inference for Engineers and Data Scientists, Cambridge University Press, Cambridge, UK; New York, NY, 2019. [Google Scholar]
- [32].Levy BC, Principles of Signal Detection and Parameter Estimation, Springer, New York, NY, 2008. oCLC: 254592856. [Google Scholar]
- [33].Malladi DP, Speyer JL, A generalized shiryayev sequential probability ratio test for change detection and isolation, IEEE Trans. Automat. Contr 44 (8) (1999). [Google Scholar]
- [34].Smith CH, McKinley IM, Ramsey PG, Rodriguez JI, Performance of multi-layer insulation for spacecraft instruments at cryogenic temperatures, in: 46th International Conference on Environmental Systems, 2010. Vienna, Austria. [Google Scholar]
- [35].Schäfer F, Destefanis R, Ryan S, Riedel W, Lambert M, Hypervelocity impact testing of CFRP/AL honeycomb satellite structures, in: Fourth European Conference on Space Debris, Darmstadt, Germany, 18. [Google Scholar]
- [36].Williamsen J, Evans S, Orbital debris momentum transfer in satellite shields following hypervelocity impact, and its application to environment validation, Procedia Eng. 204 (2017) 500–507, 10.1016/j.proeng.2017.09.747. [DOI] [Google Scholar]
- [37].Bogorad AL, Likar JJ, Voorhees CR, Herschitz R, Electrostatic discharge induced momentum impulse from charged spacecraft surfaces, IEEE Trans. Nucl. Sci 53 (6) (2006) 3607–3609, 10.1109/TNS.2006.885108. [DOI] [Google Scholar]
- [38].Kunbo X, Jiandong Z, Zizheng G, Yan C, Pinliang Z, Qiang W, Investigation on Solar Array Damage Characteristic under Millimetre Size Orbital Debris Hypervelocity Impact.
- [39].Harris A, Schaub H, Deep on-board scheduling for autonomous attitude guidance operations, in: AAS Guidance, Navigation and Control Conference, Breckenridge, CO, 2020. [Google Scholar]
- [40].McKnight DS, Di Pentino FR, New insights on the orbital debris collision hazard at GEO, Acta Astronaut. 85 (2013) 73–82, 10.1016/j.actaastro.2012.12.006. [DOI] [Google Scholar]
- [41].Campbell-Brown MD, Jones J, Annual variation of sporadic radar meteor rates, Mon. Not. Roy. Astron. Soc 367 (2) (2006) 709–716, 10.1111/j.1365-2966.2005.09974.x. [DOI] [Google Scholar]
- [42].Manis A, Matney M, Anz-Meador P, Cowardin H, The updated GEO population for ORDEM 3, in: First International Orbital Debris Conference, 2019. Sugarland, TX. [Google Scholar]
- [43].Orbital Debris Mitigation Standard Practices, United States Government, 2019. [Google Scholar]
- [44].Tschan C, What do we need for satellite event attribution?, in: Spacecraft Anomalies and Failures Workshop, 2014. Chantilly, vol. A. [Google Scholar]


