

Abstract
Single-molecule characterization has become a crucial research tool in the chemical and life sciences, but limitations, such as limited concentration range, inability to control molecular distributions in space, and intrinsic phenomena, such as photobleaching, present significant challenges. Recent developments in non-classical optics and nanophotonics offer promising routes to mitigating these restrictions, such that even low affinity (KD ~ mM) biomolecular interactions can be studied. Here we introduce and review specific nanophotonic devices used to support single molecule studies. Optical nanostructures, such as zero-mode waveguides (ZMWs), are usually fabricated in thin gold or aluminum films and serve to confine the observation volume of optical microspectroscopy to attoliter to zeptoliter volumes. These simple nanostructures allow individual molecules to be isolated for optical and electrochemical analysis, even when the molecules of interest are present at high concentration (μM - mM) in bulk solution. Arrays of ZMWs may be combined with optical probes such as single molecule fluorescence, single molecule fluorescence resonance energy transfer (smFRET), and fluorescence correlation spectroscopy (FCS) for distributed analysis of large numbers of single-molecule reactions or binding events in parallel. Furthermore, ZMWs may be used as multifunctional devices, for example by combining optical and electrochemical functions in a single discrete architecture to achieve electrochemical ZMWs (E-ZMW). In this review, we will describe the optical properties, fabrication, and applications of ZMWs for single-molecule studies, as well as the integration of ZMWs into systems for chemical and biochemical analysis.
Keywords: zero-mode waveguides, single-molecule analysis, fluorescence correlation spectroscopy, multifunctional nanostructures
1. INTRODUCTION
Optical spectroscopy, a long-standing pillar of chemical analysis, faces challenges when attempting to lower the limit of detection to the theoretical minimum - a single molecule, but the benefits of overcoming these challenges are well worth the effort. In bulk experiments, the behavior of molecular ensembles can be examined with great precision; however, as the number of molecules is decreased toward the single-molecule limit, the variability among individual molecules, rather than the average properties of the ensemble, becomes the dominant characteristic [1]. Effects that would otherwise be lost in an averaged signal from a bulk experiment may become readily apparent when a single molecule is investigated; to wit, molecular properties may be reflected in the number of occupied states, a time histogram, or a frequency distribution, thus providing more information than an ensemble average. This is especially useful when multiple effects overlap, such as fluorophore photobleaching and diffusion, both of which can remove molecules from the probed population [2]. For many applications within biological or life sciences, achieving single-molecule sensitivity can provide deeper understanding of the local molecular environment and illuminate effects arising from molecular inhomogeneity [3].
Single-molecule spectroscopy presents two main experimental challenges: obtaining the required signal-to-noise (S/N) and controlling the local environment of the molecule. Many approaches have been developed to address these issues; for example, cryogenically cooling to achieve better isolation and separation of vibrational modes [4], optical trapping [5], or embedding molecules within optically-transparent host matrices to highlight inhomogeneous spectral lineshapes [6]. However, their specialized requirements render these techniques less than ideal for the wide range of samples encountered, for example, in the life sciences [7].
To preserve the natural conformations and interactions of biological molecules under study, biological samples are typically analyzed in aqueous environments near room temperature; however, the thermal excitation makes confinement of molecules in the observation volume more difficult. Early single-molecule optical measurements were realized by dramatically decreasing the observation volume [8], thus lowering the background noise, and hence the limit of detection. The diffraction of light, typically limits the spatial resolution to ca. λ/2, providing a lower threshold for optical measurements. However, achieving single molecule occupancy in a (λ/2)3 ~ 0.1 fL focal volume obtained from a high numerical aperture microscope objective requires diluting samples below biologically-relevant concentrations. Single-molecule spectroscopy of biological molecules in situ, thus, requires decreasing the observation volume past the diffraction limit. Two main tactics in this regard are: (1) reducing the liquid volume being excited, or (2) manipulating the optical excitation/collection characteristics. The advances described in this review exploit one or both of these principles. With proper high-collection-efficiency optics, low-noise detectors, and appropriate steps taken to reduce background fluorescence and scattering, solution-based single molecule spectroscopy can achieve impressive results, e.g. deep insights into the site-specific binding behavior of biomolecules [9].
Near-field Scanning Optical Microscopy (NSOM) is a relatively early example of the first group of approaches - using the unique features of a nanophotonic structure to increase the spatial resolution beyond the diffraction limit of traditional optics. Furthermore, in the NSOM experiment, the excitation volume was decreased sufficiently to achieve single-molecule imaging of single fixed-position molecules [10]. Total-Internal Reflectance Fluorescence (TIRF) also limits the excitation volume perpendicular to an interface and is able to achieve single-molecule sensitivity [11], but cannot achieve excitation volumes comparable to those of nanophotonic structures [12]. Examples of the second approach include selective activation/deactivation of fluorescent molecules, as in Stimulated Emission-Depletion (STED) and Fluorescence (or Förster) Resonance-Energy Transfer (FRET). In these approaches, the effective excitation volume is decreased even though the overall liquid volume under observation is still diffraction-limited. Zero-mode waveguides (ZMW) are structures that accomplish both objectives simultaneously, by confining the dimensionality of evanescent waves similar to NSOM while simultaneously confining the liquid volume being observed.
Continued advances in nanofabrication capabilities, spurred by the ever-shrinking feature size of semiconductor electronics, have enabled new families of nanophotonic devices which promise dramatic improvements in the single-molecule spectroscopy, for example easing the requirements for specific analytes and increasing the working concentration range, in order to achieve more biologically-relevant measurements. The history, theory, and exciting applications of these nanophotonic devices applied toward single-molecule optical characterization is the central focus of this review.
1.1. History of Nanophotonic Structures for Optical Spectroscopy
Early investigation into nanophotonics was spurred by the need to push the boundaries of optical communication and optical storage technologies [13]. By definition, nanophotonic devices are comprised of structures with dimensions smaller than the wavelength of visible light, and, in contrast with traditional optics, tend to favor near-field interactions. The prospect of harnessing the unique characteristics of nanophotonic structures has led investigators to explore both the theoretical underpinnings of their use [14] and experimental challenges in their fabrication [15]. Miniaturization of traditional optical components has, for example, been used to create microscopic spectrometers, hinting at the possibility of completely on-chip single-molecule spectroscopy and detection [16].
One broad category of nanophotonic devices relies on structural resonances of light within subwavelength structures. For example, microtoroids can access so-called “whispering-gallery mode” optical resonances to build up large optical fields within a sub-wavelength-scale device. Because the position of the resonance is governed principally by the properties of the interface between the toroid and the surrounding environment, these devices are extremely sensitive to small changes in surface molecular composition - a property that has been used to detect single molecules [17] and exosomes [18], yielding information about both binding energy and kinetics. However, molecular detection is different from molecular spectroscopy, and these devices which use resonance frequency shifts of the toroid, rather than a spectroscopic signature of the detected molecule, do not provide spectroscopic information in the classical sense.
Split-ring resonators represent another example, which exploit changes in the plasmon resonance of segmented nanodisks with a small “gap” between the two ends of the disk. Due to their well-controlled dimensionality, these disks can show unusual features, such as Fano resonances [19]. Unlike microtoroids, split-ring resonators are more sensitive to molecules in certain parts of the disk, e.g. the gap is more sensitive than the ring, due to the local plasmon hot spots created [20]. This can effectively reduce the optical volume and raise the concentration threshold for single-molecule detection, as was demonstrated with surface-enhanced Raman scattering (SERS) for molecular monolayers [21] and DNA [20].
Linear waveguides are similar to resonators in the subwavelength confinement of light, but they can more easily be used for spectroscopy. Light guiding in nanophotonic structures can decrease the observation volume similar to TIRF, a characteristic used in the detection of single nanoparticles [22]. However, the axial length of the waveguide needs to be large enough to facilitate this coupling, so the effective volume is significantly larger than in zero-mode waveguides.
One early application of single-molecule spectroscopy in liquid environments was enabled by the development of near-field optical probes; typically made by creating a subwavelength aperture in a light-blocking film at the end of a tapered fiber, in essence extending the evanescent field of the waveguide but constraining it in both radial dimensions. NSOM uses the evanescent field created by the near-field probe to decrease the excitation volume well beyond the λ/2 diffraction limit; the first published experiments demonstrating lateral resolution <100 nm [23]. Images are then constructed by raster-scanning the probe [24]. These nearfield probes, or nanoantennas, can also be coupled to linear waveguides in hybrid systems [25].
Shortly after development of NSOM, the small probe volume created by the tip was used to observe single surface-bound dye molecules [26], an experiment with obvious bioanalytical relevance [27], for example, in imaging cell membranes [28]. Furthermore, near-field spectroscopy (NFS), has proven effective at single-molecule spectroscopy [10]. In addition, Raman scattering has recently been extended to single-molecule sensitivity; no small achievement given the ~1014-fold smaller cross-section for Raman scattering compared to absorption/fluorescence. Many reports and review articles have detailed the significant progress in this field [29–34]. Since these measurements do not rely on transmitted or absorbed light, but rather on inelastically scattered radiation, plasmonic nanostructures are much more applicable. Some methods of multiplying the available Raman signal include nanostructures, such as plasmonic nanowires [29], to increase the Raman scattering efficiency [35,36]. These SERS experiments can be combined with scanned probe approaches, such as scanning-tunneling microscopy (STM) to produce tip-enhanced Raman scattering [37].
Nanophotonic/nanoplasmonic structures, such as nanoantennas [38] and nanocubes [39], have been used for single-molecule SERS experiments engineering to produce highly localized surface plasmon “hot spots” which increase the surface-enhancement factor by a large factor within a limited volume.
1.2. Special Nanophotonic Structures
One of the most powerful aspects of nanophotonic structures is the ability to adjust the geometry to finely tune the local environment. The ability of these specialized nanophotonic structures to manipulate multiple parameters simultaneously allows for great control over observables such as reaction rate, activity, fluorescence, and catalytic behavior. As an example, nanowire photoluminescence can be modulated by varying pH and applied electrical bias [40].
The proximity of a molecule to a surface or nanostructures, i.e. the local molecular environment, can also affect molecular behavior. However, the advantages of a nanophotonic structure can be overwhelmed by the behavior of molecules in the bulk, if special care is not taken to limit the volume addressed by the nanophotonic architecture. To highlight this point, in optical aperture nanoantennas much work has been invested in developing the theory and studying the effect of adding insulating upper layers to the metal surface, in order to lower the limit of detection to the single-molecule regime [41].
Recent developments in plasmonics and metamaterials, such as the creation of material systems with index of refraction approaching zero [42], could significantly impact the field of single-molecule spectroscopy in the future due to the unusual effects made possible by non-classical material designs. Recent advances in theory and modeling, made possible by increased understanding of the optical behavior of nanostructures, promise benefits ranging from better design of plasmonic modes of nanostructures [43], to focusing light via metasurfaces into apertures without metallic waveguides [44], with many more future advancements certain to come.
2. ZERO-MODE WAVEGUIDE BACKGROUND
Zero-mode waveguides (ZMWs) are waveguides which restrict the transmission of propagating modes of incident radiation through sub-wavelength sized apertures, instead allowing only the exponentially-decaying evanescent field, a transverse stationary mode. Furthermore, confining the radiation to a zeptoliter-scale volume has important implications for the characterization of single molecules and single reaction events.
2.1. Zero-Mode Waveguide Characteristics
2.1.1. Bethe-Bouwkamp Theory
The optical properties of zero-mode waveguides are well-understood. The Kirchhoff approximation can be used to solve the homogenous wave equations within a given set of assumptions and thus describe the polarization-independent diffraction of light through a relatively large aperture, i.e. one larger than the wavelength of the incident radiation [45]. Diffraction through sub-wavelength apertures is more difficult, since the direct transmission of propagating modes is attenuated. Bethe [46] developed a theory based on Maxwell’s equations, which was later expanded by Bouwkamp [47] to examine the transmission of light through subwavelength apertures in an infinitely thin screen. In this regime, the transmission efficiency through the aperture is given by
| (1) |
where k = 2π/λ is the norm of the wavevector of the incoming light of wavelength λ, and r is the radius of the hole [48]. In real-world experiments, the metallic film has finite thickness, which serves to increase the transmission of light above the cutoff wavelength relative to the Bethe-Bouwkamp solution, as shown by Roberts [49].
More recently, the transmission has been shown to be higher than Bethe predicted due to surface plasmons and other nonideal interactions. For multiple apertures in an array, plasmonic interactions also affect the transmission, increasing it above the Bethe-Bouwkamp prediction. When the spacing between holes is decreased, the aperture array begins to resemble a classical interference grating, and the incident wave reconstructs from the array of holes acting as point sources [48]. It is even possible that extraordinary optical transmission may occur with closely-spaced nanoaperture arrays [50]. For unusual geometries, ideal solutions to the Maxwell equations, even when modified to account for surface plasmons and other non-idealities, perform poorly, and numerical methods may be required [51,52].
2.1.2. ZMWs – Light Trapping and Physical Properties
Typically, ZMWs are implemented as nanopore arrays, created as holes in a planar device made of metallic and, optionally, insulating layers. Certain physical properties of the nanostructured ZMW arrays can have a large impact on the behavior of the device. Typical pore diameters of 30–300 nm result in large surface-to-volume ratios compared to typical macro- and micro-scale liquid devices. Thus, the interaction between the surface and the liquid is greatly magnified.
One measure of the electrical condition inside the pore is the surface zeta potential, ζ, or the electrical potential at the shear plane. This is related to the Debye length, a measure of how effectively ions are shielded from the surface potential [53]. With the development of electro-kinetic flow in micro- and nano-sized liquid systems, significant progress has been made on understanding the zeta potential [54], which has been shown to be an important factor in biological systems [55]. With the small liquid volume inside nanopores, the zeta potential can determine the entire electric potential of the volume and greatly affect the behavior of ions within the pores. The zeta potential can be controlled in nanopores by changing the interfacial composition, for example by surface functionalization and ion implantation [56].
The shape [57] and metal used [58] to construct the nanopore are also important factors in determining the ability of the waveguide to confine the electromagnetic field, important for determining the optimum conditions for fluorescence, which change depending on the desired excitation and emission wavelengths. The cross-sectional shape of the nanopore/nanoantenna, e.g. circular, elliptical, square, etc., affects the plasmon response, impacting both fluorescence and SERS measurements [59].
2.1.3. Single Molecule Occupancy Conditions
When ZMWs enclose freely-diffusing systems, single-molecule occupancy is specified by the concentration that, on average, places a single molecule within the observation volume. One indication of single-molecule behavior is stepwise, well-defined transitions between a bright active state and a dark background. Transitions are sharp and well-defined to the extent that the observation volume provides a well-defined excitation intensity cutoff, with multiple fluorescent steps serving to indicate multiply-occupied pores with quantized occupancies, n = 0, 1, 2, …, while photobleaching provides fast deactivation of active molecules, appearing as a stepwise decrease in fluorescent intensity for both diffusive and bound molecules [1, 7].
The probability of a molecule being in the pore is simple to calculate at single-molecule, concentrations. Since the energy difference between an unoccupied pore, a singly-occupied pore, and a multiply-occupied pore is negligible, the standard canonical ensemble collapses to a simple Poisson distribution, with probability function [60].
| (2) |
where k = number of molecules, and λ = the average occupancy. The Poisson distribution does not accurately describe a system with larger constituents (such as DNA or nanoparticles) which experience inter-particle interactions, nor is it valid for systems with significant surface-molecule interactions, such as antibody-functionalized pores with proteins. However, for pores where the simple assumptions hold, the occupation probabilities at various average occupancies are easy to calculate; a few values for typical conditions are given in Table 1.
Table 1.
Molecular occupation probabilities for various average occupancy (λ) values.
| P(k) | λ = 0.1 | λ = 1 | λ = 2 |
|---|---|---|---|
| P(0) | 0.90484 | 0.36788 | 0.13534 |
| P(1) | 0.09048 | 0.36788 | 0.27067 |
| P(2) | 0.00452 | 0.18394 | 0.27067 |
| P(3) | 0.00015 | 0.06131 | 0.18045 |
During a measurement, an individual pore can only be occupied by an integer number of molecules, with transition rates between states governed by diffusion and/or electromigration, depending on the experiment. When a large array of equally-treated pores is observed, the pore occupancies corresponds well with Poisson statistics [60]. Of course, pore occupancy is a dynamic phenomenon. The amount of time that a freely-diffusing molecule remains in the pore is a function of the pore shape, diffusion coefficient, and temperature, among other factors, and thus can vary significantly even for systems with the same average occupancy. In contrast to relying on diffusion to fill pores, complete single-molecule occupancy may be achieved, by direct manual placement of each molecule. This strategy was demonstrated by Tinnefield and Gaub, et al. who combined atomic-force microscopy (AFM) and ZMWs, by using an oligomer-functionalized AFM tip to place individual molecules in the direct center of nanoapertures with nm-scale precision [61].
2.1.4. Optical Field Distributions
The spatial distribution of the optical field, both within and external to the ZMW, is important, and highlights one of the differences between ZMWs and NSOM. NSOM uses localized propagating radiation to illuminate an external surface held close to the waveguide aperture. This results in a relatively large excitation volume, but with the ability to optically probe a surface external to the waveguide. In contrast, ZMWs use the evanescent field within the waveguide itself, requiring the sample to be confined within the nanoaperture. Thus, ZMWs exhibit optical excitation volumes in the atto- to zeptoliter range [62].
The optical field distribution within this excitation volume is a function of both the incident wavelength and the shape of the nanopore. In the ideal case of a cylindrical nanopore and for wavelengths above the cutoff wavelength, λc ~1.7d for pore diameter d, the evanescent field decays exponentially with increasing distance into the cylinder, resulting in the optical intensity as a function of distance, I(z),
| (3) |
where I0 is the maximum intensity, Λ is the decay constant and z is the distance in the pore. The decay constant is defined as,
| (4) |
where, λm is the wavelength in the ZMW medium. If the fluorescence intensity is assumed to be proportional to the excitation profile, then the effective optical volume, Veff, in a conical ZMW is given by
| (5) |
2.2. Fluorescence in Zero-Mode Waveguides
2.2.1. Background Reduction
The noise in fluorescence experiments arises from three main sources: noise in the fluorescence signal, NS, noise from the background, NB, and noise from the detector, ND. These noise sources are usually independent, and thus cumulatively contribute to the overall measurement noise, N, in quadrature, [63].
| (6) |
with each noise source arising from multiple contributions. Signal noise is composed of shot and flicker noise of the illumination source and from the fluorescence emission, while detector noise may include dark noise, amplifier noise, and readout noise, depending on the detector technology used. Significant progress over the past few decades in decreasing noise in detectors and emission sources while increasing detector efficiency has decreased the contribution of these noise sources enough to make the background noise the dominant term.
In bulk experiments, reduction of NB is typically accomplished through frequency-domain optical filtering, which prevents scattered excitation radiation from completely overwhelming the fluorescence. In the case of a uniform background signal (save for the excitation wavelength), maximum signal-to-noise ratio(S/N) is typically achieved with the widest-range filter that captures the spectral range where the desired signal remains above the average S/N, yet still effectively blocks the excitation. In the case of frequently encountered non-spectrally-uniform background signals, choosing the optimal excitation/emission filters is more challenging and the subject of ongoing research [64].
Undesired fluorescence and scattering remain the largest contributions to the background noise. In single-molecule spectroscopy experiments, undesired fluorescence is typically proportional to the excitation volume, arising either from autofluorescence of the solvent/supporting media or spurious emission from a fluorophore external to the excitation volume. The tightly-contained excitation profiles created with ZMWs and similar nanophotonic structures effectively minimize this contribution, enabling single-molecule measurements at biologically-relevant concentrations. Photobleaching, typically an undesired phenomenon, can be used to decrease undesired fluorescent species within the collection volume, when it is applied to solvent/background molecules [8]. Alternatively, background noise may be decreased by correlating signals at multiple wavelengths with appropriately-functionalized target molecules, since random noise at different wavelengths is uncorrelated [65].
2.2.2. Coupling to Surface Plasmons
Surface plasmon interactions are a very useful tool in decreasing the limit of detection in optical spectroscopy, with techniques such as SERS relying on the enhancement of the optical field via plasmon interactions. Plasmon modes, excited by the incident radiation, can lose energy in electron-phonon interactions or convert back to radiative modes, resulting in enhancement of the near-field or scattering [66]. For zero-mode waveguides, this can lead to increased transmittance through the nanopore array, thus increasing the background in a fluorescence measurement; or alternatively, increasing the efficiency of fluorescence, an effect used in some efforts toward high-throughput DNA sequencing.
The identity of the metal in which the nanoaperture is made affects the plasmonic behavior due to the polarizability of the metal; Au is more suited to red wavelengths, Al for green [58], and Mg for ultraviolet [67]. The shape of the nanoaperture can help to focus the plasmon interactions into “hot spots”; structures with shaper angles, such as triangles or bow-tie structures, being better for plasmon focusing than circular or elliptical structures. Pulsed illumination, with femtosecond lasers, has also been shown to increase the localization of the near-field in nanoapertures [68]. Pulsed illumination with dual-wavelength SERS approaches have yielded insights into single-molecule plasmon-electron coupling between nanoparticles, demonstrating the potential of single-molecule SERS to examine behavior hidden in ensemble measurements [69].
2.2.3. Fluorescence Correlation
From its inception, fluorescence correlation spectroscopy (FCS) was created to be relevant to biological molecules - examining diffusion and binding kinetics for reactions such as binding of macromolecular partners with DNA [70]. FCS of freely-diffusing molecules uses the large changes in fluorescence associated with fluctuations in concentration equilibria of an active species, obtained in a time-resolved manner and analyzed by autocorrelation to glean valuable information about diffusion and rate constants. This approach has been extended to multicomponent mixtures [71] and larger particles, such as silica nanoparticles [72], and has gained great popularity due to the ability of FCS to provide information on multiple attributes of a molecular system with a relatively simple measurement. In short, FCS is a powerful technique which has been reviewed separately [73].
2.2.4. smFRET
Fluorescence Resonance Energy Transfer (FRET) is a versatile technique that has been adapted to a variety of conditions, including measurements at the single-molecule level (smFRET) under aqueous conditions, for both fixed and freely-diffusing targets. FRET measurements rely on the transfer of energy from a donor to an acceptor fluorophore in a non-radiative pathway, such that the energy acquired by the donor is released by the acceptor radiatively. The efficiency of this transfer, E, can provide information about the intermolecular distance between the two dye molecules through the relationship [74]:
| (7) |
where R is the inter-dye distance, and R0 is the Förster radius at which E = 0.5. The transfer efficiency as a function of intermolecular distance is portrayed in Figure 1. Practical implementations of smFRET rely on selecting the optimal energy transfer scheme, cf. Figure 1(c). Such measurements have provided insight onto many biochemical problems, including early experiments on the nature and conformation of the DNA double helix [75], and have been so successful that the smFRET is alternately described as a “nano optical ruler” [76]. smFRET has been recently demonstrated in combination with ZMWs, increasing the single-molecule concentration from ~μM to mM levels [12,77]. Carefully-tuned nanoantennas have even been shown to increase the availability of forbidden energy transmissions, increasing FRET emission efficiency [78], leading to an increase in the FRET rate for closely-spaced molecules by as much as a factor of 6 [79].
Figure 1.
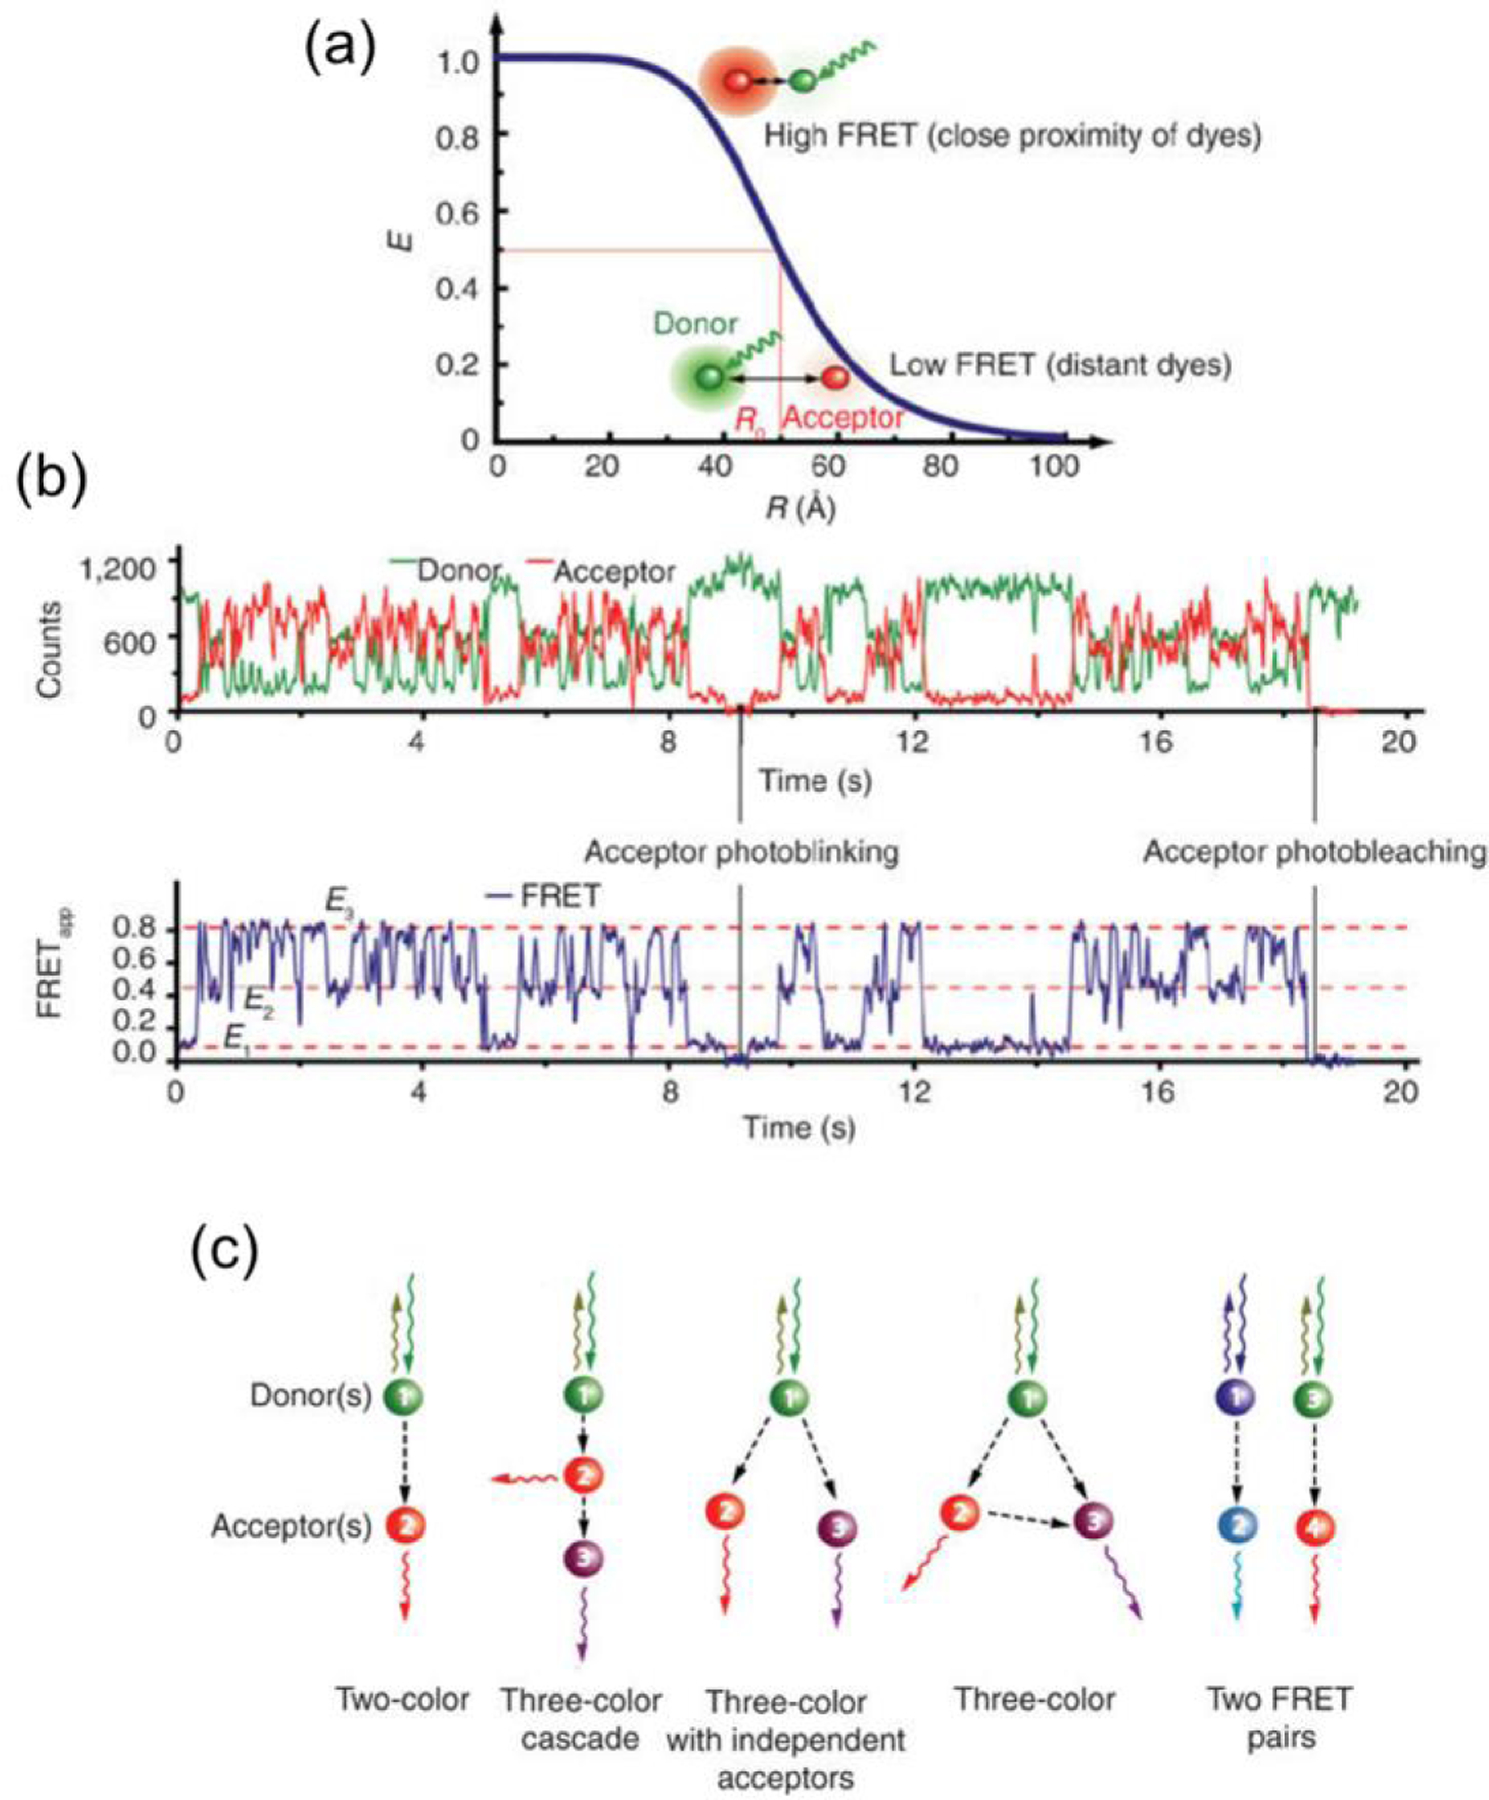
Single-molecule Fluorescence Resonance Energy Transfer (smFRET) (a) Transfer efficiency vs donor-acceptor distance according to equation 7 with R0 = 5.0 nm. (b) Fluorescence vs. time trace, top, showing simultaneous two-color, two-channel smFRET fluorescence monitoring. FRET efficiency over time, bottom, calculated from the two intensity traces. (c) Single-molecule FRET schemes. (Reproduced with permission from [74]. Copyright 2008, Nature Publishing Group.)
3. ZERO-MODE WAVEGUIDE FABRICATION
3.1. Lithography/Etching
3.1.1. Metal Lift-Off
The fabrication of zero-mode waveguides is inherently difficult due to the small (10–100 nm) length scales required to produce pores with a cutoff wavelength in the visible spectrum. Forming such small features is not possible using conventional lithography, as the diffraction limit of UV light is ~200 nm and traditional contact lithography results in features in the μm-scale. To overcome this problem lithography may be implemented using near-field optical fields from non-traditional masks,[80] but this technique has not been applied to the fabrication of ZWMs. The first published work demonstrating the fabrication of ZMWs by Webb et al. used direct e-beam lithography and a positive tone photoresist to produce an etch mask on a metal layer, e.g. aluminum, which was thermally evaporated onto a quartz coverslip. Inherently anisotropic reactive-ion etching was then used to form the nanopores [81]. While effective at producing functional ZMWs which could be used for single-molecule enzyme analysis, this method requires careful tuning of the etch process and serial direct-write e-beam lithography.
To overcome these issues, protocols based on negative-tone photoresist were introduced. In negative tone the exposed resist remains after development resulting in a pillar where a nanopore will be fabricated rather than a cylindrical hole. As shown in Figure 2, the metal layer is deposited after the resist is applied, developed, and exposed, so it is blocked from the surface where the photoresist pillar remains. The metal is then removed when the photoresist is stripped, negating the need for a separate etch step. Metal lift-off can prevent problems in fabrication due to native oxide formation, which adversely affects etch steps, as well as incomplete or over-etching of the metal layer. Since a metal-specific etch is not required, nearly any metal that can be deposited by thermal evaporation or physical vapor deposition (PVD) can be used without significant alterations [82]. In addition, metal lift-off can be combined with deep-UV lithography to create large numbers of nanopores in parallel without the need for serial electron-beam writing of the sample, making ZMW fabrication in large (wafer-scale) quantities possible. However, metal lift-off introduces new constraints on the design of the ZMW array, since fabrication becomes more difficult with increased cladding layer thickness and pore density, due to photoresist thickness and proximity effects, respectively [82].
Figure 2.
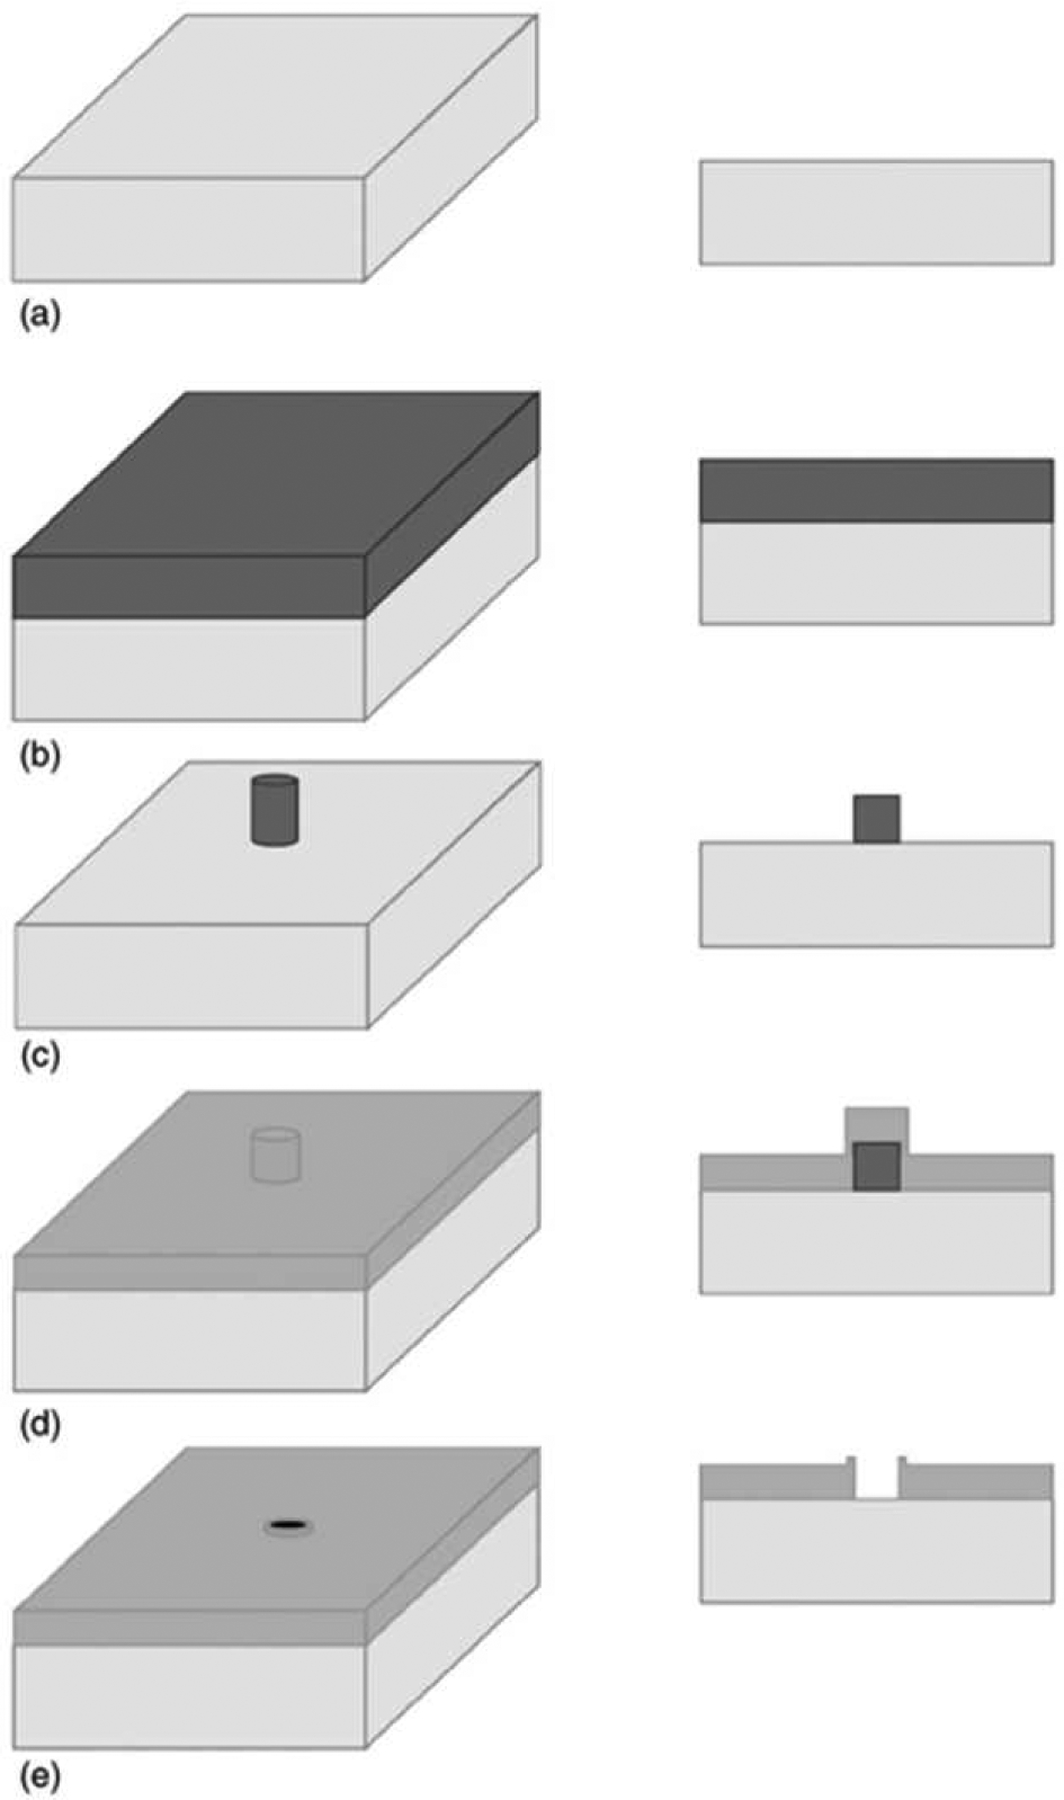
Schematic description of the metal lift-off method using negative photoresist. (a) Bare substrate. (b) Photoresist coated onto substrate and hardened with post-bake. (c) After pattern is written with electron-beam writer, pillars are developed and remainder of resist is removed. (d) A metal layer, such as aluminum, is deposited on substrate.(e) Metal lift-off reverses the pattern and reveals the nanopore/ZMW. In each panel the left image is a perspective view, and the right shows a cross-section. (Reproduced with permission from [82]. Copyright IOP Publishing Ltd. All rights reserved.)
One possibility for overcoming the limitations of metal lift-off is to use photolithography/lift-off to define a larger-scale pattern that is then reduced by another method. For example, Tang et al. used conventional UV photolithography to fabricate large (2 μm) holes in a metal surface, which were then reduced to a final dimension as small as 70 nm by electrodeposition [83]. This technique can address thicker metal layers than direct metal lift-off while achieving facile control of final nanoaperture diameter. However, control of electrodeposition conditions, including temperature, electrical current, solution circulation and concentration, introduces multiple parameters that need to be optimized. In addition, the process cannot fabricate high-density ZMW arrays due to the hole spacing defined during the UV lithography step.
3.1.2. Focused Ion Beam Milling
Focused ion beam (FIB) is widely used for fabricating nanoscale structures, including nanoapertures, because it is a direct-write method capable of precisly creating very small feature sizes. FIB techniques utilize a high-energy particle beam, usually Ga+, which is accelerated, collimated, and focused through appropriate ion optics onto a substrate material in a high-vacuum environment. The ion beam imparts energy on a very small area - the high momentum of the ion beam resulting in an extremely short DeBroglie wavelength, allowing for a tight focus and reduced forward- and back-scattering compared to electrons or photons [84].
Four main processes may result from FIB interaction with the substrate. The first, which is of most relevance to ZMW fabrication, is milling, where material is removed from the substrate through sputtering. During milling, sputtered material from the substrate may be redeposited, the substrate may swell, and amorphization of the underlying material may create non-idealities in the finished device. FIB may also be used to alter substrate properties, such as conductivity, through ion implantation, i.e. doping. Reagent gas may be injected into the local volume where the ion beam bombards the substrate, leading to two additional processes: ion-induced deposition adds material to the substrate, using the beam energy to localize a chemical vapor deposition (FIBCVD) process, or material may be removed from the substrate through FIB–assisted etching (FIBAE) where the ion beam activates a chemical reaction between the surface and an adsorbed chemical species or reactive precursor gas, altering the milled shape [84].
These processes make FIB a versatile fabrication method. The simple direct-write approach enables facile formation and modification of nanopore arrays - similar to e-beam lithography, but without the need for photoresist or preparation steps, because FIB patterns metals and semiconductors directly. Key parameters determining precision and feature size achieved by FIB milling include the beam current, energy, and size, which are functions of the focusing optics and substrate interaction. Thus, monitoring and validation are required for close control of pore depth, and wafer-scale processing is impractical. Redeposition of sputtered material may require a subsequent cleaning step. Because the size of an FIB-milled nanopore is governed by the focus of the ion beam, fabrication of nanopores larger than the critically-focused beam spot size may limit reproducibility.
In our group, we have used FIB milling to fabricate Au-clad ZMW arrays with interpore spacing ranging from 5 μm [85] to 2 μm [86] to 250 nm [87,88]. The versatility of the FIB milling technique is demonstrated by the simultaneous fabrication of large (d > λc) pores, used as alignment marks, Figure 3(a), to locate an array of small (d < λc) pores, Figure 3(b), enabling alignment of the sub-diffraction-sized ZMW array in an optical microscope. As shown in Figure 3(d), the FIB milling process produces conical frustum-shaped nanopores, rather than cylinders, as would be formed via metal lift-off or dry etching methods. This distinctive shape affects both the confinement of chemical species within the pore as well as the spatial distribution of the optical field. Promising new techniques such as inverted FIB milling may expand the abilities of FIB milling in the future, for example, by milling sub-wavelength features within nanopores [89].
Figure 3.
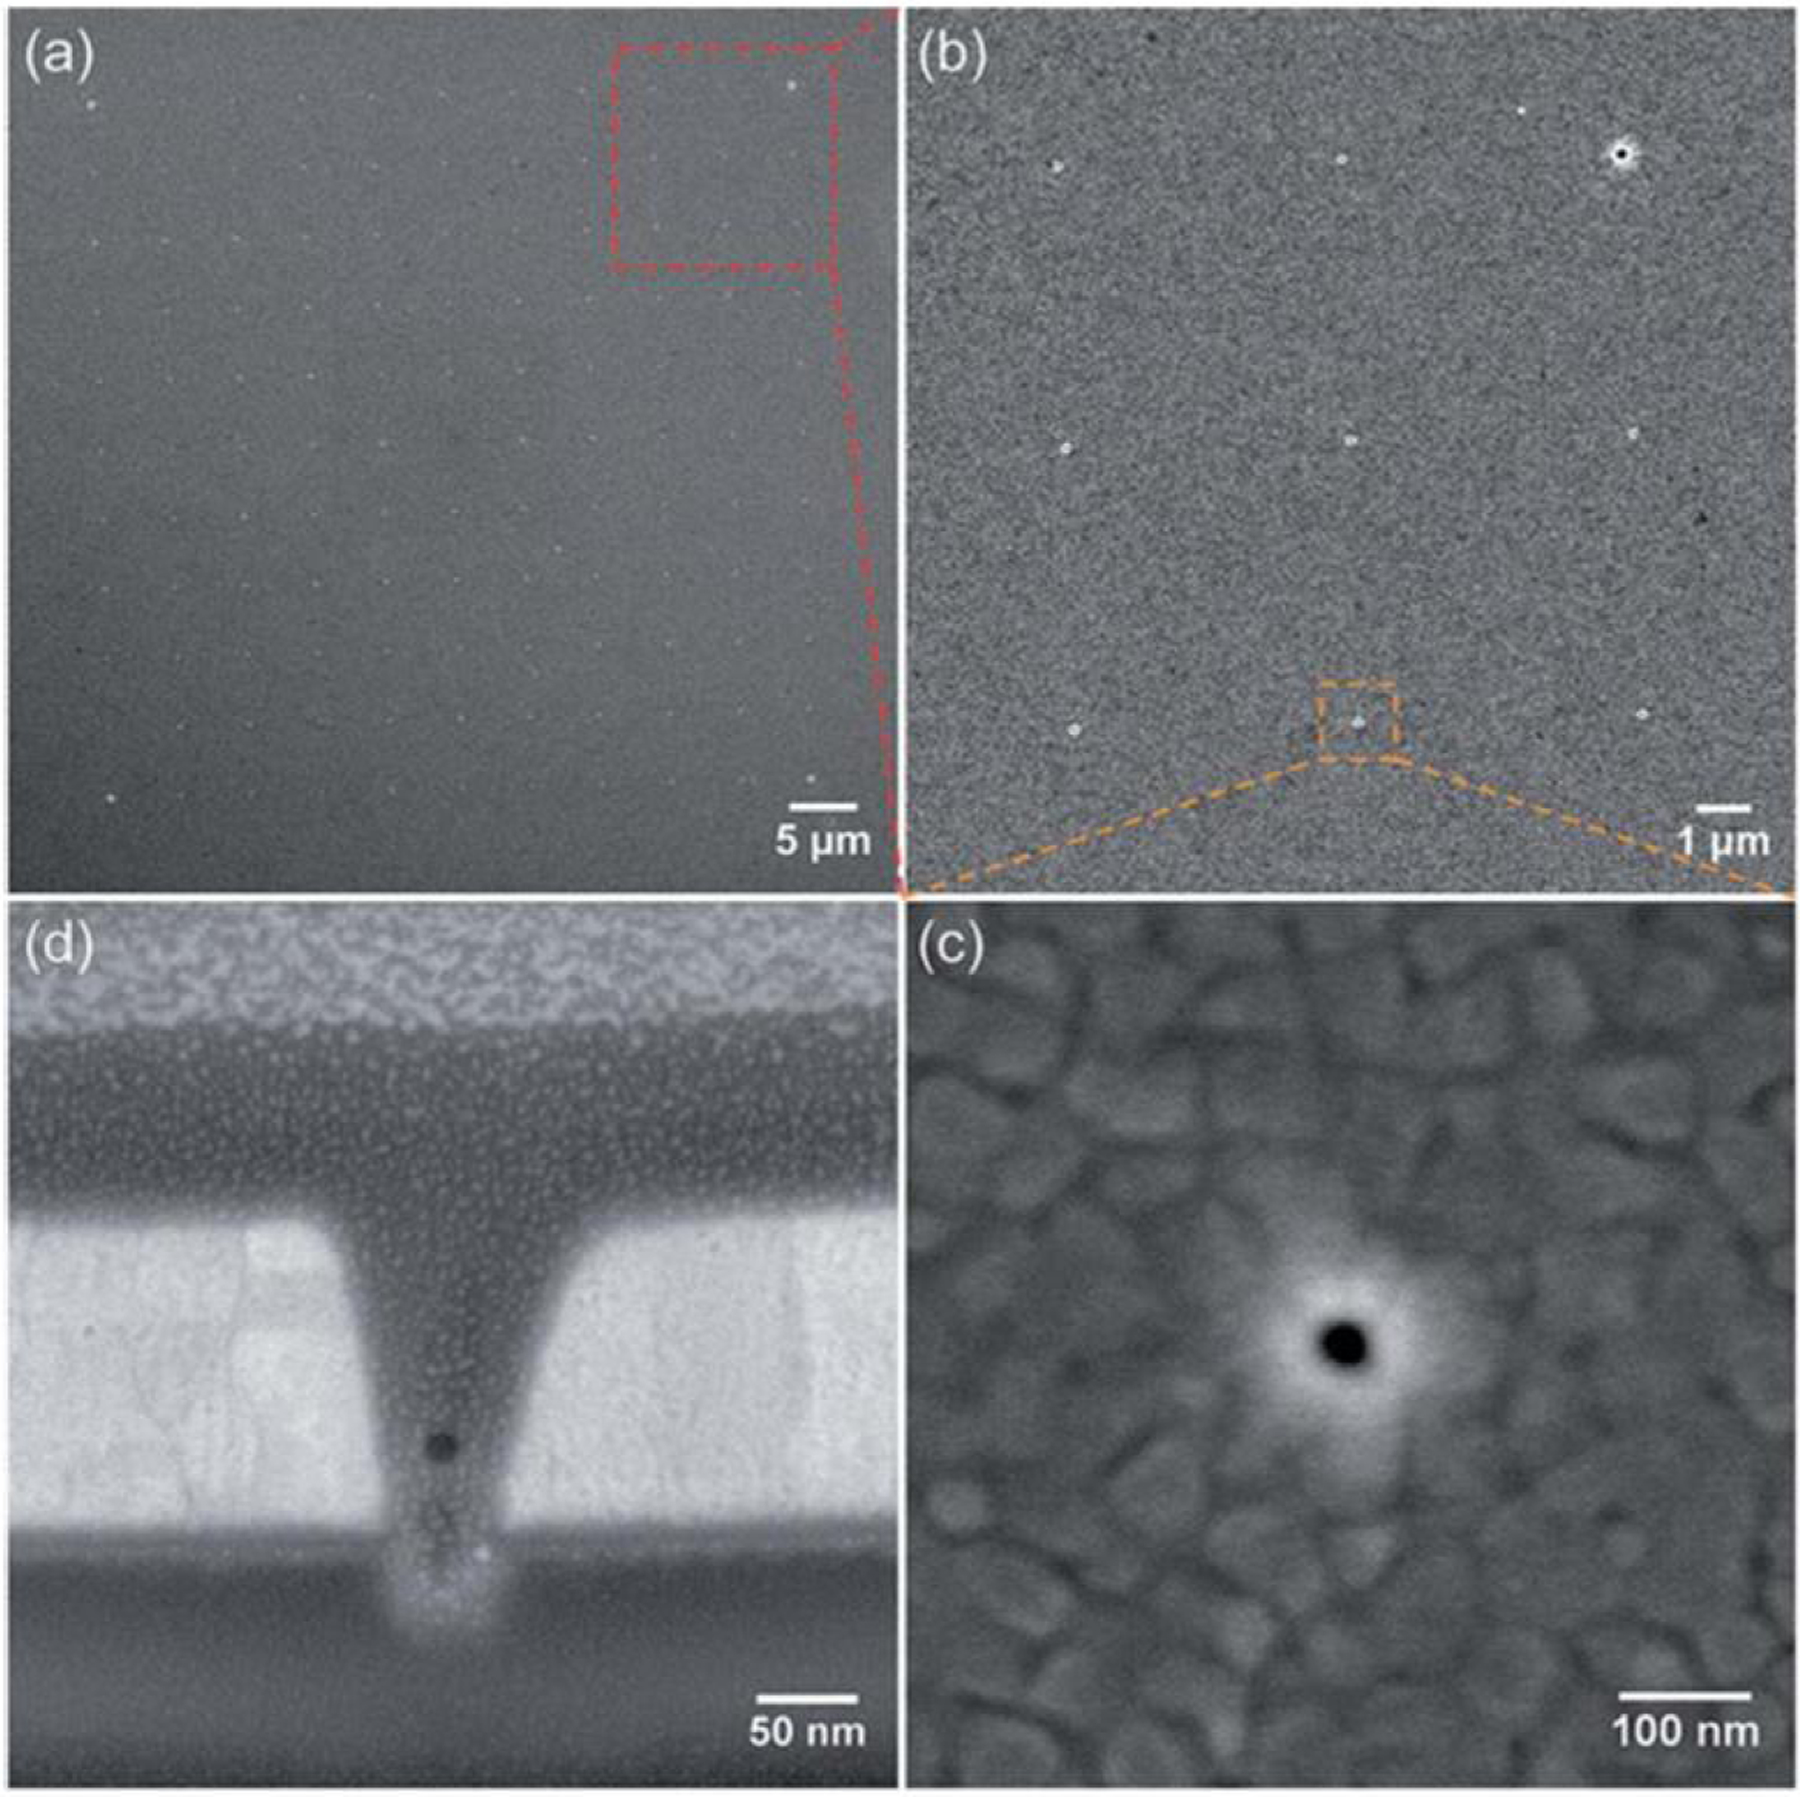
ZMW nanopore array formed by FIB milling and imaged via SEM. (a) Plan view showing a square array of 121 (11 × 11) nanopores, (b) Magnified view showing 9 (3 × 3) pores from the array, (c) Single nanopore, diameter of approx 40 nm, (d) Nanopore cross-sectioned with FIB with a protective Pt layer to assist in imaging. (Reproduced with permission from [85]. Copyright 2015, Royal Society of Chemistry.)
3.2. Surface Modification
3.2.1. Passivation
The inherent ability of ZMWs to isolate zepto- and atto-liter volumes from a bulk chemical solution carries with it an intrinsically high surface-area-to-volume ratio. While this can be helpful when significant wall interactions are desired, it complicates the problem of nonspecific adsorption which contributes to background noise. In addition, depending on the experiment, it may be desirable for the transparent lower bottom of the ZMW to exhibit a different surface functionality than the metal cladding side wall. Thus, selective and stable surface-blocking methods are needed.
One of the first, and still most common, methods is physical adsorption of bovine serum albumin (BSA), a protein which adheres to the surface and resists nonspecific adsorption of other proteins. BSA is a total passivation method which has proven effective in experiments examining DNA sequencing within ZMWs [81,90,91], ligand binding events [12,92], and protein interactions [93,94]. A caveat in its use is that BSA may bind to unbound fluorescent labels, giving rise to fluorescence noise. Thus, once BSA is used to passivate the surface, it should be included in all subsequent solutions introduced to the ZMW, or it may desorb thus degrading surface passivation [95].
Aluminum-based ZMWs can be selectively passivated using aluminophosphonate (Al-O-P) chemistry, which can bind a polyvihylphosphonic acid (PVPA) coating to the pore wall, producing a ca. 2 nm passivating layer [91]. Biotin-funtionalized poly(ethylene glycol)-trimethoxysilane (PEG-TMS) may then be deposited to achieve a ZMW with a biotin-functionalized bottom surface [90]. Similar ZMW arrays are now available commercially from Pacific Bioscience, in which BSA is used to reduce overall nonspecific binding [92].
3.2.2. SiO2/Metal Chemical Orthogonality
General strategies for surface derivatization may be extended by activating some areas of the ZMW while retaining surface passivation elsewhere. Selective modification is similar in concept to nano- and miro-scale surface patterning used to render biosensor surfaces similar to natural cell and extra-cellular environments [96]. This concept is manifested in variety of techniques; for example, using self-assembled monolayers with different identities on gold vs. alumina areas has been described as “orthogonal self-assembly” [97]; TiO2-organophosphate vs. PEG-SiO2 functionalization was termed “selective molecular assembly patterning” [98]; and thiol-Au vs. silane-SiO2 chemistry, “substrate selective patterning” [99]. Conceptually, these all share the common characteristic that two functionalization species are used with excusive reactivity to one of the available surface compositions.
Using a Au metal cladding layer instead of Al opens new possibilities for surface engineering and enhanced ZMW behavior. While at some wavelengths Al is better suited for ZMW use[58], exhibiting beneficial properties such as a short skin depth and high reflectivity [52], practical options for surface functionalization are limited. In contrast, Au is well-suited for chemical and electrochemical experiments, due to its enhanced resistance to oxidation and well-studied Au-thiol binding chemistry which has been used extensively to produce self-assembled monolayers on gold surfaces [100–104]. Other chemistries for fabricating self-assembled monolayers on gold, such as alkylsilane-Au [105] and silsesquioxane [106] covalent bonding, have also been demonstrated. With appropriate choice of end group functionality, the different surfaces of SiO2 and thiol-functionalized Au wall surface may be used to for selective patterning [107] allowing an even greater variety of specific binding interactions to be examined in the ZMW optical probe volume.
Kinz-Thompson et al. [108] demonstrated an application of SiO2/AU orthogonality to effectively bind fluorophores to the bottom SiO2 surface of a ZMW array in an Au layer through careful choice of end-group functionality for poly(ethylene glycol) (PEG) molecules. Methoxy-and thiol-functionalized PEG were bound to the Au wall surface of the ZMW, thus passivating the surface to the fluorophore, while methoxy- and biotin-funtionalized PEG were localized to the bottom SiO2 surface, with the biotin end-group exposed for further biotin-streptavidin interaction as show in Figure 4.
Figure 4.
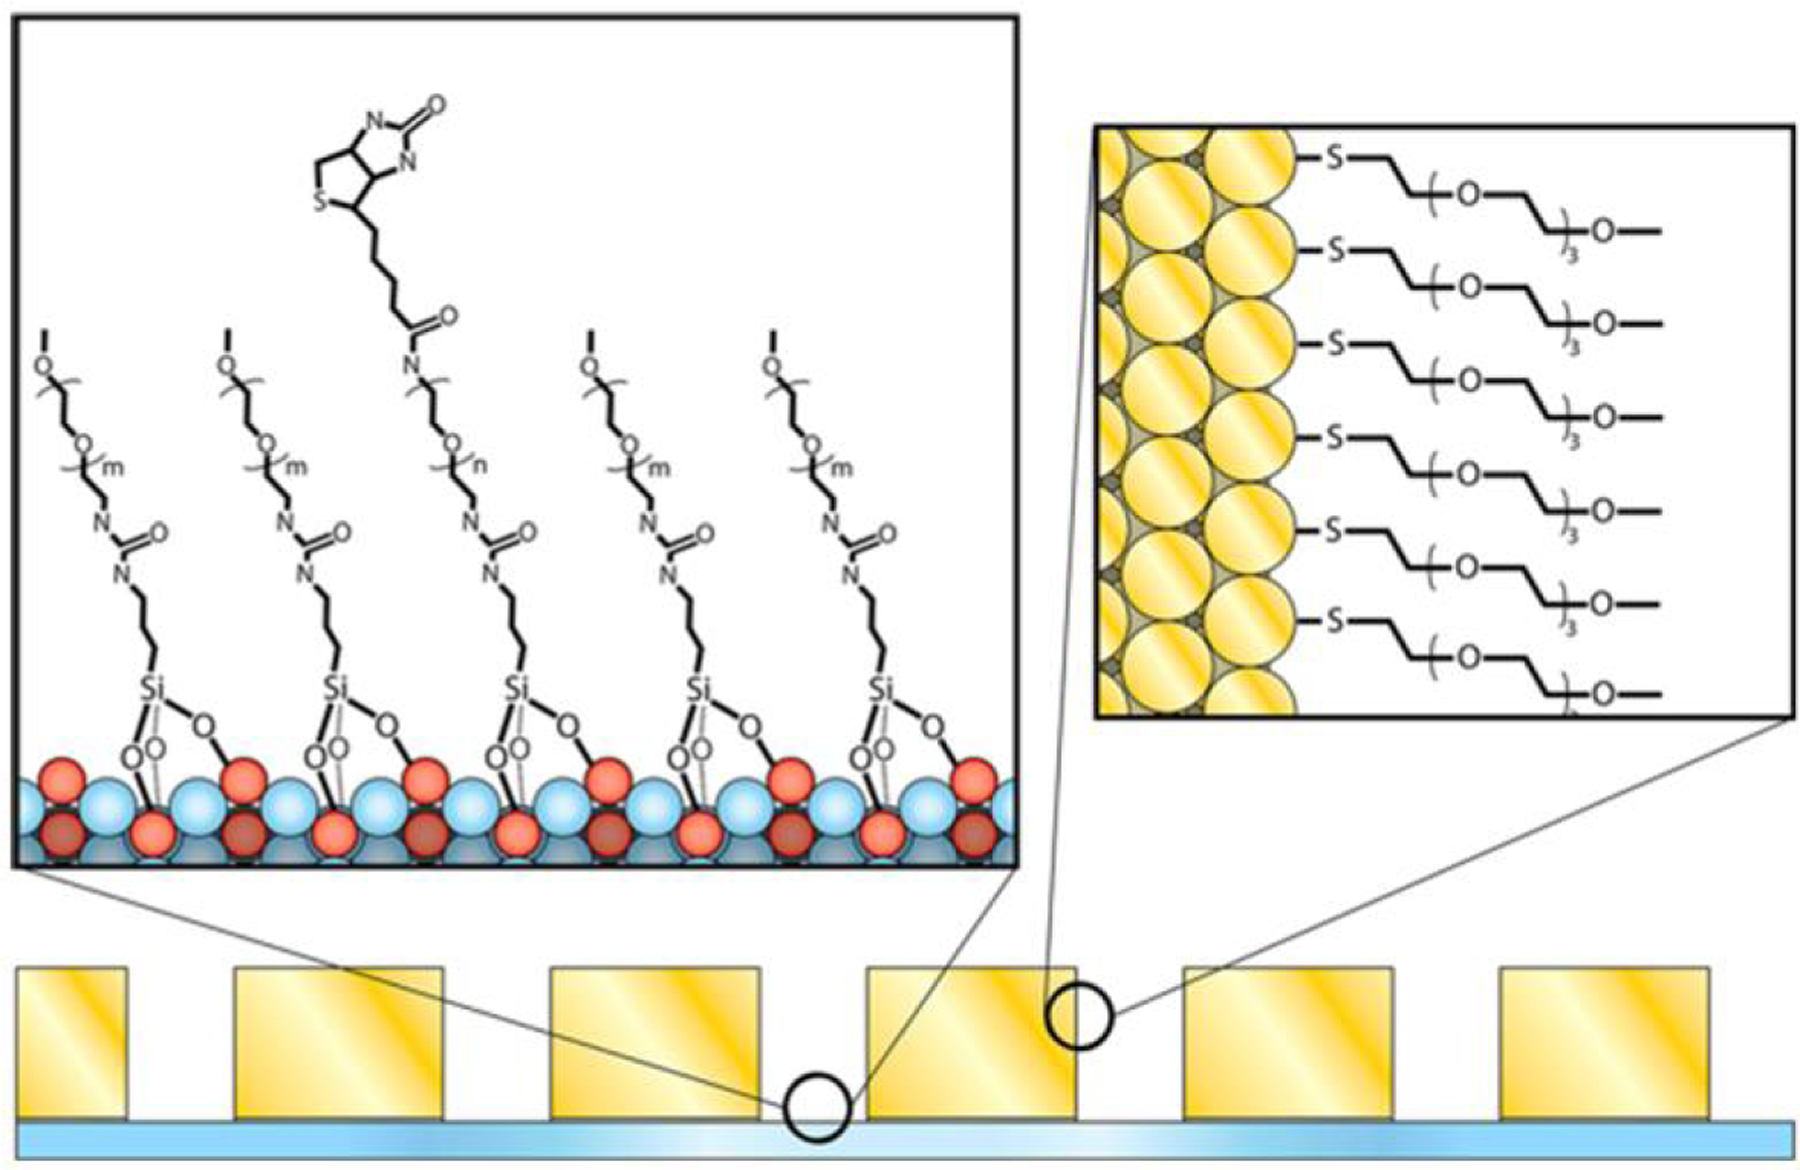
Selective passivation scheme for ZMW arrays in a gold metal cladding layer. A self-assembled monolayer (SAM) is formed via Au-thiol chemistry with mPEG-SH on the exposed metal surfaces. A mixture of biotin-PEG-Si and mPEG-Si forms a SAM on the the borosilicate bottom surface of each nanopore. (Reproduced with permission from [108]. Copyright 2013, American Chemical Society.)
In our laboratory, Au-clad ZMWs were constructed for single catalytic turnover studies using monomeric sarcosine oxidase (MSOX). A ZMW array was FIB-milled into a ~100 nm Au layer, after which the exposed Au surface was passivated with 2 kDa PEG-thiol. The bottom SiO2 surface was then silanized, after which MSOX was bound via glutaraldehyde [109]. Exploiting the SiO2/AU orthogonality allowed the dynamics of single MSOX enzymes to be studied [110].
3.3. Articulated Nanopores for Multifunctionality
Multifunctional ZMWs may be realized by using the component layers for multiple tasks. For example, the optical blocking layer may be used as a working electrode to effect potential control, yielding an electrochemical ZMW (E-ZMW). Previously, our group has developed bifunctional E-ZMWs [85,86], as shown in Figure 5. These structures are fabricated on an optically transparent substrate, so that the nanopores are bifunctional nanophotonic-nanoelectrochemical architectures, which can be used to characterize potential-dependent fluorescence dynamics under both single and double electrode configurations. The small volumes enclosed by the active region of the E-ZMW, their close proximity to the working electrode, and the small distances over which diffusive mass transport occurs combine to give the E-ZMW system powerful new properties, including the ability to observe electron transfer dynamics at the level of single electron transfer events [88].
Figure 5.
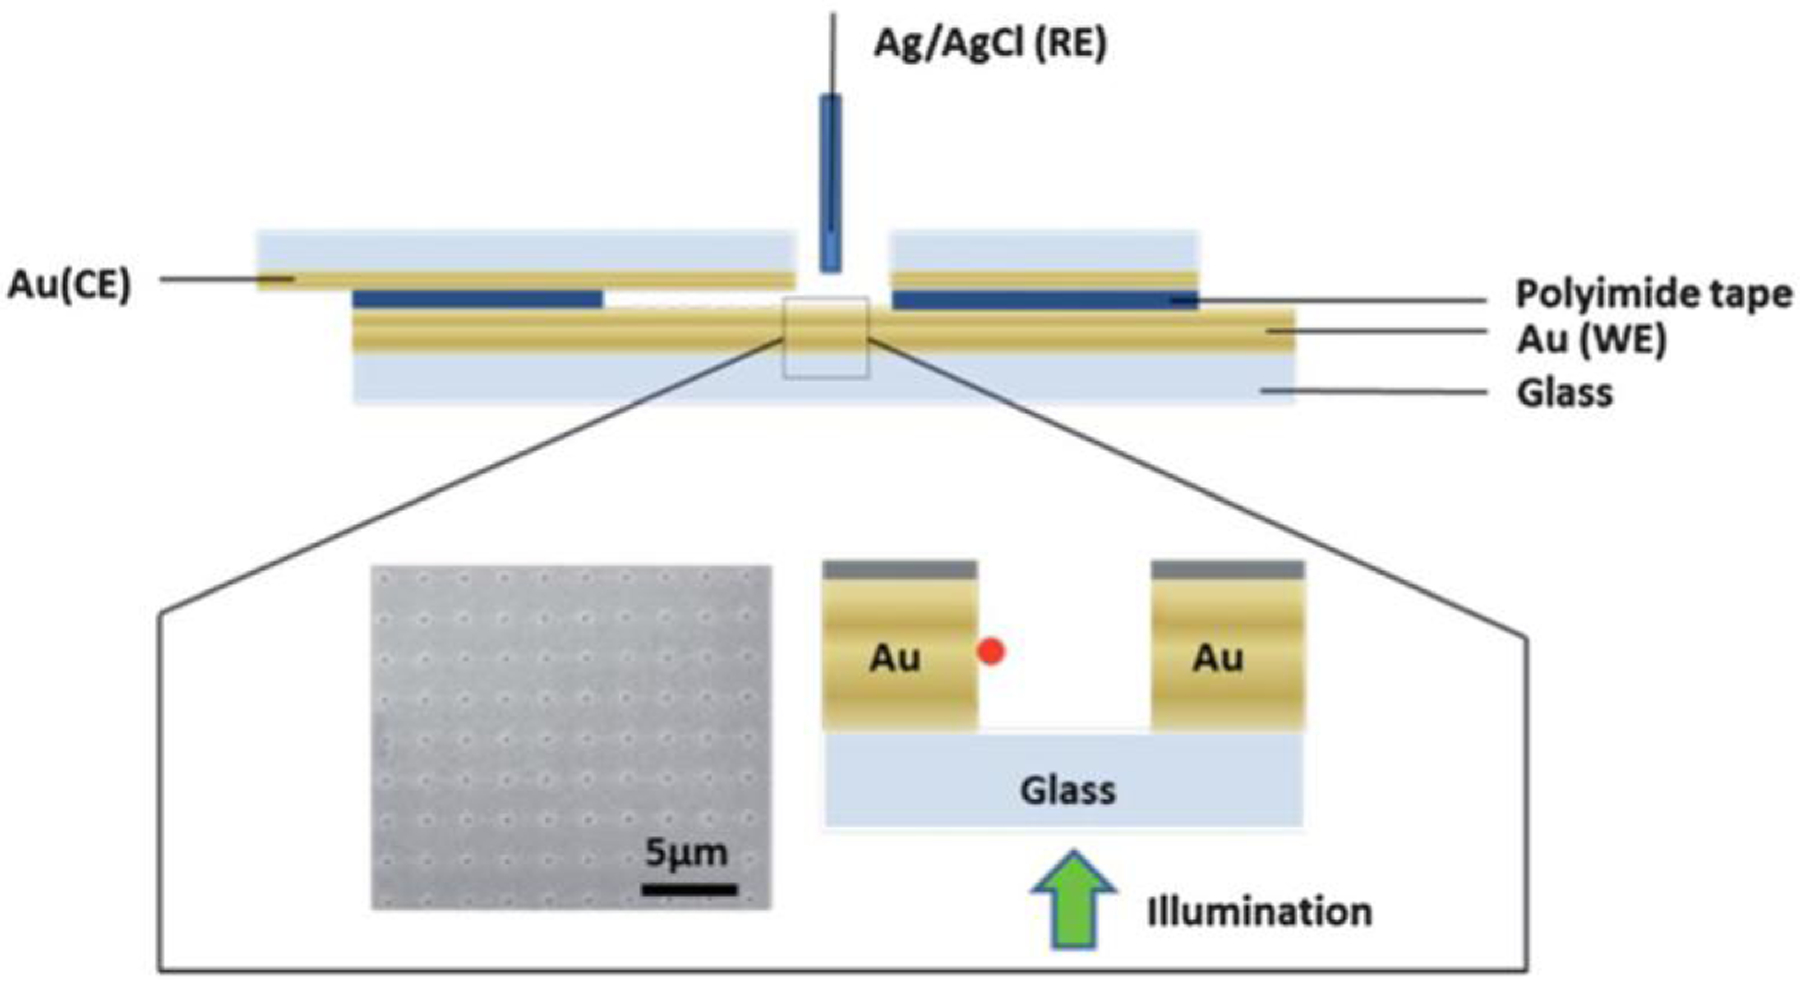
Physical configuration to integrate a ZMW array in a solution-based electrochemical cell. The ZMW array is used as the working electrode, while a Au-coated coverslip is used as the counter electrode. A Ag/AgCl reference electrode is inserted through a hole in the coverslip used to fill the device. Nanopores are formed in a 5 × 5 μm array with a pore diameter of ~100 nm and a period of 2 μm and illuminated from below the device as indicated. (Reproduced with permission from [86]. Copyright 2013, Royal Society of Chemistry.)
4. ZERO-MODE WAVEGUIDE APPLICATIONS
4.1. Freely Diffusing Systems
4.1.1. Residence Times
In FCS, fluorescence emitted from an observation volume is measured over time, with fluorescence fluctuations arising as molecules diffuse into and out of the observation volume being autocorrelated. Because the technique relies on the presence of a small number of molecules within the observation volume, the working concentration of FCS experiments is inversely proportional to the observation volume. Thus, ZMWs are well-suited to achieving FCS measurements at high concentrations of freely-diffusing species, as first demonstrated in the seminal work of Levene et al. [81]. In that experiment, ZMWs of varying diameters were studied, demonstrating the feasibility of FCS measurements at biologically-relevant concentrations and confirming the expected relationship between ZMW diameter and mean residence time, with smaller ZMWs producing smaller optical excitation volumes and, thus, shorter residence times.
ZMW-based designs were later extended to dual-color fluorescence cross-correlation (FCCS) by combining two excitation sources and two appropriately-chosen fluorescent labels to monitor enzyme-catalyzed cleavage reactions, with kinetic information obtained through cross-correlation of the fluorescence intensity time series from the two color channels [111]. Similarly, inverse-fluorescence FCS was shown by Vogel et al. to be an effective combination with ZMWs in the study of single-protein and single-nanoparticle diffusion. By observing the decrease in fluorescent intensity as high initial concentration of fluorophore was replaced by non-fluorescent proteins/nanoparticles, non-fluorescent biomarkers could be studies at relatively high concentrations in a label-free fashion[112]. New FCS techniques in ZMW devices continue to be explored, such as recent UV-FCS measurements showing changes in fluorescence lifetime as a function of the quantum efficiency of the emitter and ZMW diameter in Al ZMWs of various sizes from 60–110 nm [113].
Our group has leveraged the unique properties of E-ZMWs to examine the behavior of freely-diffusing fluorescent molecules in a controlled potential environment [85]. Flavin mononucleotide, which contains an isoalloxazine chromophore, is fluorescent when oxidized (FMN) but dark when reduced (FMNFh). It was observed at single-molecule occupancy conditions enabled by the zeptoliter-scale excitation volume of each nanopore in a ZMW array even at μM concentrations. At 〈n〉 ~ 1 occupancy, any given single molecule exhibits a residence time of 〈τ〉 ~ 2–5 μs within the ZMW excitation volume, depending on pore size and shape. With such small residence times, optical and electronic data collection pathways must be optimized for fast response; thus, avalanche photodiodes (APDs) rather than a more traditional electron-multiplied CCD were used for detection. Consistent with the potential-dependent emission characteristics of the isoalloxazine chromophore, increasing fluorescence intensity was observed at increasingly oxidizing potentials, as shown in Figure 6.
Figure 6.
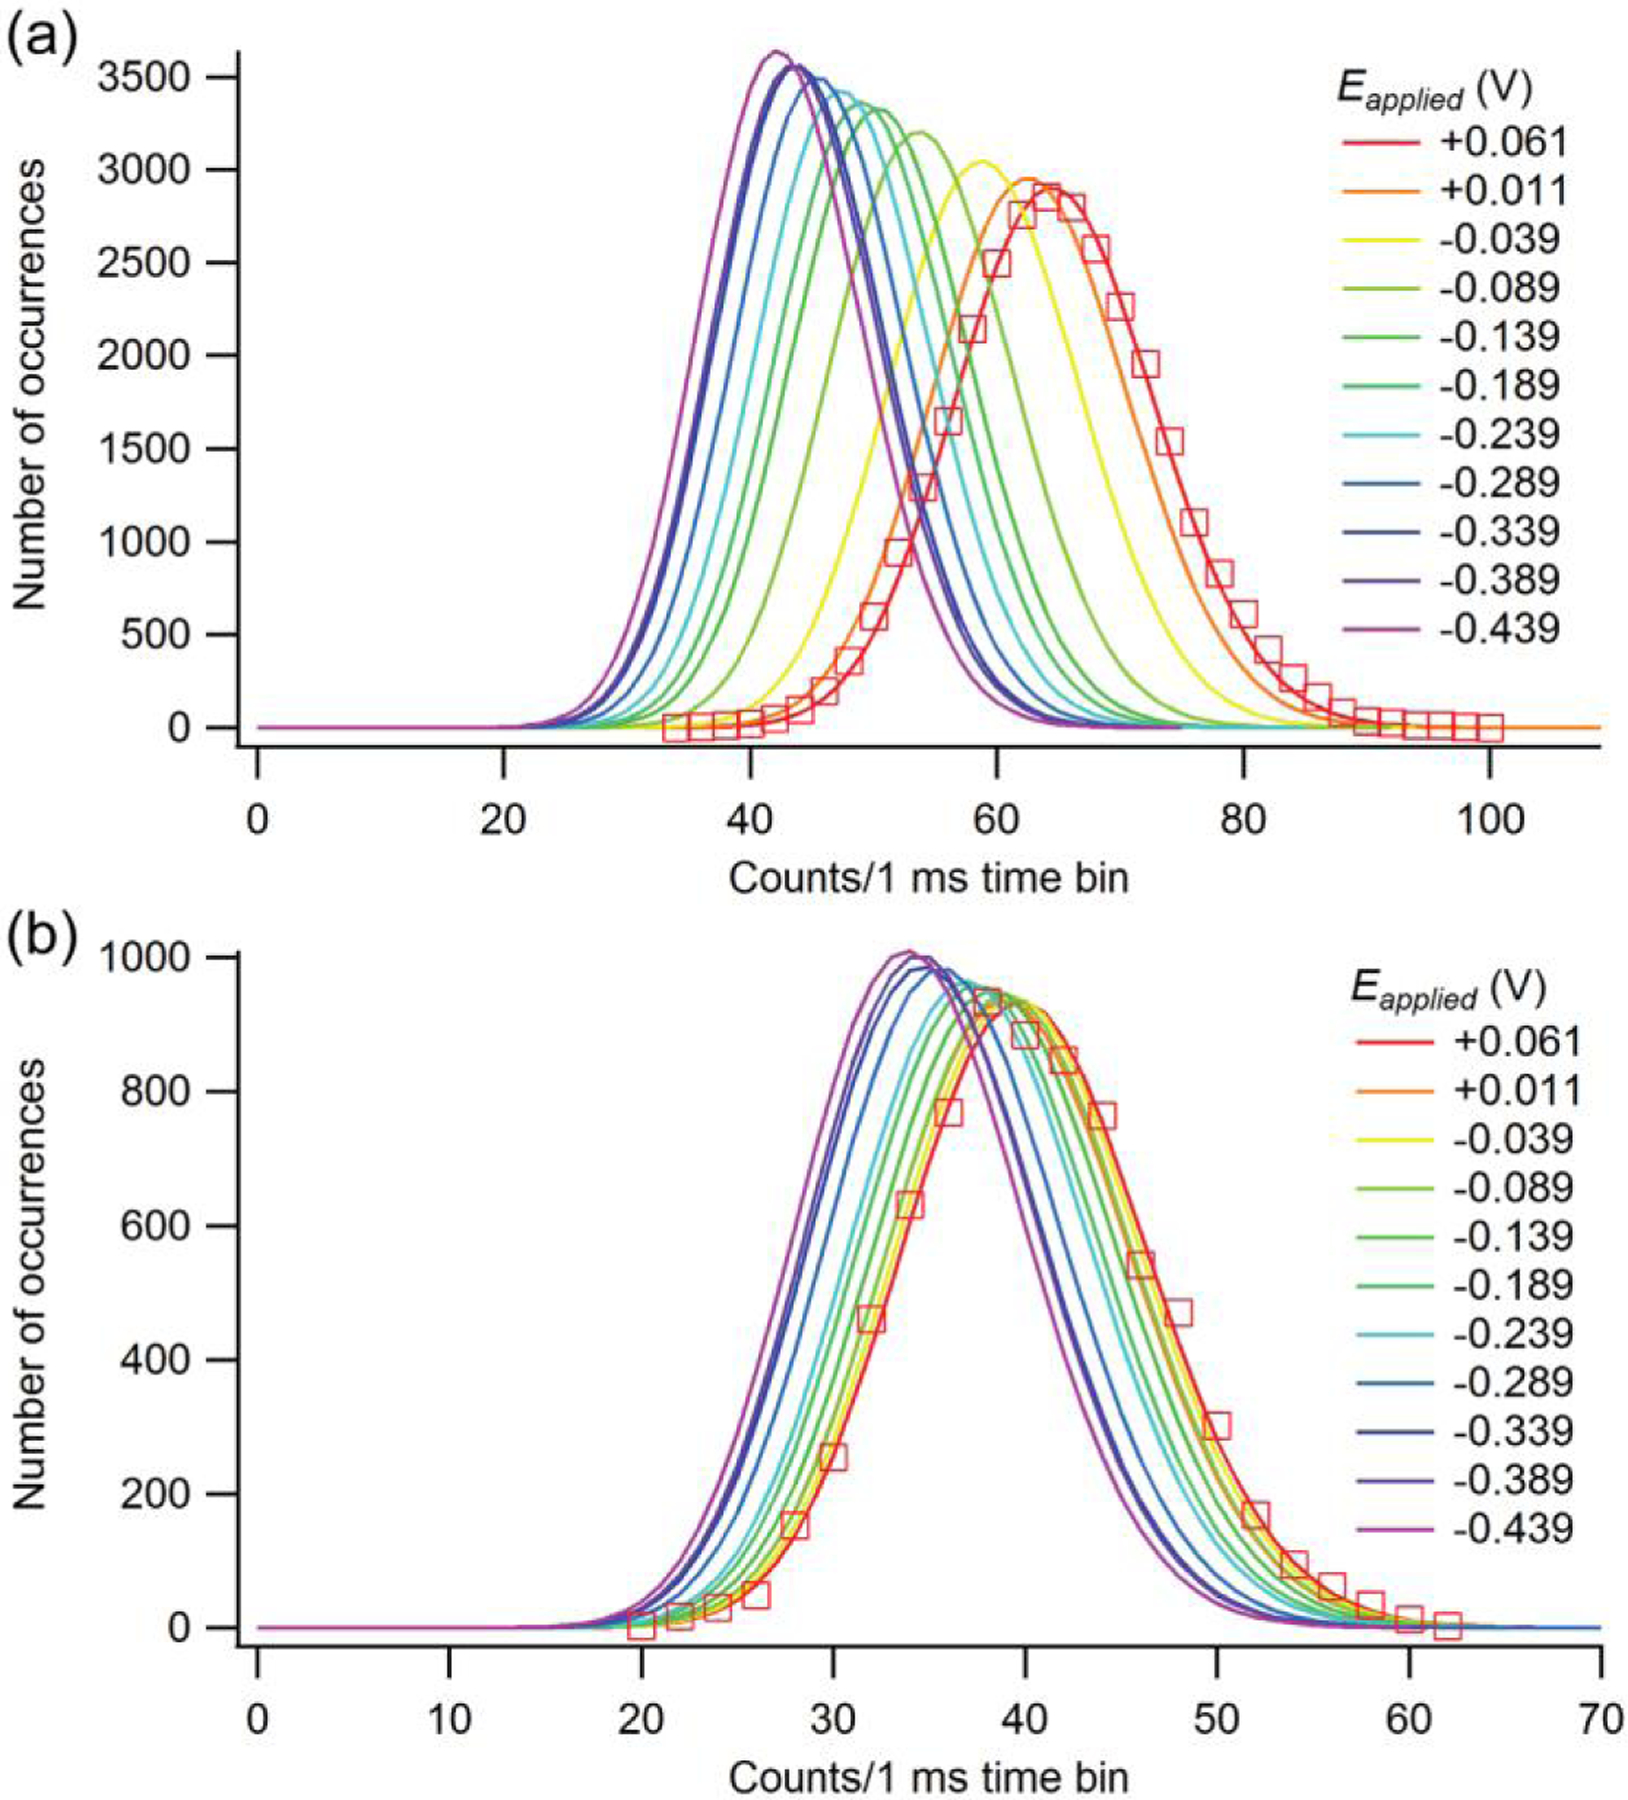
Fluorescence intensity histogram fits showing a change in fluorescence intensity as a function of the applied voltage. Two different fluorophore concentrations, with (a) 10 μM and (b) 1 μM of FMN are shown. Data points are shown for the Eappl = +0.061 V data set to illustrate the quality of the fit. (Reproduced with permission from [85]. Copyright 2015, Royal Society of Chemistry.)
4.1.2. Molecular Turnover
The E-ZMWs developed in our laboratory exhibit unique capabilities for spectroelectrochemical investigations of single molecule redox events. In particular, it is possible to carry out the single molecule fluorescence analogs of classic electrochemical experiments – for example, cyclic potential sweep single molecule fluorescence (analog of cyclic voltammetry) and single molecule chronofluorometry (analog of chronoampermetry). Here, the confinement properties of E-ZMWs are used in to probe small populations of fluorescent FMN species under controlled potential conditions. By varying the sweep rate of an applied triangular cyclic potential, the mechanistic pathways of the FMN redox process can be explored in more detail [85]. At faster sweep rates (0.5 V s−1) the fluorescence intensity is a symmetric function of applied potential, Figure 7(a), while slower sweep rates (0.05 V s−1) reveal an asymmetric response to the applied voltage, Figure 7(b). At extremely slow (0.001 V s−1) sweep rates, a distinct intermediate fluorescence response was observed, a behavior not observed in bulk (non-confined) cyclic voltammetry of FMN, Figure 7(c). We hypothesize that this intermediate fluorescence level arises from a neutral semiquinone species, which is stabilized by the unique, confined environment provided by the ZMW nanopore geometry.
Figure 7.
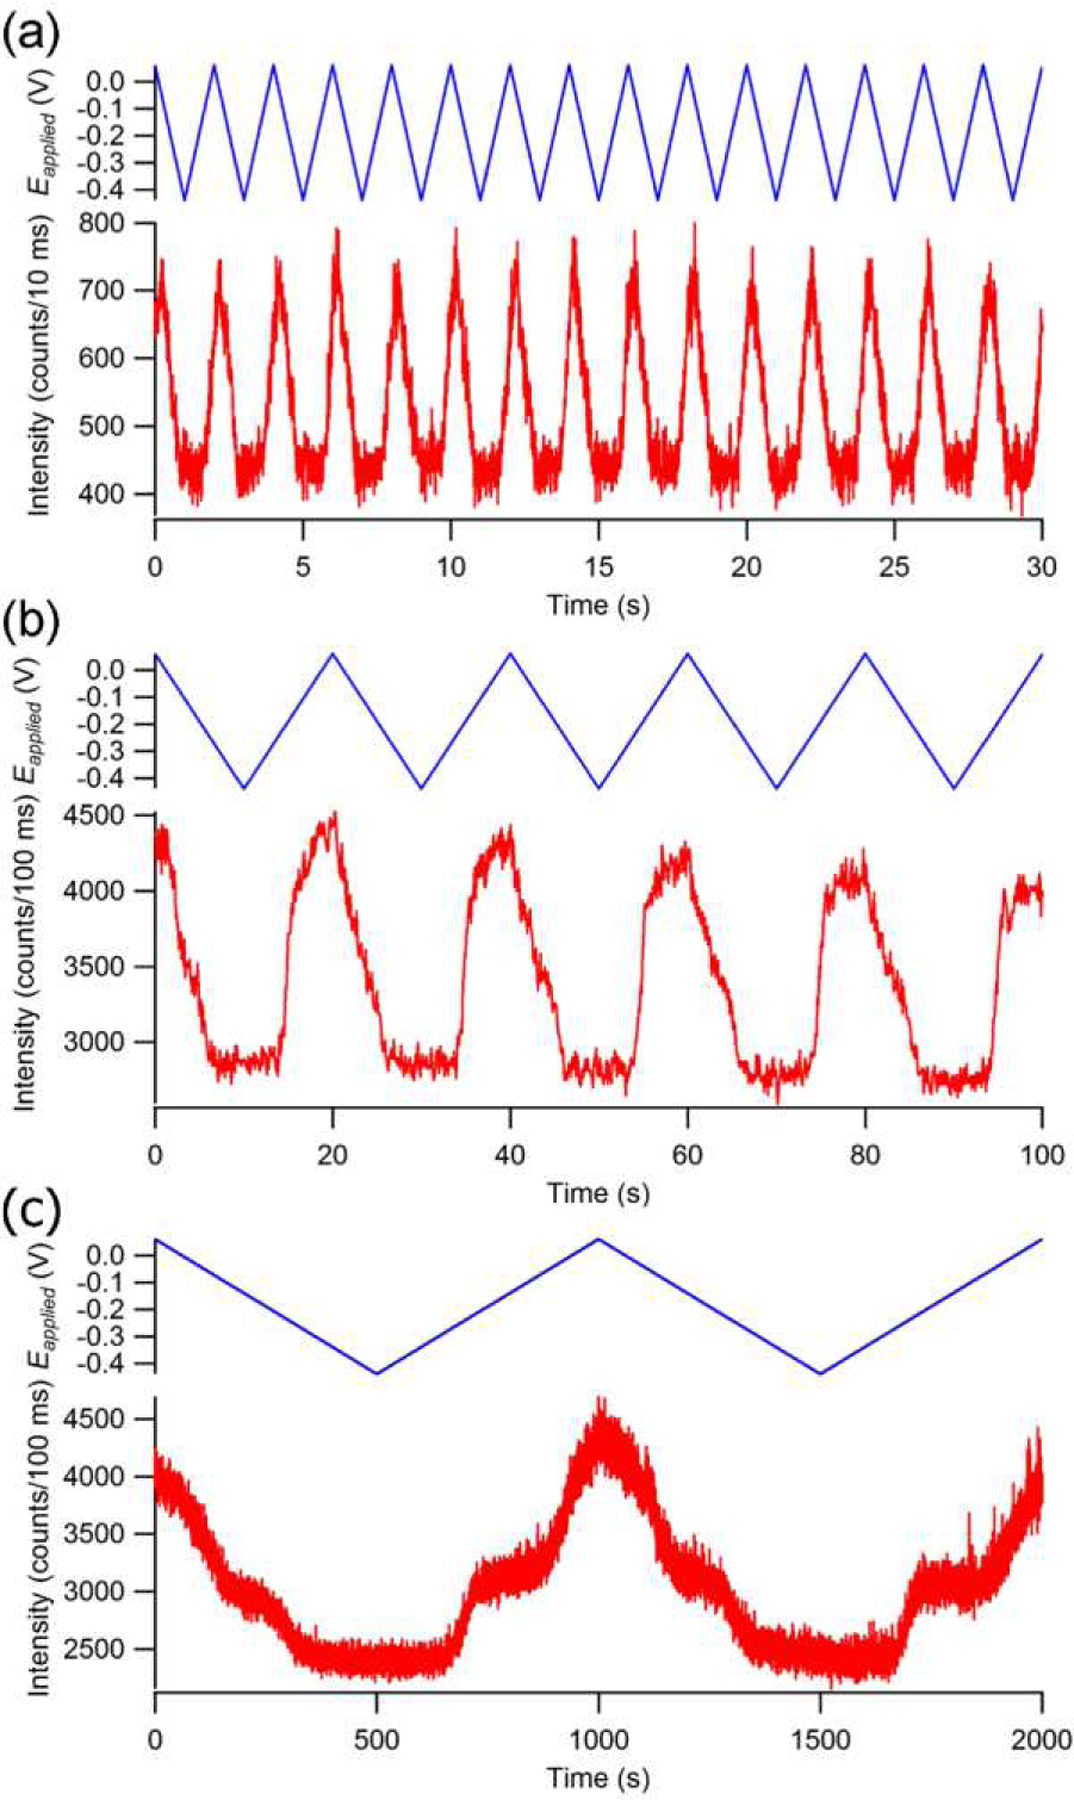
Fluorescence as a function of applied potential in a single pore of a ZMW array in 10 μM FMN in 100 mM citrate buffer. A triangular waveform (blue, top) is applied with a slew rate of (a) 0.5 V s−1, (b) 0.05 V s−1, and (c) 0.001 V s−1which affects the observed fluorescence intensity (red, bottom). (Reproduced with permission from [85]. Copyright 2015, Royal Society of Chemistry.)
4.2. Enzyme Activity
4.2.1. Immobilized Enzymes
We have also exploited the selective functionalization and passivation techniques made possible with Au-based ZMWs to also observe molecular turnover events using an immobilized, non-processive enzyme, monomeric sarcosine oxidase (MSOX) [110]. The enzyme was immobilized in the bottom of the ZMW pore, where the optical excitation intensity is highest, Figure 8, while the walls were passivated with PEG-thiol. MSOX contains an FAD cofactor, the fluorescence from which was monitored to follow the reaction dynamics of single enzyme molecules. Images of the ZMW array were analyzed to find statistical distributions of “on” and “off” residence times, allowing for more granular analysis of enzyme-substrate kinetics than could be obtained from average occupancy measurements. From these distributions, binding kinetics consistent with Michaelis-Menten theory were confirmed for the steady-limit, and the interaction of MSOX with two distinct substrates, sarconsine and L-proline, were clearly delineated. We explored the behavior of the FAD cofactor alone as a function of applied potential in the E-ZMW by functionalizing FAD on the sidewall of a Au ZMW array [86]. By varying the applied potential above and below the equilibrium potential, Eeq, it was found that the transition rate between “on” and “off” states for single FAD fluorophores was a strong function of potential, reaching a maximum around Eappiied = Eeq, as expected if the transition reflects the joint probability distribution of being in the oxidized or reduced states.
Figure 8.
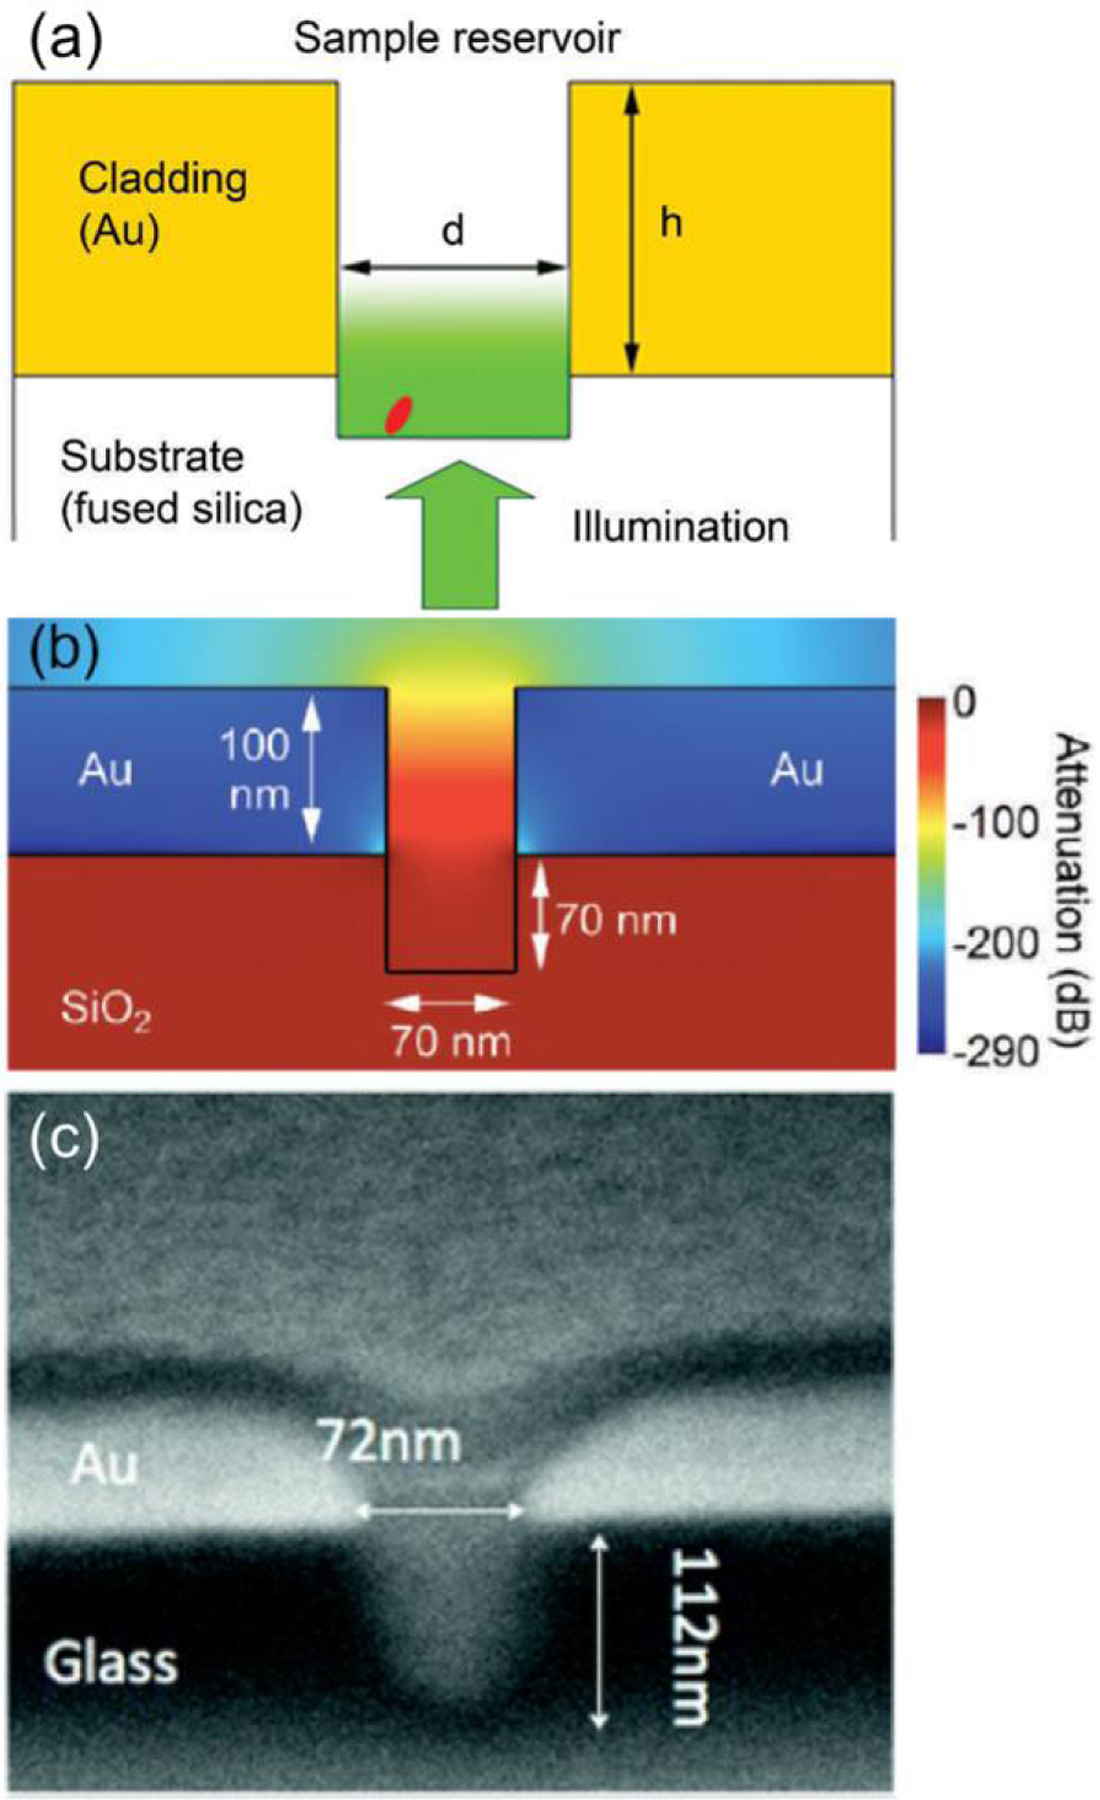
(a) Diagram of a ZMW nanopore used for MSOX immobilization. The incident radiation, introduced through the fused silica substrate, decays exponentially as a function of the vertical distance within the pore. A single MSOX enzyme is localized in the bottom (overetched) region of the pore. (b) Finite-element modeling shows the magnitude of the optical field amplitude. (c) Cross-sectional SEM image of a single ZMW. (Reproduced with permission from [110]. Copyright 2012, Society of Applied Spectroscopy.)
4.2.2. Processive Enzymes
Processive fluorescent enzymes have also been examined in ZMWs. Spudich et al. [114] used a unique adaptation of ZMW technology to examine the motor function of myosin V along actin filaments. The tight confines of cylindrical ZMWs, while ideal for observing freely-diffusing single molecules at high bulk concentrations, limit the size of actin filaments such that only a few processive steps may be observed. Instead, high-aspect trenches were fabricated with μm-scale lengths but ca. 50 nm widths to produce nanotracks in an Al film on fused silica. This unique design provided polarization-dependent confinement of light, with light polarized along the trench direction propagating similar to a subwavelength slit, while perpendicularly-polarized light was blocked. The long trench length allowed many enzyme steps of a single enzyme to be observed. The processive action was confined along the substrate, an actin filament, which was guided into the nanotrack by convex lens-induced confinement (CLIC), thus extending the observation time while minimizing background signal.
The linear ZMW concept can be extended to non-fluorescent processive enzymes as well. Yokokawa and co-workers used linear ZMWs were used to examine the mobility of kinesin along microtubules. Since the kinesin enzyme itself is not fluorescent, the microtubules were functionalized with fluorescent kinesin. The confinement provided by the Al linear ZMW decreased fluctuations typically observed from the movement of the microtubule itself, allowing for more direct observation of the enzyme kinetics directly [115]. Similar techniques are being adapted to the observation of other low-affinity enzymatic processes such as ATP hydrolysis [116].
Cylindrical ZMWs have been used for the study of complex, multi-pathway biological processes, such as RNA translation. With the enzyme immobilized on the glass bottom of an Al ZMW, the resultant small optical probe volume allows for high concentrations of the fluorophore, and the time resolution enables the study of time-dependent processes with multiple interactions using multi-channel wavelength-filtered detection [117].
4.3. Protein Interactions
The binding, folding, transport and interaction of proteins is important in understanding intracellular functions, but many of these reactions are difficult to study due to low affinity and short timescales of many of these reactions [118]. ZMWs offer a potential way to address these systems, as demonstrated by their use for studying high-throughput single-molecule real time sequencing of DNA [90].
4.3.1. Protein-Protein Binding
Molecular interactions within the nanopore are sensitive to changes in the surface functionalization of the pore. Electrochemical experiments have shown that with careful tuning of the nanopore surface chemistry, identification of certain nucleosides is possible [119]. For some low-affinity interactions, such as the oligomerization of λ-repressor, high μM concentrations are required to examine the equilibrium behavior of the molecule; traditional FCS is unable to examine single-molecule kinetics at such high concentrations, even when combined with TIRF or NSOM. However, ZMWs can effectively address these systems, since their sub-attoliter volume range renders single molecule occupancies at μM concentrations [12,120]. Similarly, ZMWs have been useful in examining the complex interactions of ribosomes with tRNA, showing the stochastic nature of tRNA-ribosome interactions and the effect of tRNA on the conformation of the ribosome [121]. With multiple approaches to increasing optical signal-to-noise, such as smFRET, and integrated microfluidics to simplify sample delivery, very weak protein-protein interactions with rare binding events may be studied in detail [94]. Proper surface passivation is needed in order to prevent aggregation of protein on the metal cladding layer, instead attracting the protein to the bottom of the pore, where the optical excitation field is most intense. The presence and motion of multiple proteins within the pore can be determined by labeling each protein with a unique fluorophore, yielding a multiplexed detection strategy [121], as shown in Figure 9.
Figure 9.
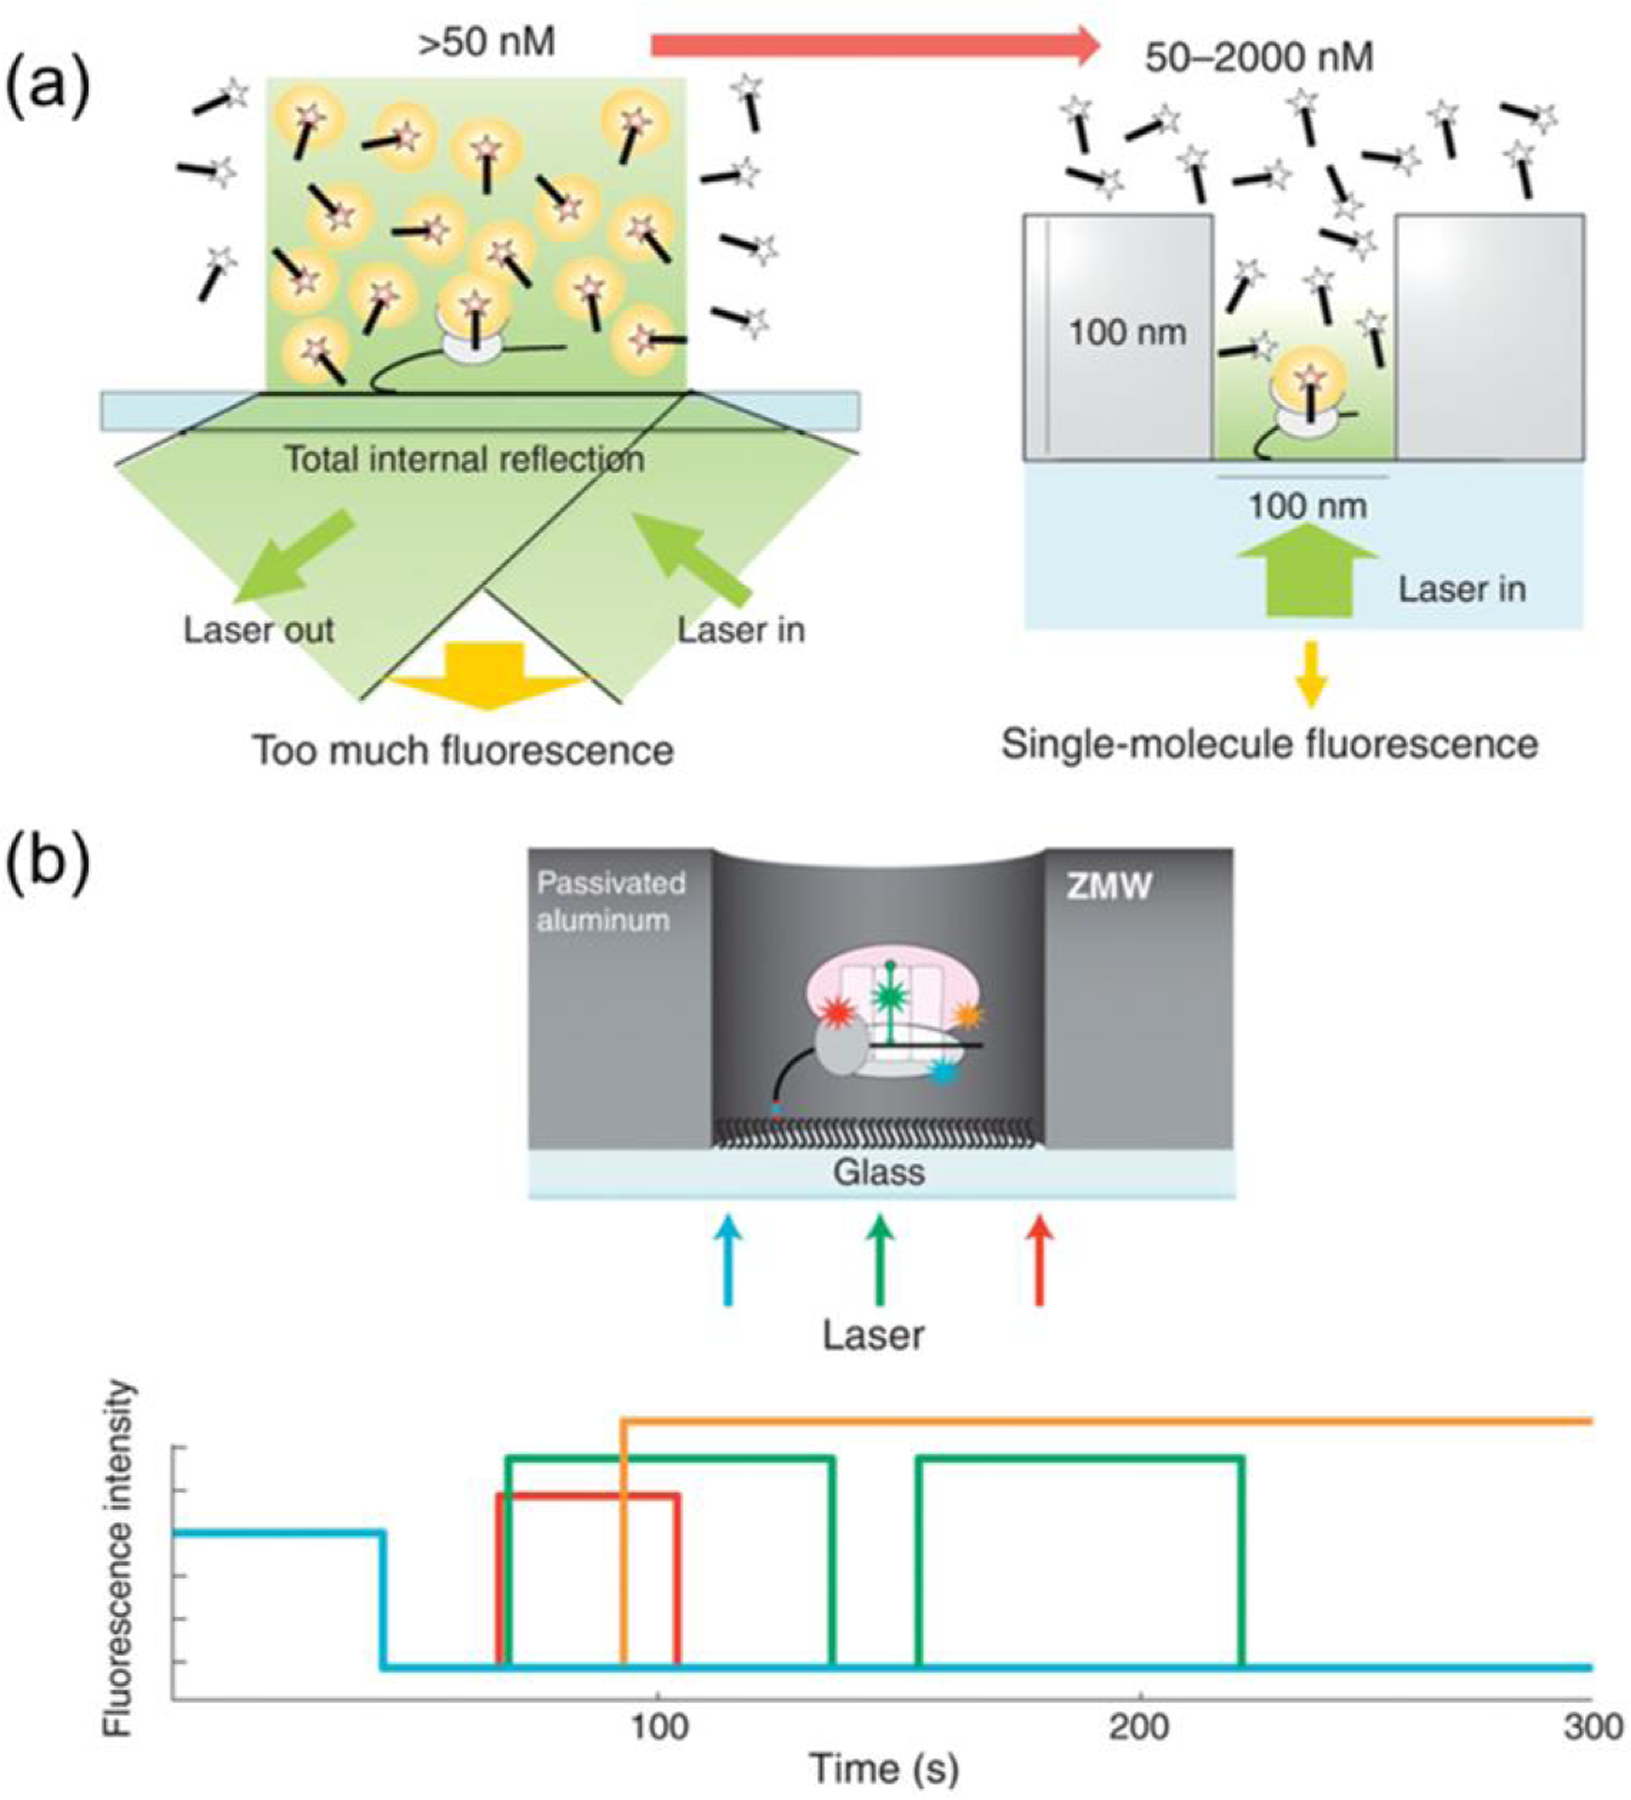
(a) Though TIRF microscopy relies on an evanescent field to excite diffusing fluorophores. Illumination extends ~150 nm into the solution, effectively limiting label concentration to < 50 nM. The spatial confinement of ZMWs limits illumination to the diameter of the nanopore and to ~ 20–30 nm from the pore bottom, increasing the working single-fluorophore concentration to > 1μM. (b) Selective passivation/functionalization of the nanopore is key to further decreasing noise from adsorbed fluorophores on the pore walls. With proper monitoring optics, a multiplexed observation system allows collection of data at several wavelengths simultaneously, enabling complex interactions such as ribosome translation on mRNA to be tracked with high time resolution at concentrations similar to in vivo conditions. (Reproduced with permission from [121]. Copyright 2016, Elsevier.)
4.3.2. Small Molecule Gating
For some selected applications, strict adherence to the Poisson-distributed molecular pore occupancies is problematic. To address these cases, DNA can be functionalized on the pore wall to preferentially bind molecules inside nanopores, thereby increasing the average occupancy of the ZMW array while still maintaining single-molecule occupancy conditions for each pore individually [122]. A related strategy uses voltage-controlled electromigration of proteins into ZMW nanopores to repeatedly fill/unfilll the pores and increase loading of large DNA strands within the pores above Poisson limits [123]. These approaches are especially helpful in exploiting the similarity of nanopore ZMWs to biological transport constructs and mechanisms, thus opening the possibility of examining such biological phenomena ex vivo and obtaining binding kinetic information without fluorescent labeling.
4.4. DNA Sequencing
4.4.1. Single Molecule Sequencing
Single oligonucleotide molecules have been probed electrically, by examining the solution impedance change as a molecule passes through a nanopore (d < 5 nm). This resistive pulse sensing approach yields information on the transport dynamics and some DNA intermolecular interactions, but it has to-date proven difficult to obtain sequence information [124]. However, adding single-molecule spectroscopic information, with the metallic nanopore membrane blocking the excitation from reaching the bulk, can enable optical detection of DNA molecule translocations over a wide array of pores, i.e. multiple parallel single-molecule events [125], thus enabling fluorescent sequencing of DNA with performance characteristics superior to that obtained through non-ZMW nanopores [126]. ZMWs used for DNA sequencing typically combine a ZMW nanoaperture, with an even smaller opening in the supporting substrate in order to orient each strand of DNA [123]. An alternate illumination method utilizes the scattering-plasmon interaction to illuminate the pore, potentially leading to label-free sequencing [127].
4.4.2. Current Capabilities
Spectroscopic multiplexing can be combined with DNA polymerase reactions to enable real-time sequencing using single polymerase enzymes. In experiments conducted by Korlach and Turner et al. [90] the low observation volume of ZMWs was used to enable the high nucleotide concentration required for polymerase sequencing, while limiting the optical probe volume to a single polymerase enzyme, thereby enabling real-time detection. By carefully controlling the fluorescent labeling of dNTP substrates and the surface chemistry of the pores, detection of four different fluorescently-labeled dNTPs was achieved with very high (>99%) accuracy using multiple excitation and collection wavelengths. Pulses in the color channels were then correlated to base pairs, with threshold and fitting algorithms used to determine the base pairs, as shown in Figure 10. With this method, a sequencing rate significantly higher than commercial methods was achieved.
Figure 10.
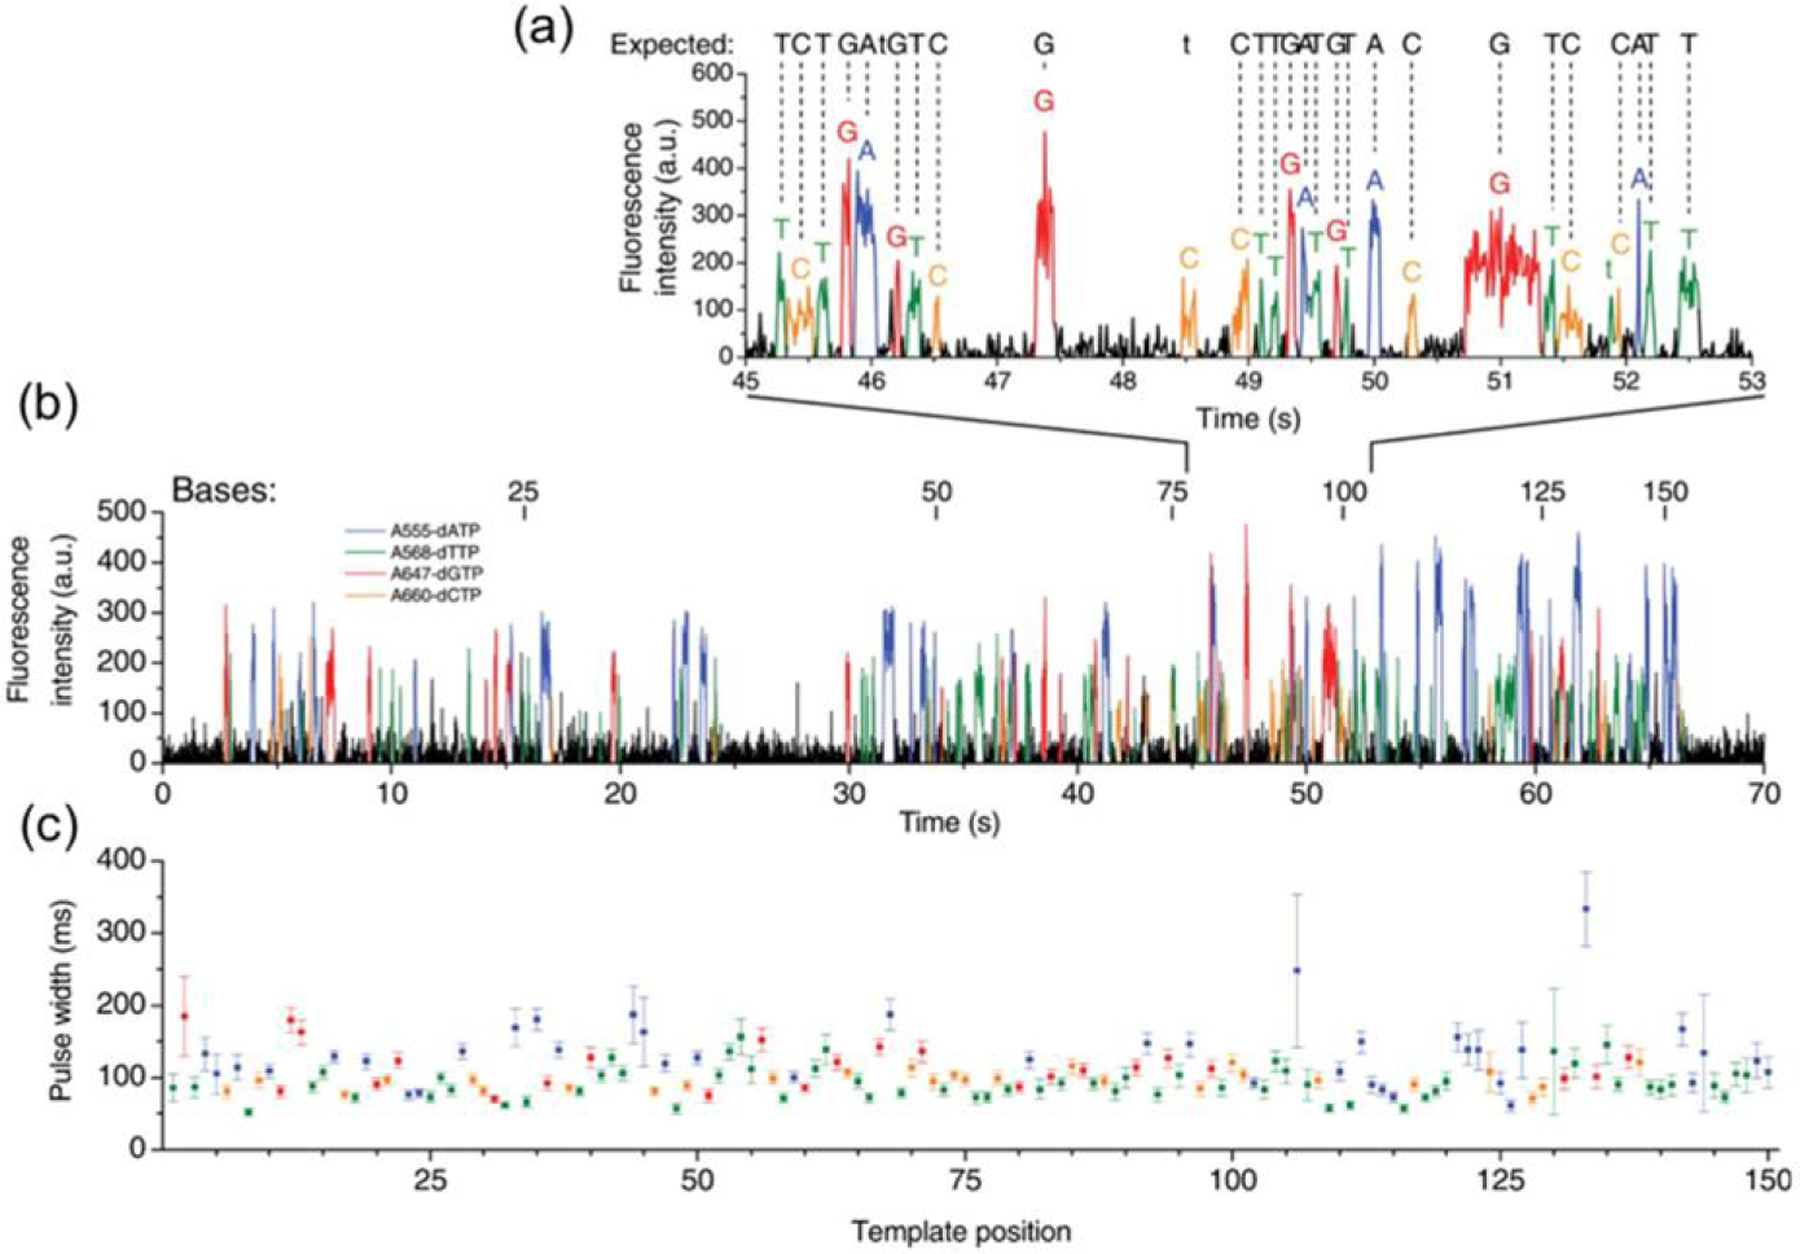
Real-time single-molecule DNA sequencing in ZMWs using a four-channel wavelength-multiplexed detection strategy. (a) Example intensity vs. time trace for all four channels, with intensity weighted based on fluorophore identity. Pulses are identified with a least-squares fitting algorithm. (b) An example of an entire 150 base-pair DNA sequence; readout was complete in approximately 63% of attempts. (c) This method produces consistent results, as seen in this plot of average pulse with as readout progresses along the DNA strand. (Reproduced with permission from [90]. Copyright 2009, AAAS.)
4.5. Cellular Mem branes in ZMWs
Due to the ability of ZMWs to isolate small volumes of analyte from bulk species, they have become increasingly important in probing isolated interactions, such as those characteristic of cell membrane-supported biomolecules. By functionalizing the bottom of the nanopores with the appropriate biomarkers, cells cultured on the ZMWs can interact with the nanopores on the single-molecule level. Remarkably, ZMWs have the unique capability of both supporting these live cell cultures while still providing the isolation necessary for studies of single-molecule interactions [128]. The increase in spatial resolution and enhancement of fluorescent signals allows single fluorophores crossing lipid bilayer membranes to be monitored by FCS [129], an important capability in understanding cellular uptake and secretion.
Because the excitation volume of the ZMW is at the bottom of the nanopore, the cell membrane bends to fit inside of the nanoaperture, isolating the remainder of the cell from optical excitation. Craighead and Bard demonstrated the ability of rat basophilic leukemia cells to conform to the shape of ZMWs, as well as the ability of the resulting fluorescent signal to elucidate kinetic information about molecular transport through the membrane [130]. Because only a small area of the cell membrane is probed, difference in transport behavior between finely-spaced areas on the cell membrane can be observed [131]. For more dynamic studies, ZMWs can be combined with other biological analysis techniques; for example, single-ligand binding has been demonstrated with cells cultured on a ZMW array in an integrated microfluidic device [132].
4.6. Spectroscopic/Electrochemical Multifunctional ZMWs
4.6.1. Speciation Control
Because the E-ZMW combines spectroscopic and electrochemical measurements at the single molecule level within a well-defined nanophotonic structure, single electron transfer events can be studied, thus illuminating the relationship between single molecule redox behavior and population characteristics. Recently, our group demonstrated an E-ZMW nanophotonic structure for single molecule spectroelectrochemistry of freely diffusing molecules [85,88]. Bifunctional E-ZMW nanostructures were fabricated and shown to exhibit nanoscale behavior in multiple domains – for example, dual-ring electrode structures that exhibit both nanophotonic and nanoelectrochemical behavior, viz. Figure 11 [87,88]. These nanopores were produced in a parallel array, which was advantageous, because: (1) the molecular occupancy conditions for individual pores could be controlled easily; (2) each nanopore contained an identical set of ring electrodes, so they all exhibited the same potential, Eappl, and (3) the electrochemical behavior was integrated over the entire array. In contrast, the fluorescence response was examined over a user-defined sub-array that could be expanded as needed up to the entire array. Because these architectures support both single molecule fluorescence and direct electrical measurements, fluorogenic molecules, such as the flavoenzymes, or the cofactors (FAD/FADH2) themselves [133,134], can be used to correlate fluctuations in electrochemical and spectroscopic events at the single-molecule level [85,135].
Figure 11.
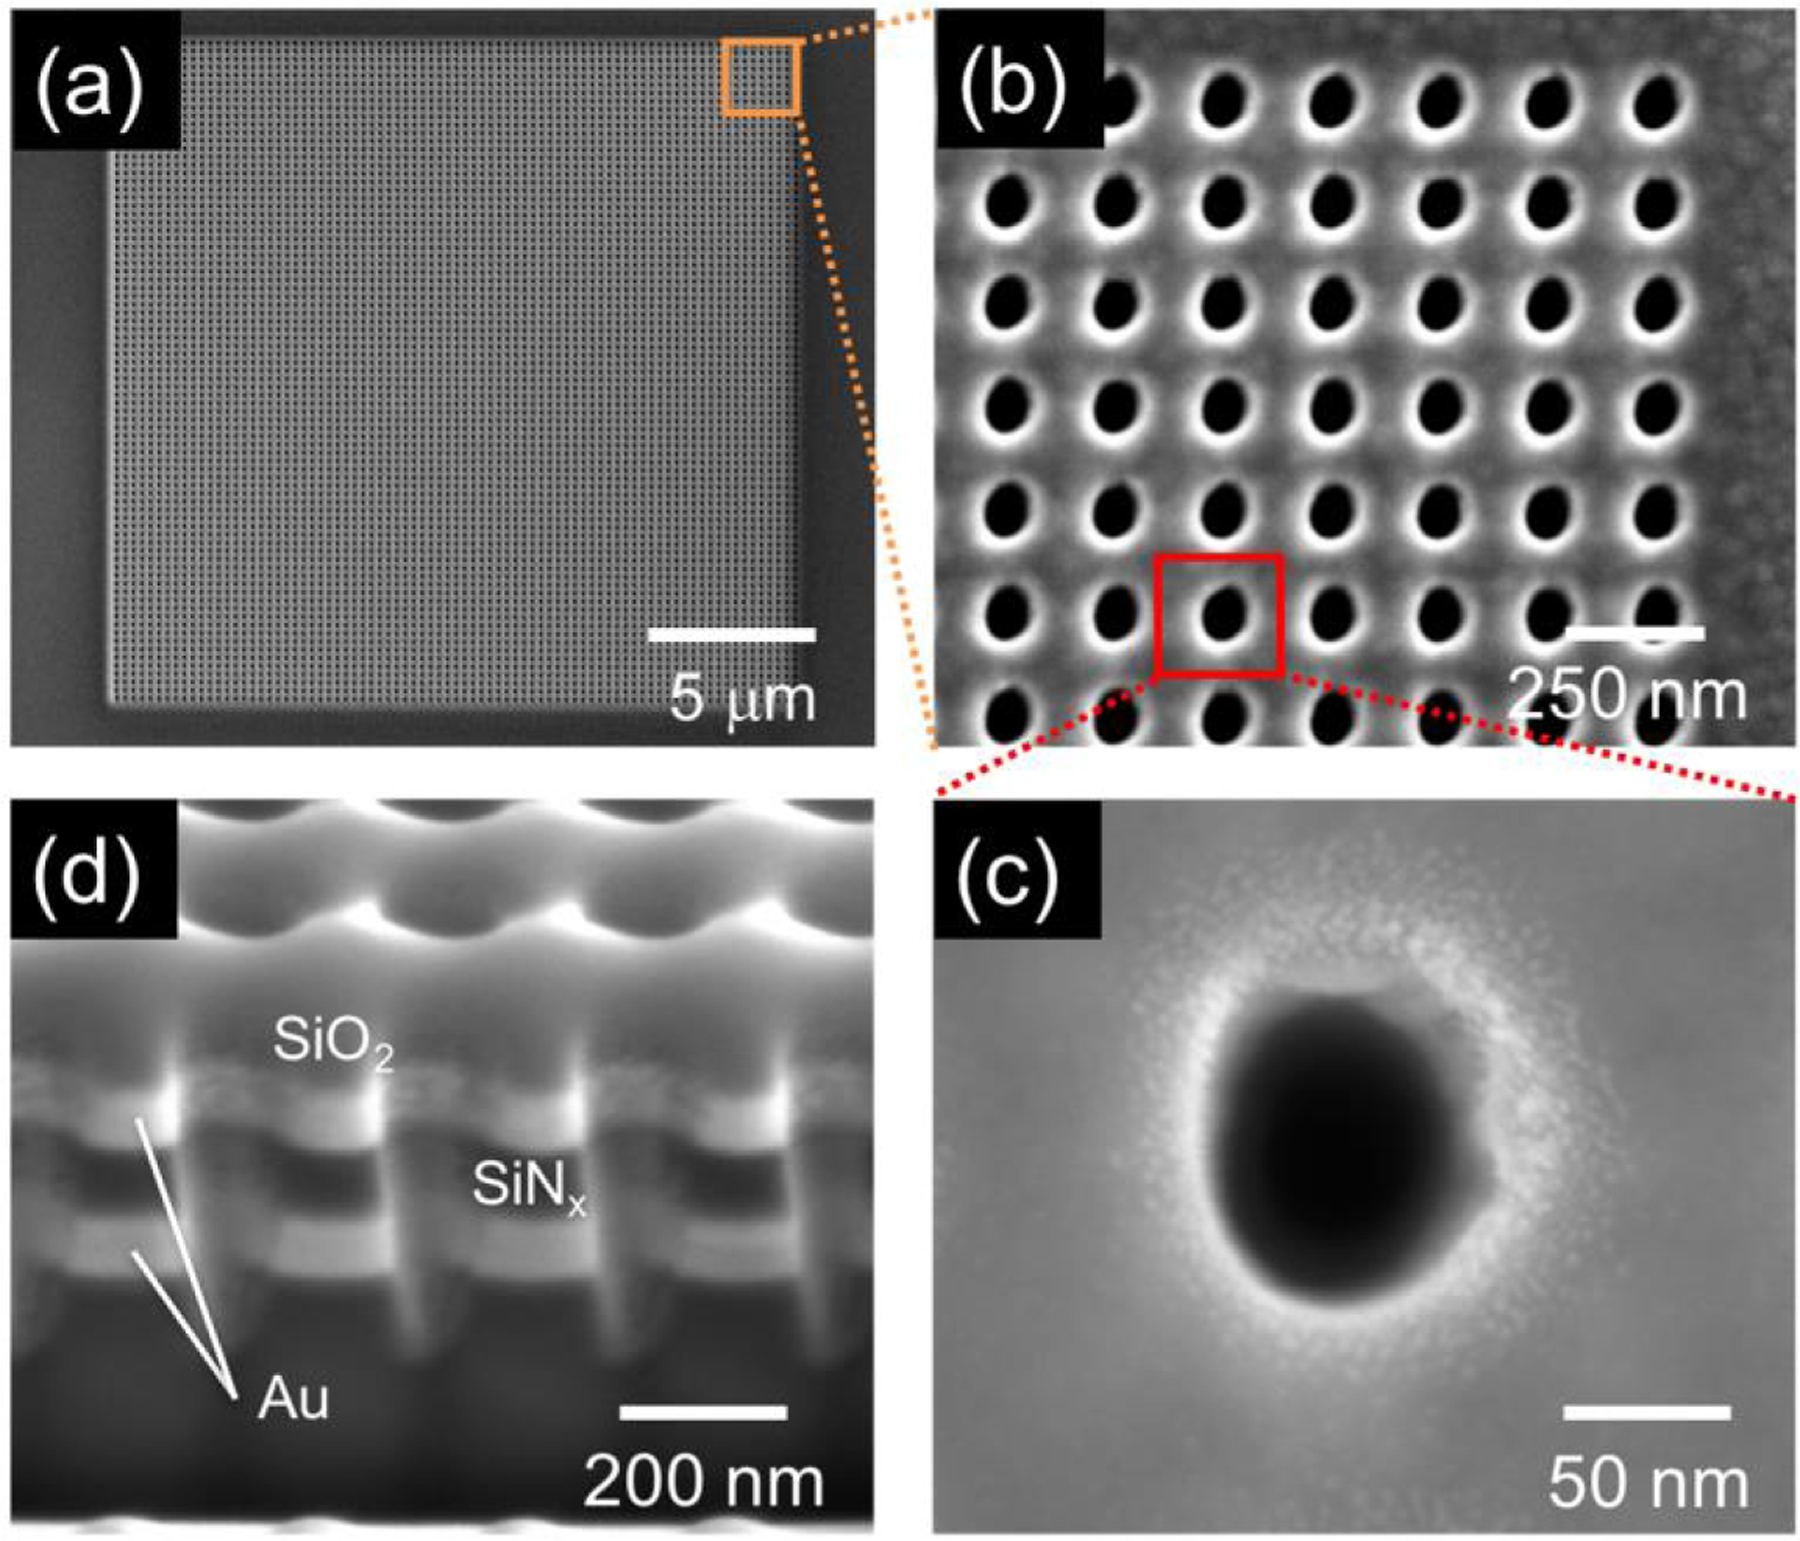
SEM images of recessed dual ring electrode ZMW array structures. Top-down views of (a) the entire ZMW array, (b) a small portion of a high density nanopore array with ~250 nm pitch, (c) a single nanopore. (d) Cross-section image of 3 adjacent dual-ring E-ZMW nanopores showing two Au ring electrodes with ~100 nm of SiNx as an insulator. (Reproduced with permission from [87]. Copyright 2016, American Chemical Society.)
4.6.2. Redox Cycling
The E-ZMW permits a wide range of nanoscale electrochemical control schemes to be coupled spectroscopic experiments, thereby providing a rich palette of single-molecule level spectroelectrochemical experiments with no direct analogs at the macroscale. For example, redox cycling (RC) of electroactive species can be exploited for signal amplification. Improved sensitivity due to the RC effect is obtained when two closely spaced electrodes are held at different potentials, one oxidizing and the other reducing, so that an electroactive analyte is oxidized and reduced multiple times within a short period of time, producing multiple electron transfer events from a single analyte molecule [136]. To realize this, our group fabricated nanoscale recessed dual-ring electrode arrays for spectroelectrochemistry [87,88]. By modulating the reaction at the bottom-ring electrode with the top-ring potential, it was possible to carry out independent redox reactions at the two ring electrodes. In particular, the dual-ring geometry, viz. Figure 11(d), allowed RC of fluorigenic redox species, with current being measured at both top and bottom electrodes, while fluorescence was observed only in the E-ZMW region defined by the bottom ring electrode.
The most obvious advantage of RC is the augmented faradic current, as given by its amplification factor, AF [137].
| (8) |
where ifeedback and ioff are the faradic currents obtained in feedback (RC) mode and non-feedback (single-electrode) mode, respectively. A characteristic feature of E-ZMW RC operation is steady-state voltammetric response, which is independent of the scan rate as well as the electrode area [138]. Furthermore, the high collection efficiency obtained with the E-ZMW dual ring electrode structure produced mirror-image oxidation and reduction currents. Furthermore, in this scheme the collector electrode exhibits only a small charging current, thus raising the possibility of fast-scan electrochemical experiments [135,139].
4.6.3. Role of Supporting Electrolyte
The E-ZMW geometry also allows electromigration mass transport to be exploited, thus yielding even greater sensitivity for analytical performance. Typically, electrochemical experiments use a background electrolyte to carry the bulk of the current between electrodes, thus reducing the electromigration of redox-active species. In contrast, large current enhancements can be achieved at nanopore electrodes without supporting electrolyte. This behavior is shown in the three distinct regimes of Figure 12. Interestingly, at very low analyte concentrations, in the absence of supporting electrolyte, two mechanisms contribute to enhanced currents: (1) ions accumulate in the nanopores due to permselectivity, and (2) electromigration adds to diffusive mass transport. Thus, electroanalytical currents in electrolyte-free media were found to produce up to 2000-fold total current amplification from a combination of ion enrichment/migration as well as RC effects [140]. At these small distances and low concentrations, the analyte itself is important in determining the structure of the electrical double layer. In another example, the strong ion accumulation was used to enhance analytical selectivity of dopamine in the presence of ascorbic acid. The nanopore electrode array acted as a counter-ion permselective channel with the RC effect producing a 3000-fold selectivity for dopamine over the common interferent, ascorbic acid [141].
Figure 12.
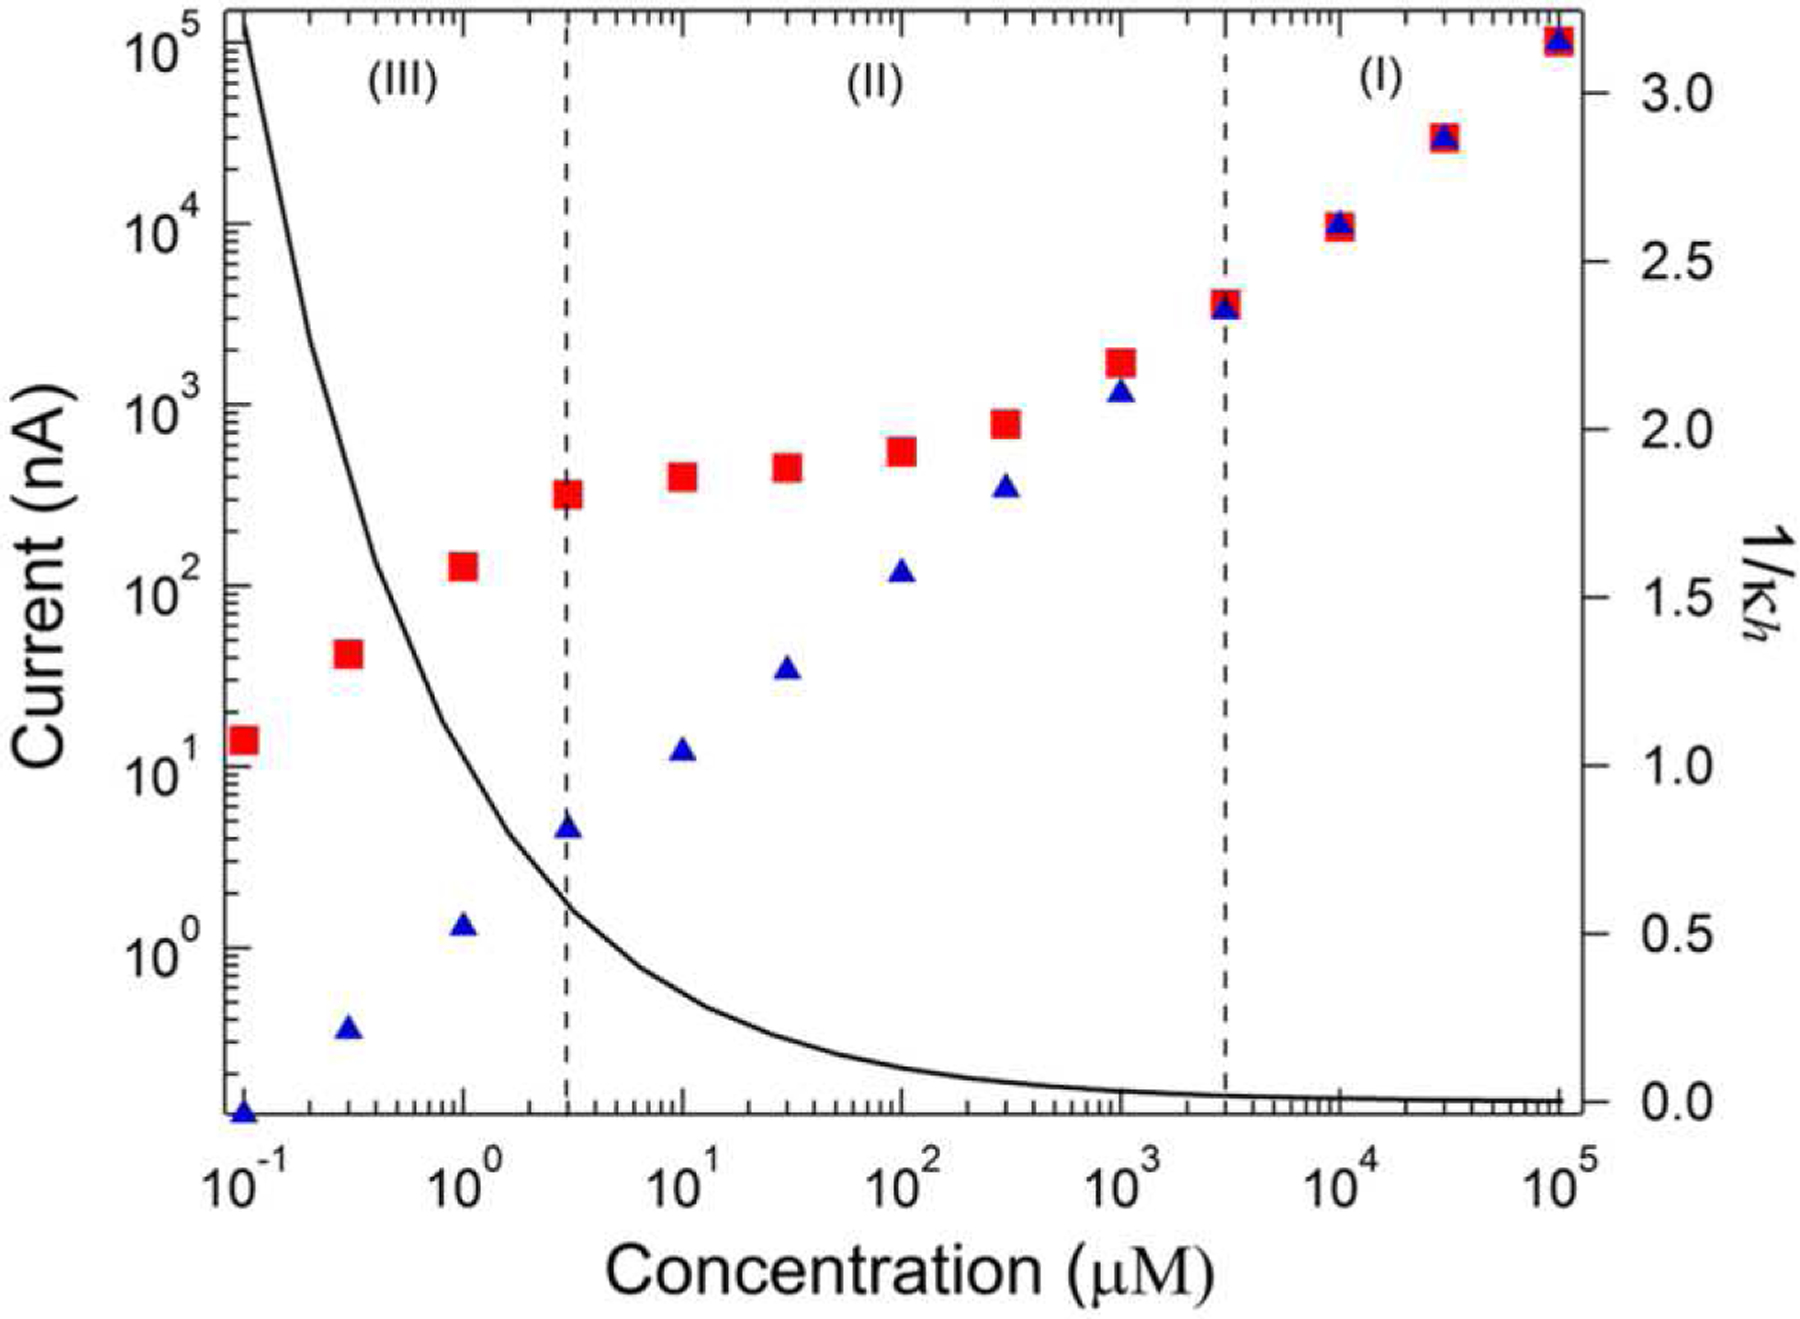
Steady-state current through the bottom ring electrode of dual-ring ZMWs in the presence of Ru(NH3)63+, showing a change in the behavior of the limiting current with analyte concentration in 0.1 M KCl (blue) vs. without supporting electrolyte (red). The calculated value of the Debye length-pore diameter ratio (1/κh) for Ru(NH3)63+ without supporting electrolyte is shown as the black curve. (Reproduced with permission from [140]. Copyright 2014, American Chemical Society.)
4.6.4. Single Molecule Electrochemical Fluorescence
Our group also studied single-molecule spectroelectrochemical cross-correlation with electron transfer events in redox switchable fluorophores in an E-ZMW [88], as shown in Figure 13. Dual ring electrode E-ZMWs exhibit efficient redox cycling of electroactive species, while simultaneously monitoring single FMN molecule fluorescence excited by the confined optical field near the bottom ring electrode, so that both electrical and optical signals could be recorded simultaneously and cross-correlated. Electron transfer events were signaled by a transition of the emission from high- to low-intensity, as FMN was reduced to FMNH2, after which potential-controlled return to the oxidized state was accompanied by a complementary fluorescence transition. The current/fluorescence-time traces obtained at pore occupancies of 〈n〉pore ~ 0.001 under RC conditions are shown in Figure 14. The clear spectroelectrochemical cross-correlation signals permitted the simultaneous current and fluorescence fluctuations to be unambiguously assigned to single molecule population fluctuations.
Figure 13.
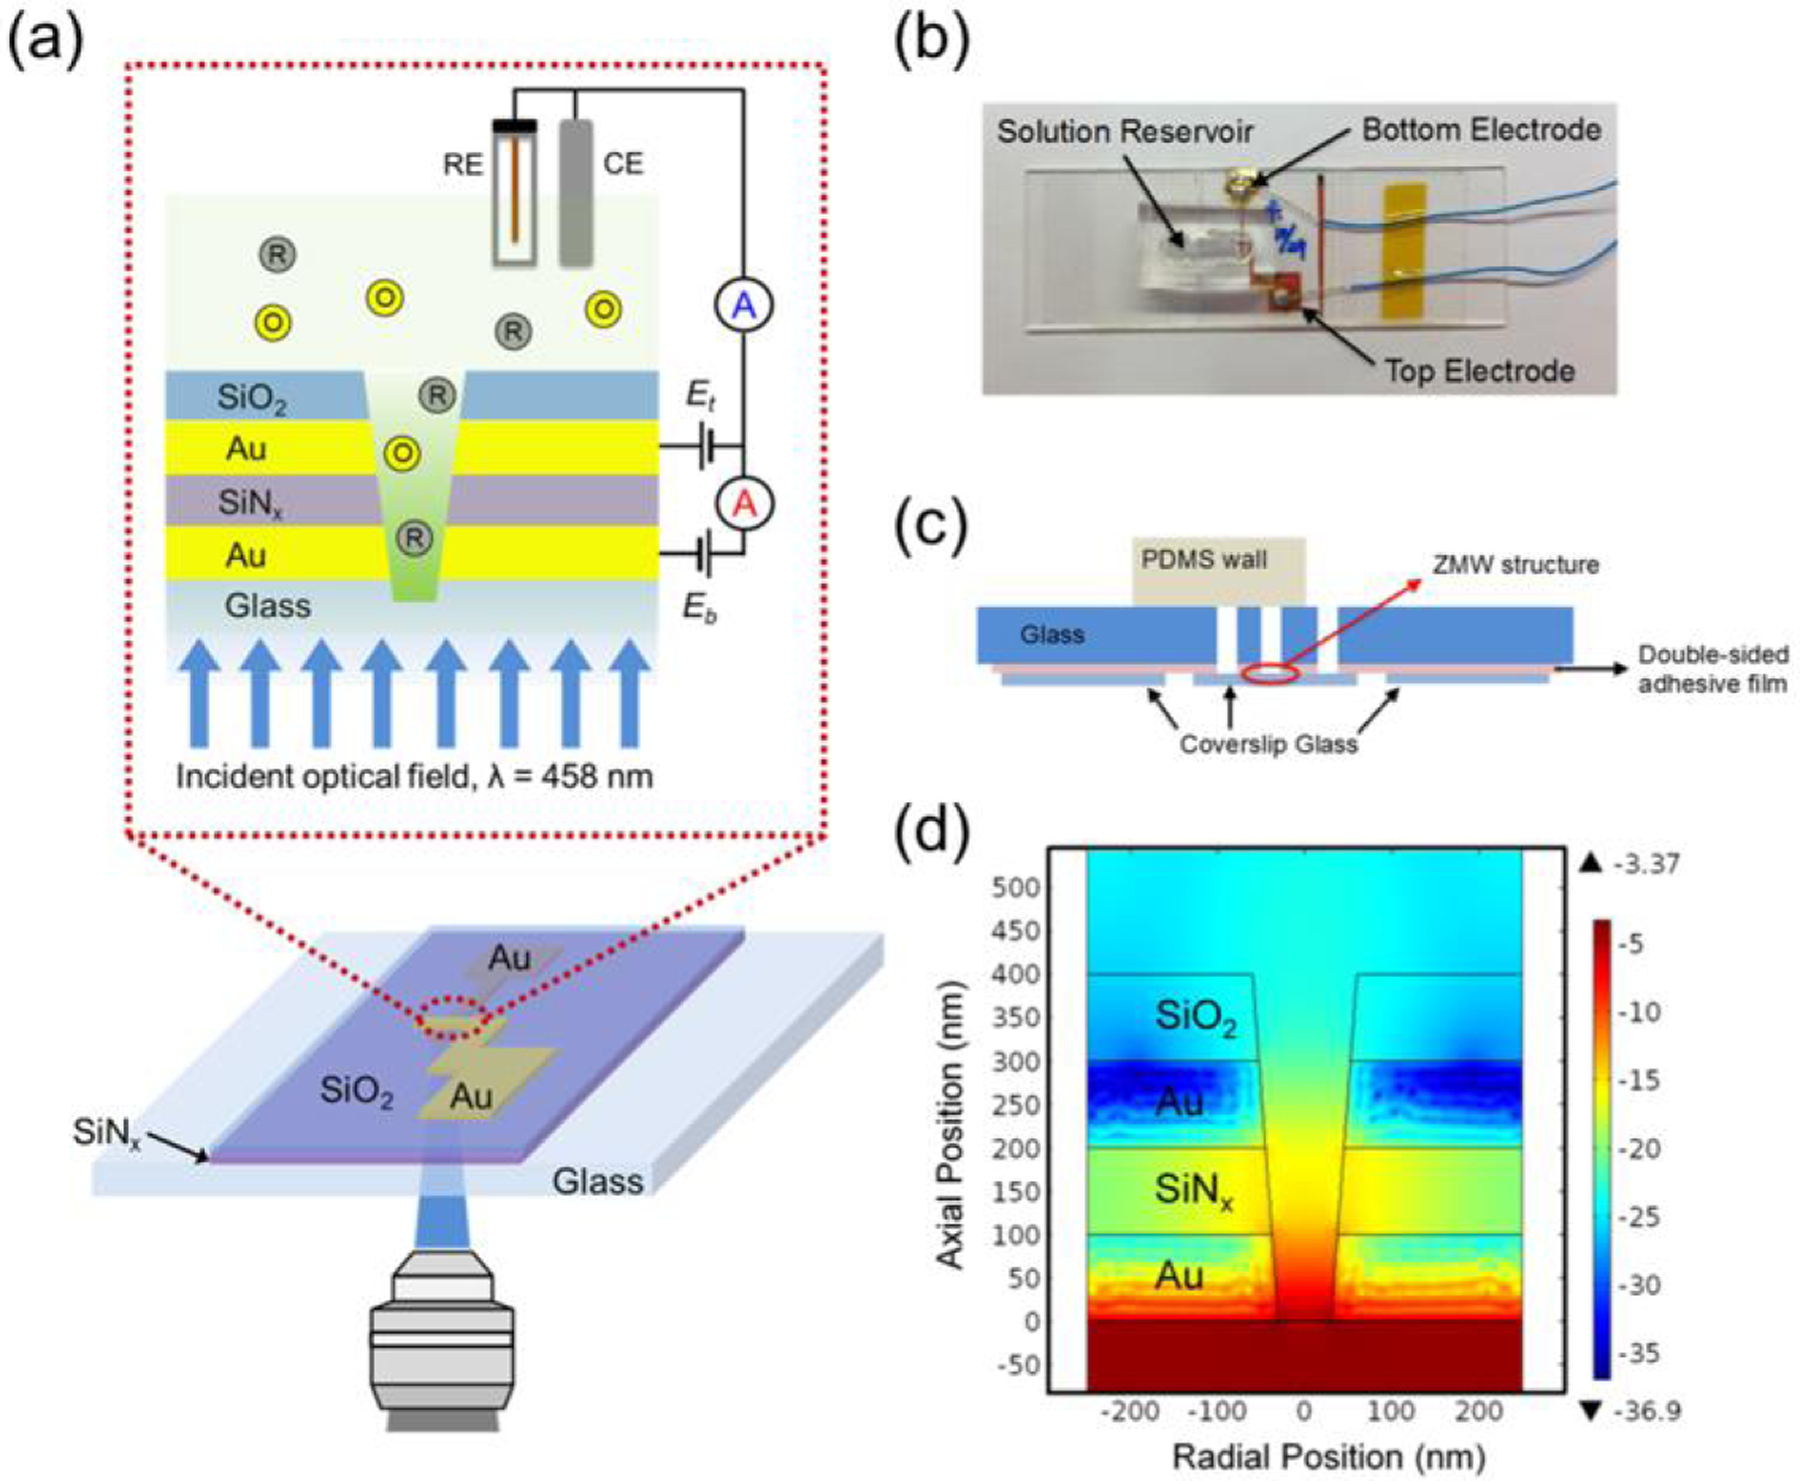
(a) Schematic diagram of the experimental configuration of the E-ZMW. (b) Photograph of E-ZMW array in mount with PDMS fluidic reservoir. (c) Diagram of ZMW and mount configuration showing through-vias for fluid access and PDMS well. Not to scale. (d) Finite-element simulation of optical field intensity for a conical frustum pore with dtop/dbottom = 2, and dbottom = 60 nm, showing decrease in intensity with vertical distance from pore bottom (Reproduced with permission from [88]. Copyright 2017, Royal Society of Chemistry.)
Figure 14.
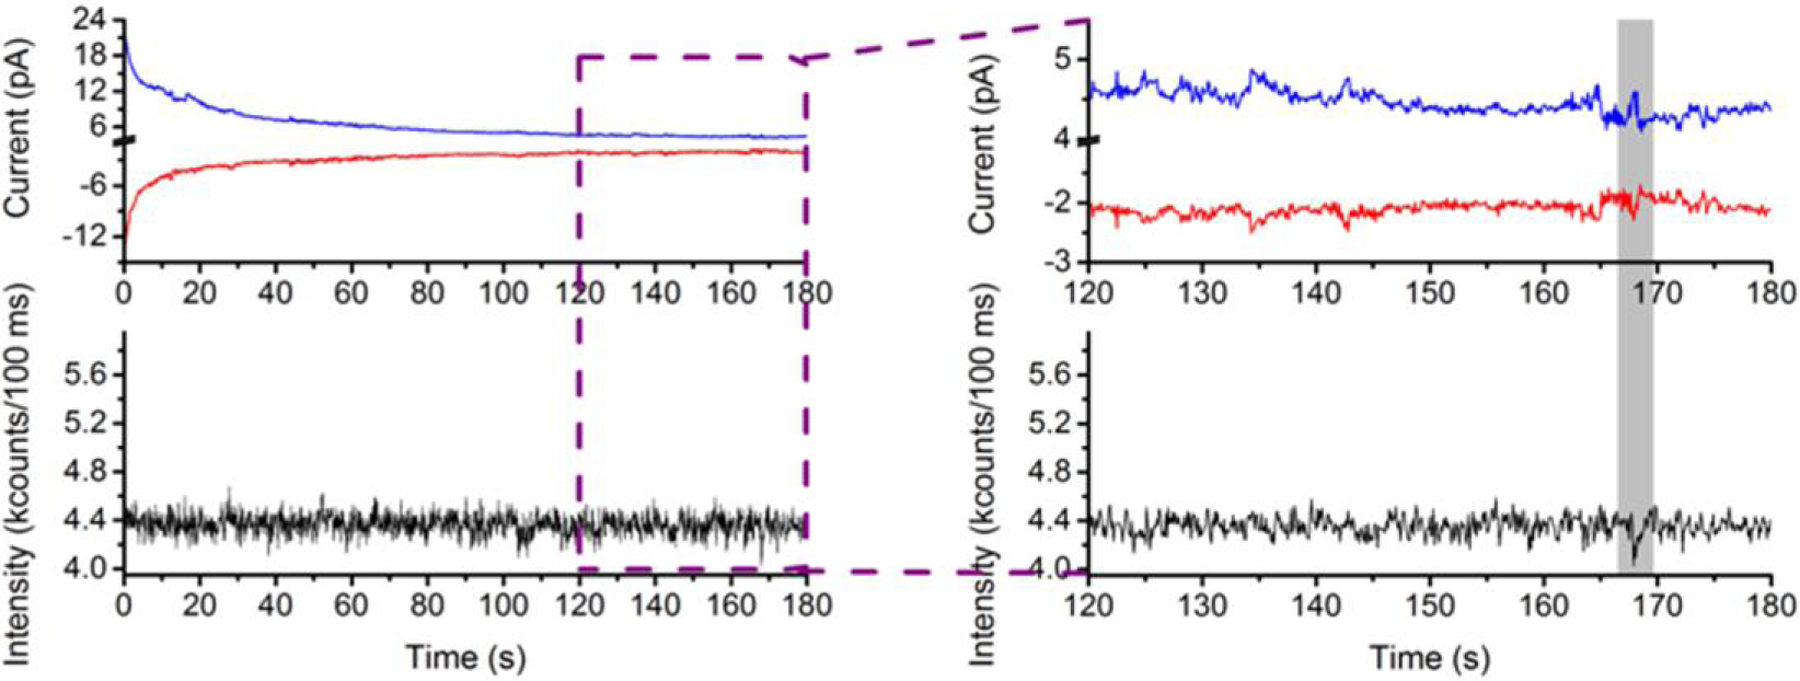
Current/fluorescence-time traces and histogram at 1 nM FMN corresponding to a molecular occupancy of 〈n〉pore ~ 0.001. Top: Symmetric steady-state current behavior, characteristic of redox cycling conditions, is measured through both bottom (red) and top (blue) electrodes of a dual-ring E-ZMW device with ~6,500 pores. The fluorescence intensity, collected simultaneously with the electrical signals in a custom confocal FCS microscope, fluctuates around a steady-state level. Some fluctuations, corresponding to quantized changes in the occupancy of the optically-interrogated portion of the array, are observed in both electrical and optical traces (grey highlights). A magnified view of one such fluctuation is shown in the inset, right. (Reproduced with permission from [88]. Copyright 2017, Royal Society of Chemistry.)
5. CONCLUSIONS AND OUTLOOK
5.1. Anticipated ZMW Developments
Exploring the global dynamics of biological processes at minute length and time scales presents a significant challenge to single-molecule characterization methods that are limited to low concentrations of label-free components. To address this, ZMW technologies pave the way for detailed characterization of freely diffusing target molecules at μM to mM concentrations. The accessibility and the multiplexing capability of nanophotonic structures, as evidenced, for example in real-time sequencing [90], allows even complex multi-molecule processes to be explored, yielding deep insights into fundamental biochemical mechanisms. Additionally, because ZMW-based systems are continually being improved, researchers can adjust the architectures and experimental protocols to suit the requirements of specific single-molecule characterization experiments. In addition, there are exciting applications yet to be explored in the coupling of ZMWs to the study of non-biochemical reactions, such as the electrochemical phenomena highlighted here. The development and use of E-ZMWs represents just the first step to further exploration of electron transfer reactions at the single-molecule level. These unique capabilities developed in E-ZMWs should open new experiments in which coupled electrochemical and spectroscopic investigations_of single electron transfer events in biological systems occur under tightly controlled conditions. For these reasons, we believe that ZMW technology should play an expanding role in biophysics.
5.2. Other Nanostructures
A defining characteristic of the ZMWs highlighted in this review is their capacity to decrease the optical excitation volume by eliminating far-field propagating light modes, restricting excitation to the localized evanescent field within the ZMW volume. However, metallic nanostructures can display a wide array of additional interesting optical properties. For example, localized surface plasmon (LSP) resonances can be excited at shaped metallic (typically Ag) nanoparticles at wavelengths that can be tuned based on the size and shape of the nanoparticles. The LSP is based on the polarization of free electrons within the metal, but it is not limited to the metal, affecting the local environment surrounding the nanoparticle as well. With appropriate engineering, LSP can be used to create areas of extremely high electric fields, which can enhance, rather than quench, the fluorescence of nearby molecules. Nanostructures which harness the LSP effect, called “nanoantennas”, engineered in the form of “bowties” have been shown to enhance the fluorescence of dye molecules within the <100 nm bowtie gap by >1000-fold [142], sparking a flurry of interest in propagating-localized radiation interaction [143]. Wegner and co-workers demonstrated that the properties of nanoantennas and ZMWs could be combined with a “nanoantenna-in-a-box” design, in which a bi-hemispherical nanoantenna was used to excite an LSP hotspot while background noise was suppressed by placing the nanoantenna within a ZMW-like structure [144]. Nanoantennas are also of active interest in the enhancement of Raman scattering. These are just a few representative examples of the types of nanophotonic structures that can be explored in the future that promise to reveal new insights into complex systems and phenomena.
5.3. From Characterization to Processing
In summary, ZMWs represent a powerful and versatile tool that can confine optical radiation to volumes orders of magnitude smaller than diffraction-limited optics allow, thus enabling unprecedented experimental capabilities, such as the study of single-molecule dynamics in physiologically-relevant bulk concentrations. The metallic nature of ZMWs allows for bifunctional nanostructures that can be used, for example, to manipulate the electrochemical potential and the optical field distribution simultaneously, as demosntrated in the E-ZMW – nanostructures that enable precise control of redox states of fluorophores and enzymes as well as stabilization of previously-inaccessible reaction intermediates. LSP effects can also be coupled with ZMWs, enhancing fluorescence emission while maintaining low backgrounds. Importantly for future technological applications, ZMWs can be fabricated from a wide array of materials in both lab- and wafer-scale production schemes, and the surface chemistry can be selectively modified to suit the requirements of particular experiments.
ZMWs already constitute a valuable tool for the study of molecular-scale phenomena of importance in in fields ranging from biophysics to electrochemistry, as the coupling of nanophotonics and nanoelectronics enables the detailed study of the behavior of single molecules. Elaborated designs, such as the bifunctional dual-ring E-ZMWs and integrated trench-ZMW nanophotonic devices, typify the opportunities that await exploration, with possibilities in biomimetic applications such as ion- and particle- transport through voltage-gated channels, voltage-dependent single-particle catalysis, and bio-specific adaptations such as linear ZMW processive enzyme assemblies. High-throughput, on-chip DNA sequencing with ultra-low detection limits is foreseeable, as commercial interest in ZMW technology continues to decrease cost and increase the audience for ZMW technology, even to the point advanced point-of-care diagnostics and therapeutics.
ACKNOWLEDGMENT
This work was supported by the National Science Foundation under grant 1404744 (DH). GMC was supported by a NASA Space Technology Research Fellowship NNX16AM45H.
SUMMARY OF ACRONYMS
- E-ZMW
electrochemical zero-mode waveguide
- FAD
flavin adenine dinucleotide
- FCS
fluorescence correlation spectroscopy
- FIB
focused ion beam
- FMN
flavin mononucleotide
- FRET
fluorescence resonance energy transfer
- MSOX
monomeric sarcosine oxidase
- NSOM
near-field scanning optical microscopy
- PVD
physical vapor deposition
- RC
redox cycling
- S/N
signal-to-noise ratio
- SERS
surface enhanced Raman scattering
- STED
stimulated emission-depletion
- STM
scanning tunneling microscopy
- TIRF
total internal reflection fluorescence
- ZMW
zero-mode waveguide
REFERENCES
- [1].Xie XS and Trautman JK 1998. Optical studies of single molecules at room temperature Annu. Rev. Phys. Chem 49 441–80 [DOI] [PubMed] [Google Scholar]
- [2].Lu Y and Paige MF 2007. An ensemble and single-molecule fluorescence spectroscopy investigation of Calcium Green 1, a calcium-ion sensor J. Fluoresc 17 739–48 [DOI] [PubMed] [Google Scholar]
- [3].Orrit M, Ha T and Sandoghdar V 2014. Single-molecule optical spectroscopy Chem. Soc. Rev 43 973–6 [DOI] [PubMed] [Google Scholar]
- [4].Moerner W 2002. A dozen years of single-molecule spectroscopy in physics, chemistry, and biophysics J. Phys. Chem. B 106 910–27 [Google Scholar]
- [5].Davis L, Fairfield F, Hammond M, Harger C, Jett J, Keller R, Hahn J, Krakowski L, Marrone B and Martin J 1992. Rapid DNA Sequencing based on single-molecule detection Los Alamos Sci 20 281–5 [DOI] [PubMed] [Google Scholar]
- [6].Moerner WE 2010. Single-molecule optical spectroscopy and imaging: from early steps to recent advances Single Molecule Spectroscopy in Chemistry, Physics and Biology (Springer Series in Chemical Physics vol 96) ed Gräslund A et al. (Berlin: Springer-Verlag; ) ch 2, pp 25–60 [Google Scholar]
- [7].Xie XS 1996. Single-molecule spectroscopy and dynamics at room temperature Acc. Chem. Res 29 598–606 [Google Scholar]
- [8].Affleck RL, Ambrose WP, Demas JN, Goodwin PM, Schecker JA, Wu M and Keller RA 1996. Reduction of luminescent background in ultrasensitive fluorescence detection by photobleaching Anal. Chem 68 2270–6 [DOI] [PubMed] [Google Scholar]
- [9].Weiss S 1999. Fluorescence spectroscopy of single biomolecules Science 283 1676–83 [DOI] [PubMed] [Google Scholar]
- [10].Trautman J, Macklin J, Brus L and Betzig E 1994. Near-field spectroscopy of single molecules at room temperature Nature 369 40–2 [Google Scholar]
- [11].Tokunaga M, Kitamura K, Saito K, Iwane AH and Yanagida T 1997. Single molecule imaging of fluorophores and enzymatic reactions achieved by objective-type total internal reflection fluorescence microscopy Biochem. Biophys. Res. Commun 235 47–53 [DOI] [PubMed] [Google Scholar]
- [12].Goldschen-Ohm MP, White DS, Klenchin VA, Chanda B and Goldsmith RH 2017. Observing Single-Molecule Dynamics at Millimolar Concentrations Angew. Chem. Int. Ed 56 2399–402 [DOI] [PMC free article] [PubMed] [Google Scholar]
- [13].Ohtsu M, Kobayashi K, Kawazoe T, Sangu S and Yatsui T 2002. Nanophotonics: design, fabrication, and operation of nanometric devices using optical near fields IEEE J. Sel. Top. Quantum Electron 8 839–62 [Google Scholar]
- [14].Gallinet B, Butet J and Martin OJ 2015. Numerical methods for nanophotonics: standard problems and future challenges Laser Photon. Rev 9 577–603 [Google Scholar]
- [15].Girard C and Dujardin E 2006. Near-field optical properties of top-down and bottom-up nanostructures J. Opt. A: Pure Appl. Opt 8 S73 [Google Scholar]
- [16].Knipp D 2007. Nanophotonics: Spectrometers shrink down Nat. Photonics 1 444–5 [Google Scholar]
- [17].Armani AM, Kulkarni RP, Fraser SE, Flagan RC and Vahala KJ 2007. Label-free, single-molecule detection with optical microcavities Science 317 783–7 [DOI] [PubMed] [Google Scholar]
- [18].Su J 2015. Label-free single exosome detection using frequency-locked microtoroid optical resonators ACS Photonics 2 1241–5 [Google Scholar]
- [19].Zhang S, Li G-C, Chen Y, Zhu X, Liu S-D, Lei DY and Duan H 2016. Pronounced fano resonance in single gold split nanodisks with 15 nm split gaps for intensive second harmonic generation ACS Nano 10 11105–14 [DOI] [PubMed] [Google Scholar]
- [20].Clark AW, Glidle A, Cumming DR and Cooper JM 2009. Plasmonic split-ring resonators as dichroic nanophotonic DNA biosensors J. Am. Chem. Soc 131 17615–9 [DOI] [PubMed] [Google Scholar]
- [21].Cubukcu E, Zhang S, Park Y-S, Bartal G and Zhang X 2009. Split ring resonator sensors for infrared detection of single molecular monolayers Appl. Phys. Lett 95 043113 [Google Scholar]
- [22].Cuadra J, Verre R, Wersäll M, Krückel C, Torres-Company V, Antosiewicz T and Shegai T 2017. Hybrid dielectric waveguide spectroscopy of individual plasmonic nanoparticles AIP Adv 7 075207 [Google Scholar]
- [23].Harootunian A, Betzig E, Isaacson M and Lewis A 1986. Super-resolution fluorescence near-field scanning optical microscopy Appl. Phys. Lett 49 674–6 [DOI] [PMC free article] [PubMed] [Google Scholar]
- [24].Betzig E and Trautman J 1992. Near-field optics-Microscopy, spectroscopy, and surface modification beyond the diffraction limit Science 257 189–95 [DOI] [PubMed] [Google Scholar]
- [25].Peyskens F, Subramanian AZ, Neutens P, Dhakal A, Van Dorpe P, Le Thomas N and Baets R 2015. Bright and dark plasmon resonances of nanoplasmonic antennas evanescently coupled with a silicon nitride waveguide Opt. Express 23 3088–101 [DOI] [PubMed] [Google Scholar]
- [26].Betzig E and Chichester RJ 1993. Single molecules observed by near-field scanning optical microscopy Science 262 1422–5 [DOI] [PubMed] [Google Scholar]
- [27].Kelso DM 1997. Biomedical applications of single molecule detection Ultrasensitive Biochemical Diagnostics II: Proc. SPIE 2985 (San Jose, US, 22 May 1997) ( 10.1117/12.274352) [DOI] [Google Scholar]
- [28].Hinterdorfer P, Garcia-Parajo MF and Dufrêne YF 2011. Single-molecule imaging of cell surfaces using near-field nanoscopy Acc. Chem. Res 45 327–36 [DOI] [PubMed] [Google Scholar]
- [29].Anker JN, Hall WP, Lyandres O, Shah NC, Zhao J and Van Duyne RP 2008. Biosensing with plasmonic nanosensors Nat. Mater 7 442–53 [DOI] [PubMed] [Google Scholar]
- [30].Kneipp K, Kneipp H, Itzkan I, Dasari RR and Feld MS 1999. Ultrasensitive chemical analysis by Raman spectroscopy Chem. Rev 99 2957–76 [DOI] [PubMed] [Google Scholar]
- [31].Kneipp K, Wang Y, Kneipp H, Perelman LT, Itzkan I, Dasari RR and Feld MS 1997. Single molecule detection using surface-enhanced Raman scattering (SERS) Phys. Rev. Lett 78 1667–70 [Google Scholar]
- [32].Li J, Huang Y, Ding Y, Yang Z, Li S, Zhou X, Fan F, Zhang W, Zhou Z and Wu D 2010. Shell-isolated nanoparticle-enhanced Raman spectroscopy Nature 464 392–5 [DOI] [PubMed] [Google Scholar]
- [33].Nie S and Emory SR 1997. Probing single molecules and single nanoparticles by surface-enhanced Raman scattering Science 275 1102–6 [DOI] [PubMed] [Google Scholar]
- [34].Xu H, Bjerneld EJ, Käll M and Börjesson L 1999. Spectroscopy of single hemoglobin molecules by surface enhanced Raman scattering Phys. Rev. Lett 83 4357–60 [Google Scholar]
- [35].Evans CC, Liu C and Suntivich J 2016. TiO2 nanophotonic sensors for efficient integrated evanescent Raman spectroscopy ACS Photonics 3 1662–9 [Google Scholar]
- [36].Peyskens F, Dhakal A, Van Dorpe P, Le Thomas N and Baets R 2015. Surface enhanced Raman spectroscopy using a single mode nanophotonic-plasmonic platform ACS Photonics 3 102–8 [Google Scholar]
- [37].Meng L, Sun M, Chen J and Yang Z 2016. A nanoplasmonic strategy for precision in-situ measurements of tip-enhanced Raman and fluorescence spectroscopy Sci. Rep 6 19558. [DOI] [PMC free article] [PubMed] [Google Scholar]
- [38].Ahmed A and Gordon R 2012. Single molecule directivity enhanced Raman scattering using nanoantennas Nano Lett 12 2625–30 [DOI] [PubMed] [Google Scholar]
- [39].Rycenga M, Xia X, Moran CH, Zhou F, Qin D, Li ZY and Xia Y 2011. Generation of Hot Spots with Silver Nanocubes for Single-Molecule Detection by Surface-Enhanced Raman Scattering Angew. Chem. Int. Ed 123 5587–91 [DOI] [PMC free article] [PubMed] [Google Scholar]
- [40].Wallys J, Teubert J r, Furtmayr F, Hofmann DM and Eickhoff M 2012. Bias-enhanced optical pH response of group III–nitride nanowires Nano Lett 12 6180–6 [DOI] [PubMed] [Google Scholar]
- [41].Alam MS, Karim F and Zhao C 2016. Single-molecule detection at high concentrations with optical aperture nanoantennas Nanoscale 8 9480–7 [DOI] [PubMed] [Google Scholar]
- [42].Liberal I and Engheta N 2017. The rise of near-zero-index technologies Science 358 1540–1 [DOI] [PubMed] [Google Scholar]
- [43].Zhang R, Bursi L, Cox JD, Cui Y, Krauter CM, Alabastri A, Manjavacas A, Calzolari A, Corni S and Molinari E 2017. How To Identify Plasmons from the Optical Response of Nanostructures ACS Nano 11 7321–35 [DOI] [PMC free article] [PubMed] [Google Scholar]
- [44].Estakhri NM, Engheta N and Kastner R 2017. Transparent metasurface with prescribed aperture field 2017 IEEE International Symposium on Antennas and Propagation & USNC/URSI National Radio Science Meeting (San Diego, CA, 9–14 July 2017) [Google Scholar]
- [45].Drezet A, Woehl J and Huant S 2002. Diffraction by a small aperture in conical geometry: Application to metal-coated tips used in near-field scanning optical microscopy Phys. Rev. E 65 046611. [DOI] [PubMed] [Google Scholar]
- [46].Bethe H 1944. Theory of diffraction by small holes Phys. Rev 66 163–82 [Google Scholar]
- [47].Levine H and Schwinger J 1949. On the transmission coefficient of a circular aperture Phys. Rev 75 1608–9 [Google Scholar]
- [48].Genet C and Ebbesen T 2007. Light in tiny holes Nature 445 39–46 [DOI] [PubMed] [Google Scholar]
- [49].Roberts A 1987. Electromagnetic theory of diffraction by a circular aperture in a thick, perfectly conducting screen J. Opt. Soc. Am. A 4 1970–83 [Google Scholar]
- [50].Fan Z, Zhan L, Hu X and Xia Y 2008. Critical process of extraordinary optical transmission through periodic subwavelength hole array: Hole-assisted evanescent-field coupling Opt. Commun 281 5467–71 [Google Scholar]
- [51].Tanaka K and Tanaka M 2004. Analysis and numerical computation of diffraction of an optical field by a subwavelength-size aperture in a thick metallic screen by use of a volume integral equation Appl. Opt 43 1734–46 [DOI] [PubMed] [Google Scholar]
- [52].Jin EX and Xu X 2004. Finitte-difference time-domain studies on optical transmission through planar nano-apertures in a metal film Jpn. J. Appl. Phys 43 407 [Google Scholar]
- [53].Kirby BJ 2010. Zeta Potential in Microchannels Micro-and nanoscale fluid mechanics: transport in microfluidic devices (New York: Cambridge University Press; ) ch 10, pp 226–31 [Google Scholar]
- [54].Wang J, Wang M and Li Z 2006. Lattice Poisson–Boltzmann simulations of electro-osmotic flows in microchannels J. Colloid Interface Sci 296 729–36 [DOI] [PubMed] [Google Scholar]
- [55].Altankov G, Richau K and Groth T 2003. The role of surface zeta potential and substratum chemistry for regulation of dermal fibroblasts interaction Materialwiss. Werkstofftech 34 1120–8 [Google Scholar]
- [56].Nelson BP, Candal R, Corn RM and Anderson MA 2000. Control of surface and ζ potentials on nanoporous TiO2 films by potential-determining and specifically adsorbed ions Langmuir 16 6094–101 [Google Scholar]
- [57].Bortchagovsky E, Colas des Francs G, Naber A and Fischer U 2008. On the optimum form of an aperture for a confinement of the optically excited electric near field J. Microsc 229 223–7 [DOI] [PubMed] [Google Scholar]
- [58].Martin WE, Srijanto BR, Collier CP, Vosch T and Richards CI 2016. A Comparison of Single-Molecule Emission in Aluminum and Gold Zero-Mode Waveguides J. Phys. Chem. A 120 6719–27 [DOI] [PubMed] [Google Scholar]
- [59].Lee W, Kim K and Kim D 2012. Electromagnetic near-field nanoantennas for subdiffraction-limited surface plasmon-enhanced light microscopy IEEE J. Sel. Top. Quantum Electron 18 1684–91 [Google Scholar]
- [60].Stewart WJ 2009. Probability, Markov chains, queues, and simulation: the mathematical basis of performance modeling (Princeton, NJ: Princeton University Press; ). [Google Scholar]
- [61].Heucke SF, Baumann F, Acuna GP, Severin PM, Stahl SW, Strackharn M, Stein IH, Altpeter P, Tinnefeld P and Gaub HE 2013. Placing individual molecules in the center of nanoapertures Nano Lett 14 391–5 [DOI] [PubMed] [Google Scholar]
- [62].Moran-Mirabal JM and Craighead HG 2008. Zero-mode waveguides: sub-wavelength nanostructures for single molecule studies at high concentrations Methods 46 11–7 [DOI] [PubMed] [Google Scholar]
- [63].Ingle JD and Crouch SR 1988. Spectrochemical analysis (Old Tappan, NJ: Prentice Hall College Book Division; ). [Google Scholar]
- [64].Galievsky VA, Stasheuski AS and Krylov SN 2017. Improvement of LOD in Fluorescence Detection with Spectrally Non-Uniform Background by Optimization of Emission Filtering Anal. Chem [DOI] [PubMed] [Google Scholar]
- [65].Li H, Ying L, Green JJ, Balasubramanian S and Klenerman D 2003. Ultrasensitive coincidence fluorescence detection of single DNA molecules Anal. Chem 75 1664–70 [DOI] [PubMed] [Google Scholar]
- [66].Jain PK and El-Sayed MA 2010. Plasmonic coupling in noble metal nanostructures Chem. Phys. Lett 487 153–64 [Google Scholar]
- [67].Wang Y, Peterson EM, Harris JM, Appusamy K, Guruswamy S and Blair S 2017. Magnesium as a Novel UV Plasmonic Material for Fluorescence Decay Rate Engineering in Free Solution J. Phys. Chem. C 121 11650–7 [Google Scholar]
- [68].Lee H, Kim C and Kim D 2015. Sub-10 nm near-field localization by plasmonic metal nanoaperture arrays with ultrashort light pulses Sci. Rep 5 17584. [DOI] [PMC free article] [PubMed] [Google Scholar]
- [69].Sprague-Klein EA, McAnally MO, Zhdanov DV, Zrimsek AB, Apkarian VA, Seideman T, Schatz GC and Van Duyne RP 2017. Observation of Single Molecule Plasmon-Driven Electron Transfer in Isotopically Edited 4, 4′-Bipyridine Gold Nanosphere Oligomers J. Am. Chem. Soc 139 15212–21 [DOI] [PubMed] [Google Scholar]
- [70].Magde D, Elson E and Webb WW 1972. Thermodynamic fluctuations in a reacting system—measurement by fluorescence correlation spectroscopy Phys. Rev. Lett 29 705–8 [Google Scholar]
- [71].Schwille P, Meyer-Almes F-J and Rigler R 1997. Dual-color fluorescence cross-correlation spectroscopy for multicomponent diffusional analysis in solution Biophys. J 72 1878–86 [DOI] [PMC free article] [PubMed] [Google Scholar]
- [72].Ow H, Larson DR, Srivastava M, Baird BA, Webb WW and Wiesner U 2005. Bright and stable core− shell fluorescent silica nanoparticles Nano Lett 5 113–7 [DOI] [PubMed] [Google Scholar]
- [73].Thompson NL 2002. Fluorescence correlation spectroscopy Top. Fluoresc. Spectrosc. (Topics in fluorescence spectroscopy vol 1) ed Lakowicz JR (Boston: Springer; ) pp 337–78 [Google Scholar]
- [74].Roy R, Hohng S and Ha T 2008. A practical guide to single-molecule FRET Nat. Methods 5 507–16 [DOI] [PMC free article] [PubMed] [Google Scholar]
- [75].Jares-Erijman EA and Jovin TM 1996. Determination of DNA helical handedness by fluorescence resonance energy transfer J. Mol. Biol 257 597–617 [DOI] [PubMed] [Google Scholar]
- [76].Ray PC, Fan Z, Crouch RA, Sinha SS and Pramanik A 2014. Nanoscopic optical rulers beyond the FRET distance limit: fundamentals and applications Chem. Soc. Rev 43 6370–404 [DOI] [PubMed] [Google Scholar]
- [77].de Torres J, Ghenuche P, Moparthi SB, Grigoriev V and Wenger J 2015. FRET Enhancement in Aluminum Zero-Mode Waveguides ChemPhysChem 16 782–8 [DOI] [PubMed] [Google Scholar]
- [78].De Torres J, Mivelle M, Moparthi SB, Rigneault H, Van Hulst NF, García-Parajó MF, Margeat E and Wenger J 2016. Plasmonic Nanoantennas Enable Forbidden Förster Dipole–Dipole Energy Transfer and Enhance the FRET Efficiency Nano Lett 16 6222–30 [DOI] [PubMed] [Google Scholar]
- [79].Ghenuche P, de Torres J, Moparthi SB, Grigoriev V and Wenger J 2014. Nanophotonic enhancement of the Förster resonance energy-transfer rate with single nanoapertures Nano Lett 14 4707–14 [DOI] [PubMed] [Google Scholar]
- [80].Fischer UC and Zingsheim H 1981. Submicroscopic pattern replication with visible light J. Vac. Sci. Technol 19 881–5 [Google Scholar]
- [81].Levene MJ, Korlach J, Turner SW, Foquet M, Craighead HG and Webb WW 2003. Zero-mode waveguides for single-molecule analysis at high concentrations Science 299 682–6 [DOI] [PubMed] [Google Scholar]
- [82].Foquet M, Samiee KT, Kong X, Chauduri BP, Lundquist PM, Turner SW, Freudenthal J and Roitman DB 2008. Improved fabrication of zero-mode waveguides for single-molecule detection J. Appl. Phys 103 034301 [Google Scholar]
- [83].Teng C-H, Lionberger TA, Zhang J, Meyhöfer E and Ku P-C 2012. Fabrication of nanoscale zero-mode waveguides using microlithography for single molecule sensing Nanotechnology 23 455301. [DOI] [PubMed] [Google Scholar]
- [84].Tseng AA 2005. Recent developments in nanofabrication using focused ion beams Small 1 924–39 [DOI] [PubMed] [Google Scholar]
- [85].Zaino LP, Grismer DA, Han D, Crouch GM and Bohn PW 2015. Single occupancy spectroelectrochemistry of freely diffusing flavin mononucleotide in zero-dimensional nanophotonic structures Faraday Discuss 184 101–15 [DOI] [PubMed] [Google Scholar]
- [86].Zhao J, Zaino LP III and Bohn PW 2013. Potential-dependent single molecule blinking dynamics for flavin adenine dinucleotide covalently immobilized in zero-mode waveguide array of working electrodes Faraday Discuss 164 57–69 [DOI] [PubMed] [Google Scholar]
- [87].Han D, Zaino LP III, Fu K and Bohn PW 2016. Redox Cycling in Nanopore-Confined Recessed Dual-Ring Electrode Arrays J. Phys. Chem. C 120 20634–41 [Google Scholar]
- [88].Han D, Crouch GM, Fu K, Zaino LP III and Bohn PW 2017. Single-molecule spectroelectrochemical cross-correlation during redox cycling in recessed dual ring electrode zero-mode waveguides Chem. Sci 8 5345–55 [DOI] [PMC free article] [PubMed] [Google Scholar]
- [89].Suutala A, Olkkonen J, Cox D, Lappalainen J and Jantunen H 2009. Inverted method for fabricating a nano-aperture device with subwavelength structures J. Vac. Sci. Technol. B 27 2457–61 [Google Scholar]
- [90].Eid J, Fehr A, Gray J, Luong K, Lyle J, Otto G, Peluso P, Rank D, Baybayan P, Bettman B et al. 2009. Real-time DNA sequencing from single polymerase molecules Science 323 133–8 [DOI] [PubMed] [Google Scholar]
- [91].Korlach J, Marks PJ, Cicero RL, Gray JJ, Murphy DL, Roitman DB, Pham TT, Otto GA, Foquet M and Turner SW 2008. Selective aluminum passivation for targeted immobilization of single DNA polymerase molecules in zero-mode waveguide nanostructures Proc. Natl. Acad. Sci. U.S.A 105 1176–81 [DOI] [PMC free article] [PubMed] [Google Scholar]
- [92].Goldschen-Ohm MP, Klenchin VA, White DS, Cowgill JB, Cui Q, Goldsmith RH and Chanda B 2016. Structure and dynamics underlying elementary ligand binding events in human pacemaking channels eLife 5 e20797. [DOI] [PMC free article] [PubMed] [Google Scholar]
- [93].Miyake T, Tanii T, Sonobe H, Akahori R, Shimamoto N, Ueno T, Funatsu T and Ohdomari I 2008. Real-time imaging of single-molecule fluorescence with a zero-mode waveguide for the analysis of protein− protein interaction Anal. Chem 80 6018–22 [DOI] [PubMed] [Google Scholar]
- [94].Zhao Y, Chen D, Yue H, Spiering MM, Zhao C, Benkovic SJ and Huang TJ 2014. Dark-field illumination on zero-mode waveguide/microfluidic hybrid chip reveals T4 replisomal protein interactions Nano Lett 14 1952–60 [DOI] [PMC free article] [PubMed] [Google Scholar]
- [95].MacBeath G and Schreiber SL 2000. Printing proteins as microarrays for high-throughput function determination Science 289 1760–3 [DOI] [PubMed] [Google Scholar]
- [96].Schmidt RC and Healy KE 2009. Controlling biological interfaces on the nanometer length scale J. Biomed. Mater. Res. A 90 1252–61 [DOI] [PubMed] [Google Scholar]
- [97].Laibinis PE, Hickman JJ, Wrighton MS and Whitesides GM 1989. Orthogonal self-assembled monolayers: alkanethiols on gold and alkane carboxylic acids on alumina Science 245 845–7 [DOI] [PubMed] [Google Scholar]
- [98].Michel R, Reviakine I, Sutherland D, Fokas C, Csucs G, Danuser G, Spencer ND and Textor M 2002. A novel approach to produce biologically relevant chemical patterns at the nanometer scale: Selective molecular assembly patterning combined with colloidal lithography Langmuir 18 8580–6 [Google Scholar]
- [99].Bergkvist M, Niamsiri N, Strickland AD and Batt CA 2008. Substrate selective patterning on lithography defined gold on silica: Effect of end-group functionality on intermolecular layer formation Surf. Sci 602 2121–7 [Google Scholar]
- [100].Love JC, Estroff LA, Kriebel JK, Nuzzo RG and Whitesides GM 2005. Self-assembled monolayers of thiolates on metals as a form of nanotechnology Chem. Rev 105 1103–70 [DOI] [PubMed] [Google Scholar]
- [101].Castner DG and Ratner BD 2002. Biomedical surface science: Foundations to frontiers Surf. Sci 500 28–60 [Google Scholar]
- [102].Cölfen H and Mann S 2003. Higher-order organization by mesoscale self-assembly and transformation of hybrid nanostructures Angew. Chem. Int. Ed 42 2350–65 [DOI] [PubMed] [Google Scholar]
- [103].Doron A, Katz E and Willner I 1995. Organization of Au colloids as monolayer films onto ITO glass surfaces: application of the metal colloid films as base interfaces to construct redox-active monolayers Langmuir 11 1313–7 [Google Scholar]
- [104].Nuzzo RG, Zegarski BR and Dubois LH 1987. Fundamental studies of the chemisorption of organosulfur compounds on gold (111). Implications for molecular self-assembly on gold surfaces J. Am. Chem. Soc 109 733–40 [Google Scholar]
- [105].Owens TM, Nicholson KT, Banaszak Holl MM and Süzer S 2002. Formation of alkylsilane-based monolayers on gold J. Am. Chem. Soc 124 6800–1 [DOI] [PubMed] [Google Scholar]
- [106].Owens TM, Nicholson KT, Fosnacht DR, Orr BG and Banaszak Holl MM 2006. Formation of mixed monolayers of silsesquioxanes and alkylsilanes on gold Langmuir 22 9619–22 [DOI] [PubMed] [Google Scholar]
- [107].Briand E, Humblot V, Landoulsi J, Petronis S, Pradier C-M, Kasemo B and Svedhem S 2010. Chemical modifications of Au/SiO2 template substrates for patterned biofunctional surfaces Langmuir 27 678–85 [DOI] [PubMed] [Google Scholar]
- [108].Kinz-Thompson CD, Palma M, Pulukkunat DK, Chenet D, Hone J, Wind SJ and Gonzalez RL Jr 2013. Robustly passivated, gold nanoaperture arrays for single-molecule fluorescence microscopy ACS Nano 7 8158–66 [DOI] [PMC free article] [PubMed] [Google Scholar]
- [109].Schwendel D, Dahint R, Herrwerth S, Schloerholz M, Eck W and Grunze M 2001. Temperature dependence of the protein resistance of poly-and oligo (ethylene glycol)-terminated alkanethiolate monolayers Langmuir 17 5717–20 [Google Scholar]
- [110].Zhao J, Branagan SP and Bohn PW 2012. Single-molecule enzyme dynamics of monomeric sarcosine oxidase in a gold-based zero-mode waveguide Appl. Spectrosc 66 163–9 [DOI] [PubMed] [Google Scholar]
- [111].Wenger J, Gérard D, Lenne P-F, Rigneault H, Dintinger J, Ebbesen TW, Boned A, Conchonaud F and Marguet D 2006. Dual-color fluorescence cross-correlation spectroscopy in a single nanoaperture: towards rapid multicomponent screening at high concentrations Opt. Express 14 12206–16 [DOI] [PubMed] [Google Scholar]
- [112].Sandén T, Wyss R, Santschi C, Hassaïne G r, Deluz C d, Martin OJ, Wennmalm S and Vogel H 2011. A zeptoliter volume meter for analysis of single protein molecules Nano Lett 12 370–5 [DOI] [PubMed] [Google Scholar]
- [113].Jiao X, Peterson EM, Harris JM and Blair S 2014. UV fluorescence lifetime modification by aluminum nanoapertures ACS Photonics 1 1270–7 [Google Scholar]
- [114].Elting MW, Leslie SR, Churchman LS, Korlach J, McFaul CM, Leith JS, Levene MJ, Cohen AE and Spudich JA 2013. Single-molecule fluorescence imaging of processive myosin with enhanced background suppression using linear zero-mode waveguides (ZMWs) and convex lens induced confinement (CLIC) Opt. Express 21 1189–202 [DOI] [PMC free article] [PubMed] [Google Scholar]
- [115].Morita Y, Fujimoto K, Iino R, Tomishige M, Shintaku H, Kotera H and Yokokawa R 2016. Single-molecule fluorescence imaging of kinesin using linear zero-mode waveguides IEEE SENSORS (Orlando, FL, 30 October 2016) [Google Scholar]
- [116].Fujimoto K, Morita Y, Iino R, Tomishige M, Shintaku H, Kotera H and Yokokawa R 2017. Linear zero mode waveguides for the study of chemo-mechanical coupling mechanism of kinesin IEEE 30th International Conference on MEMS (Las Vegas, NV, 22 Jan 2017) [Google Scholar]
- [117].Tsai A, Petrov A, Marshall RA, Korlach J, Uemura S and Puglisi JD 2012. Heterogeneous pathways and timing of factor departure during translation initiation Nature 487 390–3 [DOI] [PMC free article] [PubMed] [Google Scholar]
- [118].Fersht A 1999. Structure and mechanism in protein science: a guide to enzyme catalysis and protein folding (New York, NY: Macmillan; ). [Google Scholar]
- [119].Astier Y, Braha O and Bayley H 2006. Toward single molecule DNA sequencing: direct identification of ribonucleoside and deoxyribonucleoside 5’-monophosphates by using an engineered protein nanopore equipped with a molecular adapter J. Am. Chem. Soc 128 1705–10 [DOI] [PubMed] [Google Scholar]
- [120].Samiee KT, Foquet M, Guo L, Cox E and Craighead H 2005. λ-Repressor oligomerization kinetics at high concentrations using fluorescence correlation spectroscopy in zero-mode waveguides Biophys. J 88 2145–53 [DOI] [PMC free article] [PubMed] [Google Scholar]
- [121].Tsai A, Puglisi JD and Uemura S 2016. Chapter One-Probing the Translation Dynamics of Ribosomes Using Zero-Mode Waveguides Prog. Mol. Biol. Transl. Sci 139 1–43 [DOI] [PubMed] [Google Scholar]
- [122].Plénat T, Yoshizawa S and Fourmy D 2017. DNA-Guided Delivery of Single Molecules into Zero-Mode Waveguides ACS Appl. Mater. Interfaces 9 30561–6 [DOI] [PubMed] [Google Scholar]
- [123].Larkin J, Foquet M, Turner SW, Korlach J and Wanunu M 2014. Reversible positioning of single molecules inside zero-mode waveguides Nano Lett 14 6023–9 [DOI] [PMC free article] [PubMed] [Google Scholar]
- [124].Chen P, Gu J, Brandin E, Kim Y-R, Wang Q and Branton D 2004. Probing single DNA molecule transport using fabricated nanopores Nano Lett 4 2293–8 [DOI] [PMC free article] [PubMed] [Google Scholar]
- [125].Chansin GA, Mulero R, Hong J, Kim MJ, Demello AJ and Edel JB 2007. Single-molecule spectroscopy using nanoporous membranes Nano Lett 7 2901–6 [DOI] [PubMed] [Google Scholar]
- [126].Sauer M, Angerer B, Ankenbauer W, Földes-Papp Z, Göbel F, Han K-T, Rigler R, Schulz A, Wolfrum J and Zander C 2001. Single molecule DNA sequencing in submicrometer channels: state of the art and future prospects J. Biotechnol 86 181–201 [DOI] [PubMed] [Google Scholar]
- [127].Shi X, Gao R, Ying Y-L, Si W, Chen Y and Long Y-T 2015. An integrated system for optical and electrical detection of single molecules/particles inside a solid-state nanopore Faraday Discuss 184 85–99 [DOI] [PubMed] [Google Scholar]
- [128].Richards CI, Luong K, Srinivasan R, Turner SW, Dougherty DA, Korlach J and Lester HA 2012. Live-cell imaging of single receptor composition using zero-mode waveguide nanostructures Nano Lett 12 3690–4 [DOI] [PMC free article] [PubMed] [Google Scholar]
- [129].Wenger J, Rigneault H, Dintinger J, Marguet D and Lenne P-F 2006. Single-fluorophore diffusion in a lipid membrane over a subwavelength aperture J. Biol. Phys 32 SN1–SN4 [DOI] [PMC free article] [PubMed] [Google Scholar]
- [130].Edel JB, Wu M, Baird B and Craighead HG 2005. High spatial resolution observation of single-molecule dynamics in living cell membranes Biophys. J 88 L43–L5 [DOI] [PMC free article] [PubMed] [Google Scholar]
- [131].Wenger J, Conchonaud F, Dintinger J, Wawrezinieck L, Ebbesen TW, Rigneault H, Marguet D and Lenne P-F 2007. Diffusion analysis within single nanometric apertures reveals the ultrafine cell membrane organization Biophys. J 92 913–9 [DOI] [PMC free article] [PubMed] [Google Scholar]
- [132].Martin WE, Ge N, Srijanto BR, Furnish E, Collier CP, Trinkle CA and Richards CI 2017. Real-Time Sensing of Single-Ligand Delivery with Nanoaperture-Integrated Microfluidic Devices ACS Omega 2 3858–67 [DOI] [PMC free article] [PubMed] [Google Scholar]
- [133].Hustad S, Ueland PM and Schneede J 1999. Quantification of riboflavin, flavin mononucleotide, and flavin adenine dinucleotide in human plasma by capillary electrophoresis and laser-induced fluorescence detection Clin. Chem 45 862–8 [PubMed] [Google Scholar]
- [134].Kao Y-T, Saxena C, He T-F, Guo L, Wang L, Sancar A and Zhong D 2008. Ultrafast dynamics of flavins in five redox states J. Am. Chem. Soc 130 13132–9 [DOI] [PMC free article] [PubMed] [Google Scholar]
- [135].Fu K, Han D, Ma C and Bohn PW 2016. Electrochemistry at single molecule occupancy in nanopore-confined recessed ring-disk electrode arrays Faraday Discuss 193 51–64 [DOI] [PubMed] [Google Scholar]
- [136].Kätelhön E, Krause KJ, Singh PS, Lemay SG and Wolfrum B 2013. Noise characteristics of nanoscaled redox-cycling sensors: Investigations based on random walks J. Am. Chem. Soc 135 8874–81 [DOI] [PubMed] [Google Scholar]
- [137].Niwa O, Morita M and Tabei H 1990. Electrochemical behavior of reversible redox species at interdigitated array electrodes with different geometries: consideration of redox cycling and collection efficiency Anal. Chem 62 447–52 [Google Scholar]
- [138].Zhu F, Yan J, Pang S, Zhou Y, Mao B, Oleinick A, Svir I and Amatore C 2014. Strategy for increasing the electrode density of microelectrode arrays by utilizing bipolar behavior of a metallic film Anal. Chem 86 3138–45 [DOI] [PubMed] [Google Scholar]
- [139].Ma C, Contento NM, Gibson LR and Bohn PW 2013. Redox cycling in nanoscale-recessed ring-disk electrode arrays for enhanced electrochemical sensitivity ACS Nano 7 5483–90 [DOI] [PubMed] [Google Scholar]
- [140].Ma C, Contento NM and Bohn PW 2014. Redox cycling on recessed ring-disk nanoelectrode arrays in the absence of supporting electrolyte J. Am. Chem. Soc 136 7225–8 [DOI] [PubMed] [Google Scholar]
- [141].Fu K, Han D, Ma C and Bohn PW 2017. Ion selective redox cycling in zero-dimensional nanopore electrode arrays at low ionic strength Nanoscale 9 5164–71 [DOI] [PubMed] [Google Scholar]
- [142].Kinkhabwala A, Yu Z, Fan S, Avlasevich Y, Müllen K and Moerner W 2009. Large single-molecule fluorescence enhancements produced by a bowtie nanoantenna Nat. Photonics 3 654–7 [Google Scholar]
- [143].Novotny L and Van Hulst N 2011. Antennas for light Nat. Photonics 5 83–90 [Google Scholar]
- [144].Punj D, Mivelle M, Moparthi SB, Van Zanten TS, Rigneault H, Van Hulst NF, García-Parajó MF and Wenger J 2013. A plasmonic ‘antenna-in-box’ platform for enhanced single-molecule analysis at micromolar concentrations Nat. Nanotechnol 8 512–6 [DOI] [PubMed] [Google Scholar]