

Abstract
Carbonate rocks record the oldest forms of life on Earth, and their geologic reconstruction requires multiple methods to determine physical and chemical processes before conclusions of ancient biosignatures are made. Since crystal orientation within rock fabric may be used to infer geologic settings, we present here a complementary Raman method to study the orientation of calcite (CaCO3) and dolomite [CaMg (CO3)2] minerals. The relative peak intensity ratio of the carbonate lattice Eg modes T and L reveals the crystallographic orientation of calcite and dolomite with respect to the incident light polarization. Our results for calcite show that when the incident laser light propagates down the crystallographic a/b axis: (1) the L mode is always greater in intensity than the T mode (IT < IL), and (2) the spectra are most intense at 45° and least intense at 90° polarization angles measured from around the c axis. Our results for dolomite show that (1) IT > IL when the incident light propagation is down the crystallographic c axis and (2) IT < IL when the incident light propagation is down the crystallographic a/b axis. This study reveals mineral orientation variation related to deposition and paragenesis within limestone and dolostone samples. The method presented yields information related to growth and deformation during diagenetic and metamorphic alteration and may be used in research seeking to identify the fabric parameters of any calcite or dolomite containing rock. The compositional and structural data obtained from Raman mapping is useful in structural geology, materials science, and biosignature research.
Keywords: calcite, crystal orientation, dolomite, lattice mode, petrography
1 |. INTRODUCTION
The most common carbonate rocks are limestone and dolostone. Dolostones are composed of dolomite [CaMg (CO3)2] and were predominant carbonate rocks during the Precambrian and Paleozoic (>252 Ma), whereas limestones are composed of calcite (CaCO3) and prevail during the Mesozoic and Cenozoic (~252 Ma to present).[1] Although dolomite occurrence appears to increase with increasing age, the exact mechanisms behind this apparent trend are undefined (e.g., Machel[2]). Modern, or Holocene (<12 ka), dolomite occurrence is associated with evaporitic and normal-to-hypersaline peritidal settings (e.g., McKenzie[3] and Gregg et al.[4]), while ancient dolomite occurrences exist in many different settings and often allow for more than one genetic interpretation.[2,5]
After deposition, diagenesis and metamorphism (i.e., chemical and physical processes) alter the original sediments and rocks (e.g., Moore[6]). In high pressure and temperature metamorphic settings (amphibolite facies or greater), limestone and dolostone metamorphose to marble.[7–9] Metamorphism may result in overgrowth and interlocking of grains, which is easily observable under a microscope. Metamorphism may also produce less easily detectable preferred orientation of new minerals, in which situation minerals grow perpendicular to the direction of greatest stress, common at convergent plate boundaries where unidirectional pressures dominate.[10] Additionally, shear zones occur in compressional and extensional tectonic settings and may orient existing grains.[10] However, unlike schist and gneiss, grain orientation in marble is not visible with the unaided eye and requires microstructural analysis for determination.[11–13]
Calcite and dolomite are rhombohedral carbonate minerals[14] that belong to the trigonal crystal system.[15] Calcite consists of alternating layers of Ca2+ cations and (CO3)2− anions oriented normal to the c axis (Figure 1A) and belongs to the space group R-3c,[5,14] whereas dolomite is ideally composed of equal amounts of Ca2+ and Mg2+ cations arranged in alternating layers normal to the c axis[5] (Figure 1B) and belongs to the space group R-3.[16] Raman spectra patterns in calcite and dolomite originate from specific molecular bond vibrations from the oscillation of phonons from the carbonate (CO3) polyhedral,[17–20] which makes confocal Raman spectroscopy a valuable petrographic tool for the characterization of calcite and dolomite mineral structure, composition, temperature, and pressure estimates,[21] and the evaluation of crystallographic orientation.[21–24]
FIGURE 1.

The crystal structure of (a) calcite and (B) dolomite viewed along the a axis, visualized using VESTA.[67] Ca = blue, mg = orange, C = brown, and O = red. (C) the unit cell (outlined in black) looking down the c-axis, after rotating the crystal in (B) 90° (modified from Hsiao et al. 2019).[68] (D) simplified schematics of oriented crystal data from the RRUFF database compared to (E) thin section data used in this study
Experimental work exerting uniaxial extension and compression on carbonate samples shows that crystal preferred orientation (CPO) behaves similarly in limestone, dolostone, and marble.[25–28] Variations within carbonate rock fabrics (i.e., textural and structural criteria) are predominately controlled by temperature and pressure and may be used to infer geologic settings.[27,29,30] Additionally, weathering (i.e., the physical breakdown of rocks at the earth's surface) of carbonate rock is controlled by grain shape orientation, lattice orientation, composition (calcitic or dolomitic), grain boundary, and grain size.[31–34] Although most studies utilize multiple methods of X-ray and electron microscopy to determine the aforementioned characteristics of a sample, confocal Raman spectroscopy provides the orientation, composition, and imaging needed for grain shape, boundaries, and size, all within a single map, and can be a valuable tool for these studies.
For example, in geobiology research, the use of high-resolution confocal Raman spectroscopy has been crucial in studies that needed in situ detection and characterization (such as mapping) of organic compounds in rocks.[22,35–37] Additionally, the crystallographic orientation within rock fabric in the search for ancient biosignatures can improve our understanding of a sample's formation and alteration history of the mineral matrix and the organic compounds mapped.
Considerable geobiology research attention has been devoted to stromatolite structures. Stromatolites are laminated organosedimentary structures formed by the precipitation of carbonate minerals and the trapping and binding of fine-grained sediments by microbial communities,[38,39] and because stromatolites have been found within the oldest sedimentary formations, these types of rocks contain the oldest known fossil record of life.[40,41] Visible deformation of the naturally layered structure of stromatolites allows for a relative estimate of local deformation on a metamorphic grade scale. Since the orientation of grains and minerals within a rock's fabric may reveal depositional controls and diagenetic changes during burial,[42] crystal orientation in stromatolitic fabrics can be compared to regional geologic structures and help determine if these structures have undergone additional pressure regime that further deformed and damaged the lithologies and the contained organics.
In this paper, we employed confocal Raman spectroscopy to study ~1.8 Ma nodular limestone and ~515–500 Ma dolomitized stromatolites to determine crystal arrangement within carbonate rock fabrics. The motivation for this research is to resolve the type of pressure (confining vs. directional) applied to Cambrian stromatolites from the Valley and Ridge Province (Appalachian), that exhibit relatively well preserved primary fabric (fine laminae and fenestral porosity) and lack marble lithology but record temperatures of 260–322° C ± 30° C,[43] indicative of deep burial settings. In addition, limestone samples are used to examine whether the Raman spectra of calcite grains show trends that would help identify the crystal orientation. Although not present in the stromatolite samples used here, calcite is ubiquitous to ancient and modern stromatolites and therefore needed to extend this method for future studies involving calcite. Raman spectra of oriented calcite and dolomite samples from the RRUFF database were used as standards, and examples of calcite and dolomite were used from previously characterized samples to test this method. The results show that Raman intensities of the lattice modes T and L for both calcite and dolomite can be used as an indicator of changing crystal orientation in a sample. While the samples studied here are restricted to sedimentary carbonate rocks, the measurements reported can be performed on any calcite and dolomite containing materials.
2 |. SAMPLE CHARACTERIZATION
2.1 |. Allentown dolomite
The Late Cambrian (515–500 Ma) Allentown Formation from northern New Jersey, USA,[44–46] is composed of three dolomite phases that formed during different stages of diagenesis, resulting in varying crystal size, shape, and intercrystalline boundaries. They are characterized from oldest to youngest as microspar (M), zoned (Z), and saddle (S).[43] The microspar dolomite is a diagenetic replacement of precursory calcium carbonate phase(s) that were originally deposited in a marginal marine setting. Microspar dolomite ranges in size from 5 to 40 μm and exhibits nonplanar, closely packed anhedral crystals with irregular, intercrystalline grain boundaries. Organic carbon is exclusively distributed within this first generation of dolomite, as seen in the D and G peaks that average 1334 and 1601 cm−1, respectively. The zoned dolomite occurs as a cavity lining phase that exhibits Fe-enriched zonation bands under cathodoluminescence. Zoned dolomite ranges in size from 10 to 100 μm and exhibits planar, sub-hedral to anhedral crystals with straight compromised grain boundaries. The saddle dolomite ranges in size from 10 to >100 μm and exhibits nonplanar, saddle-shaped crystals that occur as a void-filling phase.
The Allentown Formation is situated in the region affected by convergent plate boundaries, associated with extensive folding from the tectonic events that formed the Appalachian Mountains.[47,48] Regional metamorphism of this type may produce shear zones and unidirectional pressure, which eventually may result in the preferred orientation of dolomite grains. We seek to determine if any of the multi-generational dolomite exhibits preferred orientation from the tectonic setting or random orientation from deposition during the stromatolites' lithification and diagenesis.
2.2 |. Olduvai Gorge calcite
The Quaternary (~1.8 Ma) Olduvai Basin in Tanzania, East Africa, consists of limestone intercalated with clastics and volcanics.[49,50] Nodular limestone was deposited in freshwater seeps and contains calcite spherulites (0.5-mm to 3-cm diameter) that occur as rosettes composed of multiple generations of radiating acicular to fiberous crystals around a central core.[49] The rosette cores consist of blocky calcite, peloidal clusters, or small micritic clumps, with two or more generations of calcite spar radiating outwards.[49]
The Olduvai basin is located in the East African Rift Valley (EAR) where divergent plate boundaries may have caused localized strain from extensional rifting and faulting. Some grain alignment may result from this kind of tectonic regime; however, based on previous studies, we do not expect the limestone samples to exhibit preferentially oriented grains.[49–51] We seek to determine if the calcite cores and spar exhibit different crystallographic orientations.
3 |. METHODS
3.1 |. Mineralogy and geochemistry
Powder X-ray diffraction (XRD) and Electronprobe Microanalyses (EPMA) results for RRUFF calcite and dolomite standards were taken from the RRUFF database. Stoichiometry and trace element data were recorded for each dolomite sample using the supplied single-crystal XRD and microprobe data files. Results are listed in Table S1.
XRD and inductively coupled plasma optical emission spectroscopy (ICP-OES) results for the Olduvai Gorge calcite samples used in this study were previously reported by Ashley et al.[49,50] and are listed in Table S1.
XRD and EPMA results for the Allentown dolostone samples used in this study were previously reported in Murphy et al.[43] and are listed in Table S1.
3.2 |. Raman spectroscopy
Analyses of calcite and dolomite with known crystal orientation were performed on spectra from the RRUFF project database[52] (Table S1) and used as standards to compare to thin section data collected in this study. RRUFF data used were collected at the University of Arizona in the Mineralogy and Crystallography Lab using an open access instrument built on an optical table by Alex Goncharov and Victor Struzhkin, with a 514.5 nm argon ion laser and a Jobin Yvon Spex HR 460 spectrometer equipped with a liquid nitrogen cooled Princeton Instruments 1152 × 256 pixel CCD detector.[52] RRUFF data were collected from single crystals mounted onto a goniometer stage and rotated to a known orientation relative to the incident (laser) light propagation and polarization directions (Figure 1D). A fiducial mark was used to indicate the direction of a crystallographic axis relative to the laser's polarization.[52] Spectra were collected with the incident light propagating along the crystallographic c and a axis. Because the a and b axes are equivalent in the hexagonal crystal structure (a = b ≠ c), the relative intensity trends when the light is propagating down the a axis will be equivalent for light propagating down the b axis. Crystals were rotated around the light propagation direction, and Raman spectra were collected when the incident light polarization was 0°, 45°, and 90° relative to the crystallographic axes as indicated by the fiducial mark. The data were downloaded and plotted in Excel and normalized to the intensity of the highest peak, which is the A1g(internal) mode between 1077–1087 and 1092–1100 cm−1 (nondegenerate, v1) for calcite and dolomite, respectively. Intensity ratios between the lattice Eg(external) translational phonons (T) at 146– 156 and 171–179 cm−1 and liberational phonons (L) at 272–281 and 290–302 cm−1 were then analyzed to determine if their relative intensity is correlated to crystal orientation relative to the incident light propagation/polarization direction. A two-tailed paired T-test (P = 0.05) was applied to test that the results for any given calcite and dolomite propagation direction and polarization measurement angle differ significantly from one another.
Raman spectra of limestone and dolostone samples were acquired at Rutgers University in the Department of Earth and Environmental Sciences using a WITec alpha300 equipped with a frequency-doubled Nd:YAG (532 nm) excitation laser and a ×100 (NA 0.9) Zeiss objective lens (Figure 1E). Spectral peak positions were calibrated against a silicon standard. Raman spectra for Figure 7 were acquired at Carnegie Institution of Washington in the Geophysical Laboratory using a WITec α-Scanning Near-Field Optical Microscope customized to incorporate confocal Raman spectroscopic imaging. The excitation source was a WITec frequency-doubled solid-state yttrium-aluminum-garnet (YAG) laser (532 nm) with a ×20 objective lens. All spectra were collected on a Peltier-cooled Andor electron multiplying charge-coupled device (EMCCD) chip after passing through a f/4300-mm focal length imaging spectrometer using 600 grooves/mm grating.
WITec Project 5+ software was used to collect and process all Raman data. An eighth-order polynomial Savitzky–Golay filter was used to smooth the spectra. Gaussian peak fitting was performed on the Raman modes v1, T, and L. A Gaussian peak fit was used because it resulted in a better fit compared to the Lorentz peak fit.
To visualize the different crystal orientations within our Raman maps, the L/v1 (calcite) and T/L (dolomite) peak intensity ratios were displayed as a function of sample surface position using the WITec calculator dialog. The WITec spectral mask tool was used to differentiate between different mineral grains based on their relation to the maximum and minimum ratio values of the Raman map's intensity scale bar. This way, we isolated the extreme crystal orientations within each map based on L/v1 or T/L band intensity ratios. Spectral masks were generated using either WITec's draw tools and hand-selecting spectral areas that were then extracted as a draw field mask, or by setting a relative intensity threshold (based on the Raman map's spectral scale) in WITec's calculator dialog and then extracted as a calculator image. Therefore, each extracted mask image comprises all sample grains with orientations that result in a given Raman band intensity ratio.
Spectra from these image masked areas were averaged and exported to Excel, where they were normalized to the v1 peak's intensity and overlain to observe peak shifts in the intensity of the T and L lattice modes. In circumstances where fluorescence was present, a shape fit background subtraction with a shape size of 80 was applied using the background fitting tool of the WITec Project 5 software. Background fitting was confirmed to not artificially alter the relative intensities of the processed spectra. Mapped areas range from 16,000 to 1,920,000 spectra points, and extracted spectrum masks range from 567 to 1,680,000 spectra points.
It is important to note that unlike the RRUFF sample data, our thin sections likely consist of minerals oriented at all angles and are not limited to the orientations examined in the RRUFF database. Therefore, when generating the spectral masks, we selected the maximum and minimum observed Raman intensity ratios from each sample. For example, for an image with a max peak intensity ratio of 1.145 (Raman intensity ratios), a mask with a relative intensity threshold of >1 will isolate the most intense spectra (max band intensity ratio) and thus the grain(s) orientation(s) that corresponds to that particular ratio. The same process was used for middle and minimum peak intensity ratios. The maximum and minimum values used to create each mask were: Olduvai calcite's L/v1 intensity ratio was >0.7 and <0.1 (Figure 4); Allentown dolomite's T/L intensity ratio was 1.2 to 1.8 and 0.7 to 0.8 (Figure 5); 1.7 to 2.9 and 0.7 to 0.8 (Figure 6); >1.0 and <1.0 (Figure 7). Note that masks created by setting a relative intensity threshold have greater than or less than values, while masks created with the draw tool have an approximate range of values.
Extracted mask image values include: Olduvai calcite's L/v1 intensity ratio ranged from 0.200 to 0.610 (Figure 4); Allentown dolomite's T/L intensity ratio ranged from 0.976 to 1.031 (Figure 5); 0.985 to 1.010 (Figure 6); 0.637 to 1.149 (Figure 7). For each range listed, the highest ratio was the maximum mask used, the median ratio between each range was the middle mask used (i.e., when T = L for dolomite), and the lowest ratio was the minimum mask used.
4 |. RESULTS AND DISCUSSION
4.1 |. Mineralogy and geochemistry
The Olduvai calcite ranges from pure calcite to Mg-excess calcite and includes trace elements Mg, Fe, Sr, and Mn.[49] The Allentown dolomite ranges from low Ca-excess to low Mg-excess, is poorly to well ordered, and includes trace elements Fe, Si, Mn, and Zn.[43] Most natural dolomites deviate from the ideal[5,53,54] dolomite chemistry of pure CaMg (CO3)2 and include trace elements in the carbonate lattice,[55] as well as various cationic ordering.[16,56] Since Raman vibration modes are sensitive to structure and composition,[21] and the wavelength (cm−1) of the external lattice modes, T and L, are structure specific,[57] the variations in crystal structure (stoichiometry and cationic ordering) and composition (trace elements) were determined to rule out any affects these variations may have on the resulting Raman spectra (Table S1). Results show that regardless of differences in dolomite structure and composition, the wavenumbers and the peak intensity trends in lattice modes T and L are comparable across all samples (Table S2). Therefore, stoichiometry and chemistry do not appear to have a measurable effect on the lattice vibrational modes changes in peak intensity; and rather, it is the crystallographic orientation that causes intensity shifts.
4.2 |. Raman spectroscopy
The (CO3)2− group's Raman vibrational modes were observed, on average, at 1436, 1085, 711, 281, and 154 cm−1 for calcite, and 1442, 1097, 724, 298, and 175 cm−1 for dolomite, due to asymmetric stretching (v3), symmetric stretching (v1), symmetric deformation (v4), and liberational and translational (L and T), respectively[20,58] (Table S2 and Figures 2 and 3). The Olduvai samples did not exhibit a calcite peak at v3, and this is likely due to high fluorescence in these samples, which may have obscured this peak from view. Olduvai thin sections were previously stained with potassium (K) ferricyanide and alizarin red-S,[49,50] most of which were removed with deionized water for this study; however, some peaks still remain in the 1200 to 1500 cm−1 region of the spectrum (Figure 4C). The Allentown samples exhibit a dolomite peak at 1775 cm−1 (combination band of v1 + v4).[57,59,60] and organic carbon peaks at 1334 and 1601 cm−1 (Figures 5–7).
FIGURE 2.

RRUFF calcite sample used as standard (RRUFF ID R050130). (A) and (B) Raman spectra stack plots illustrating the effects of changing crystal orientation on T and L mode peak intensities. Data are normalized to the (v1) peak 1087 cm−1. Blue = polarization measured parallel (0°) to sample's crystallographic axis; red = polarization measured 45° to sample's crystallographic axis; green = polarization measured perpendicular (90°) to sample's crystallographic axis. (C) Comparison of calcite L/v1 peak intensity ratios for c and a/b axis laser propagation directions
FIGURE 3.
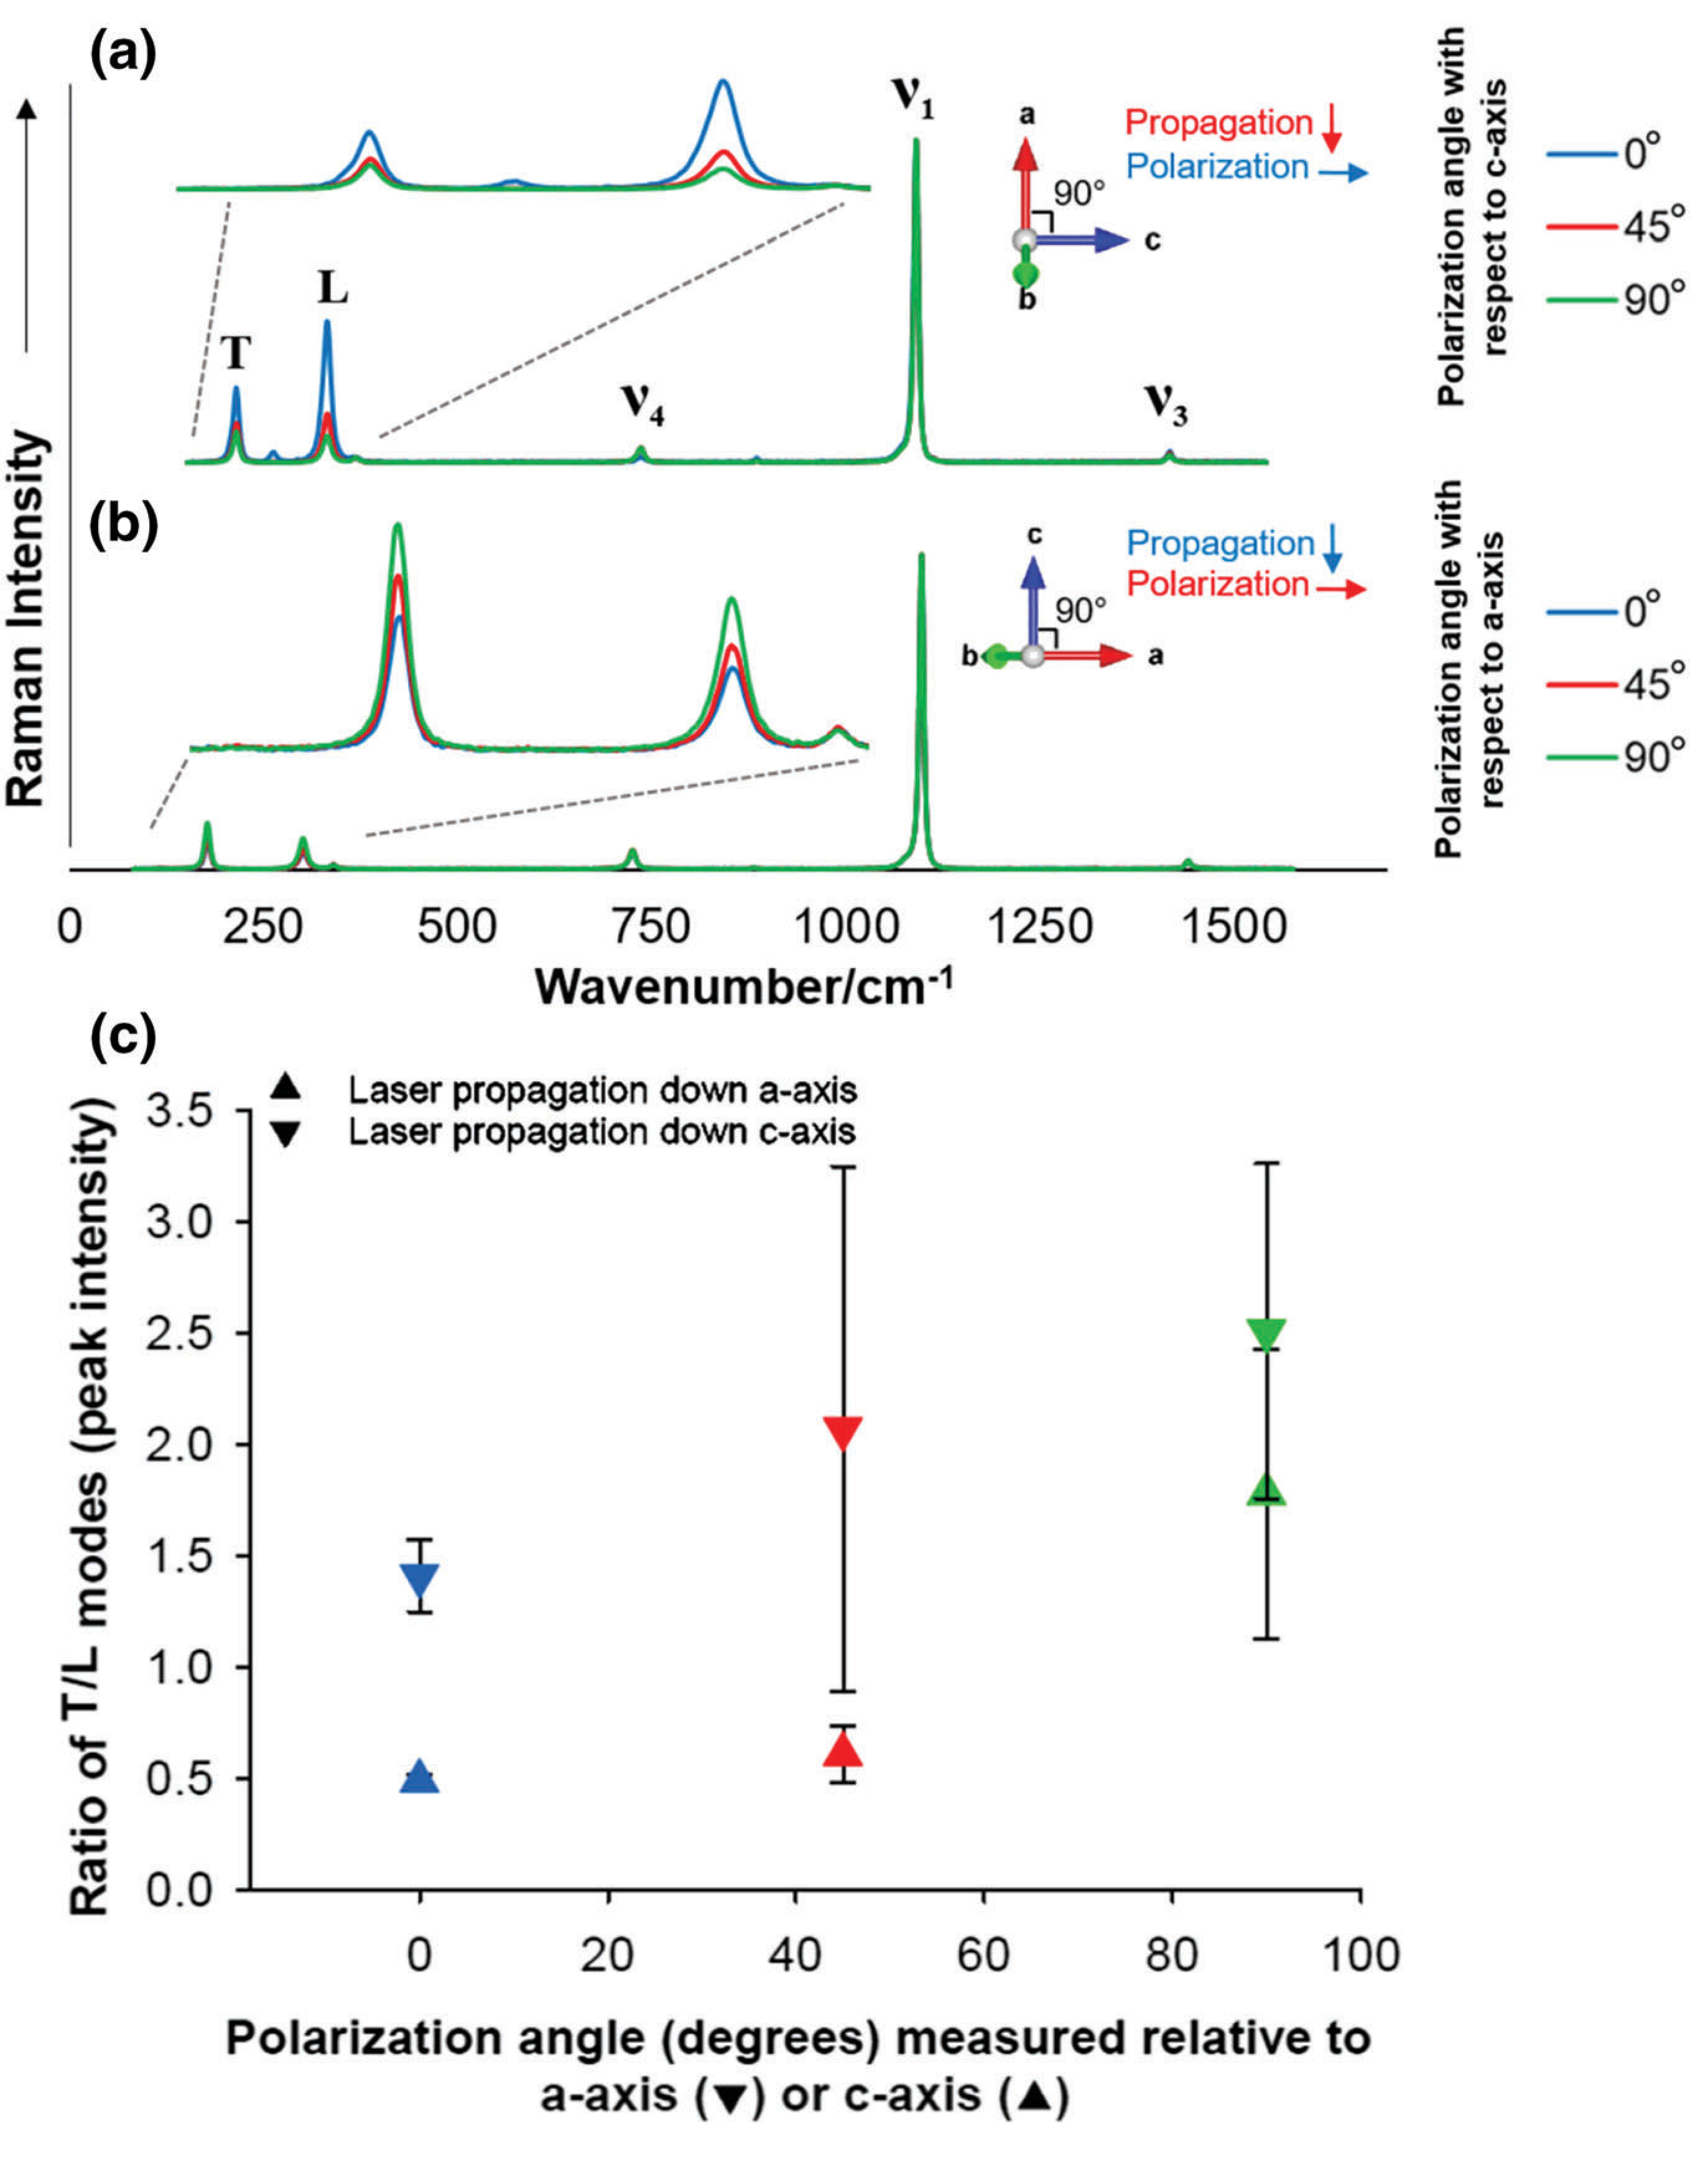
RRUFF dolomite sample used as standard (RRUFF ID R050357). (a and B) Raman spectra stack plots illustrating the effects of changing crystal orientation on T and L mode peak intensities. Data are normalized to the (v1) peak 1,098 cm−1. Blue = polarization measured parallel (0°) to sample's crystallographic axis; red = polarization measured 45° to sample's crystallographic axis; green = polarization measured perpendicular (90°) to sample's crystallographic axis. (C) Comparison of dolomite T/L peak intensity ratios from c and a/b axis laser propagation directions
4.2.1 |. RRUFF standards
Calcite
RRUFF standards reveal that the L/v1 relative intensity changes when the laser propagation direction is parallel to the a axis, and the polarization measurements are taken with the incident polarization 0°, 45°, and 90° relative to the c axis (Figure 2A). No apparent relative intensity change is evident when the laser propagation direction is parallel to the c axis, and the polarization measurements are taken from 0°, 45°, and 90° relative to the a axis (Figure 2B). RRUFF data points in Figure 2C are the average intensity ratios across five samples (Table S2), and error bars are the standard deviation values. Figure 2 shows that whether the incoming laser propagation direction is parallel to the c or a/b axis, and regardless of the polarization angle, the L mode's intensity is always greater than the T mode's intensity (IT < IL). It is also revealed that the L/v1 relative intensity increases when the incident light propagates down the a axis and the angle between the incident light polarization and c axis is changed from 90°, to, 0°, to 45° (Figure 2). T test results reveal a statistical difference (P < 0.05) between normalized intensities of the L mode (L/v1) polarization measurements from 0°, 45°, and 90° with respect to the c axis. The T mode shows no such trend.
Dolomite
RRUFF standards reveal relative crystal orientation changes based on laser propagation direction and relative intensity ratios of the lattice modes T and L. Figure 3 shows that when the laser propagation direction is down the c axis, and the polarization measurements are taken at different polarization angles with respect to the a axis, the T mode's intensity is greater than the L mode's intensity (IT > IL). Conversely, when the laser propagation direction is down the a axis, and polarization measurements are taken with respect to the c axis, the T mode's intensity is less than the L mode's intensity (IT < IL), except at 90° when IT > IL is observed. RRUFF data points in Figure 3C are the average intensity ratios across five samples (Table S2), and error bars are the standard deviation values. Unlike calcite, there is no obvious trend in the spectral intensity of the L (or T) mode at different laser polarization degrees of orientation to dolomite's crystallographic axes (Figure 3). Note the RRUFF database's polarization angles measured around the a axis has higher intensity ratios than polarization angles measured around the c axis because the T mode is more intense than the L mode when spectra are collected with the laser propagating down the a/b axis (Figure 3C). T test results revealed that the T/v1 and L/v1 ratios vary (P = 0.1) between normalized intensities at 0° and 90° polarization measurements with respect to the c axis, but not the a axis. At 0° polarization angle, there is a significant difference (P < 0.05) between the c and a axis for T/v1 and L/v1 ratios.
4.2.2 |. Limestone and dolostone samples
Throughout the Olduvai thin sections, the v1 mode ranges from 1076–1078 cm−1, T mode from 145 to 147 cm−1, and L mode from 271 to 274 cm−1. Average peak positions are reported in Table S1. Raman maps of L/v1 relative intensities reveals varying crystal orientation within the core and spar phases of calcite, though the exact grain orientations cannot be determined (Figure 4B). The calcite exhibits various L/v1 relative intensities (Figure 4D), which is indicative of varying crystal orientation (Figure 2A), displayed as varying brightness within mapped areas (Figure 4B). As expected, the local tectonic settings did not produce preferred crystal orientation in the Olduvai samples, and the calcite's core and spar phases show random orientations.
FIGURE 4.

(A) Transmitted light photomicrograph of a calcite rosette from Olduvai limestone thin section (red box marks the Raman mapped area). (B) Raman map of L/v1 peak intensity ratios where different levels of brightness indicate different crystal orientations. Red, green, and blue crosses mark the areas where average spectra were taken and are shown in (C) and (D). (C) Overlay of average spectra from areas in (B), before fluorescence removal and after. (D) the same spectra from (C) normalized to the v1 peak and showing IT < IL as expected for calcite
The Olduvai calcite samples display relative L/v1 peak intensity ratios (0.20 to 0.61) that are much larger than the RRUFF samples (0.03 to 0.20). This disparity is likely because the Olduvai crystals are positioned in orientations outside of what is recorded in the RRUFF database.
Throughout the Allentown thin sections, the v1 mode ranges from 1,083–1,100 cm−1, T mode from 161 to 180 cm−1, and L mode from 286 to 304 cm−1. Average peak positions are reported in Table S1. Raman mapping reveals varying crystal orientation within the first (M) and second (Z) generations of dolomite. The dolomite exhibits various relative intensities (Figures 5–7), indicating varying crystal orientation for adjacent grains. The green and blue map overlay (Figure 6E) allows for easy differentiation of relatively small intensity ratio changes between grains. Figure 7 shows a larger mapped area that best illustrates the stromatolite's microstructure by showing the randomly orientated microspar and zoned dolomite in addition to revealing the saddle dolomite is oriented in the same direction. For these samples, we observe a relative T/L intensity ratio of 0.64 to 1.15. Because this intensity ratio is less than that which can be observed (RRUFF database) when light is propagating along the c axis (1.41 to 2.51), the observed crystals cannot be oriented with their c axis parallel to the incident light propagation direction, and their intensity ratios suggest that the light propagation direction is closer to that of the a/b crystallographic axes. The results indicate that although the Allentown dolostone was buried up to 10 km,[61] the randomly oriented first (M) and second (Z) generations of dolomite were not exposed to unidirectional stress that would be strong enough to align or elongate grains, but rather lithostatic and uniform confining pressures during burial diagenesis. These findings support the authors' conclusion that the randomly oriented M and Z dolomites formed at or very near the surface in low-pressure settings.[43] Despite the regional metamorphism in the area, the Allentown was likely exhumed early or not buried deep enough during the orogenies to experience shearing or the pressure settings necessary to orient existing mineral grains. The saddle dolomites are oriented in the same direction, which is likely the result of a preferred growth pattern where overlapping subcrystals grew nearly perpendicular to the c axis[62,63] during deep burial.
FIGURE 5.

(A) Transmitted light photomicrograph of mapped area (red box) of microspar dolomite from Allentown dolostone thin section. Corresponding peak intensity maps for T, L, and v1 showing varying intensity among peaks; brighter areas indicate greater peak intensity. Scale bars are 3 microns long. (B) Raman map of T/L peak intensity ratios indicating different crystal orientations. Black and white crosses mark the areas where average spectra were taken and are shown in (C) and (D). (C) Average spectra of areas containing large T/L ratios in (B) showing IT > IL. (D) Average spectra taken from dark areas of (B) where IT < IL
FIGURE 7.

(A) Raman map of dolomite where the peak intensity ratio (IT/IL) shows the variations in crystal orientation throughout two generations of dolomite (M and Z), while the third generation (S) is oriented in the same direction. Brighter areas indicate greater peak intensity. (B) Transmitted light photomicrograph of Allentown dolomite sample. Red box denotes mapped area in (A). M, Z, and S mark the different generations of dolomite, microspar (M, small dark gray crystals), zoned (Z, larger bright white crystals), and saddle (S, very large white to light gray crystals). (C) Average spectra from bright areas (zoned dolomite). (D) Average spectra from dull areas (saddle dolomite)
FIGURE 6.

(A) Transmitted light photomicrograph of mapped area (red box) across two generations of dolomite crystals, microspar (M) and zoned (Z) dolomite from an Allentown dolostone thin section. (B) Raman map of T/L peak intensity ratios of the dolomite from mapped area in (a). Brighter areas indicate greater peak intensity. (C) Green map of T mode peak intensity where lighter green areas indicate greater peak intensity. (D) Blue map of L mode peak intensity where lighter blue areas indicate greater peak intensity. (E) Superposition of green (T mode) and blue (L mode) maps of (C) and (D) showing the light blue area (black cross) of a zoned dolomite crystal. (F) and (G) are average spectra taken from the areas marked with white and black crosses that show the relative change in crystal orientation as observed by the T and L Raman mode peaks
The Allentown dolomite samples display relative T/L peak intensity ratios (0.64 to 1.15) that fall between c and a/b axis laser propagation directions from the RRUFF database (0.49 to 2.51). This difference is likely because Allentown crystals are positioned in orientations outside of what is recorded in the RRUFF database. Additionally, the differences between the maximum observed T/L intensity ratios between Allentown images (Figures 5–7) is likely due to different crystal orientations where the maps with a lower maximum ratio value simply do not contain grains at the same orientation(s) as the maps that exhibit larger maximum ratio values.
The conditions under which carbonate minerals form and alter will play a direct role in the resulting rock's texture (including the arrangement and orientation of grains), a better understanding of which will help reconstruct the rock's formational history. Mineral orientation is important in polygenetic carbonate mineral studies where multiple stages of crystal formation and alteration may have taken place under different settings. Raman analysis of mineral orientation may be useful when the orientation of grains can be used to help differentiate stages of extant mineral growth from new grain formation within the same matrix.[64] Materials scientists seeking to understand fabric parameters related to degradation of carbonate rock used in building materials, monuments, and sculptures may also benefit from this application in the selection of building materials and repair of existing historic structures. Structural geology studies, which have typically relied on electron backscatter diffraction (EBSD),[65] a scanning electron microscope (SEM) based surface technique, can instead use Raman spectra to determine crystal orientation to back up claims of pressure settings. Raman analyses require less sample preparation and user time than EBSD analyses. However, the Raman method presented here only qualitatively measures crystal orientation; therefore, the need for exact crystal orientation measurements would still require either EBSD analyses or polarized Raman measurements elucidating the form of the Raman polarizability tensors. However, polarized Raman measurements elucidating the shapes of the Raman polarizability tensors[66] require the use of a polarization analyzer, which is not standard equipment on many Raman instruments. The method presented here shows that qualitatively examining crystal orientation has the benefit of not needing a polarization analyzer and can be performed using essentially any Raman instrument. The technique described here is of great use as an initial, fast and qualitative measure of carbonate grain orientation that can be used to elucidate areas of interest for further analysis using EBSD.
5 |. CONCLUSION
Calcite reveals spectra trends related to crystal orientation when the laser propagation direction is oriented down the a/b axis. No dependence of L/v1 relative intensity on crystal orientation is observed when the incident light is propagated down the c axis. Changes in crystal orientation are observed in the L/v1 relative intensities when light is propagated down the a/b-axes and polarization is measured with respect to the c axis. For this case, the maximum L/v1 value is observed with a light polarization at ~45° from the c axis and a minimum observed at ~90°. Calcite's relative peak intensity trends allow for peak intensity mapping using L/v1 to reveal mineral orientation changes that can be displayed as a Raman map.
Dolomite reveals spectra trends related to crystal orientation when the laser propagation direction is oriented down the c- and a/b-axes. Changes in crystal orientation are observed in the relative L and T lattice mode intensities. Dolomite reveals two trends related to laser propagation down the c and a/b axis: (1) dolomite crystals oriented with laser propagation down the a/b axis and polarization measured from the c axis have IT < IL relative intensities, except at 90° when IT > IL is observed and (2) dolomite crystals oriented with laser propagation down the c axis and polarization measured from the a axis have IT > IL relative intensities regardless of laser polarization angles at 0°, 45°, and 90°. Dolomite's relative peak intensity trends allow for peak intensity mapping use T/L to reveal relative mineral orientation changes that can be displayed as a Raman map.
This study introduces a method to qualitatively examine the relative crystallographic orientations of calcite and dolomite solely from their Raman spectral relative intensities. The data can be displayed as an image of relative Raman intensity of the L/v1 and T/L modes across a sample surface. This method enables examination of preferred mineral orientation within rocks, which may yield information related to growth and deformation during diagenetic and metamorphic alteration of any calcite or dolomite containing rocks. Results presented here have improved upon conclusions in Murphy et al.[43] by resolving the type of pressure applied to the Allentown stromatolites. Overall, this work presents a method to quickly examine the qualitative orientations of the two most common carbonate mineral grains (calcite and dolomite) and can be performed on essentially any Raman instrument to target areas of interest for further EBSD analyses. This complimentary Raman method allows for a more comprehensive interpretation of geologic samples from Raman spectra and expands the usefulness of Raman data in geologic and materials sciences.
Supplementary Material
ACKNOWLEDGMENTS
We thank Professors Gail Ashley and Carol de Wet for loan of Olduvai samples. This work was supported by NASA ASTEP (NNX14AT28G to M.G.) and NASA NAI ENIGMA–Rutgers University (80NSSC18M0093).
Funding information
NASA, Grant/Award Numbers: 80NSSC18M0093, NNX14AT28G
Footnotes
SUPPORTING INFORMATION
Additional supporting information may be found online in the Supporting Information section at the end of this article.
REFERENCES
- [1].Ronov AB, American Geological Institute, American Geological Institute, Falls Church, Va. 1983, 88. [Google Scholar]
- [2].Machel HG, in The Geometry and Petrogenesis of Dolomite Hydrocarbon Reservoirs, (Eds: Braithwaite CJR, Rizzl G, Darke G), UK, London: 2004. 7. [Google Scholar]
- [3].McKenzie JA, J. Geol 1981, 89, 185. [Google Scholar]
- [4].Gregg JM, Howard SA, Mazzullo SJ, Sedimentology 1992, 39, 143. [Google Scholar]
- [5].Gregg JM, Bish DL, Kaczmarek SE, Machel HG, Sedimentology 2015, 62, 1749. [Google Scholar]
- [6].Moore CH, Carbonate Diagenesis and Porosity 46, Elsevier, Amsterdam; 1989. 338. [Google Scholar]
- [7].Liu FL, Gerdes A, Liou JG, Xue HM, Liang FH, J. Metamorph. Geol 2006, 24, 569. [Google Scholar]
- [8].Peck WH, Volkert RA, Meredith MT, Rader EL, J. Geol 2006, 114, 485. [Google Scholar]
- [9].Seaton NCA, Whitney DL, Teyssier C, Toraman E, Heizler MT, Tectonophysics 2009, 479, 241. [Google Scholar]
- [10].Earle S, Physical Geology, 2nd ed. BCcampus, Victoria, B.C. 2019. retrieved from https://opentextbc.ca/geology/. CC BY 4.0 license. [Google Scholar]
- [11].Barnhoorn A, Bystricky M, Burlini L, Kunze K, J. Struct. Geol 2004, 26, 885. [Google Scholar]
- [12].Oesterling N, Heilbronner R, Stunitz H, Barnhoorn A, Molli G, J. Struct. Geol 2007, 29, 681. [Google Scholar]
- [13].Pieri M, Kunze K, Burlini L, Stretton I, Olgaard DL, Burg J-P, Wenk H-R, Tectonophysics 2001, 330, 119. [Google Scholar]
- [14].Graf DL, Am. Mineral 1961, 46, 1283. [Google Scholar]
- [15].Bragg WL, Proc. R. Soc. Lond. A 1914, 89, 468. [Google Scholar]
- [16].Graf DL, Goldsmith JR, J. Geol 1956, 64, 173. [Google Scholar]
- [17].Bhagavantam S, Venkatarayudu T, Proc. Indian Acad. Sci. A 1939, 9, 224. [Google Scholar]
- [18].Bhagavantam S, Proc. Indian Acad. Sci. A 1940, 11, 62. [Google Scholar]
- [19].Frost RL, Hales MC, Wain DL, J. Raman Spectrosc 2008, 39, 108. [Google Scholar]
- [20].Sun J, Wu Z, Cheng H, Zhang Z, Frost RL, Spectrochim. Acta a Mol. Biomol. Spectrosc 2014, 117, 158. [DOI] [PubMed] [Google Scholar]
- [21].Ishibashi H, Arakawa M, Ohi S, Yamamoto J, Miyake A, Kagi H, J. Raman Spectrosc 2008, 39, 1653. [Google Scholar]
- [22].Bower D, Steele A, Fries MD, Green OR, Lindsay JR, Astrobiology 2016, 16, 169. [DOI] [PMC free article] [PubMed] [Google Scholar]
- [23].Wall M, Nehrke G, Biogeosciences 2012, 9, 4885. [Google Scholar]
- [24].Nedungadi TMK, Proc. Ind. Acad. Sci 1939, 10, 197. [Google Scholar]
- [25].Neumann E, J. Geol 1969, 77, 426. [Google Scholar]
- [26].Rutter EH, Casey M, Burlini L, J. Struct. Geol 1994, 16, 1431. [Google Scholar]
- [27].Ebert A, Herwegh M, Evans B, Pfiffner A, Austin N, Vennemann T, Tectonophysics 2007, 444,1. [Google Scholar]
- [28].Austin N, Evans B, J. Geophys. Res 2009, 114, B09402. [Google Scholar]
- [29].Wenk HR, Venkitasubramanyan CS, Baker DW, Contr. Mineral. And Petrol 1973, 38, 81. [Google Scholar]
- [30].Fernandez FJ, Rodriguez I, Escuder-Viruete J, Perez-Estaunn A, Tectonophysics 2016, 686, 116. [Google Scholar]
- [31].Shushakova V, Fuller ER Jr., Siegesmund S, Environ. Earth Sci 2011, 63, 1587. [Google Scholar]
- [32].Shushakova V, Fuller ER Jr., Siegesmund S, Environ. Earth Sci 2013, 69, 1263. [Google Scholar]
- [33].Conti P, Microstructures, textures and material properties of marble rocks; an introduction, University of Siena, Italy: 2013. [Google Scholar]
- [34].Andriani GF, Germinario L, Environ. Earth Sci 2014, 72, 2523. [Google Scholar]
- [35].Allwood AC, Walter MR, Marshall CP, Vib. Spectrosc 2006, 41, 190. [Google Scholar]
- [36].Sforna M, van Zuilen M, Philippot P, Geochim. Cosmochim. Acta 2014, 124, 18. [Google Scholar]
- [37].Olcott Marshall A, Jehlicka J, Rouzaud JN, Marshall CP, Gondwana Research 2014, 25, 284. [Google Scholar]
- [38].Walter MR, Stromatolites, Elsevier, New York: 1976. 790. [Google Scholar]
- [39].Paerl HW, Steppe TF, Reid RP, Environ. Microbiol 2001, 3, 123. [DOI] [PubMed] [Google Scholar]
- [40].Barghoorn ES, Tyler SA, Science 1965, 147, 563. [DOI] [PubMed] [Google Scholar]
- [41].Allwood AC, Walter MR, Kamber BS, Marshall CP, Burch IW, Nature 2006, 441, 714. [DOI] [PubMed] [Google Scholar]
- [42].Flügel E, Microfacies of Carbonate Rocks, Springer-Verlag, Berlin: 2004. 976. [Google Scholar]
- [43].Murphy AE, Wieman ST, Gross J, Stern JC, Steele A, Glamoclija M, Sediment. Geol 2020, 410, 105777. [Google Scholar]
- [44].Weller S, New Jersey Geological Survey Report on Paleontology 3, Trenton, NJ: 1903. [Google Scholar]
- [45].Howell BF, Geological Society of America Memoir 1945, 12, 1355. [Google Scholar]
- [46].Dalton RF, Volkert RA, Monteverde DH, Herman GC, Canace RJ, New Jersey Geological and Water Survey, Trenton, NJ: 2014. [Google Scholar]
- [47].Miller BL, Pennsylvania Geological Survey 4th Series Bulletin C 39, Harrisburg, PA: 1941. [Google Scholar]
- [48].Drake AA Jr., Geological Survey Bulletin 1194-L, United States Geological Survey, Washington, D. C. 1965. [Google Scholar]
- [49].Ashley GM, de Wet CB, Barboni D, Magill CR, Depos. Rec 2016, 2,4. [Google Scholar]
- [50].Ashley GM, de Wet CB, Houser LM, Delaney JS, Depos. Rec 2020, 2,1. [Google Scholar]
- [51].Ashley GM, de Wet CB, Dominguez-Rodrigo M, Karis AM, O'Reilly TM, Baluyot R, J. Sediment. Res 2014, 84, 988. [Google Scholar]
- [52].Lafuente B, Downs RT, Yang H, Stone N, in Highlights in Mineralogical Crystallography, (Eds: Armbruster T, Danisi RM), W. De Gruyter, Berlin, Germany: 2015. 1. [Google Scholar]
- [53].Machel HG, Encyclopedia of Earth Science, Springer, Berlin, Heidelberg: 1978. [Google Scholar]
- [54].Goldsmith JR, Graf DL, Am. Mineral 1958, 43, 84. [Google Scholar]
- [55].Land LS, Publ 1980, 28, 87. [Google Scholar]
- [56].Pina CM, Pimentel C, Crespo A, Chem. Geol 2020, 547, 119667. [Google Scholar]
- [57].Dufresne WJB, Rufledt CJ, Marshall CP, J. Raman Spectrosc 2018, 49, 1999. [Google Scholar]
- [58].Liu LG, Mernagh TP, Am. Mineral 1990, 7–8, 801. [Google Scholar]
- [59].Rutt HN, Nicola JH, J. Phys. C: Solid State Phys 1974, 7, 4522. [Google Scholar]
- [60].Gunasekaran S, Anbalagan G, Pandi S, J. Raman Spectrosc 2006, 37, 892. [Google Scholar]
- [61].Harris AG, Repetski JE, Stamm NR, Weary DJ, US Geol. Surv 1995, 95–557. [Google Scholar]
- [62].Radke BM, Mathis RL, J. Sediment. Petrol 1980, 50, 1149. [Google Scholar]
- [63].Kostecka A, J. Sediment. Res 1995, 65, 332. [Google Scholar]
- [64].Katz A, J. Geol 1971, 79, 38. [Google Scholar]
- [65].Jellison GE, Leonard DN, Anovitz LM, Parish CM, Specht ED, Rosseel TM, J. Appl. Phys 2018, 124, 223102. [Google Scholar]
- [66].Turrell G, Infrared and Raman Spectra of Crystals, Academic Press, London and New York: 1972. 384. [Google Scholar]
- [67].Momma K, Izumi F, J. Appl. Crystallogr 2011, 44, 1272. [Google Scholar]
- [68].Hsiao Y-H, Wang B, La Plante EC, Pignatelli I, Anoop Krishnan NM, Le Pape Y, Neithalath N, Bauchy M, Sant G, Npj Mater. Degrad 2019, 3, 36. [Google Scholar]
Associated Data
This section collects any data citations, data availability statements, or supplementary materials included in this article.