

Abstract
Background:
Chronic rhinosinusitis (CRS) without nasal polyps (CRSsNP) is a common disease and is characterized by multiple inflammatory endotypes. However, molecular mechanisms in CRSsNP are poorly understood compared to polypoid CRS.
Objective:
To identify mechanisms and biomarkers associated with inflammatory endotypes underpinning CRSsNP.
Methods:
Ethmoid tissues and nasal lavage fluids (NLF) were obtained from control patients and patients with CRS. The gene expression profiles were determined by microarray as well as quantitative RT-PCR and expression of proteins was measured by ELISA and Luminex.
Results:
Microarray found that 126, 241, and 545 genes were >3-fold and significantly elevated in CRSsNP with type (T) 1 endotype (T1 CRSsNP), T2 CRSsNP, and T3 CRSsNP, respectively, compared to control tissue. Selected identified genes were confirmed by RT-PCR. Gene set enrichment analysis suggested that T1 CRSsNP was associated with IFN-γ-signaling and anti-viral immunity controlled by T cells (Th1 and CD8+), NK cells and antigen presenting cells (APC); T2 CRSsNP was associated with STAT6-signaling and IgE-mediated activation controlled by eosinophils, mast cells, Th2 cells, ILC2 and APC; and T3 CRSsNP was associated with IL-17-signaling, acute-inflammatory response, complement-mediated inflammation and infection controlled by neutrophils, Th17 cells, B cells and APC. Results suggest that T1 (CXCL9 and CXCL10), T2 (eosinophilic proteins and CCL26) and T3 (CSF3) endotypic biomarkers in NLF may be able to distinguish tissue endotypes in CRSsNP.
Conclusions:
Inflammatory endotypes in CRSsNP were controlled by different molecular mechanisms. NLF biomarker assays may allow for more precise and personalized medical treatments in CRS.
Keywords: Chronic rhinosinusitis without nasal polyps, Endotype, Transcriptome, Biomarker
Capsule summary
T1, T2 and T3 endotypes in CRSsNP were controlled by distinct gene signatures with different molecular mechanisms, and nasal lavage fluid biomarker assays may allow for more precise and personalized medical treatments in CRS.
INTRODUCTION
Chronic rhinosinusitis (CRS) is a common clinical syndrome responsible for over 400,000 surgeries per year and a total annual cost to the US health system estimated at $22 billion.1–3 CRS is frequently divided into two main phenotypes: CRS with nasal polyps (CRSwNP) and CRS without nasal polyps (CRSsNP). CRSwNP is primarily characterized by type 2 (T2) inflammation, especially in Western countries.4–8 Furthermore, many transcriptome and proteome analyses have identified mechanisms and molecules associated with T2 (eosinophilic) CRSwNP as well as non-eosinophilic CRSwNP.8–13
Despite the fact that 75–90% of all CRS patients are classified as CRSsNP, study of this phenotype has been complicated by use of variable sinonasal biopsy sites having inherent tissue-specific molecular differences (e.g. in host defense molecule expression),14 obscuring the underlying heterogeneity of inflammation. While in CRSwNP it is obvious to study nasal polyp (NP) tissue, investigators have used tissue biopsies from different anatomic locations within the sinonasal cavity to evaluate inflammatory patterns in CRSsNP, leading to issues with reproducibility in the literature. We recently evaluated biopsies from three anatomic structures commonly removed at the time of endoscopic nasal surgeries - inferior turbinate, uncinate tissue and ethmoid tissue (ET) - and demonstrated a variable degree of inflammation in these sites in CRSsNP; in general, ET had both the highest level of inflammation and the greatest heterogeneity of inflammation.5 For example, significant elevations in expression of T2 markers (Charcot-Leyden crystal galectin [CLC] and IL-13) and the type 3 (T3) marker, IL-17A were found only in ET but not in inferior turbinate or uncinate tissue, indicating that ET is a more important location for these types of inflammation in non-polypoid disease.5 We further found that the distinct inflammatory endotypes found in ET were associated with distinct clinical presentations in patients with CRSsNP.7 These results suggest that ET might be the best sinonasal tissue in which to study CRSsNP pathogenesis.
In the US and Europe, it has become clearer that the most frequent inflammatory endotype in CRSsNP is T2, as opposed to T1 or T3.4–7, 15, 16 However, the mechanisms of T2 inflammation in CRSsNP, other than elevation of eosinophil markers and T2 cytokines, have not been determined. In addition, the mechanisms underlying the T1 and T3 endotypes in CRSsNP are still largely unknown. Furthermore, since published studies have all utilized samples obtained at the time of sinus surgery, the relative frequencies of these endotypes in patients who do not require surgery are not known. Mindful of these limitations, we set out to better understand specific mechanisms and biomarkers in each CRSsNP endotype by examining gene expression profiles in ET using microarray.
METHODS
Patients and tissue collection
Patients with CRS and control patients were recruited from the Otolaryngology clinic and the Northwestern Sinus Center of Northwestern Medicine. Detailed information and characteristics of subjects in this study are shown in this article’s Online Repository at www.jacionline.org (Supplementary Table E1–E3). All patients signed informed consent forms and the protocol governing procedures for this study was approved by the Institutional Review Board of Northwestern University Feinberg School of Medicine.
Real-time quantitative RT-PCR and microarray
Detailed methods for real-time quantitative RT-PCR (qRT-PCR) and information about primers and probes (Supplementary Table E4) are shown in this article’s Online Repository. The mRNA expression levels were normalized to a housekeeping gene, β-glucuronidase (GUSB).
Microarray analysis with SurePrint G3 Human Gene Expression 8×60K v2 Microarray (Agilent Technologies) was performed according to the manufacturer’s instructions at University of North Carolina Lineberger Comprehensive Cancer Center, within the Genomics Core Facility. The data were log 2 transformed, normalized by global normalization, centered and then analyzed using Subio Platform ver. 1.23 (Subio Inc., Kagoshima, Japan). Gene ontology (GO) enrichment analysis and pathway analysis were performed by g:Profiler. GO and pathways associated with endotypes were identified based on an adjusted p value <0.05 by g:SCS algorithm.17
Protein assays
Nasal lavage fluid (NLF) was obtained from patients before surgery. After suctioning the nasopharynx, 8 ml of PBS was sprayed through a syringe toward the middle meatus, and the resultant fluid was collected. Tissue extract was prepared by homogenization with a Bullet Blender Blue (Next Advance, Averill Park, NY). The protein concentrations of each biomarker in cell free supernatants were determined by commercial ELISA and Luminex kits. Detailed methods are shown in this article’s Online Repository.
Statistical analysis
All statistical calculations were performed using Graphpad Prism version 6.07 (GraphPad Software, La Jolla, CA), Subio Platform and g:Profiler. Differences between groups were analyzed using the 1-way ANOVA Kruskal-Wallis Dunn’s multiple comparison test or the Mann-Whitney test. A p value of less than 0.05 was considered significant.
RESULTS
Identification of endotype-related genes in CRSsNP
We collected ET from 42 control subjects, 126 CRSsNP patients and 55 CRSwNP patients and NP tissues from 63 CRSwNP patients (Supplementary Table E1) and identified T1, T2 and T3 endotypes by expression of IFN-γ, CLC and IL-17A, respectively, using qRT-PCR (Supplementary Fig. E1). We next selected 5 CRSsNP patients with only T1 endotype (T1 CRSsNP), 8 with only T2 endotype (T2 CRSsNP) and 5 with only T3 endotype (T3 CRSsNP) for subsequent microarray analyses (Supplementary Fig. E1 and Table E2). We also included ET from 9 CRSsNP patients that had no detectable elevations of T1, T2, or T3 inflammation (which we refer to as untypeable endotype (Tun CRSsNP) (Supplementary Fig. E1)) and from 11 patients without sinonasal disease. Finally, 8 ET and 9 NP were included from patients with CRSwNP.
After filtering by exclusion of non-annotated genes, weakly expressed genes and undetectable genes, we found that 31, 126, 241 and 545 genes (probes) were >3-fold significantly elevated in Tun, T1, T2 and T3 CRSsNP, respectively, compared to controls in microarray analysis (Table 1 and Supplementary Table E5). We found that over one third of the up-regulated genes in Tun CRSsNP were uncharacterized “LOC” genes or pseudogenes (Supplementary Table E5) and GO and pathway analyses did not identify any specific terms (not shown). Therefore we did not further focus on Tun CRSsNP in the current study.
Table 1.
Top 15 up-regulated genes in each endotype of CRSsNP
| Probe ID | Gene | Fold | p-value |
|---|---|---|---|
| T1 | |||
| A_33_P3343175 | CXCL10 | 15.4 | 2.39E-06 |
| A_23_P112026 | IDO1 | 14.6 | 3.39E-06 |
| A_24_P303091 | CXCL10 | 14.3 | 9.54E-06 |
| A_23_P18452 | CXCL9 | 10.9 | 9.17E-05 |
| A_24_P852756 | HLA-DQA2 | 9.5 | 5.11E-06 |
| A_23_P81898 | UBD | 9.3 | 2.21E-07 |
| A_23_P151294 | IFNG | 9.2 | 5.21E-04 |
| A_33_P3273884 | HLA-DQA1 | 7.4 | 3.69E-04 |
| A_23_P125278 | CXCL11 | 7.2 | 1.35E-04 |
| A_33_P3293049 | HLA-DQA1 | 6.9 | 1.82E-04 |
| A_23_P128993 | GZMH | 6.6 | 1.81E-04 |
| A_33_P3408913 | SAA2 | 6.6 | 9.46E-04 |
| A_23_P22565 | FATE1 | 6.3 | 4.50E-04 |
| A_33_P3364089 | SLCO1B3 | 6.2 | 1.03E-04 |
| A_23_P46105 | HAO2 | 6.1 | 3.28E-03 |
| T2 | |||
| A_24_P125335 | CCL13 | 173.3 | 3.15E-10 |
| A_23_P55270 | CCL18 | 146.7 | 2.27E-08 |
| A_23_P101683 | CLC | 139.6 | 1.78E-08 |
| A_23_P144126 | FETUB | 123.2 | 5.76E-06 |
| A_23_P112859 | CST1 | 82.1 | 1.81E-05 |
| A_24_P237175 | CST2 | 64.4 | 1.11E-05 |
| A_33_P3387991 | CEBPE | 54.1 | 2.96E-08 |
| A_33_P3514487 | VSTM1 | 49.9 | 1.42E-08 |
| A_23_P215484 | CCL26 | 40.1 | 5.12E-06 |
| A_23_P251031 | IL13 | 33.6 | 2.11E-05 |
| A_23_P250302 | CCR3 | 30.1 | 2.26E-08 |
| A_23_P153390 | CLEC4G | 28.2 | 3.55E-06 |
| A_23_P51217 | CLCA1 | 26.1 | 9.10E-04 |
| A_23_P101992 | MARCO | 16.3 | 5.00E-07 |
| A_23_P321223 | PMCH | 15.6 | 2.09E-04 |
| T3 | |||
| A_23_P501754 | CSF3 | 108.6 | 7.14E-06 |
| A_23_P87238 | SAA4 | 56.5 | 1.57E-05 |
| A_23_P121695 | CXCL13 | 50.7 | 6.98E-03 |
| A_33_P3222424 | CSF3 | 47.8 | 1.20E-04 |
| A_33_P3408913 | SAA2 | 47.6 | 3.48E-05 |
| A_33_P3408918 | SAA2 | 47.3 | 5.26E-05 |
| A_24_P556318 | SAA3P | 46.9 | 2.95E-03 |
| A_23_P331560 | SLC26A4 | 40.2 | 1.22E-03 |
| A_33_P3254844 | CEACAM7 | 36.1 | 9.88E-05 |
| A_23_P17065 | CCL20 | 31.2 | 7.04E-04 |
| A_33_P3260430 | SPRR2A | 29.8 | 1.12E-02 |
| A_21_P0014941 | SDIM1 | 24.2 | 9.46E-05 |
| A_23_P150316 | MMP12 | 23.2 | 2.93E-04 |
| A_23_P26024 | C15orf48 | 23.0 | 1.97E-07 |
| A_23_P386478 | TNIP3 | 19.3 | 4.83E-03 |
Mechanisms of inflammation in T1 CRSsNP
We first manually searched 126 genes that were up-regulated in T1 CRSsNP and observed that they were highly associated with IFN-γ-mediated signaling and IFN-γ producing cells. These included IFNG itself, IFN-γ-induced genes18, 19, MHC-related molecules, T cell-associated genes, NK cell- and CD8+ T cell-associated genes, and acute inflammatory and host defense molecules20, 21 (Table 2). To further understand the potential mechanisms of inflammation, we performed GO and pathway analyses using the up-regulated genes in each CRSsNP endotype (Fig. 1 and Supplementary Tables E6–E8). GO enrichment analysis identified 156 biological process terms that were significantly associated with T1 endotype (Fig. 1A and Supplementary Table E6). 88 terms including immune response and defense response were shared across all three endotypes (Fig. 1A). We noted that 33 terms were found only in T1 CRSsNP, including IFN-γ-mediated signaling pathway, antigen processing and presentation, NK cell mediated immunity and defense response to virus (Fig. 1B). KEGG pathway analysis identified 32 pathways that associated with T1 endotype (Supplementary Table E6) and 12 pathways that were associated only with T1 endotype including antigen presentation, viral infection, NK cell mediated cytotoxicity and T helper cell differentiation (Fig. 1CD). These results suggest that inflammation in T1 CRSsNP is controlled by T cells, NK cells and antigen presenting cells (APC).
Table 2.
Associated functions of up-regulated genes in T1 CRSsNP
| Association | Up-regulated gene in T1 CRSsNP compared to control ET |
|---|---|
| IFN-γ-induced | CXCL9, CXCL10, CXCL11, IDO1, GBP1, GBP5, UBD, STAT1, MHC-related genes |
| MHC-related | HLA-B, HLA-F, HLA-DPA1, HLA-DPB1, HLA-DPB2, HLA-DQA1, HLA-DQA2, HLA-DQB1, HLA-DQB2, HLA-DRA, HLA-DRB1, HLA-DRB3, HLA-DRB4, HLA-DRB5, HLA-DMA, HLA-DMB, CIITA, CD74 |
| T cell | CD3D, CD3G, CTLA4, TRAT1, CD8A |
| NK cell- and CD8+ T cell | GZMA, GZMB, GZMH, CD96, CD160, NCR3, ZNF683 |
| Acute inflammatory and host defense | CFB, SAA2, SAA4, TF |
Figure 1. Endotype specific GO biological processes and KEGG pathways in CRSsNP.
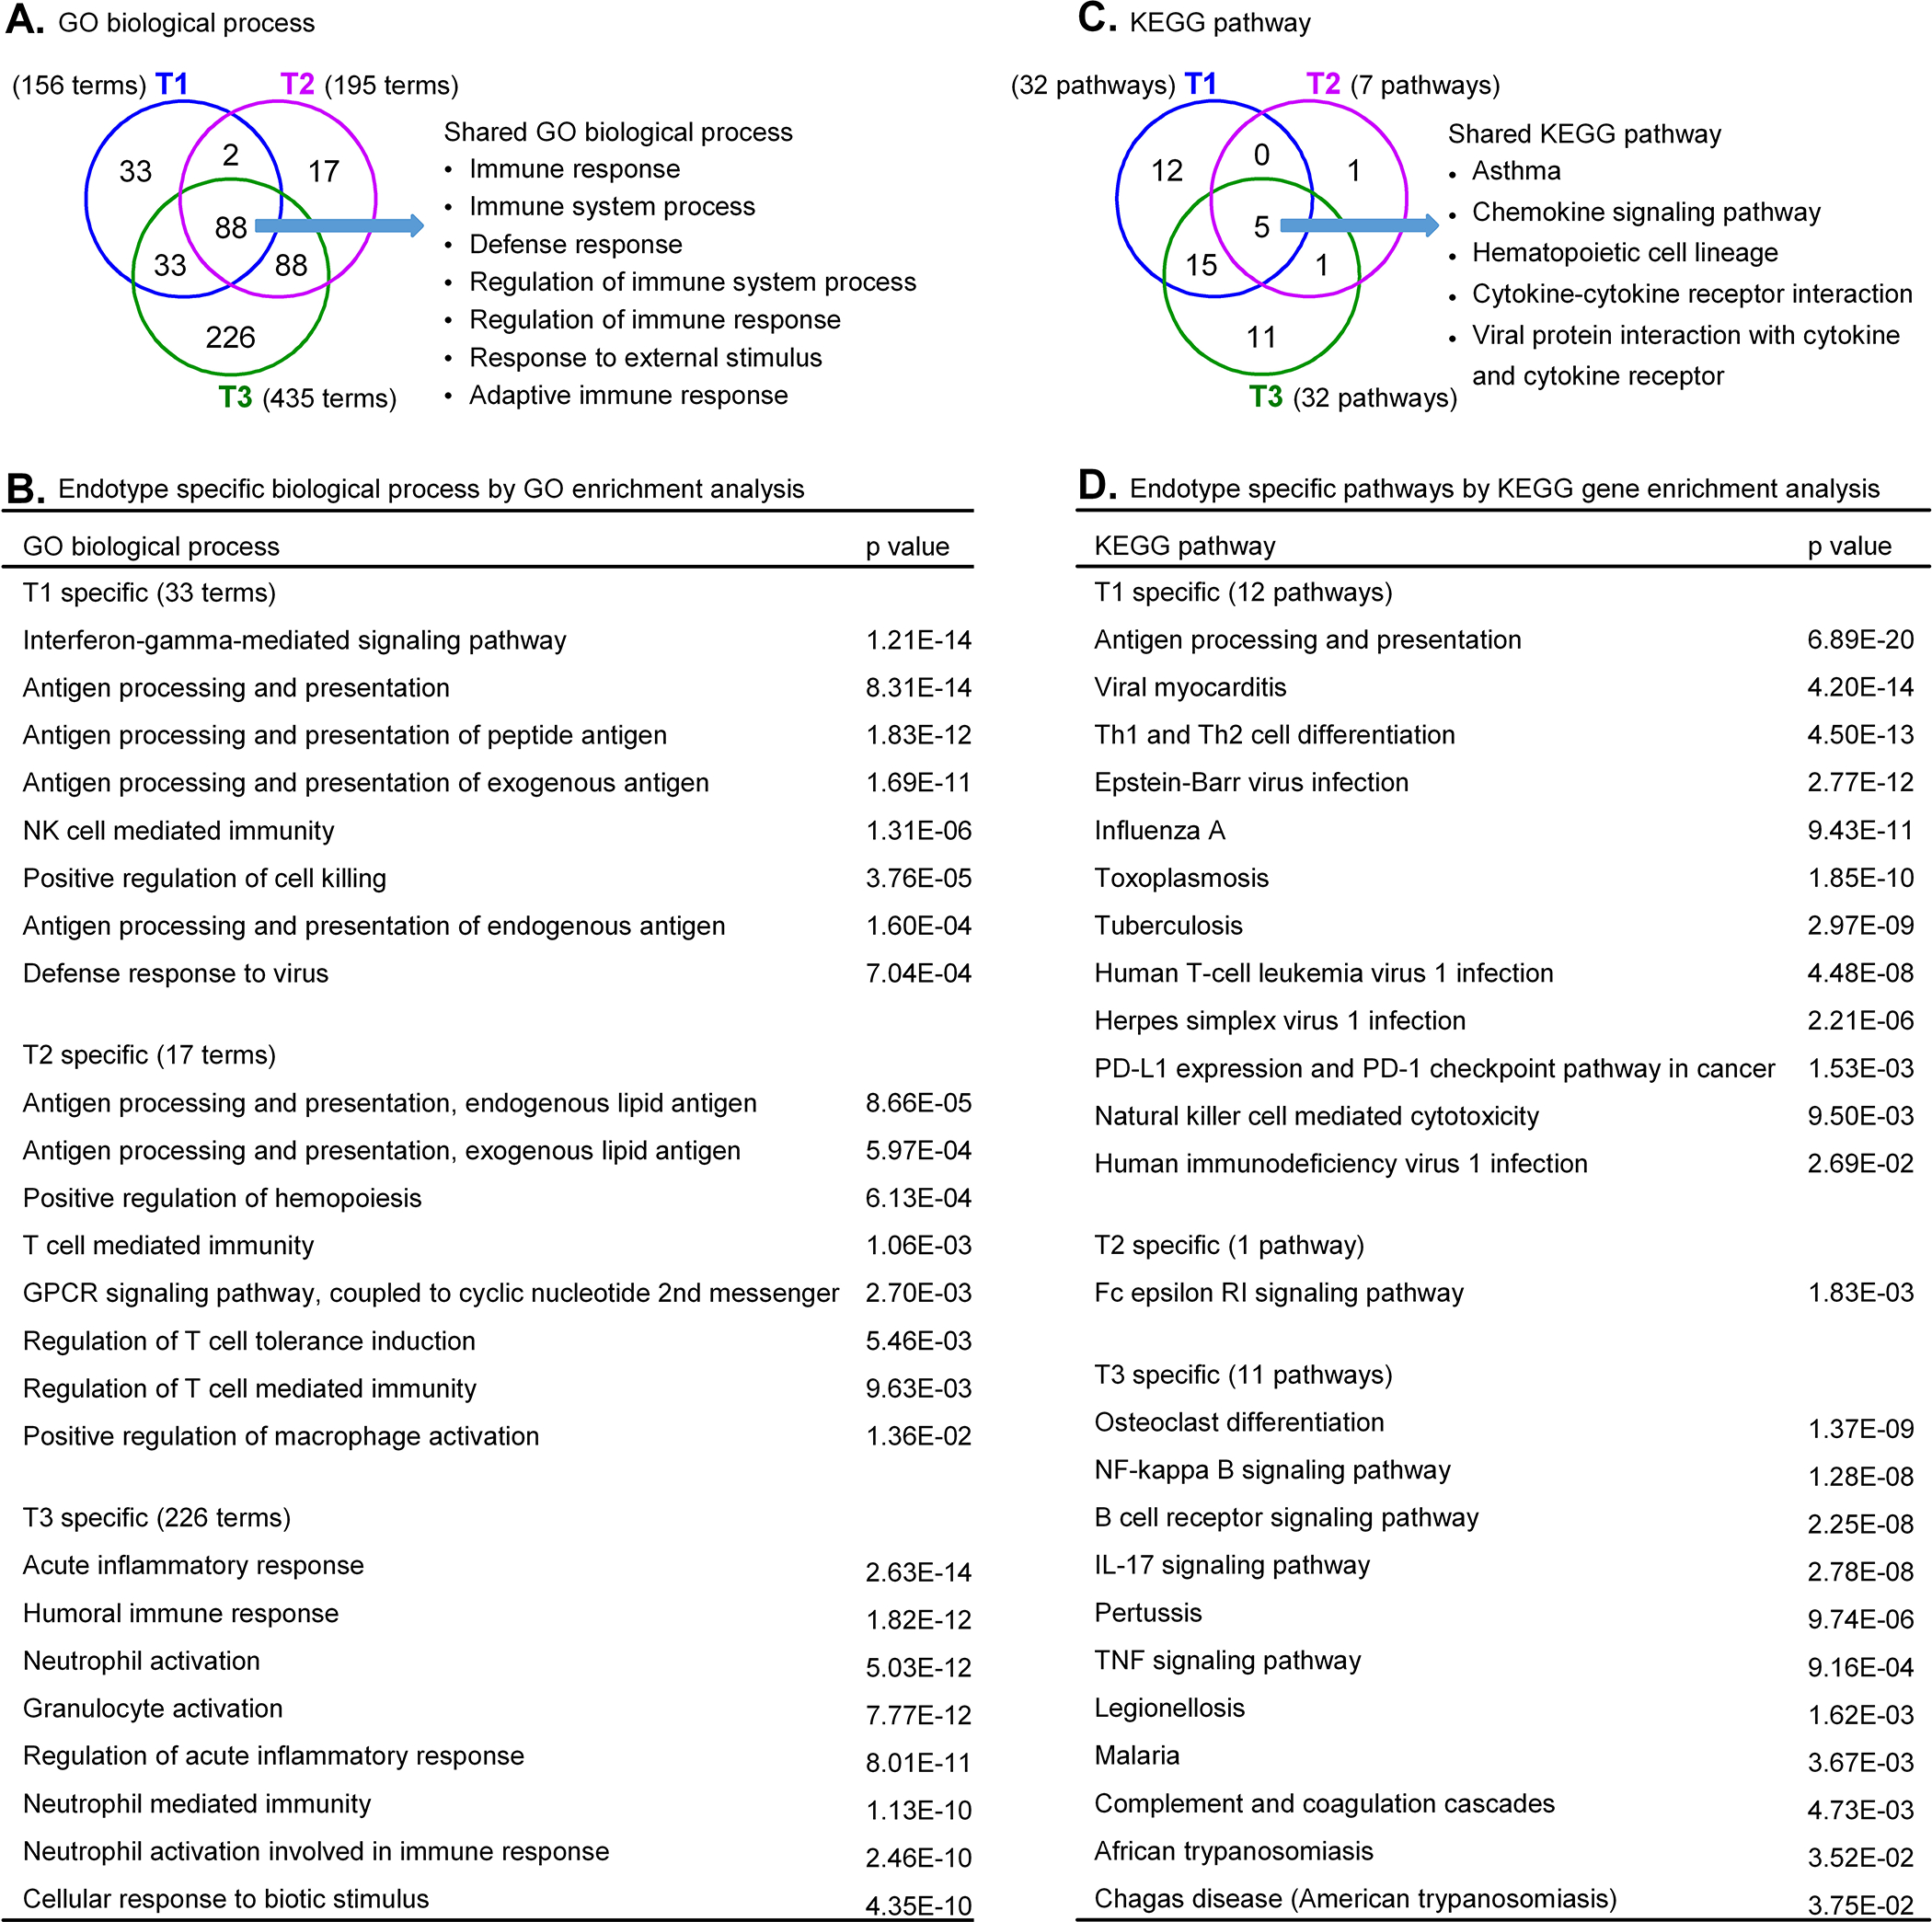
Venn diagrams showed the overlaps and endotype specific GO biological processes (A) and KEGG pathways (C) in CRSsNP. Eight specific GO biological processes for each endotype are shown in B. The complete list of endotype specific GO biological processes is shown in Supplemental Tables E6–E8. Endotype specific KEGG pathways are shown in D.
Biomarkers of T1 CRSsNP in tissue
To identify specific biomarkers that are only elevated in the T1 endotype, we next screened >3-fold significantly up-regulated genes in T1 endotype compared to control and all other endotypes of CRSsNP and identified 12 genes which included IFNG, CXCL9, CXCL10 and CXCL11 (Fig. 2AB). Clustering analysis also showed that these 12 genes were highly elevated only in T1 CRSsNP (Fig. 2B).
Figure 2. T1 CRSsNP specific genes in tissue and biomarkers of T1 endotype in NLF.
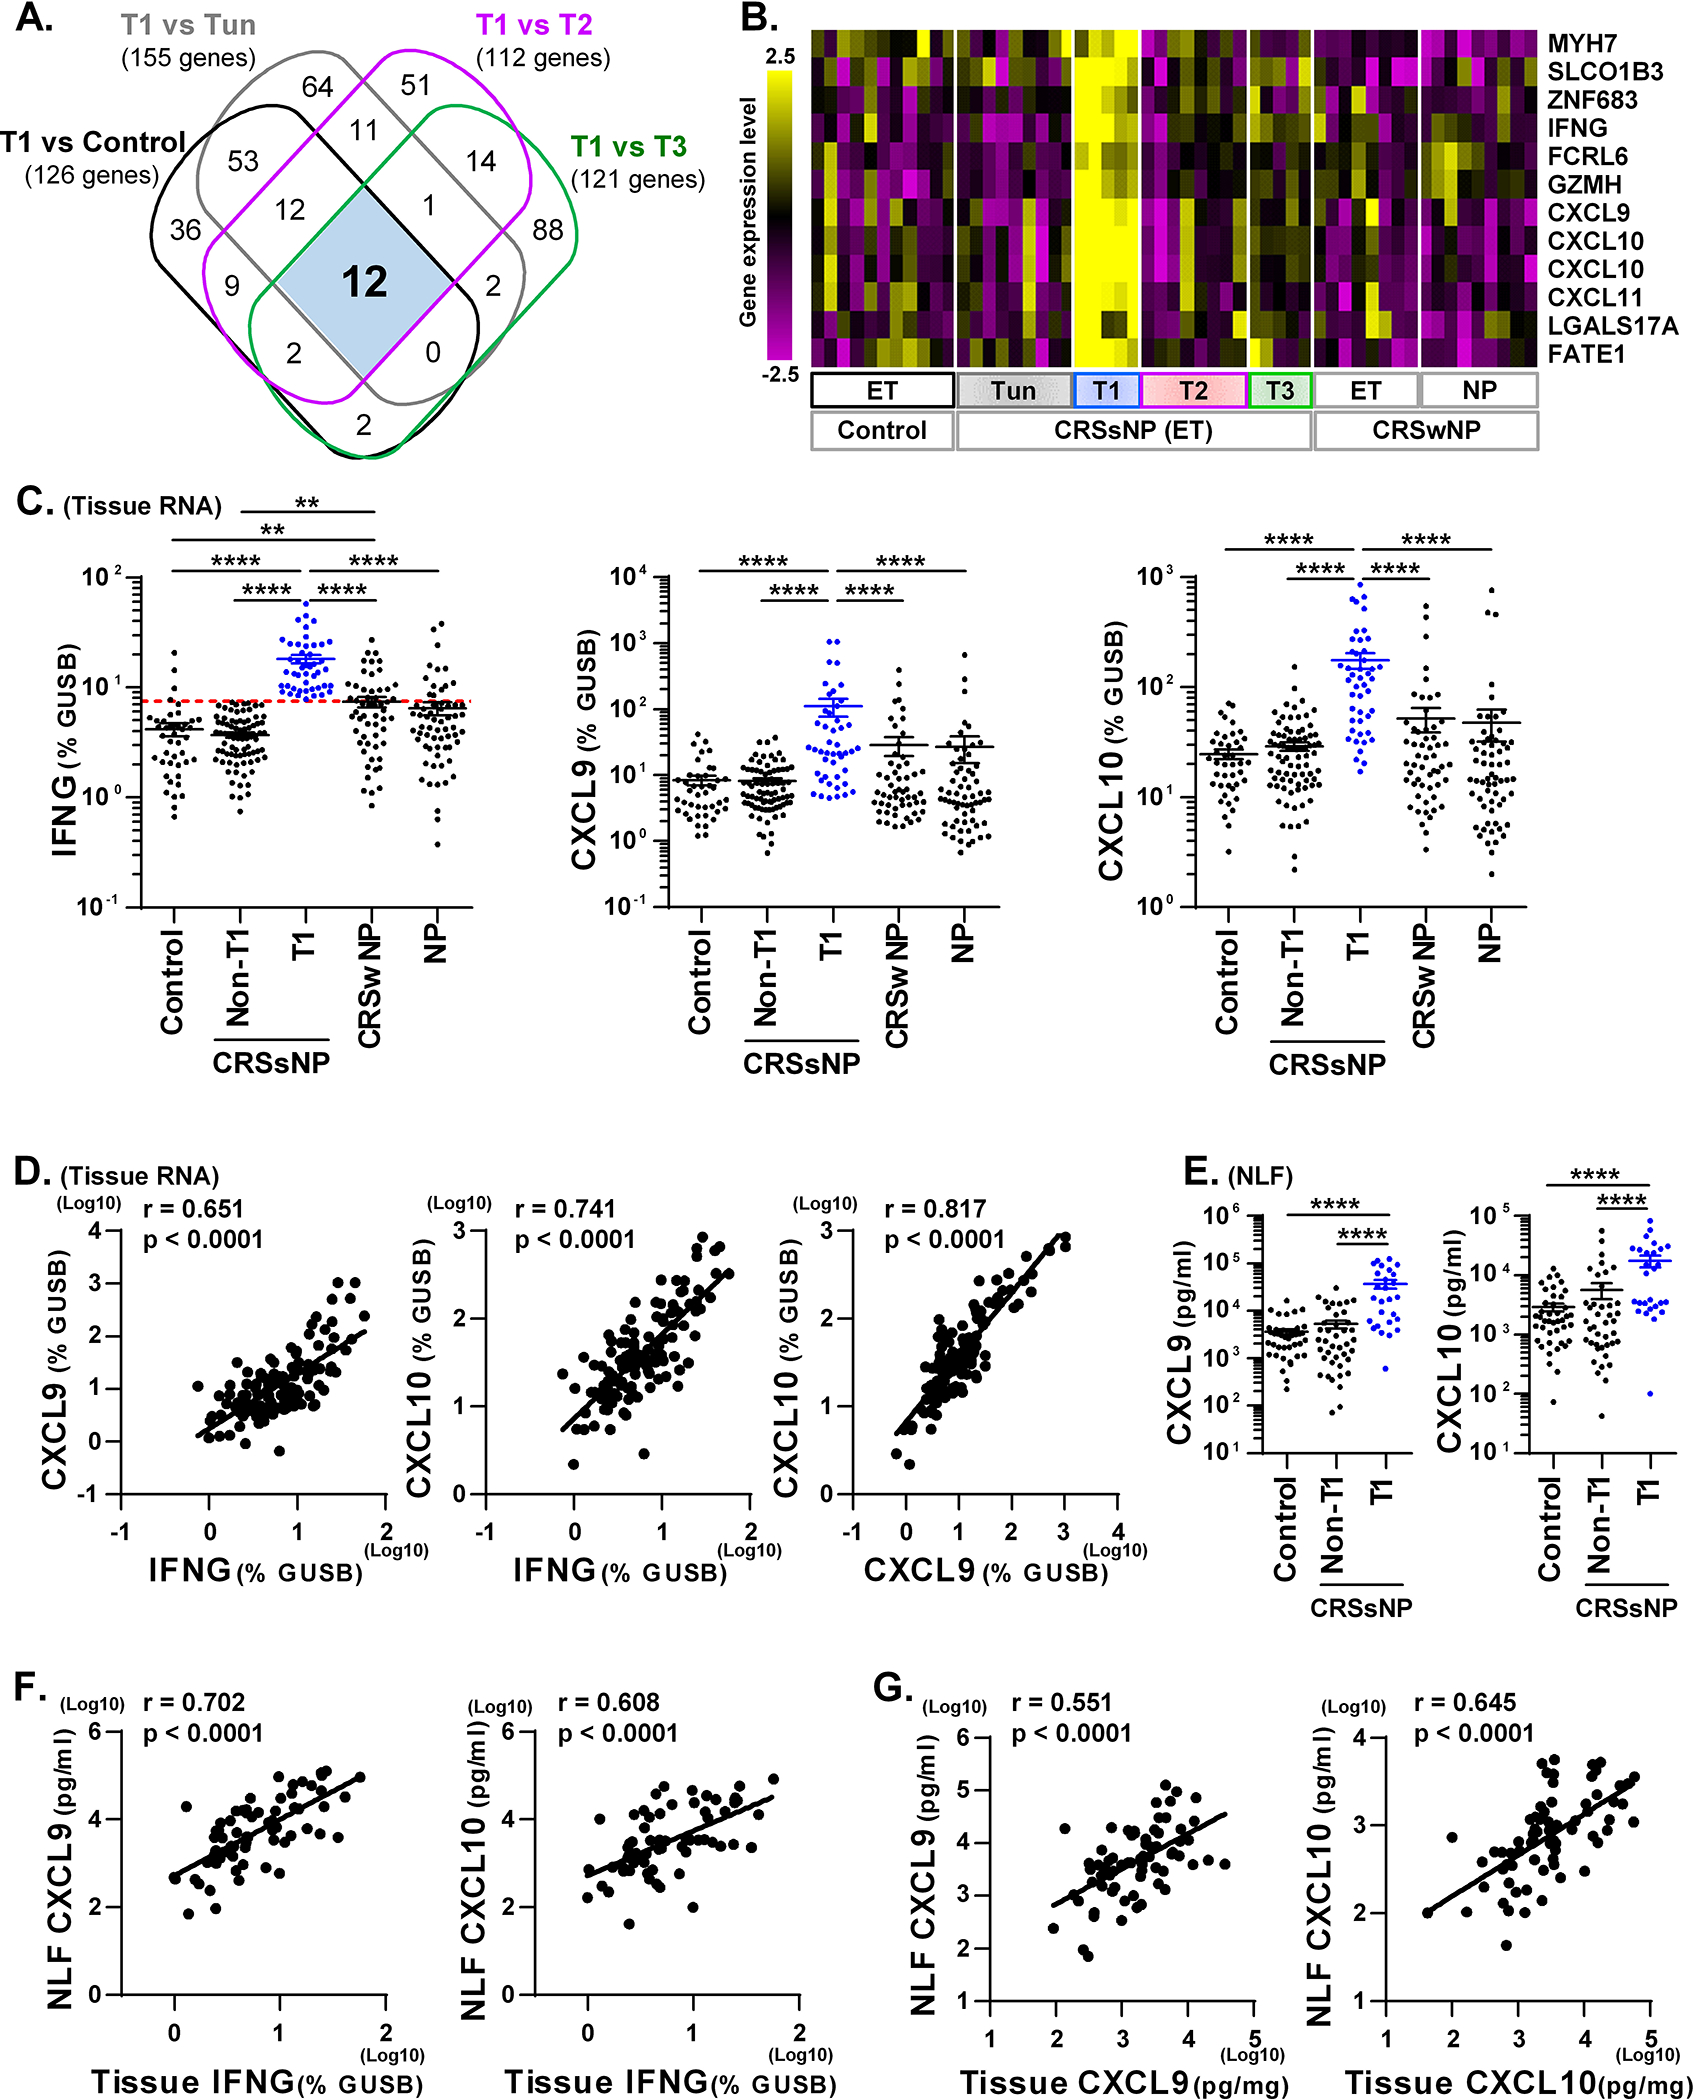
A Venn diagram identified that 12 genes were >3-fold significantly elevated in T1 endotype compared to control and all other CRSsNP endotypes (A). Hierarchical clustering was performed using the 12 T1 CRSsNP specific genes in the microarray data (B). Expression of mRNAs in control ET (n=42), CRSsNP ET (n=126), CRSwNP ET (n=56) and CRSwNP NP (n=63) is shown in C. CRSsNP ET was divided into two groups by the presence (T1, n=46) or absence (Non-T1, n=80) of T1 endotype based on the 90th percentile expression of IFNG in control ET (shown by red dotted line). The protein concentrations in NLF and tissue extracts are shown (E-G). Protein expression in NLF compared across the groups is shown in E. The Spearman rank correlations were assessed by matched RNA samples (D, n=126), matched NLF and RNA samples (F. n=68) and matched NLF and tissue extract samples (G. n=71) in CRSsNP. Results are shown as mean ± SEM. ** p<0.01, **** p<0.0001 by one-way ANOVA (C, E).
To confirm our microarray analysis findings, we performed qRT-PCR in a larger cohort. We separated endotypes using the 90th percentile of gene expression of the primary endotypic markers (IFNG for T1) in control ET as the threshold for elevated expression,7 and then examined endotype specific genes comparing the presence (T1) and absence (Non-T1) of T1 endotype (Fig. 2C). We chose CXCL9 and CXCL10 as biomarkers and confirmed that they were significantly elevated in T1 CRSsNP compared to control, non-T1 CRSsNP and CRSwNP (Fig. 2C). Furthermore, mRNA gene expression of IFNG, CXCL9 and CXCL10 strongly and positively correlated with each other in CRSsNP ET (n=126, Fig. 2D). These results suggest that IFNG, CXCL9 and CXCL10 are appropriate and concordant biomarkers for the T1 endotype in CRSsNP.
Biomarkers of T1 CRSsNP in nasal lavage
While we first identified biomarkers using surgical tissues (Fig. 2A), this is not practical in an outpatient setting. We therefore pursued a method of endotyping using nasal lavage fluids (NLF) that does not require surgery or biopsy and may have utility in studies based in the clinic or in the field. We obtained NLF from control patients and patients with CRSsNP to test whether levels of the identified biomarkers in NLF reflect inflammation in paired adjacent tissue samples. We first found that detectability of IFN-γ was low (2.3% positive samples, not shown) in CRSsNP NLF. This suggests that IFN-γ may not be useful for endotyping NLF samples. In contrast, we found that detectability of CXCL9 and CXCL10 in NLF by Luminex was 100% and the concentrations measured displayed nice variability among patients in CRSsNP (Fig. 2E). We separated NLF samples by presence and absence of T1 endotype using tissue PCR results (Fig. 2C) in 68 CRSsNP donors who had both tissue RNA and NLF data and found that CXCL9 and CXCL10 proteins were significantly elevated in T1 CRSsNP compared to control and non-T1 CRSsNP (Fig. 2E). We then analyzed whether tissue levels of IFN-γ correlated with these biomarkers in NLF in CRSsNP. We found that IFNG mRNA in tissue positively and significantly correlated with proteins for CXCL9 (r=0.702, p<0.0001) and CXCL10 (r=0.608, p<0.0001) in NLF in CRSsNP (Fig. 2F). We also collected matched protein tissue extracts from CRSsNP patients (n=71) and found that these biomarkers (CXCL9 and CXCL10) showed positive correlations between NLF and tissue in CRSsNP (Fig. 2G). Receiver operating characteristic (ROC) analysis also showed that CXCL9 (AUC, 0.869; p<0.0001; Sensitivity, 85%; Specificity, 75%) and CXCL10 (AUC, 0.815; p<0.0001; Sensitivity, 93%; Specificity, 63%) in NLF can be used as biomarkers to predict the T1 endotype in CRS tissue (Supplementary Fig. E2 and Table E9). These results suggest that CXCL9 and CXCL10 in NLF can be used as biomarkers to predict T1 endotype in CRS tissue.
Mechanisms of inflammation in T2 CRSsNP
We identified 241 up-regulated genes (Supplementary Table E5) in T2 CRSsNP that included T2 cytokines, T2 inflammation-associated chemokines, markers of Th2 cells and group 2 innate lymphoid cells (ILC2), IL-13 and STAT6-induced genes22 and activation markers (Table 3). In addition, eosinophil-related23, 24, mast cell-related25, 26, myeloid cell-related27, 28, basophil-related and regulatory T cell-related genes were up-regulated in T2 CRSsNP (Table 3). GO analysis identified 17 T2 CRSsNP-specific biological process terms including antigen processing and presentation of lipid antigen, and T cell mediated immunity (Fig. 1A, B, Supplementary Table E7). KEGG pathway analysis suggested that the T2 endotype was associated with activation of the FcεRI signaling pathway (Fig. 1D, Supplementary Table E7). These results suggest that inflammation in T2 CRSsNP is controlled by classical type 2 inflammation.
Table 3.
Associated functions of up-regulated genes in T2 CRSsNP
| Association | Up-regulated gene in T2 CRSsNP compared to control ET |
|---|---|
| T2 inflammation | IL4, IL5, IL13, CCL13, CCL18, CCL23, CCL26 |
| IL-13 and STAT6 induced | CLCA1, POSTN, SERPINB2, SERPINB10, CST1, CST2, FETUB |
| Activation | CD69, IL2RA |
| Th2 and ILC2 | IL1RL1, PTGDR2 |
| Eosinophil | ALOX15, CLC, CCL13, CCL26, CCR3, HRH4, RNASE2, RNASE3, SIGLEC8, PRSS33, PTGDR2 |
| Mast cell | CPA3, HDC, MS4A2, HPGDS, TPSAB1, TPSD1 |
| Basophil | CLC, CCR3, PTGDR2 |
| Myeloid cell | CCR1, CCL8, CCL23, CD1C, CD163, CD200R1, CD209, CD300LF, CNR2, F13A1, MARCO, MRC1, NLRP12 |
| Regulatory T cell | IL2RA, FOXP3, IL10, CTLA4 |
| Group I CD1 | CD1A, CD1B, CD1C |
Biomarkers of T2 CRSsNP
We identified 47 genes that differentiated T2 CRSsNP from all other endotypes of CRSsNP and control by microarray (Fig. 3A). Clustering analysis showed that 46 of these 47 genes (except HSD3B2) were shared between ET from T2 CRSsNP and CRSwNP and NP tissues from CRSwNP patients (Fig. 3B and Supplementary Fig. E3). This indicates that these 46 genes are likely common biomarkers of the T2 endotype in tissue. As we did above with the T1 endotype, we selected two T2 endotype specific genes, IL-13 and CCL26, and confirmed that they were significantly elevated in T2 CRSsNP compared to control and non-T2 CRSsNP by qRT-PCR (Fig. 3C). Importantly, similar to our finding by microarray (Fig. 3B), CLC, IL-13 and CCL26 were also elevated in ethmoid and NP tissues of CRSwNP and there was no significant difference between T2 CRSsNP and CRSwNP (Fig. 3C). Furthermore, mRNAs for CLC, IL-13 and CCL26 significantly and positively correlated with each other in CRSsNP tissue (n=126, Fig. 3D). These results suggest that the identified 46 genes, including CLC, IL-13 and CCL26, could serve as biomarkers of the T2 endotype in tissue.
Figure 3. T2 CRSsNP specific genes in tissue and biomarkers of T2 endotype in NLF.
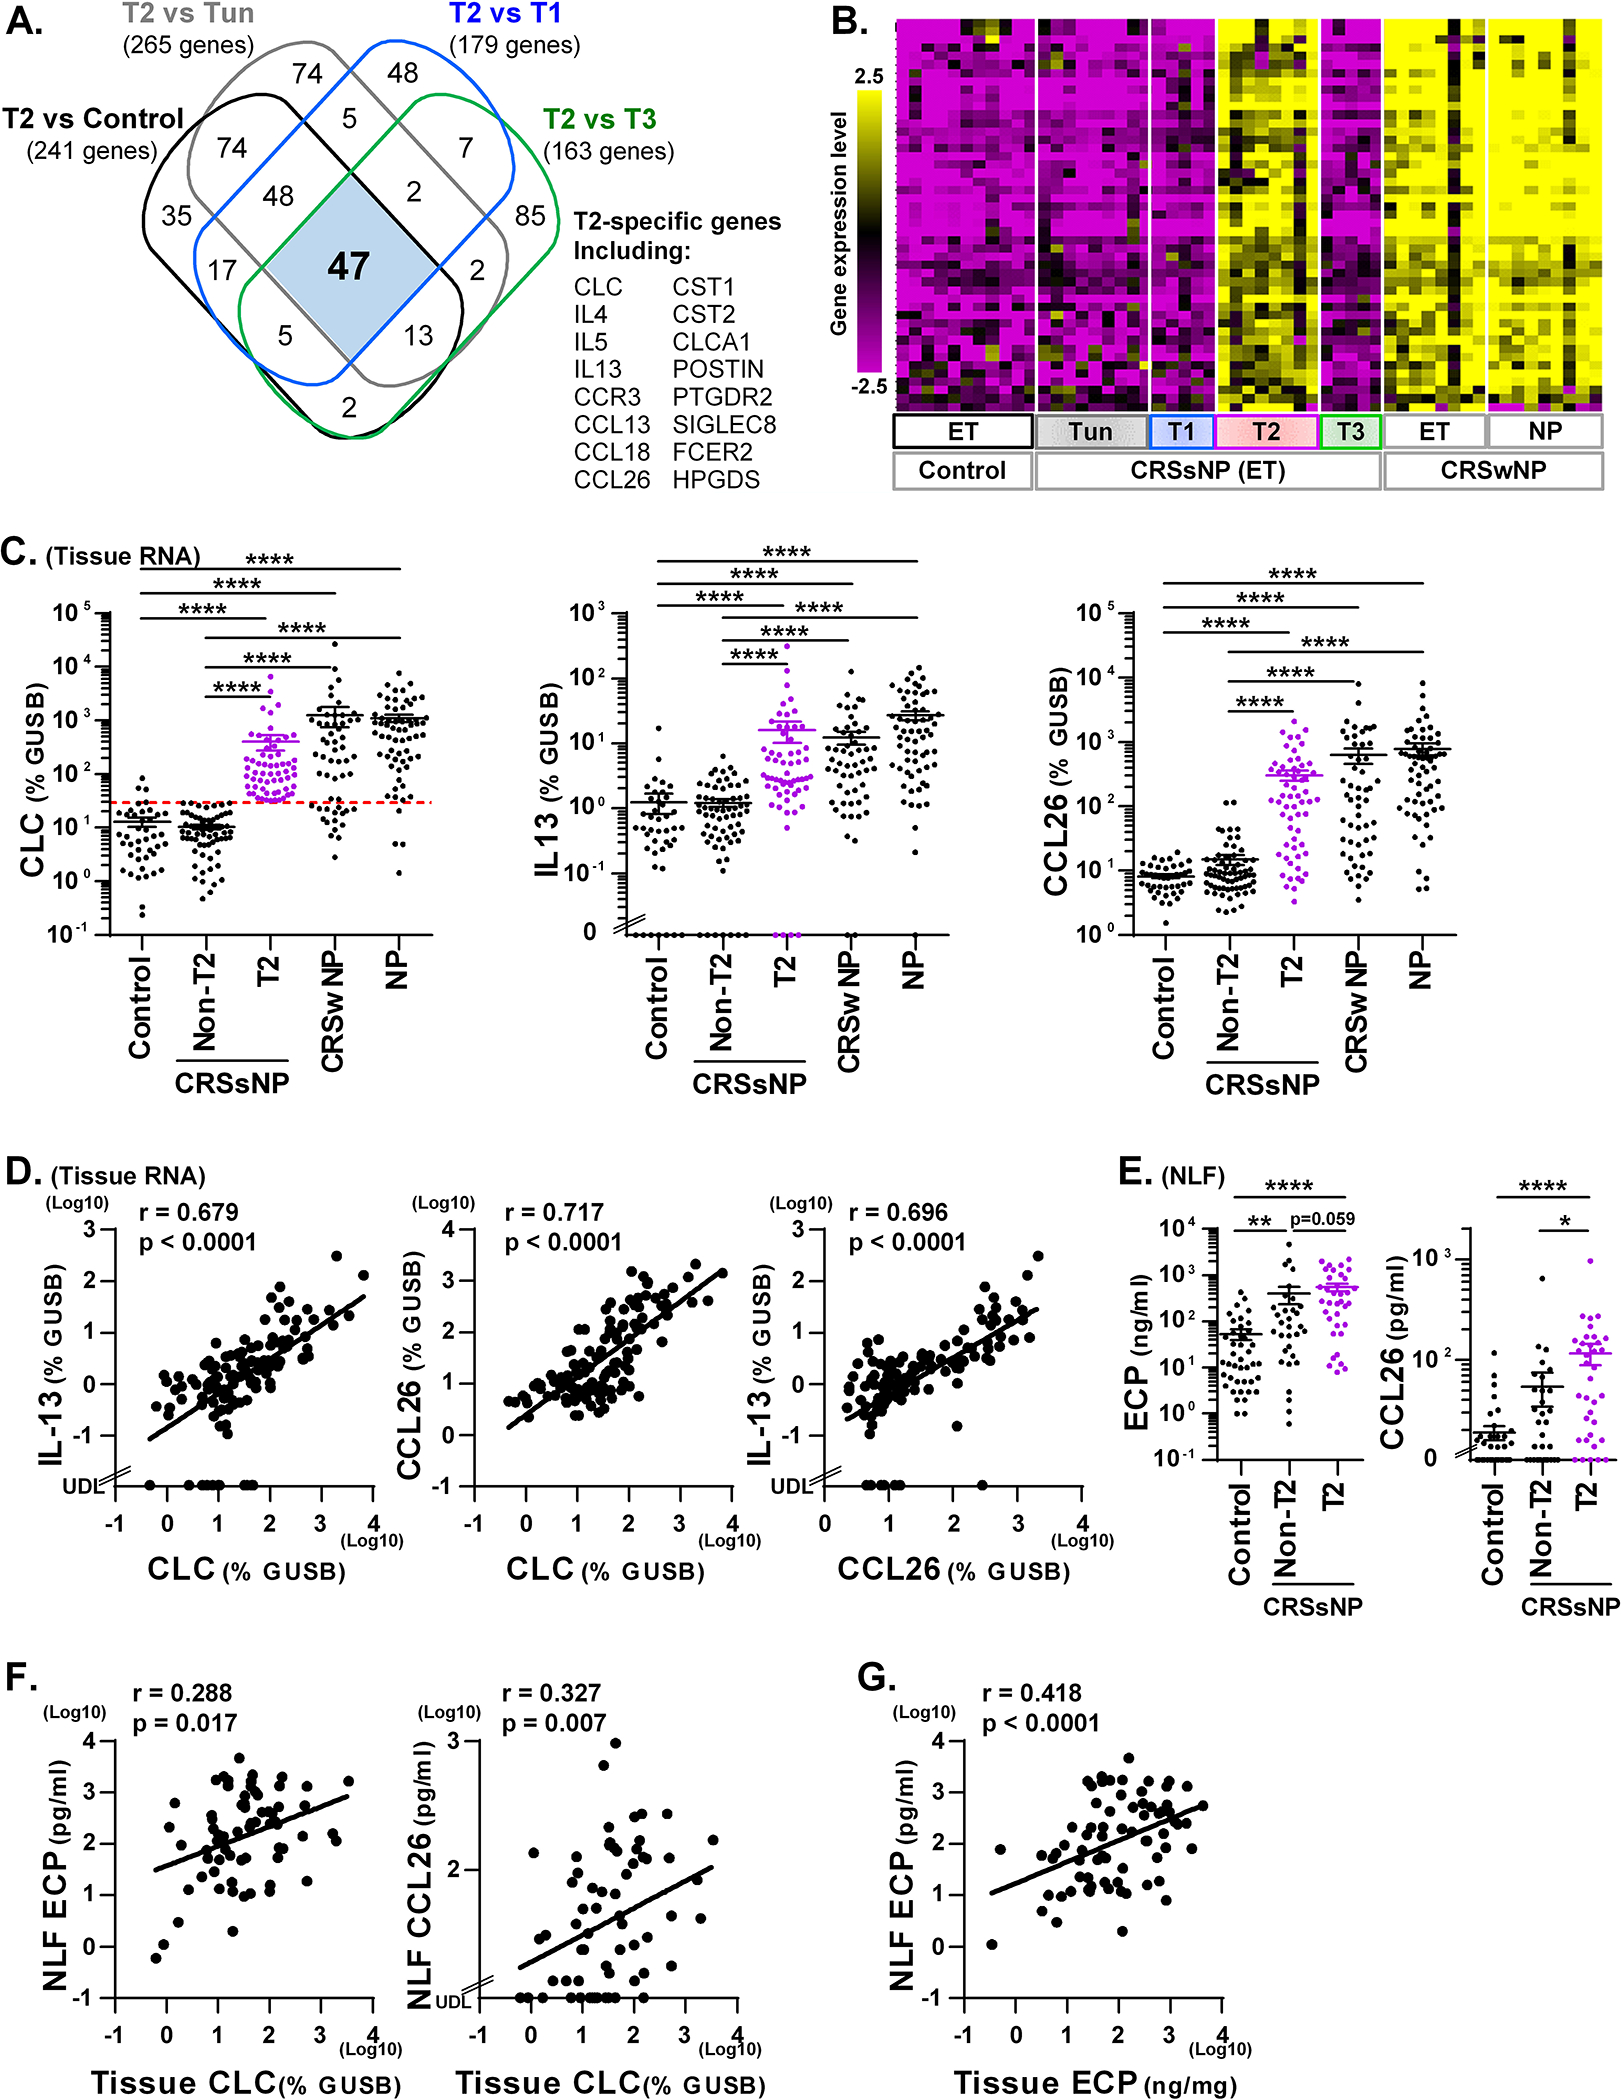
A Venn diagram identified that 47 genes were >3-fold significantly elevated in T2 endotype compared to control and all other CRSsNP endotypes (A). The hierarchical clustering was performed using 47 T2 CRSsNP specific genes in the microarray data (B). Expression of mRNAs in control ET (n=42), CRSsNP ET (n=126), CRSwNP ET (n=56) and CRSwNP NP (n=63) was performed by qRT-PCR (C, D). CRSsNP was divided into two groups by the presence (T2, n=60) or absence (Non-T2, n=66) of T2 endotype based on the 90th percentile expression of CLC in control ET (shown by red dotted line in C). The protein concentrations in control NLF (n=42), CRSsNP NLF and CRSsNP ET extracts were determined by ELISA and Luminex (E-G). Protein expression in NLF compared across the groups is shown in E. The Spearman rank correlations were assessed by matched RNA samples (D, n=126), matched NLF and RNA samples (F. n=68) and matched NLF and tissue extract samples (G. n=71) in CRSsNP. Results are shown as mean ± SEM. * p<0.05, ** p<0.01, **** p<0.0001 by one-way ANOVA (C, E). UDL; under the detection limit.
We examined whether these biomarkers can be used in NLF to predict tissue T2 endotype in CRSsNP. Since there was no standard detection system for the eosinophil marker CLC protein at the time of this study, we assayed ECP protein, which is a commonly used marker of eosinophils. We found that detectability of ECP, IL-13 and CCL26 proteins in CRSsNP NLF was 100%, 14.0% and 75.6%, respectively (n=86, not shown), indicating that IL-13 is less useful for endotyping using NLF samples. We next separated presence and absence of T2 endotype in CRSsNP NLF using matched tissue RNA results (n=68) and found that ECP and CCL26 proteins were elevated in T2 CRSsNP compared to control and non-T2 CRSsNP in NLF samples although concentration of ECP between T2 CRSsNP and non-T2 CRSsNP did not reach a significant difference (Fig. 3E). We also found that CLC mRNA in tissue positively and significantly correlated with proteins for ECP (r=0.288, p=0.017) and CCL26 (r=0.327, p=0.007) in CRSsNP NLF (n=68, Fig. 3F). In addition, levels of ECP in NLF positively correlated with ECP in tissue in CRSsNP (n=71, Fig. 3G). ROC analysis also suggested that ECP (AUC, 0.767; p<0.0001; Sensitivity, 64%; Specificity, 84%) and CCL26 (AUC, 0.778; p<0.0001; Sensitivity, 64%; Specificity, 80%) can be used as biomarkers in NLF to predict the T2 endotype in CRS tissue (Supplementary Fig. E2 and Table E9).
Mechanisms of inflammation in T3 CRSsNP
Compared to control tissue, we identified 545 up-regulated genes in T3 CRSsNP (Table 1 and Supplementary Table E5) that included acute inflammatory and host defense proteins20, 21, complement proteins, proinflammatory cytokines, class II MHC molecules, neutrophil-associated genes22, 29, macrophage-related genes27, B cell-related genes and T cell-related genes (Table 4). Although IL-17A was undetectable by microarray (not shown), IL-17F was detected as an up-regulated gene in T3 CRSsNP (Fig. 4A and Supplementary Table E5) and many of the up-regulated genes in T3 CRSsNP are known to be induced by IL-17A.22, 30 GO enrichment analysis identified 435 terms that were significantly associated with up-regulated genes in the T3 endotype and 226 terms that were uniquely associated with T3 endotype (Fig. 1A, Supplementary Table E8). This included acute inflammatory response and neutrophil activation, degranulation and chemotaxis (Fig. 1B). KEGG pathway analysis suggested that B cell receptor signaling, IL-17 signaling, TNF signaling, NF-κB signaling, complement activation and infectious diseases were uniquely associated with the T3 endotype (Fig. 1CD, Supplementary Table E8). These results suggest that inflammation in T3 CRSsNP is controlled by neutrophils, APC, B cells and Th17 cells and it may be triggered by bacterial infection and activation of complement.
Table 4.
Associated functions of up-regulated genes in T3 CRSsNP
| Association | Up-regulated gene in T3 CRSsNP compared to control ET |
|---|---|
| Acute inflammatory and host defense | SAA1, SAA2, SAA4, HAMP, CFB, CP, DEFB4A, CHI3L1, S100A9, SERPINA1, SERPINA3 |
| Complement | C1QA, C1QB, C1QC, C3, C4A, C4B, C4BPA, CFB |
| Proinflammatory cytokine | IL1B, IL6, IL17F, CSF3, LTB, TNFSF11, TNFSF14 |
| Class II MHC-related | HLA-DMB, HLA-DOB, HLA-DQA1, HLA-DQA2, HLA-DQB1, HLA-DQB, HLA-DRB3, HLA-DRB4 |
| Neutrophil | CSF3, CSF3R, CXCL1, CXCL2, CXCL3, CXCL6, CXCR1, CXCR2, IL-8, CD177, FCGR3A, FPR1, FPR2, FPR3, VNN2 |
| Macrophage | AIM2, CCL2, CCL7, CCL8, CCR1, FCGR1B, CNR2, MMP12, MPEG1 |
| B cell | CD19, CD22, CD72, CD79B, BLK, CXCL13 |
| T cell | CD3D, CD7, CD27, CD28, CD40LG, CTLA4, ICOS, TIGIT |
Figure 4. T3 CRSsNP specific genes in tissue and biomarkers of T3 endotype in NLF.
A Venn diagram identified that 84 genes were >3-fold significantly elevated in T3 endotype compared to control and all other CRSsNP endotypes (A). The hierarchical clustering was performed using 84 T3 CRSsNP specific genes in the microarray data (B). Expression of mRNAs in control ET (n=42), CRSsNP ET (n=126), CRSwNP ET (n=56) and CRSwNP NP (n=63) was performed by qRT-PCR (C, D). CRSsNP was divided into two groups by the presence (T3, n=31) or absence (Non-T3, n=95) of T3 endotype based on the 90th percentile expression of IL-17A in control ET (shown by red dotted line in C). The protein concentrations in control NLF (n=42), CRSsNP NLF and CRSsNP ET extracts were determined by Luminex (E-G). Protein expression in NLF compared across the groups is shown in E. The Spearman rank correlations were assessed by matched RNA samples (D, n=126), matched NLF and RNA samples (F. n=68) and matched NLF and tissue extract samples (G. n=71) in CRSsNP. Results are shown as mean ± SEM. * p<0.05, ** p<0.01, *** p<0.001 and **** p<0.0001 by one-way ANOVA (C, E). UDL; under the detection limit.
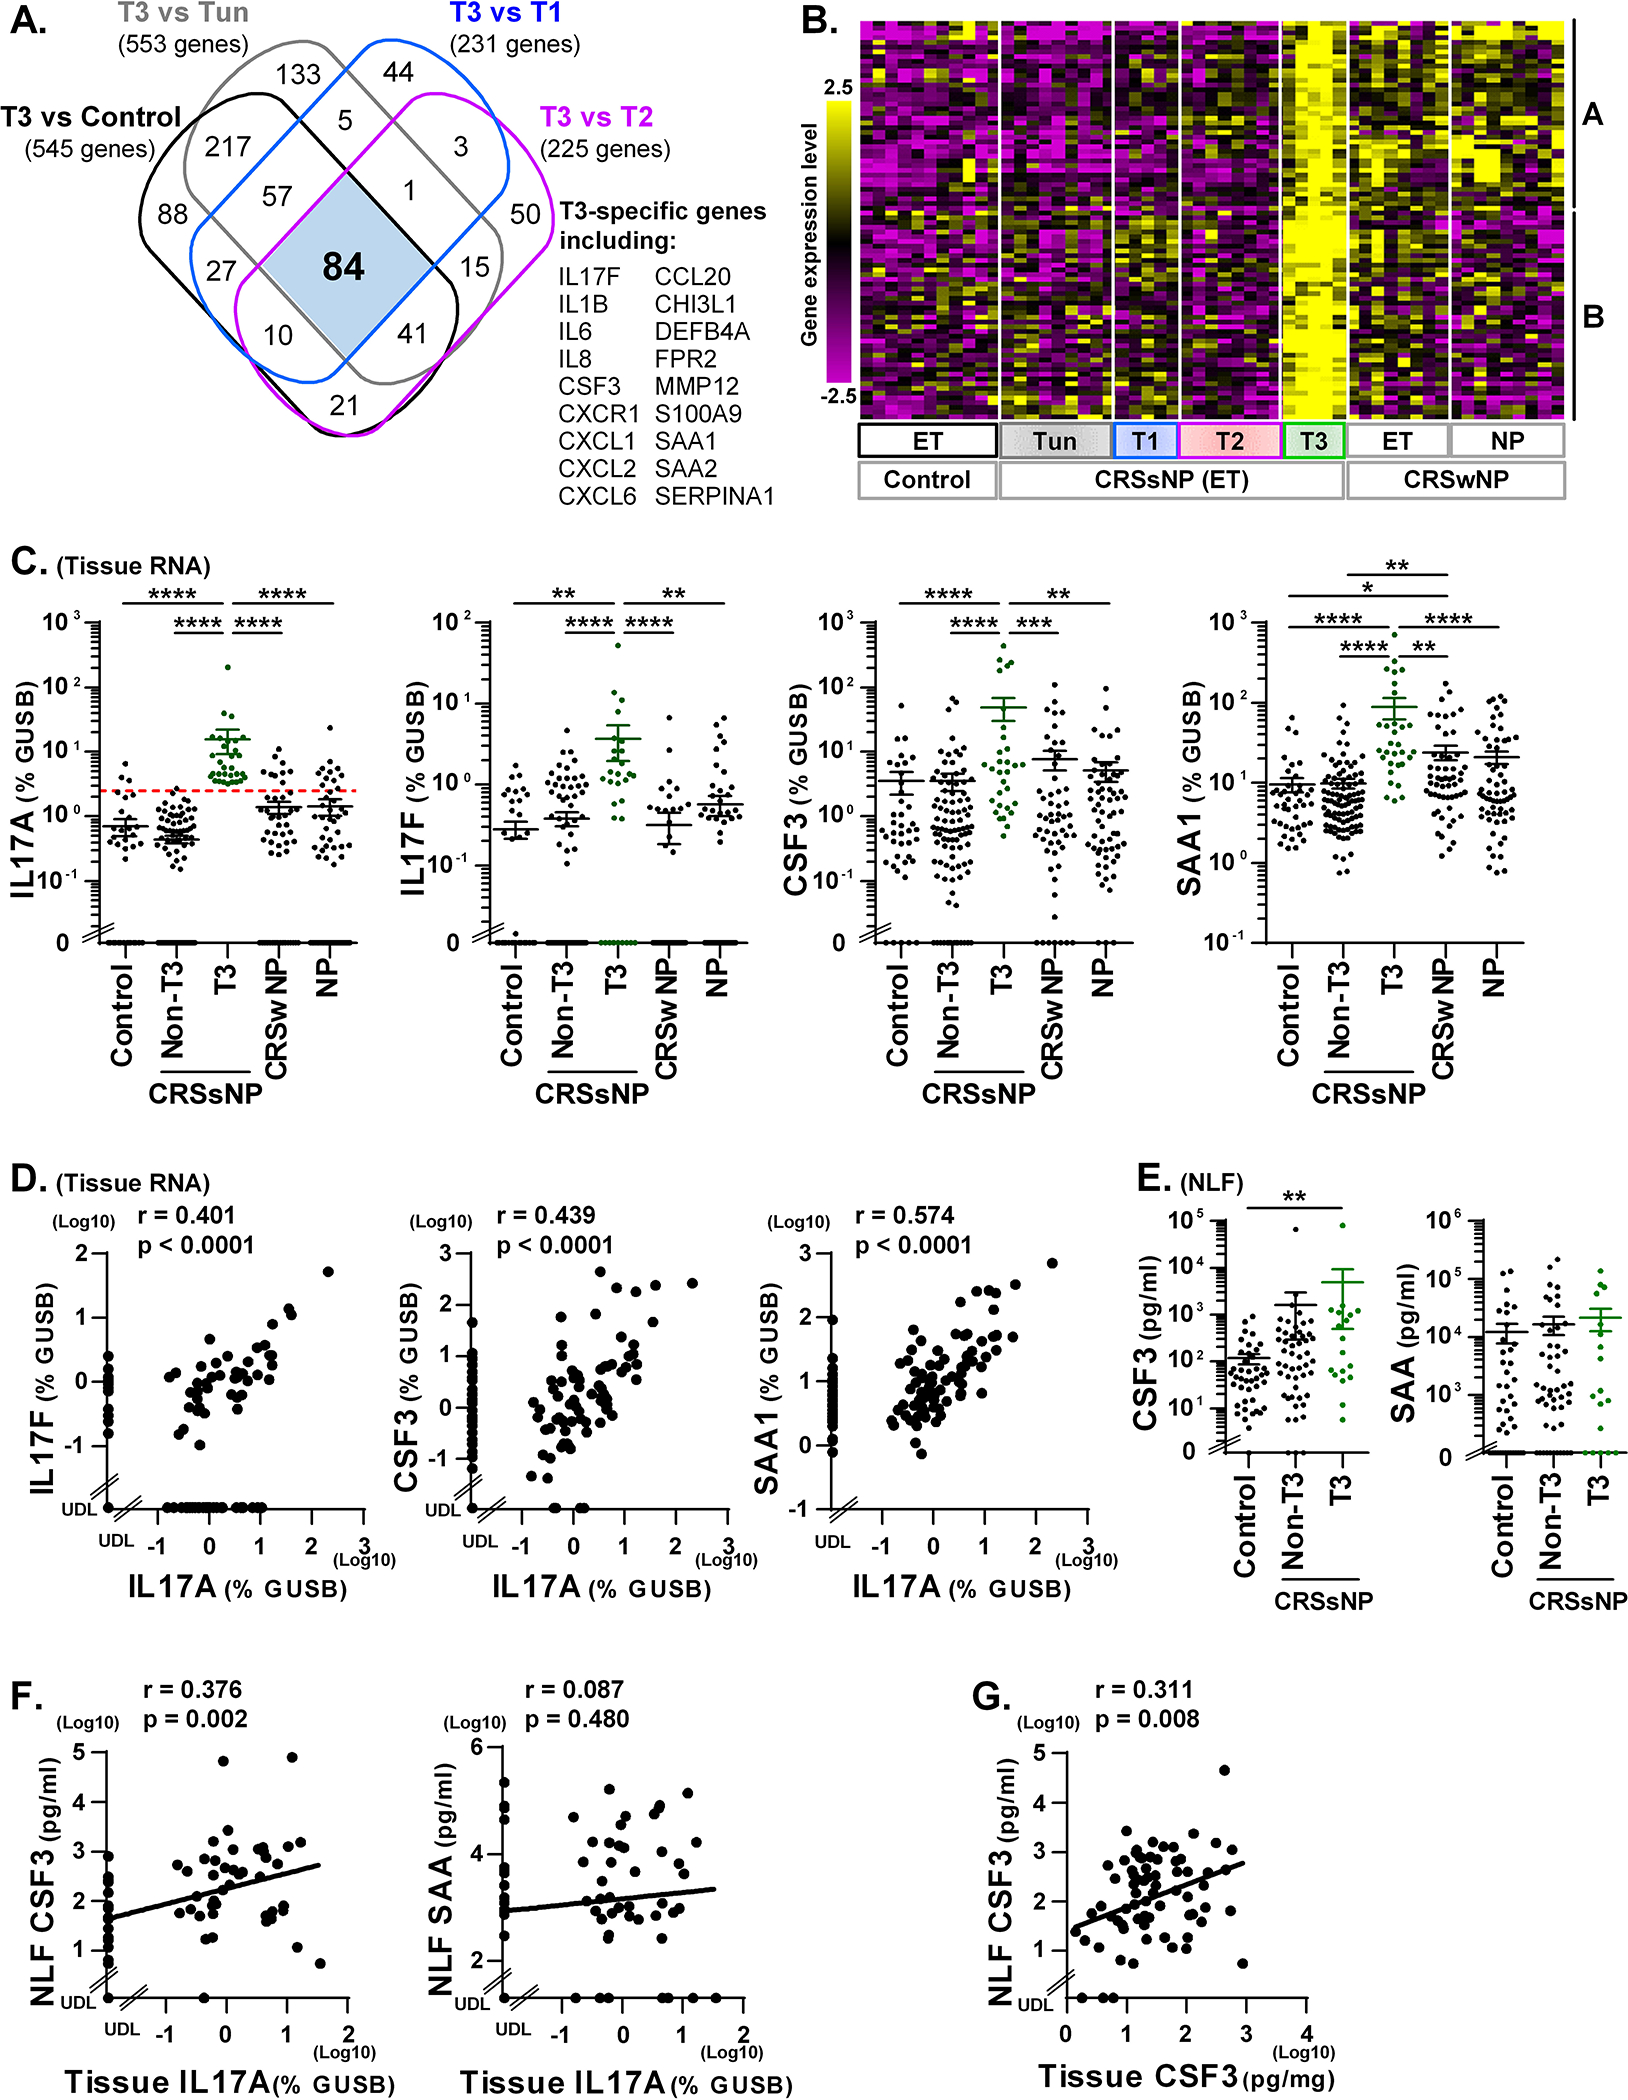
Biomarkers of T3 CRSsNP
We identified 84 genes that showed >3-fold and significant up-regulation in the T3 endotype compared to control and all other endotypes of CRSsNP by microarray (Fig. 4A). Clustering analysis suggested that these genes may be variably elevated in ET of CRSwNP with some (cluster A) found at elevated levels in NP and others (cluster B) which were not (Fig. 4B and Supplementary Fig. E4). This suggests that genes in cluster B may be better biomarkers of the T3 endotype. We next selected genes from cluster B (IL-17F, CSF3, SAA1 and IL-1B) and cluster A (IL-6), and performed qRT-PCR to confirm the microarray results. We found that gene expression for IL-17F, CSF3 and SAA1 was significantly elevated in T3 CRSsNP compared to all other groups (Fig. 4C). IL-1B and IL-6 also showed elevation in T3 CRSsNP when compared to non-T3 CRSsNP (Supplementary Fig. E5). We then found that IL-17A significantly and positively correlated with IL-17F, CSF3, SAA1 and IL-1B but not with IL-6 in CRSsNP ET (n=126, Fig. 4D and Fig. E5). Overall, these PCR results confirm our findings of gene expression patterns by microarray and suggest that genes in cluster B including IL-17F, CSF3, SAA1 and IL-1B, in addition to IL-17A, are good biomarkers of the type 3 endotype of CRS in tissue.
We next examined these proteins in NLF and found that the detectability of IL-17A, CSF3, SAA and IL-1β in CRSsNP NLF by Luminex was 11.6%, 96.5%, 79.1% and 53.5%, respectively (n=86, not shown), suggesting that IL-17A was the least useful biomarker in NLF. Using tissue endotyping results in CRSsNP (n=68), we found that CSF3 protein was elevated in T3 CRSsNP compared to control in NLF samples (Fig. 4E). However, the concentration of SAA, IL-1β and IL-6 did not show significant elevation in T3 CRSsNP NLF samples (Fig. 4E and E5C). We further found that IL-17A mRNA in tissue only significantly correlated with protein levels of CSF3 (r=0.376, p= 0.002) in CRSsNP NLF (n=68, Fig. 4F). We also found that CSF3 showed positive correlations between NLF and tissue in CRSsNP (n=71, Fig. 4G). ROC analysis also showed that CSF3 in NLF (AUC, 0.662; p=0.030; Sensitivity, 44%; Specificity, 89%) is the best biomarker which we tested to predict the T3 endotype in CRS tissue (Supplementary Fig. E2 and Table E9).
DISCUSSION
In the past decade, the underlying mechanisms and key immune cells responsible for CRSwNP pathogenesis have been well characterized. In contrast, these processes have only begun to be examined in CRSsNP. Recent studies have classified the inflammatory environment in CRSsNP into T1, T2, or T3 endotypes.5–7 To our knowledge, this is the first study to report transcriptome data for each inflammatory endotype of CRSsNP and to identify potential mechanisms for each endotype. Furthermore, we have identified biomarkers that can be useful classifying inflammatory endotypes in NLF from CRS patients.
Classically, T1-mediated immunity provides defense against intracellular bacteria and viruses, and IFN-γ is a key immune effector cytokine produced from activated CD4+ Th1 cells as well as CD8+ cytotoxic T cells, NK cells and ILC1.31 Although we initially hypothesized that Th1 cells were the main T1 effector cell in T1 CRSsNP, current study found that CD8+ T cell- and NK cell-associated genes including CD8A, granzymes, NCR3 and ZNF683 were also highly elevated in T1 CRSsNP (Table 2). These results suggest that both innate (NK cell) and adaptive (Th1 cell and CD8+ cytotoxic T cell) type 1 immune cells are important in driving T1 CRSsNP. Since ILC1-specific markers have not been identified and the frequency of ILC1 in sinus tissue was very low,32, 33 the role of ILC1 in T1 CRSsNP is currently unclear and future studies using more sensitive approaches will be required.
Both GO and pathway analyses suggested that the T1 endotype was associated with viral infections (Fig. 1 and Supplementary Table E6). Innate immunity against viruses is triggered by the recognition of virus by innate pattern recognition receptors including toll-like receptors and RIG-I like receptors and the production of type I IFNs including IFN-α and IFN-β in infected cells.34 Type I IFNs further induce many antiviral proteins that inhibit viral replication.34 However, our results showed that type I IFN and type I IFN-induced genes were not elevated in T1 CRSsNP (Supplementary Table E5 and not shown). Instead, IFN-γ (a type II IFN), many IFN-γ-induced genes (e.g. MHC molecules and CXCR3 ligands), and T cells markers were up-regulated in T1 CRSsNP (Table 2). This suggests that virus-mediated inflammation in T1 CRSsNP may be mainly regulated by adaptive T cell mediated responses, including proliferation and activation of viral-specific Th1 cells and cytotoxic CD8+ T cells. Furthermore, innate NK cell-mediated cytotoxicity may be involved in the anti-viral immunity in T1 CRSsNP. In addition to anti-viral immunity, phagocytosed bacteria may also be involved in inflammation in T1 CRSsNP via similar pathways including NK cell-mediated cytotoxicity and antigen specific Th1 cell- and cytotoxic T cell-mediated adaptive immunity. However, GO and pathway analyses are only tools that predict molecular events by selected genes (e.g up-regulated genes in endotype). Further studies will be required to examine direct evidences of key identified GO terms and pathways in each endotype including viral infection and T1 endotype.
T2 inflammation-mediated immunity provides defense against helminth infection and is involved in allergic disease. Our microarray results showed that key effector cytokines in T2 inflammation, IL-4, IL-5 and IL-13, and markers of known T2 cytokine producing cells, Th2 cells, mast cells, basophils and ILC2,8 were all significantly up-regulated in T2 CRSsNP (Table 3). This result suggests that known T2 cytokine-producing cells are the primary contributors of T2 inflammation observed in T2 CRSsNP. We previously published that mast cells, basophils and ILC2 were not elevated in CRSsNP and were only elevated in CRSwNP.32, 35, 36 Our use of uncinate tissues from patients with CRSsNP and/or lack of subset analysis using endotypic markers may explain our lack of detection of these cell types in our previous studies.32, 35, 36 Further study will thus be required to determine the presence of these cells in CRSsNP using the more relevant ethmoid tissue, with endotyping in a large cohort and also to examine the relative contribution of T2 cytokines from each cell type in T2 CRSsNP.
In addition to markers of T2 cytokine producing cells, we also found many up-regulated genes in T2 CRSsNP such as CCL18, CCL23, CD1c, CD163, F13A1, MRC1 (also known as CD206), POSTN and cystatins (Table 3) that have been previously reported as NP-associated genes.8–12, 37–40 Furthermore, T2 CRSsNP-specific genes were also significantly elevated in ET and NP tissues from patients with CRSwNP (Fig. 3B). These results suggest that the mechanisms of T2 inflammation in T2 CRSsNP and T2 CRSwNP are similar or the same. What remains unclear is why, despite having similar T2 inflammatory environments, polypoid tissue only develops in CRSwNP and not CRSsNP. Indeed, we identified several genes that were only elevated in NP but not in T2 CRSsNP (not shown). In addition, we have previously reported widespread activation of coagulation and deposition of crosslinked fibrin in NP tissue.41, 42 Future investigations are needed to identify genes that specifically are associated with NP formation.
GO analysis indicated that processing and presentation of lipid antigen was uniquely associated with T2 endotype (Fig. 1B) and this association was due to the up-regulation of group 1 CD1 molecules CD1A, CD1B and CD1C in T2 CRSsNP (Table 3 and Supplementary Table E7). Group 1 CD1 molecules capture lipid antigen and present antigen to group 1 CD1-restricted T cells. Several groups reported that group 1 CD1-restricted autoreactive T cells promoted production of autoantibodies and autoimmune diseases.43 We previously found the elevation of autoantibodies in CRSwNP.44–46 It may be valuable to investigate the presence and role of group 1 CD1-restricted T cells in T2 CRSsNP.
T3-mediated immunity provides host defense against extracellular microbes such as bacteria and fungi. IL-17A and IL-17F are key effector cytokines produced mainly from Th17 cells and ILC3.31 We found up-regulation of IL-17A, IL-17F and T cell-associated genes in T3 CRSsNP (Fig. 4 and Table 4) suggesting that Th17 cells may be the primary contributor of T3 cytokines in T3 CRSsNP. However, it is still possible that ILC3 may play a minor role and future study is needed to examine the contribution by ILC3.
GO and pathway analyses suggested that the T3 endotype is strongly associated with neutrophilic inflammation (Fig. 1). Indeed, our microarray study found elevations of numerous neutrophil chemokines, activation factors and receptors in T3 CRSsNP (Table 4). This suggests that neutrophils not only accumulated but also are highly activated in T3 CRSsNP in vivo. In addition, pathway analysis suggested that the T3 endotype is associated with B cell activation and complement pathways. Since we found up-regulation of C1Q in addition to C3 and C4 and the gene signature of IgG-mediated neutrophil activation (Table 4), the classical complement pathway46 may play a role in T3 CRSsNP. In addition, complement factor B was elevated in both T1 and T3 CRSsNP (Tables 2 and 4), suggesting that the alternative complement pathway46 might also play a role in T1 and T3 CRSsNP. We recently reported that the classical complement pathway is activated in NP.46 However, we previously could not detect elevation of the complement pathway in CRSsNP.46 Similar to studies of type 2 cells, we used uncinate tissues in those studies and did not perform a subset analysis using endotypic markers which may explain the negative results.46 Future studies are thus clearly required using ET of CRSsNP patients to revisit the influence of the complement pathways in non-polypoid CRS.
We also found that up-regulated genes in the T3 endotype were highly associated with acute inflammatory and host defense responses (Fig. 1 and Table 4). Importantly, many of these genes are known to be induced in neutrophils, macrophages and structural cells including epithelial cells and fibroblasts via direct activation of innate immune receptors on these cells by pathogens as well as by paracrine activation through the production of IL-17 from antigen specific Th17 cells and pro-inflammatory cytokines TNF and IL-1β from innate immune cells including macrophages.30 This suggests that T3 CRSsNP may be associated with bacterial infection. Importantly, we recently found that the T3 endotype potently associated with the presence of intranasal pus, supporting this view.7 This finding strongly meshes with our current result.
In the present study, we identified biomarkers of each inflammatory endotype in tissue. Our results suggest that CXCL9 (T1), CXCL10 (T1), CLC (T2), ECP (T2), CCL26 (T2), CSF3 (T3) SAA (T3) and IL-1β (T3), as well as T cell associated cytokines, IFN-γ, IL-13 and IL-17A, are useful biomarkers to detect each indicated endotype in CRS tissue. We also attempted to identify biomarkers in NLF that are able to predict tissue endotypes in CRS. We first found that the detectability of T cell associated cytokines in CRSsNP NLF was low. This suggests that they are not useful markers for endotyping using NLF samples. We further found that levels of CXCL9 and CXCL10 in NLF positively correlated with tissue T1 inflammation, ECP and CCL26 in NLF correlated with tissue T2 inflammation and NLF CSF3 correlated with tissue T3 inflammation (Figs 2–4). This suggests that these molecules are good biomarkers in NLF for inflammatory endotypes and measurement of these biomarkers in NLF may be able to predict tissue inflammation without surgery and biopsy in CRS.
Although we were able to identify up-regulated genes, biomarkers and potential mechanisms in each endotype, our present study has certain limitations. Since the endotypes were defined beforehand for the microarray samples, this was not a completely unbiased analysis and we might be missing other unknown key endotypes besides T1, T2 and T3. Furthermore, we failed to identify Tun CRSsNP specific mechanisms by microarray. Indeed, Principal Component Analysis also showed that T2 and T3 endotypes are major factors to separate distinct clusters (Supplementary Fig. E6). In contrast, normal control and Tun CRSsNP presented within the same cluster. Since the Tun endotype was assigned to patients based on the absence of elevation of T1, T2, or T3 inflammation, this group may have more than one unrecognized endotype, making it difficult to identify a single strong gene signature and function. A larger scale transcriptomic study using a truly unbiased analysis might be of value. Another potential limitation of our study might be the identification of T3 endotype biomarkers. Although we found positive correlations between IL-17A and the identified markers in tissue and between tissue IL-17A and NLF biomarkers (Fig. 4), these correlations were not as strong as those found with T1 and T2 endotypes. ROC analysis also showed similar patterns in T3 markers (Supplementary Fig. E2 and Table E9). Future studies are necessary to identify, validate and evaluate additional T3 biomarkers in NLF. Nonetheless, our studies indicate that CSF3 has utility in NLF and ET as a biomarker of T3 responses (Fig. 4, Supplementary Fig. E2 and Table E9) until a more useful biomarker can be identified. Several patients were taking a variety of medications including corticosteroids and this might affect the results. We showed that systemic but not nasal steroid treatment may influence levels of endotypic markers (Supplementary Figs. E7 and E8). Further clinical studies will be required to validate the role of systemic steroid treatment on the effect of endotype in CRSsNP. Finally, the sensitivity of the NLF assay might be an issue. Since we used 8 ml of PBS to collect nasal fluids, all released factors in the nasal cavity are recovered in a highly diluted state. We and other groups have also tried sponges, filter papers and swabs to collect local secretions with some success.16, 47–49 Further validation studies will be required to compare these techniques.
In conclusion, we report that inflammatory endotypes in CRSsNP are controlled by distinct gene signatures with different mechanisms. The identified mechanisms in each endotype may help discover endotype specific new therapeutic targets and NLF biomarker assays may help in designing more precise and personal medicine strategies in CRS patients.
Supplementary Material
Key messages.
CRSsNP has at least 3 major inflammatory endotypes that are controlled by different molecular mechanisms and inflammatory cells.
The identified mechanisms in each endotype may lead to discovery of endotype specific new therapeutic targets.
Nasal lavage biomarker assays may help in studies of the epidemiology, genetics or outcomes in patients with diverse endotypes and lead the way to personalized medicine strategies for the treatment of CRSsNP.
Acknowledgments
This research was supported in part by NIH grants, R01 AI104733, R37 HL068546, R01 AI137174, U19 AI106683 and P01 AI145818 and by a grant from the Ernest S. Bazley Foundation.
We would like to gratefully acknowledge Ms. Lydia Suh, Mr. James Norton, Mr. Roderick Carter, Ms. Caroline P.E. Price Ms. Julia H. Huang and Ms. Kathleen E. Harris (Northwestern University Feinberg School of Medicine) for their skillful technical assistance. We would like to gratefully acknowledge Dr. Yan Shi at University of North Carolina Lineberger Comprehensive Cancer Center, within the Genomics Core Facility for her support of microarray analysis including amplification, labeling and hybridization of RNA and scanning of signals.
Funding:
This research was supported in part by NIH grants, R01 AI104733, R01 AI137174, R37 HL068546, U19 AI106683 and P01 AI145818 and by a grant from the Ernest S. Bazley Foundation.
Abbreviations
- APC
Antigen presenting cell
- CLC
Charcot-Leyden crystal galectin
- CRS
Chronic rhinosinusitis
- CRSsNP
CRS without nasal polyps
- CRSwNP
CRS with nasal polyps
- CSF
Colony stimulating factor
- ECP
Eosinophil cationic protein
- GO
Gene ontology
- IFN
Interferon
- ILC
Innate lymphoid cell
- NP
Nasal polyp
- qRT-PCR
Quantitative RT-PCR
- ROC
Receiver operating characteristic
- T1
Type 1
- T2
Type 2
- T3
Type 3
- Tun
Untypeable
Footnotes
Conflicts of interest: WWS served on advisory boards for GlaxoSmithKline and Genentech. BKT reports personal fees from Sanofi Regeneron/Genzyme, and OptiNose. ATP reports personal fees from Sanofi Regeneron and personal fees and grants from AstraZeneca and OptiNose. LCG reports personal fees from Astellas Pharmaceuticals. KCW reports consultant fees from Baxter, OptiNose and Acclarent. RCK reports personal fees from Sanofi, Novartis, Lyra Pharmaceutical, GlaxoSmithKline and Neurent. RPS reports personal fees from Intersect ENT, Merck, GlaxoSmithKline, Sanofi, AstraZeneca/Medimmune, Genentech, Actobio Therapeutics, Lyra Therapeutics, Astellas Pharma Inc., and Otsuka Inc. RPS also has Siglec-8 and Siglec-8 ligand related patents licensed to Allakos Inc. AK reports a consultant fee from Astellas Pharma and a gift for his research from Lyra Therapeutics. AIK, JAP, SSS and DBC report no conflicts of interest.
References
- 1.Fokkens WJ, Lund VJ, Mullol J, Bachert C, Alobid I, Baroody F, et al. European Position Paper on Rhinosinusitis and Nasal Polyps 2012. Rhinol Suppl 2012; 23:3 p preceding table of contents, 1–298. [PubMed] [Google Scholar]
- 2.Orlandi RR, Kingdom TT, Hwang PH, Smith TL, Alt JA, Baroody FM, et al. International Consensus Statement on Allergy and Rhinology: Rhinosinusitis. Int Forum Allergy Rhinol 2016; 6 Suppl 1:S22–209. [DOI] [PubMed] [Google Scholar]
- 3.Smith KA, Orlandi RR, Rudmik L. Cost of adult chronic rhinosinusitis: A systematic review. Laryngoscope 2015; 125:1547–56. [DOI] [PubMed] [Google Scholar]
- 4.Tomassen P, Vandeplas G, Van Zele T, Cardell LO, Arebro J, Olze H, et al. Inflammatory endotypes of chronic rhinosinusitis based on cluster analysis of biomarkers. J Allergy Clin Immunol 2016; 137:1449–56 e4. [DOI] [PubMed] [Google Scholar]
- 5.Tan BK, Klingler AI, Poposki JA, Stevens WW, Peters AT, Suh LA, et al. Heterogeneous inflammatory patterns in chronic rhinosinusitis without nasal polyps in Chicago, Illinois. J Allergy Clin Immunol 2017; 139:699–703 e7. [DOI] [PMC free article] [PubMed] [Google Scholar]
- 6.Wang X, Zhang N, Bo M, Holtappels G, Zheng M, Lou H, et al. Diversity of TH cytokine profiles in patients with chronic rhinosinusitis: A multicenter study in Europe, Asia, and Oceania. J Allergy Clin Immunol 2016; 138:1344–53. [DOI] [PubMed] [Google Scholar]
- 7.Stevens WW, Peters AT, Tan BK, Klingler AI, Poposki JA, Hulse KE, et al. Associations Between Inflammatory Endotypes and Clinical Presentations in Chronic Rhinosinusitis. J Allergy Clin Immunol Pract 2019; 7:2812–20 e3. [DOI] [PMC free article] [PubMed] [Google Scholar]
- 8.Kato A Immunopathology of chronic rhinosinusitis. Allergol Int 2015; 64:121–30. [DOI] [PMC free article] [PubMed] [Google Scholar]
- 9.Wang W, Gao Z, Wang H, Li T, He W, Lv W, et al. Transcriptome Analysis Reveals Distinct Gene Expression Profiles in Eosinophilic and Noneosinophilic Chronic Rhinosinusitis with Nasal Polyps. Sci Rep 2016; 6:26604. [DOI] [PMC free article] [PubMed] [Google Scholar]
- 10.Plager DA, Kahl JC, Asmann YW, Nilson AE, Pallanch JF, Friedman O, et al. Gene transcription changes in asthmatic chronic rhinosinusitis with nasal polyps and comparison to those in atopic dermatitis. PLoS One 2010; 5:e11450. [DOI] [PMC free article] [PubMed] [Google Scholar]
- 11.Rostkowska-Nadolska B, Kapral M, Fraczek M, Kowalczyk M, Gawron W, Mazurek U. A microarray study of gene expression profiles in nasal polyps. Auris Nasus Larynx 2011; 38:58–64. [DOI] [PubMed] [Google Scholar]
- 12.Okada N, Nakayama T, Asaka D, Inoue N, Tsurumoto T, Takaishi S, et al. Distinct gene expression profiles and regulation networks of nasal polyps in eosinophilic and non-eosinophilic chronic rhinosinusitis. Int Forum Allergy Rhinol 2018; 8:592–604. [DOI] [PubMed] [Google Scholar]
- 13.Payne SC, Han JK, Huyett P, Negri J, Kropf EZ, Borish L, et al. Microarray analysis of distinct gene transcription profiles in non-eosinophilic chronic sinusitis with nasal polyps. Am J Rhinol 2008; 22:568–81. [DOI] [PMC free article] [PubMed] [Google Scholar]
- 14.Seshadri S, Rosati M, Lin DC, Carter RG, Norton JE, Choi AW, et al. Regional differences in the expression of innate host defense molecules in sinonasal mucosa. J Allergy Clin Immunol 2013; 132:1227–30 e5. [DOI] [PMC free article] [PubMed] [Google Scholar]
- 15.Tyler MA, Russell CB, Smith DE, Rottman JB, Padro Dietz CJ, Hu X, et al. Large-scale gene expression profiling reveals distinct type 2 inflammatory patterns in chronic rhinosinusitis subtypes. J Allergy Clin Immunol 2017; 139:1061–4 e4. [DOI] [PMC free article] [PubMed] [Google Scholar]
- 16.Turner JH, Chandra RK, Li P, Bonnet K, Schlundt DG. Identification of clinically relevant chronic rhinosinusitis endotypes using cluster analysis of mucus cytokines. J Allergy Clin Immunol 2018; 141:1895–7 e7. [DOI] [PMC free article] [PubMed] [Google Scholar]
- 17.Reimand J, Kull M, Peterson H, Hansen J, Vilo J. g:Profiler--a web-based toolset for functional profiling of gene lists from large-scale experiments. Nucleic Acids Res 2007; 35:W193–200. [DOI] [PMC free article] [PubMed] [Google Scholar]
- 18.Barrat FJ, Crow MK, Ivashkiv LB. Interferon target-gene expression and epigenomic signatures in health and disease. Nat Immunol 2019; 20:1574–83. [DOI] [PMC free article] [PubMed] [Google Scholar]
- 19.Hurgin V, Novick D, Werman A, Dinarello CA, Rubinstein M. Antiviral and immunoregulatory activities of IFN-gamma depend on constitutively expressed IL-1alpha. Proc Natl Acad Sci U S A 2007; 104:5044–9. [DOI] [PMC free article] [PubMed] [Google Scholar]
- 20.Jain S, Gautam V, Naseem S. Acute-phase proteins: As diagnostic tool. J Pharm Bioallied Sci 2011; 3:118–27. [DOI] [PMC free article] [PubMed] [Google Scholar]
- 21.Hancock RE, Haney EF, Gill EE. The immunology of host defence peptides: beyond antimicrobial activity. Nat Rev Immunol 2016; 16:321–34. [DOI] [PubMed] [Google Scholar]
- 22.Singhania A, Wallington JC, Smith CG, Horowitz D, Staples KJ, Howarth PH, et al. Multitissue Transcriptomics Delineates the Diversity of Airway T Cell Functions in Asthma. Am J Respir Cell Mol Biol 2018; 58:261–70. [DOI] [PMC free article] [PubMed] [Google Scholar]
- 23.Esnault S, Kelly EA, Schwantes EA, Liu LY, DeLain LP, Hauer JA, et al. Identification of genes expressed by human airway eosinophils after an in vivo allergen challenge. PLoS One 2013; 8:e67560. [DOI] [PMC free article] [PubMed] [Google Scholar]
- 24.Toyama S, Okada N, Matsuda A, Morita H, Saito H, Fujisawa T, et al. Human eosinophils constitutively express a unique serine protease, PRSS33. Allergol Int 2017; 66:463–71. [DOI] [PubMed] [Google Scholar]
- 25.Saito H, Kato A, Matsumoto K, Okayama Y. Culture of human mast cells from peripheral blood progenitors. Nat Protoc 2006; 1:2178–83. [DOI] [PubMed] [Google Scholar]
- 26.Motakis E, Guhl S, Ishizu Y, Itoh M, Kawaji H, de Hoon M, et al. Redefinition of the human mast cell transcriptome by deep-CAGE sequencing. Blood 2014; 123:e58–67. [DOI] [PMC free article] [PubMed] [Google Scholar]
- 27.Atri C, Guerfali FZ, Laouini D. Role of Human Macrophage Polarization in Inflammation during Infectious Diseases. Int J Mol Sci 2018; 19. [DOI] [PMC free article] [PubMed] [Google Scholar]
- 28.Brown CC, Gudjonson H, Pritykin Y, Deep D, Lavallee VP, Mendoza A, et al. Transcriptional Basis of Mouse and Human Dendritic Cell Heterogeneity. Cell 2019; 179:846–63 e24. [DOI] [PMC free article] [PubMed] [Google Scholar]
- 29.Grassi L, Pourfarzad F, Ullrich S, Merkel A, Were F, Carrillo-de-Santa-Pau E, et al. Dynamics of Transcription Regulation in Human Bone Marrow Myeloid Differentiation to Mature Blood Neutrophils. Cell Rep 2018; 24:2784–94. [DOI] [PMC free article] [PubMed] [Google Scholar]
- 30.Chen K, Kolls JK. Interluekin-17A (IL17A). Gene 2017; 614:8–14. [DOI] [PMC free article] [PubMed] [Google Scholar]
- 31.Annunziato F, Romagnani C, Romagnani S. The 3 major types of innate and adaptive cell-mediated effector immunity. J Allergy Clin Immunol 2015; 135:626–35. [DOI] [PubMed] [Google Scholar]
- 32.Poposki JA, Klingler AI, Tan BK, Soroosh P, Banie H, Lewis G, et al. Group 2 innate lymphoid cells are elevated and activated in chronic rhinosinusitis with nasal polyps. Immun Inflamm Dis 2017; 5:233–43. [DOI] [PMC free article] [PubMed] [Google Scholar]
- 33.Simoni Y, Newell EW. Dissecting human ILC heterogeneity: more than just three subsets. Immunology 2018; 153:297–303. [DOI] [PMC free article] [PubMed] [Google Scholar]
- 34.Chow KT, Gale M Jr., Loo YM. RIG-I and Other RNA Sensors in Antiviral Immunity. Annu Rev Immunol 2018; 36:667–94. [DOI] [PubMed] [Google Scholar]
- 35.Takabayashi T, Kato A, Peters AT, Suh LA, Carter R, Norton J, et al. Glandular mast cells with distinct phenotype are highly elevated in chronic rhinosinusitis with nasal polyps. J Allergy Clin Immunol 2012; 130:410–20 e5. [DOI] [PMC free article] [PubMed] [Google Scholar]
- 36.Mahdavinia M, Carter RG, Ocampo CJ, Stevens W, Kato A, Tan BK, et al. Basophils are elevated in nasal polyps of patients with chronic rhinosinusitis without aspirin sensitivity. J Allergy Clin Immunol 2014; 133:1759–63. [DOI] [PMC free article] [PubMed] [Google Scholar]
- 37.Poposki JA, Uzzaman A, Nagarkar DR, Chustz RT, Peters AT, Suh LA, et al. Increased expression of the chemokine CCL23 in eosinophilic chronic rhinosinusitis with nasal polyps. J Allergy Clin Immunol 2011; 128:73–81 e4. [DOI] [PMC free article] [PubMed] [Google Scholar]
- 38.Peterson S, Poposki JA, Nagarkar DR, Chustz RT, Peters AT, Suh LA, et al. Increased expression of CC chemokine ligand 18 in patients with chronic rhinosinusitis with nasal polyps. J Allergy Clin Immunol 2012; 129:119–27 e1–9. [DOI] [PMC free article] [PubMed] [Google Scholar]
- 39.Poposki JA, Peterson S, Welch K, Schleimer RP, Hulse KE, Peters AT, et al. Elevated presence of myeloid dendritic cells in nasal polyps of patients with chronic rhinosinusitis. Clin Exp Allergy 2015; 45:384–93. [DOI] [PMC free article] [PubMed] [Google Scholar]
- 40.Kato Y, Takabayashi T, Sakashita M, Imoto Y, Tokunaga T, Ninomiya T, et al. Expression and Functional Analysis of CST1 in Intractable Nasal Polyps. Am J Respir Cell Mol Biol 2018; 59:448–57. [DOI] [PubMed] [Google Scholar]
- 41.Takabayashi T, Kato A, Peters AT, Hulse KE, Suh LA, Carter R, et al. Excessive fibrin deposition in nasal polyps caused by fibrinolytic impairment through reduction of tissue plasminogen activator expression. Am J Respir Crit Care Med 2013; 187:49–57. [DOI] [PMC free article] [PubMed] [Google Scholar]
- 42.Imoto Y, Kato A, Takabayashi T, Stevens W, Norton JE, Suh LA, et al. Increased thrombin-activatable fibrinolysis inhibitor levels in patients with chronic rhinosinusitis with nasal polyps. J Allergy Clin Immunol 2019; 144:1566–74 e6. [DOI] [PMC free article] [PubMed] [Google Scholar]
- 43.Bagchi S, Genardi S, Wang CR. Linking CD1-Restricted T Cells With Autoimmunity and Dyslipidemia: Lipid Levels Matter. Front Immunol 2018; 9:1616. [DOI] [PMC free article] [PubMed] [Google Scholar]
- 44.Tan BK, Li QZ, Suh L, Kato A, Conley DB, Chandra RK, et al. Evidence for intranasal antinuclear autoantibodies in patients with chronic rhinosinusitis with nasal polyps. J Allergy Clin Immunol 2011; 128:1198–206 e1. [DOI] [PMC free article] [PubMed] [Google Scholar]
- 45.Jeffe JS, Seshadri S, Hamill KJ, Huang JH, Carter R, Suh L, et al. A role for anti-BP180 autoantibodies in chronic rhinosinusitis. Laryngoscope 2013; 123:2104–11. [DOI] [PMC free article] [PubMed] [Google Scholar]
- 46.Van Roey GA, Vanison CC, Wu J, Huang JH, Suh LA, Carter RG, et al. Classical complement pathway activation in the nasal tissue of patients with chronic rhinosinusitis. J Allergy Clin Immunol 2017; 140:89–100 e2. [DOI] [PMC free article] [PubMed] [Google Scholar]
- 47.Pothoven KL, Norton JE, Hulse KE, Suh LA, Carter RG, Rocci E, et al. Oncostatin M promotes mucosal epithelial barrier dysfunction, and its expression is increased in patients with eosinophilic mucosal disease. J Allergy Clin Immunol 2015; 136:737–46 e4. [DOI] [PMC free article] [PubMed] [Google Scholar]
- 48.Yoo F, Soler ZM, Mulligan JK, Storck KA, Lamira JM, Pasquini WN, et al. Olfactory cleft mucus proteins associated with olfactory dysfunction in a cohort without chronic rhinosinusitis. Int Forum Allergy Rhinol 2019; 9:1151–8. [DOI] [PMC free article] [PubMed] [Google Scholar]
- 49.Hoggard M, Nocera A, Biswas K, Taylor MW, Douglas RG, Bleier BS. The sinonasal microbiota, neural signaling, and depression in chronic rhinosinusitis. Int Forum Allergy Rhinol 2018; 8:394–405. [DOI] [PubMed] [Google Scholar]
Associated Data
This section collects any data citations, data availability statements, or supplementary materials included in this article.