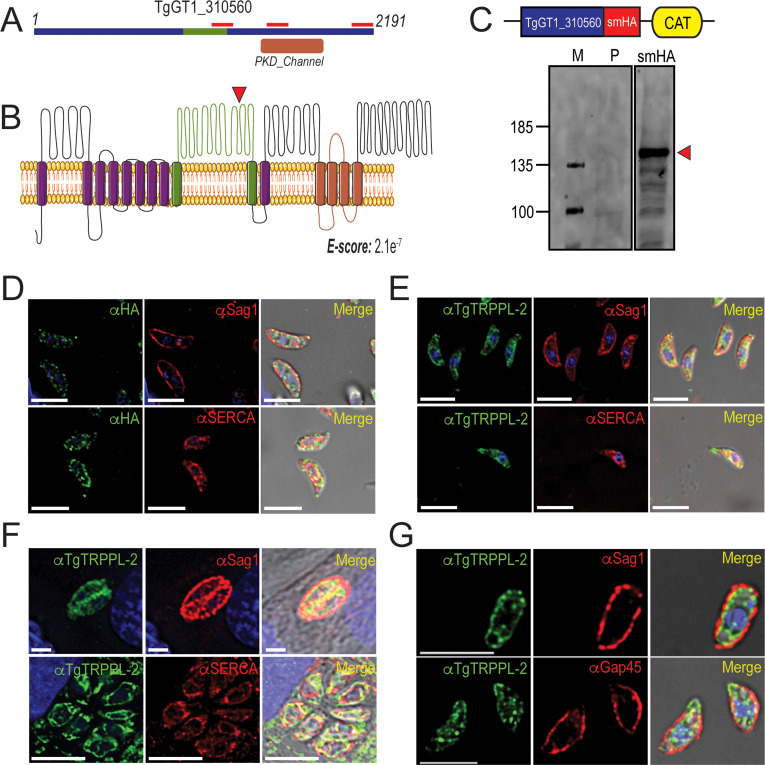
Figure 1. TgTRPPL-2 localizes to the endoplasmic reticulum and periphery of T. gondii.
(A) Schematic representation of the InterPro Domain annotation of TgTRPPL-2 in the GT1 strain. Red line indicates coverage of the sequence by mass spectrometry. (B) Predicted topology for TgTRPPL-2 in GT1 strain. Model was generated with the Protter application (Omasits et al., 2014). The PKD domain is shown in orange. The domain used to generate antibodies is highlighted in green. Predicted Transmembrane Domains (TMDs) are highlighted in purple. The red arrowhead indicates the predicted cleavage site for TgTRPPL2. (C) Schematic representation of C-terminal tagging of TgTRPPL-2 in TatiΔKu80 parasites and western blots of TgTRPPL-2-smHA membranes using αHA (1:1000) showing a major band at approximately 150 kDa (red arrowhead). (D) Immunofluorescence analysis (IFA) of extracellular tachyzoites using αHA antibody and co-localization with αSAG1 (1:1000) and αSERCA (1:1000) showing partial co-localization with both markers. (E) IFAs of extracellular and intracellular (F) tachyzoites respectively with αTgTRPPL-2 (1:100) showing labeling of the protein at the periphery, co-localized with αSAG1 (1:1000) and with αTgSERCA (1:1000). (G) Super-resolution of extracellular IFAs using αTgTRPPL-2 (1:100) co-localized with αSAG1 (1:1000) but not with αGAP45 (1:1000). Scale bars in D-G represent 5 µm.


