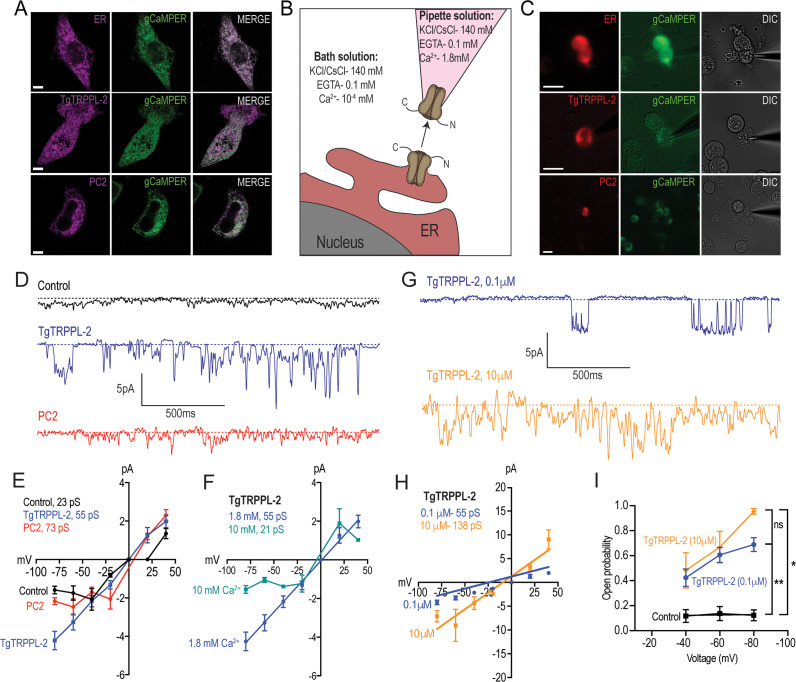
Figure 4. Characterization of TgTRPPL-2 expressed in HEK-3KO cells.
(A) Images of HEK-3KO cells expressing an endoplasmic reticulum (ER)-marker, polycystin 2 (PC2), or TgTRPPL-2 with the genetic calcium indicator gCaMPer. (B) Schematic representation of nuclear-patch clamp in the outside (cytosolic-side) out configuration. Ionic composition and concentration for bath and pipette solutions are shown. (C) Patched nuclear-extract expressing ER-marker, PC2, and TgTRPPL-2 with the genetic calcium indicator gCaMPer. (D) Representative tracing from control, TgTRPPL-2 or PC2-expressing cells showing the currents recorded in the presence of 1.8 mM luminal Ca2+ in a symmetrical potassium chloride solution. Tracings represent approximately 2 s. (E) Current-voltage relationship comparing single-channel current amplitude of control, PC2, and TgTRPPL-2-expressing cells from (D). Inset: calculated slope conductance for control, TgTRPPL-2, and PC2. (F) Current-voltage relationship comparing single-channel current amplitude of TgTRPPL-2-expressing cells at 1.8 and 10 mM [Ca2+] inside the pipette. Inset: calculated slope conductance for the conditions analyzed. (G) Representative traces of currents recorded from TgTRPPL-2-expressing cells using different concentration of [Ca2+] in the bath solution (Solution A vs. Solution C) (Supplementary file 4). Tracings represent approximately 2 s. (H) Current-voltage relationship comparing single-channel current amplitude of TgTRPPL-2-expressing cells at 0.1 and 10 μM [Ca2+] in the bath solution. Inset: calculated slope conductance for the different [Ca2+]. (I) Open probability of control and TgTRPPL-2-expressing cells in the presence of different [Ca2+] in the bath solution in comparison to the control. *p<0.01, **p<0.001. Scale bars in A and C represent 10 µm.

