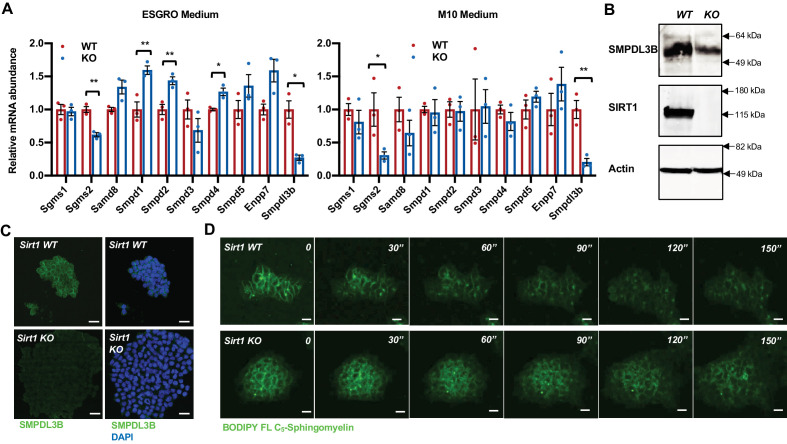
Figure 2. SIRT1-deficient mESCs have reduced expression of SMPDL3B and sphingomyelin degradation.
(A) SIRT1 KO mESCs have reduced mRNA levels of Smpdl3b. WT and SIRT1 KO mESCs were cultured in either ESGRO medium or M10 medium. The mRNA levels of indicated enzymes involved in sphingomyelin synthesis (Sgms) and degradation (Smpd) were analyzed by qPCR (n = 3 biological replicates, *p<0.05, **p<0.01). (B–C) SIRT1 KO mESCs have reduced protein levels of SMPDL3B. The protein levels of SMPDL3B were analyzed by (B) immunoblotting and (C) immuno-fluorescence staining. Scale bars: 20 µm. (D) SIRT1 KO mESCs have reduced degradation of sphingomyelin. WT and SIRT1 KO mESCs were preloaded with BODIPY FL-C5 sphingomyelin for 30 min at 4°C, then incubated with BODIPY FL-C5 sphingomyelin-free medium at 37°C. The dynamic of BODIPY FL-sphingomyelin was monitored for additional 12 hr at 37°C. WT and SIRT1 KO mESC clones that have comparable preloaded levels of BODIPY FL-C5 sphingomyelin were shown. Scale bars: 20 µm.


