Abstract
We and others recently developed rapid tilt-series acquisition methods for cryo-electron tomography on a Titan Krios G3i equipped with a single axis holder and a K-series direct electron detector and showed that one of these, the fast-incremental single exposure (FISE) method, significantly accelerates tilt-series acquisition when compared to traditional methods while preserving the quality of the images. Here, we characterize the behavior of our single axis holder in detail during a FISE experiment to optimally balance data quality with speed. We explain our methodology in detail so others can characterize their own stages, and conclude with recommendations for projects with different resolution goals.
Graphical Abstract
Introduction
Cryo-electron tomography (Cryo-ET) has become an essential imaging technique to reveal the structures of frozen-hydrated biological complexes and the architectures of cells in their native states (Cassidy et al., 2015; Chang et al., 2016; Ghosal et al., 2017; Kaplan et al., 2019; Mattei et al., 2018; Schur et al., 2016). In cryo-ET, a tilt-series is collected by tilting the sample around a tilt axis and acquiring multiple projection images of the specimen throughout a tilt range. This tilt-series is then used to computationally reconstruct a tomogram, a 3D volume of the object being imaged. One of the major challenges in cryo-ET is throughput; a typical tilt-series takes an average of 30 minutes to collect. The majority of this time is spent on ancillary tasks intended to ensure the target remains centered in the field of view (FoV) at every tilt angle in the tilt-series (Mastronarde, 2005). We and others recently developed the fast-incremental single exposure (FISE) method on a Titan Krios G3i equipped with a highly-eucentric single axis holder, and showed that by skipping all tracking of the target during acquisition, high-quality tilt-series can be acquired in 5 minutes or less (Chreifi et al., 2019; Eisenstein et al., 2019). FISE tilt-series of purified ribosomes, for instance yielded subtomogram averages with sub-nanometer resolution (Eisenstein et al., 2019).
During a FISE acquisition, the camera records a single, long movie encompassing the entire tilt-series, including every tilt angle in the tilt scheme, while the dose is fractionated into individual frames at a user-determined frame rate. In order to avoid recording images during stage movement, the beam is blanked throughout most of the tilt scheme and only unblanked once the stage has come to a rest at each desired tilt angle. When acquisition is complete, blank frames are discarded based on a user-defined threshold for mean electron count and frames from the same tilt angle are motion-corrected and combined.
While stage movement during tilting has been explored previously (Chreifi et al., 2019; Eisenstein et al., 2019), residual stage movement after the stage has finished tilting to each target angle has not yet been characterized. In a typical FISE experiment, the beam is typically unblanked as soon as the stage has stopped tilting, but excessive residual stage movement could reduce FISE data quality. Here, we have analyzed the settling behavior of our stage immediately after each tilt operation of a typical dose-symmetric tilt scheme, with a focus on the direction of movement, its amplitude, how long the settling lasts, and the reproducibility of the behavior for each tilt operation. We find that a fraction of a second delay may be desirable after some tilt operations depending on a user’s data collection parameters and resolution goals. We also describe how we tested our Titan Krios stage at Caltech so others can replicate the tests on their own instruments and customize their FISE scripts accordingly.
Results & Discussion
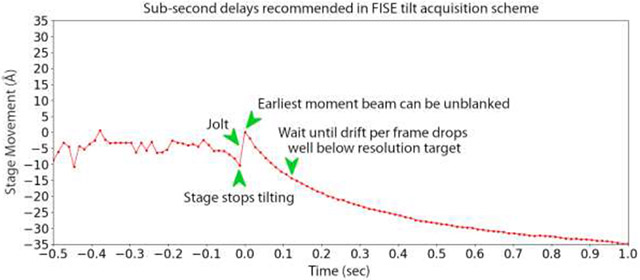
In order to fully characterize the behavior of the stage as tilting stops, we first recorded long exposures with the highest frame rate possible starting while the stage was still tilting, and continuing for an additional 2 seconds after the tilting ended (Figure 1). This experiment was done twelve times for three different tilt operations commonly used in a typical dose-symmetric tilt scheme: a small 3° tilt operation from 0° to 3°(Figure 1A) and two large operations in different directions, from 45° to −36° and from −60° to 48° (Figure 1B,C). In order to maximize sampling rate, this experiment was done at the highest frame rate allowed by the Gatan K3 detector of 75 frames per second (fps) and a pixel size of 0.68 Å/pix. In all cases, we observed a quick jolt perpendicular to the tilt axis, with a magnitude of approximately 10 Å, just as the stage visually appears to arrive at its destination in our images. The jolt is extremely short-lived, lasting for approximately 0.04 s (between 1-3 frames at a frame rate of 75 fps), so it would be easily missed at low frame rates. The jolt observed could be caused by stage corrections applied to reduce the build-up of internal tension that occurs during stage rotation. Afterwards, each of the three tilt operations resulted in different behavior, but in each case, the average stage movement started at less than 2 Ångstroms per frame and then decreased to hundredths of an Ångstrom per frame within a second.
Figure 1.
Stage movement perpendicular to the tilt axis during and after tilting from (A) 0° to 3°, (B) 45° to −36°, and (C) −60° to 48°. We assigned time 0 as the time at which the stage visually appears to have stopped its tilting motion in the recorded images. A green arrow marks the jolt observed when the stage stopped tilting.
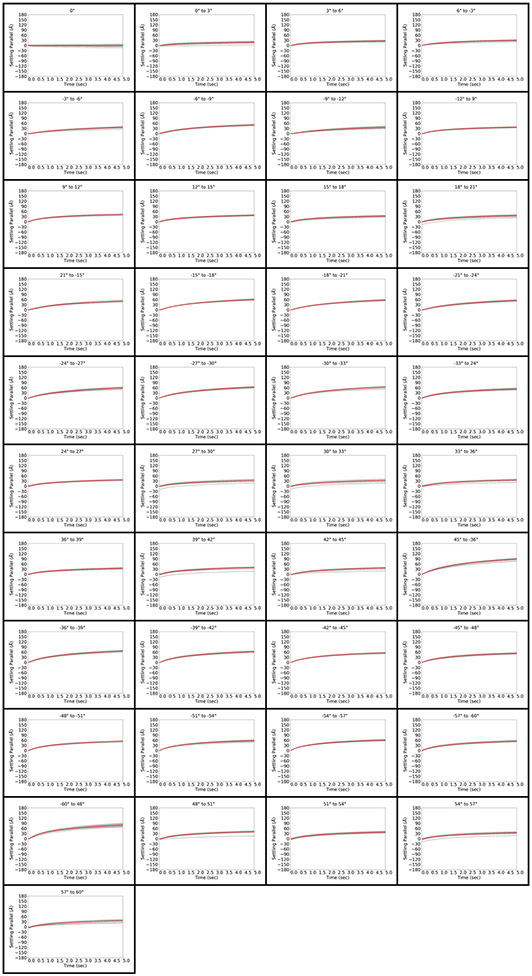
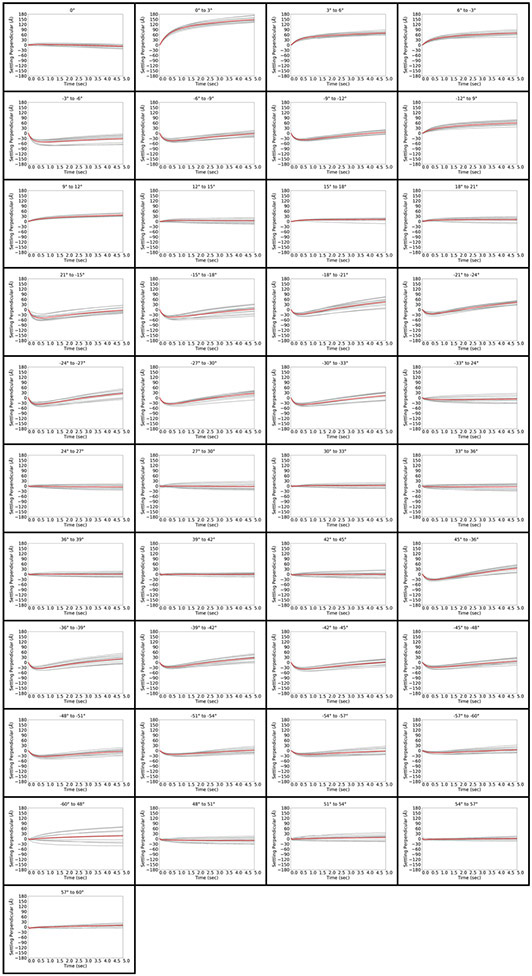
To further characterize stage stability, we next analyzed residual stage movement in conditions identical to a FISE experiment. In a FISE experiment the SerialEM FrameSeriesFromVar command is first used to issue a stage tilt command, which can be followed by an optional delay time, and then the beam is unblanked. By setting the delay time to 0 in this experiment, the time between the end of tilting and beam unblanking is set simply by internal communications between the hardware and software. This analysis was done for every tilt operation in a typical −60° to +60°, 3°-increment dose-symmetric tilt scheme (a total of 41 tilt operations, see Table 1 below), and performed at 12 different locations on a grid with cross grating. In this experiment, data were again collected at a frame rate of 75 fps, the maximal frame rate achievable by the Gatan K3 camera, and a pixel size of just 0.68 Å/pix. While this high frame rate is unlikely to be useful in cryo-ET experiments, it allows us to characterize stage movement in as much detail as possible. Figures 2 and 3 show residual stage movement parallel and perpendicular to the tilt axis after unblanking for all 41 tilt operations in the tilt scheme.
Table 1.
Tilt operations in the dose-symmetric tilt scheme used during FISE acquisition, numbered in the order they are acquired.
| 1 | 0° | 12 | 18° to 21° | 22 | 27° to 30° | 32 | −45° to −48° |
| 2 | 0° to 3° | 13 | 21° to −15° | 23 | 30° to 33° | 33 | −48° to −51° |
| 3 | 3° to 6° | 14 | −15° to −18° | 24 | 33° to 36° | 34 | −51° to −54° |
| 4 | 6° to −3° | 15 | −18° to −21° | 25 | 36° to 39° | 35 | −54° to −57° |
| 5 | −3° to −6° | 16 | −21° to −24° | 26 | 39° to 42° | 36 | −57° to −60° |
| 6 | −6° to −9° | 17 | −24° to −27° | 27 | 42° to 45° | 37 | −60° to 48° |
| 7 | −9° to −12° | 18 | −27° to −30° | 28 | 45° to −36° | 38 | 48° to 51° |
| 8 | −12° to 9° | 19 | −30° to −33° | 29 | −36° to −39° | 39 | 51° to 54° |
| 9 | 9° to 12° | 20 | −33° to 24° | 30 | −39° to −42° | 40 | 54 to 57° |
| 10 | 12° to 15° | 21 | 24° to 27° | 31 | −42° to −45° | 41 | 57° to 60° |
| 11 | 15° to 18° |
Figure 2.
Stage behavior and overall movement parallel to the tilt axis immediately after tilting and unblanking the beam in a FISE experiment for all 41 tilt operations in the dose-symmetric tilt scheme. Tilt operations are indicated at the top of each panel. Each of the 12 measurements is depicted in grey, and the average is depicted in red.
Figure 3.
Stage behavior and overall movement perpendicular to the tilt axis immediately after tilting and unblanking the beam in a FISE experiment for all 41 tilt operations in the dose-symmetric tilt scheme. Tilt operations are indicated at the top of each panel. Each of the 12 measurements is depicted in grey, and the average is depicted in red.
In the FISE context, overall stage movement parallel to the tilt axis was quite small, staying below 60Å over 5 seconds for the majority of tilting operations (Figure 2). In many cases, the stage moved at 0.5-2 Å/frame in the positive direction for the first 2-3 frames (0.1 seconds), but was then as close to motionless as we could detect using standard motion-correction software. The behavior was very different perpendicular to the tilt axis, where a cumulative movement of up to 180 A is observed over 5 seconds (Figure 3). The large jolt perpendicular to the tilt axis was never observed in any of the iterations, suggesting that it occurs in the dead time between the end of the stage tilting operation and beam unblanking. The timing of the event therefore suggests that there is no need to account for it in a FISE experiment. We found it remarkable that while the stage’s behavior overall varied significantly between tilt operations, the movements were quite consistent for a given tilt operation regardless of position on the grid.
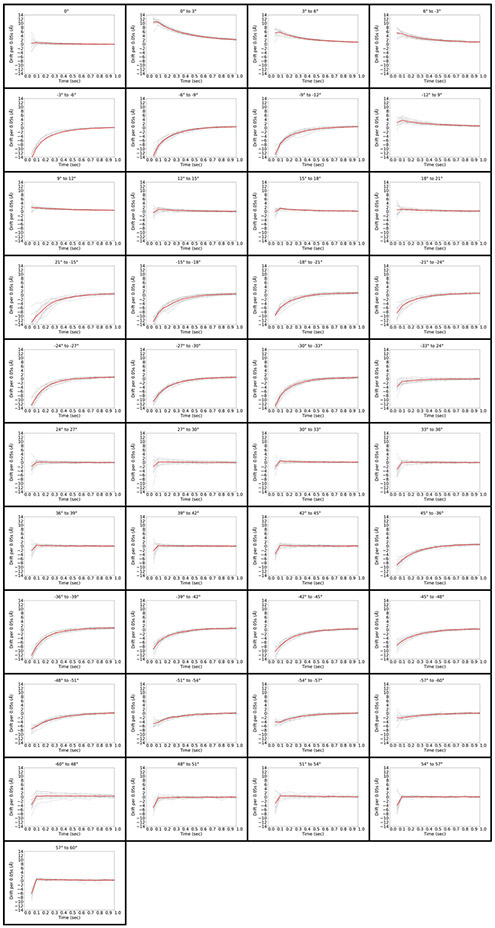
To explore stage drift at frame rates more commonly used in cryo-ET, we plotted the drift per frame perpendicular to the tilt axis at 20 fps (0.05s/frame), measured at 12 different positions on the grid (Figure 4). In the best cases, we observed between 2-6 Å/frame drift in the first few frames, quickly dropping to less than 1Å/frame after 0.1s. In the worst cases, stage movement began at 14 Å/frame and then decreased to about 1 Å/frame after half a second, with further gradual decreases in subsequent seconds.
Figure 4.
Stage drift per 0.05s frame for all 41 tilt operations in the tilt scheme. Tilt operations are indicated at the top of each panel. Each of the 12 measurements is depicted in grey, and the average is depicted in red.
In order to assess whether the stage drifts in the z direction (parallel to the beam), we calculated power spectra of individual frames and fit contrast transfer functions (CTF) with CTFFIND4 (Rohou and Grigorieff, 2015) for the first 3 tilt operations in our tilt scheme (Figure 5A-C). In all three cases, the estimated defoci of different frames varied by only 10-20 nanometers or less, and erratically, suggesting that those differences were errors in defocus estimation rather than actual physical stage drift. Drifts in z are therefore comparable to or smaller than drifts in x and y. Because these distances are very small compared to the depth of field of electron microscopes, z-drift after tilting will not limit resolution and is not a concern.
Figure 5.
Stage drift in the z direction after tilting, measured by estimating defoci and fitting the contrast transfer functions in 0.0135 second frames over 1 second for the (A) 0° tilt angle, (B) 0° to 3° tilt operation, and (C) 3° to 6° tilt operation.
To examine the quality and resolution of frames acquired during a FISE experiment at 20 fps, we also generated power spectra at multiple timepoints, ranging from 0.1 s to 5 s, for the three best and three worst tilt operations (Figure 6). These images were recorded on a cross grating covered with gold nanoparticles. The bright circle is produced by the {111} gold nanoparticle plane (2.35 Å lattice spacing). Another, fainter ring can also sometimes be seen for the {200} plane at 2.03 Å. For all tilt operations, frames taken at 0.1 s exhibited only a partial 2.35 Å gold ring, with information missing mostly in the vertical direction. Completeness improves by 0.5s for the best tilt operations, but remains poor for the worst ones. Frames taken at 1 s and later exhibit complete gold rings at 2.35 Å, except for the worst tilt operation, from 0° to 3°. These results are in good agreement with the drift data of Figure 4 since drift rates have to decrease to ~1 Å before resolutions of 2.35 Å can be achieved. We were surprised that the worst stage movement perpendicular to the tilt axis followed the smallest tilt operation, the 3° increment from 0° to 3° (Figures 3, 4).
Figure 6.
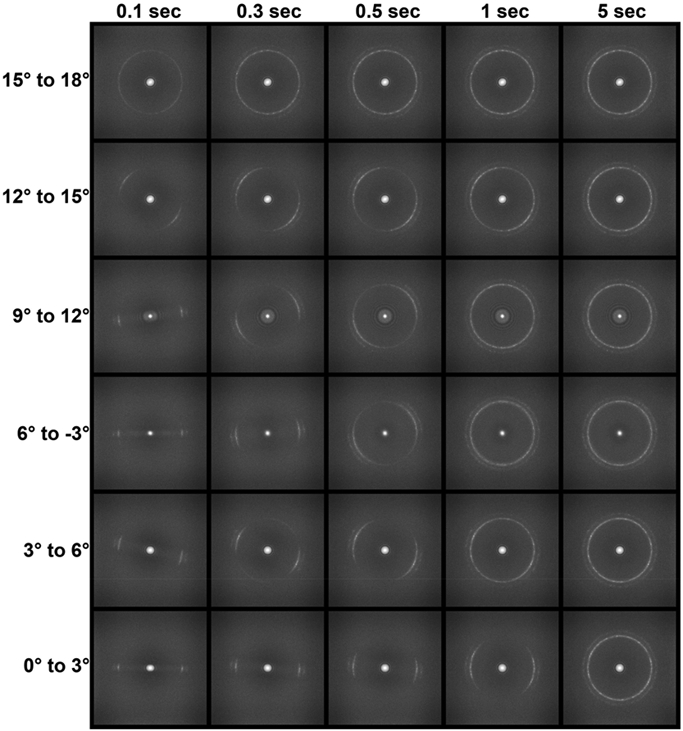
Power spectra of individual 0.05s frames at various timepoints after beam unblanking for the 3 best and 3 worst tilt operations, shown in order of best to worst. The tilt axis is horizontal in all the images.
To further explore the factors that affect stage behavior, we collected data using different tilt schemes, changing the order in which tilt angles are acquired, and compared average stage movements to the tilt scheme (Figure 7). In the first alternate tilt scheme, we collected tilt angles in exactly the reverse order as in our dose-symmetric tilt scheme. The second alternative tilt scheme is simply bidirectional from 0°, with a tilt range of −60° to +60°. The results suggest that stage behavior after tilting to any particular final tilt angle is consistently affected by tilting direction and certain final tilt angles are more problematic than others, with the worst being arriving at 3°, regardless of the direction the stage starts from.
Figure 7.
Comparison of the average stage movement after tilting using different tilt schemes for all 41 target angles in a 3°-increment cryo-ET acquisition. The dose-symmetric tilt scheme is depicted in red, the reverse tilt scheme in blue, and the bi-directional tilt scheme in green. Destination tilt angles indicated at the top of each panel.
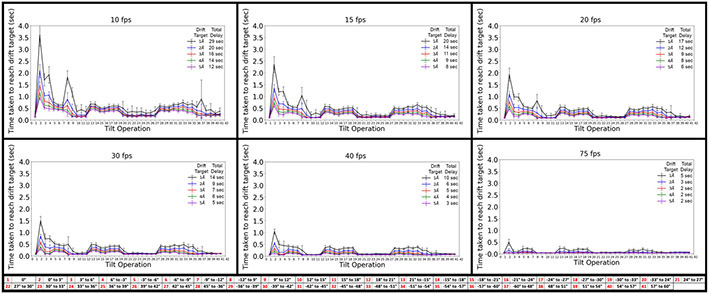
Taken together, these results recommend that short delays be inserted between tilting and unblanking the beam for each specific tilt operation in a FISE experiment in order to minimize the effect of stage drift on the final resolution in the images. The ideal delay times are, however, dependent on resolution targets and camera frame rates. This is because one must wait until the absolute drift within a frame falls below about half to a third of the resolution target, and this is obviously reached more quickly the faster the frame rate and the larger the resolution target. For every tilt operation described in Table 1, we therefore calculated the time at which residual stage movement between frames drops below certain thresholds, ranging from 1 Å to 5 Å, for frame rates between 10 and 75 fps (Figure 8). These drift targets make it possible to produce subtomogram averages with resolutions roughly ranging from 3 Å to 15 Å, which is the typical range of interest today.
Figure 8.
Time required to reach various drift rate thresholds for the 41 tilt operations in a typical dose-symmetric tilt scheme, at frame rates of 10 fps, 15 fps, 20 fps, 30 fps, 40 fps, and 75 fps. For convenience, the attached table references the 41 tilt operations depicted on the horizontal axis of each plot. The inset in each panel shows the color used for each drift rate threshold and the total time that would be added to a FISE tilt-series acquisition if these times were used as delays prior to each tilt operation.
The results highlight how valuable high frame rates can be. Assuming a cryo-ET experiment seeks to produce a sub-nanometer subtomogram average, the drift rate per frame should be less than half that resolution and perhaps even as low as a third. Taking a drift rate target of 3 Å/frame, almost no delays are indicated if the camera frame rate is 75 fps (Figure 8). If the camera frame rate used is only 10 fps, however, delays of approximately 0.5 seconds per tilt are required, adding up to a total of 16 extra seconds needed for the whole tilt-series. Since the achievable resolution in cellular cryo-ET projects is often limited by other factors to just 2-4 nm (Galaz-Montoya and Ludtke, 2017; Glaeser, 1971; Kudryashev et al., 2012; Radermacher, 1988), no delays are needed even at low frame rates. Unfortunately, collecting FISE tilt-series at very high frame rates (> 20 fps) in super-resolution mode (11520x8184 pixels, commonly referred to as bin 0.5x) on the K3 causes an error. The high number of recorded frames causes the camera hardware buffer to fill up to capacity before the entire exposure is finished. This limitation is greatly reduced when super-resolution frames are binned directly at the camera hardware (to bin 1x, 5760x4092 pixels). With our tilt scheme, we are able to record FISE data at up to 20 fps at bin 0.5x, and up to 60 fps at bin 1x. It is worth noting that frame rates greater than 20 fps are mostly of academic interest, since it is not clear how motion-correction software will perform at very high frame rates given the limited dose available when imaging biological samples. Since faster frame rates imply a lower dose per frame, it would be interesting to establish a minimum dose required to motion-correct images. While we have been able to motion-correct images with as low as 0.2 electrons per pixel, the quality of motion-correction greatly depends not only on the dose per pixel and sample thickness, but also on the inherent contrast within the sample and the size of the objects being imaged. These factors make it difficult to assign a specific value to the minimum dose required for motion-correction.
While our results show that the quality of FISE frames recorded at lower frame rates can be preserved by delaying longer, these added delays are short, and do not significantly impact overall tilt-series time (Table 2). For instance, it currently takes us approximately 225 s to record a tilt-series with no added delays. By applying the recommended delays, the maximal K3 frame rate of 75 fps would result in total delays of 5 s per tilt series to reach a 1Å drift target, for a total of 230 s per tilt series. On the other hand, collecting these at 20 fps results in total added delays of 17 s per tilt series, or 242 s per tilt series.
Table 2.
Breakdown of the times taken to perform different steps of a FISE tilt-series acquisition on a Krios G3i with a K3 camera. The total time added by incorporating the recommended delays is also shown. Note: frame rates greater than 60 fps are not yet experimentally sustainable.
| Prep Time | Exposure Time (s) | Tilting Time (s) | Camera Latency | Total Time |
|---|---|---|---|---|
| 90 s | 41 s | 90 s | 4 s | 225 s |
| Frame rate | Extra delay to reach < 1Å drift target |
Total time with delays | ||
| 10 fps | 29 s | 254 s | ||
| 15 fps | 20 s | 245 s | ||
| 20 fps | 17 s | 242 s | ||
| 30 fps | 14 s | 239 s | ||
| 40 fps | 10 s | 235 s | ||
| 75 fps | 5 s | 230 s | ||
There are many factors that can limit the resolution of a subtomogram average. These factors include, among others, ice thickness, image quality, a precise alignment of the tilt series based on sufficient and stable fiducial markers, and particle size and features for a precise alignment. In order to improve image quality, we have here analyzed the behavior of our single axis stage in the fractions of a second after it stops tilting and developed a protocol that others can use to characterize their own stages. Other factors that can impact the resolution of a sub-tomogram average include large changes in defocus between tilt images, such as we and others previously reported (Chreifi et al., 2019; Eisenstein et al., 2019). To further explore this on our stage, we measured the changes in defocus in FISE tilt series by CTF fitting. The average defocus change from 20 iterations over a tilt range of −60° to +60° was 1781 ± 92 nm (Figure 9A). The changes were so consistent across runs, we incorporated defocus corrections based on the average expected change in defocus at each tilt angle into our FISE acquisition protocol. To test the reliability of this approach, we collected an additional 10 FISE tilt series using these pre-calibrated defocus corrections. The average difference between the minimum and maximum defoci within each tilt-series was then 349 ± 52 nm underfocus, with the majority of the variation occurring at high tilt angles (Figure 9B).
Figure 9.
Defocus change measured by CTF fitting for 20 FISE tilt series without any pre-calibration applied (A) and 10 FISE tilt series with pre-calibration applied (B). Positive defocus values are underfocused.
Conclusions
We have analyzed the drift behavior of a Titan Krios G3i single axis holder in a FISE experiment and determined that it takes a few tenths of a second for the stage to settle after each tilt operation. While previous FISE experiments have already generated sub-nanometer resolution subtomogram averages without any delays added (Eisenstein et al., 2019), we suggest an improved FISE protocol that incorporates brief (fractions of a second) delay times between the tilt command and beam unblanking. In order to maximize image quality while minimizing added erall acquisition time, this delay should be tailored to each tilt operation, the resolution goal, and the camera frame rate used. We speculate that different stages will exhibit different behaviors, so each should be characterized following the procedures and analyses we outline here to optimize collection times. We note that modern cryo-stages suffer other shortcomings as well, such as non-eucentricity, which were not discussed here, but which can also be corrected by tilt-operation-specific beam and image shifts and focus adjustments in the FISE collection script.
Materials and Methods
Cryo-ET data collection
All tomographic data were collected in electron-counting mode using SerialEM software version 3.8 (Mastronarde, 2003) on a Titan Krios G3i (Thermo Fisher Scientific) equipped with a Gatan energy filter and a K3 electron detector (Gatan). Data were recorded on a Ted Pella waffle pattern grating replica with 2160 lines/mm on a 3mm grid (Ted Pella), at a pixel size of 0.68Å and a target defocus of −1 μm.
Data processing and measurement of stage settling
Images were recorded during stage tilting using a simple SerialEM script, by first issuing a TiltTo command to each starting tilt angle, followed by a TiltDuringRecord command to begin recording while tilting the stage to each target tilt angle, starting from 0° to 3°, 45° to −36°, and −60° to 48°. A long enough exposure time was set in order to record frames during stage tilting and for several seconds after it had stopped. Frames were recorded at a frame rate of 75 fps. Data were then gain-normalized and motion-corrected using IMOD’s Alignframes (Kremer et al., 1996). Alignment values produced by the motion correction were used to plot stage movement perpendicular to the tilt axis as a function of time, and the moment the stage appears to reach the target tilt angle in the images was assigned as time 0.
Data collected in a FISE context were acquired at 75 fps by collecting each tilt angle individually with an exposure time of 5 s per tilt, for a total of 41 datasets at 12 different locations on a waffle pattern grating replica grid (Ted Pella). The dose-symmetric tilt scheme adapted from others (Hagen et al., 2017) was used since it provides a more optimal distribution of radiation dose, and is the recommended scheme for FISE data collection. Frames from each dataset were then gain-normalized and motion-corrected with IMOD’s Alignframes (Kremer et al., 1996) or Motioncor2 (Zheng et al., 2017). Both motion-correction programs produced similar results in all cases. Motion-correction values were used to plot stage movement perpendicular and parallel to the tilt axis over time. Drift per frame was calculated by taking the difference between the accumulated drift for a given frame and the frame preceding it. Power spectra were produced with EMAN2 using a single 0.05 s frame at the following timepoints: 0.1 s, 0.2 s, 0.3 s, 0.5 s, 1 s, and 5 s. The time taken to reach a drift rate threshold was calculated for each tilt operation by finding the time at which the drift per frame value dropped below a target threshold value and remained below that threshold for at least 10 frames at a given frame rate. Frame rates included 10 fps, 15 fps, 20 fps, 30 fps, 40 fps, and 75 fps, while drift thresholds used were 1 Å, 2Å, 3 Å, 4 Å, and 5 Å. Our FISE scripts can be downloaded from the SerialEM Script Repository (https://serialemscripts.nexperion.net/)
Stage movement along Z and defocus calibration
Defocus change immediately after tilting served as a proxy for stage drift in the Z direction. This analysis was done by estimating the CTF in individual 0.0135 second frames over 1 second each for the 0°, 0° to 3°, and 3° to 6° tilt operations using CTFFIND4 (Rohou and Grigorieff, 2015). To measure defocus changes per tilt angle on our stage during FISE acquisition, uncalibrated FISE tilt series were acquired from various carbon quantifoil R2/2 grids, with no pre-calibration shifts applied in Z between tilt angles. Tilt series defoci were measured by CTF fitting using IMOD’s ctfplotter (Kremer et al., 1996; Xiong et al., 2009). The average stage shifts in Z were subsequently calculated at each tilt angle and used as defocus shifts in the acquisition of pre-calibrated FISE tilt series.
Acknowledgements:
This work was supported by NIH grant GM122588 (to G.J.J.). Electron cryomicroscopy was done in the Beckman Institute Resource Center for Transmission Electron Microscopy at Caltech.
Footnotes
Publisher's Disclaimer: This is a PDF file of an unedited manuscript that has been accepted for publication. As a service to our customers we are providing this early version of the manuscript. The manuscript will undergo copyediting, typesetting, and review of the resulting proof before it is published in its final form. Please note that during the production process errors may be discovered which could affect the content, and all legal disclaimers that apply to the journal pertain.
References
- Cassidy CK, Himes BA, Alvarez FJ, Ma J, Zhao G, Perilla JR, Schulten K, Zhang P, 2015. CryoEM and computer simulations reveal a novel kinase conformational switch in bacterial chemotaxis signaling. eLife 4, e08419. 10.7554/eLife.08419 [DOI] [PMC free article] [PubMed] [Google Scholar]
- Chang Y-W, Rettberg LA, Treuner-Lange A, Iwasa J, Søgaard-Andersen L, Jensen GJ, 2016. Architecture of the type IVa pilus machine. Science 351, aad2001. [DOI] [PMC free article] [PubMed] [Google Scholar]
- Chreifi G, Chen S, Metskas LA, Kaplan M, Jensen GJ, 2019. Rapid tilt-series acquisition for electron cryotomography. Journal of Structural Biology 205, 163–169. 10.1016/j.jsb.2018.12.008 [DOI] [PMC free article] [PubMed] [Google Scholar]
- Eisenstein F, Danev R, Pilhofer M, 2019. Improved applicability and robustness of fast cryo-electron tomography data acquisition. Journal of Structural Biology 208, 107–114. 10.1016/j.jsb.2019.08.006 [DOI] [PMC free article] [PubMed] [Google Scholar]
- Galaz-Montoya JG, Ludtke SJ, 2017. The advent of structural biology in situ by single particle cryo-electron tomography. Biophys Rep 3, 17–35. 10.1007/S41048-017-0040-0 [DOI] [PMC free article] [PubMed] [Google Scholar]
- Ghosal D, Chang Y-W, Jeong KC, Vogel JP, Jensen GJ, 2017. In situ structure of the Legionella Dot/Icm type IV secretion system by electron cryotomography. EMBO reports 18, 726–732. 10.15252/embr.201643598 [DOI] [PMC free article] [PubMed] [Google Scholar]
- Glaeser RM, 1971. Limitations to significant information in biological electron microscopy as a result of radiation damage. Journal of Ultrastructure Research 36, 466–482. 10.1016/S0022-5320(71)80118-1 [DOI] [PubMed] [Google Scholar]
- Hagen WJH, Wan W, Briggs JAG, 2017. Implementation of a cryo-electron tomography tilt-scheme optimized for high resolution subtomogram averaging. Journal of Structural Biology, SI:Electron Tomography 197, 191–198. 10.1016/j.jsb.2016.06.007 [DOI] [PMC free article] [PubMed] [Google Scholar]
- Kaplan M, Subramanian P, Ghosal D, Oikonomou CM, Pirbadian S, Starwalt-Lee R, Mageswaran SK, Ortega DR, Gralnick JA, El-Naggar MY, Jensen GJ, 2019. In situ imaging of the bacterial flagellar motor disassembly and assembly processes. The EMBO Journal 38, e100957. 10.15252/embj.2018100957 [DOI] [PMC free article] [PubMed] [Google Scholar]
- Kremer JR, Mastronarde DN, McIntosh JR, 1996. Computer Visualization of Three-Dimensional Image Data Using IMOD. Journal of Structural Biology 116, 71–76. 10.1006/jsbi.1996.0013 [DOI] [PubMed] [Google Scholar]
- Kudryashev M, Castaño-Díez D, Stahlberg H, 2012. LIMITING FACTORS IN SINGLE PARTICLE CRYO ELECTRON TOMOGRAPHY. Computational and Structural Biotechnology Journal 1, e201207002. 10.5936/csbj.201207002 [DOI] [PMC free article] [PubMed] [Google Scholar]
- Mastronarde DN, 2005. Automated electron microscope tomography using robust prediction of specimen movements. Journal of Structural Biology 152, 36–51. 10.1016/j.jsb.2005.07.007 [DOI] [PubMed] [Google Scholar]
- Mastronarde DN, 2003. SerialEM: A Program for Automated Tilt Series Acquisition on Tecnai Microscopes Using Prediction of Specimen Position. Microscopy and Microanalysis 9, 1182–1183. 10.1017/S1431927603445911 [DOI] [Google Scholar]
- Mattei S, Tan A, Glass B, Müller B, Kräusslich H-G, Briggs JAG, 2018. High-resolution structures of HIV-1 Gag cleavage mutants determine structural switch for virus maturation. PNAS 115, E9401–E9410. 10.1073/pnas.1811237115 [DOI] [PMC free article] [PubMed] [Google Scholar]
- Radermacher M, 1988. Three-Dimensional reconstruction of single particles from random and nonrandom tilt series. Journal of Electron Microscopy Technique 9, 359–394. 10.1002/jemt.1060090405 [DOI] [PubMed] [Google Scholar]
- Rohou A, Grigorieff N, 2015. CTFFIND4: Fast and accurate defocus estimation from electron micrographs. J. Struct. Biol 192, 216–221. 10.1016/j.jsb.2015.08.008 [DOI] [PMC free article] [PubMed] [Google Scholar]
- Schur FKM, Obr M, Hagen WJH, Wan W, Jakobi AJ, Kirkpatrick JM, Sachse C, Krausslich H-G, Briggs JAG, 2016. An atomic model of HIV-1 capsid-SP1 reveals structures regulating assembly and maturation. Science 353, 506–508. 10.1126/science.aaf9620 [DOI] [PubMed] [Google Scholar]
- Xiong Q, Morphew MK, Schwartz CL, Hoenger AH, Mastronarde DN, 2009. CTF determination and correction for low dose tomographic tilt series. Journal of Structural Biology 168, 378–387. 10.1016/j.jsb.2009.08.016 [DOI] [PMC free article] [PubMed] [Google Scholar]
- Zheng SQ, Palovcak E, Armache J-P, Verba KA, Cheng Y, Agard DA, 2017. MotionCor2: anisotropic correction of beam-induced motion for improved cryo-electron microscopy. Nature Methods 14, 331–332. 10.1038/nmeth.4193 [DOI] [PMC free article] [PubMed] [Google Scholar]


