Abstract
Various models for ultrasonic scattering from trabecular bone have been proposed. They may be evaluated to a certain extent by comparison with experimental measurements. In order to appreciate limitations of these comparisons, it is important to understand measurement precision. In this paper, an approach proposed by Lizzi and co-workers is adapted to model precision of estimates of frequency dependent backscatter for scattering targets (such as trabecular bone) that contain many scatterers per resolution cell. This approach predicts uncertainties in backscatter due to the random nature of the interference of echoes from individual scatterers as they are summed at the receiver. The model is validated in experiments on a soft-tissue-mimicking phantom and on 24 human calcaneus samples interrogated in vitro. It is found that while random interference effects only partially explain measured variations in the magnitude of backscatter, they are virtually entirely responsible for observed variations in the frequency dependence (exponent of a power law fit) of backscatter.
Keywords: backscatter, bone, precision, scatterer size
Introduction
Ultrasound techniques are recognized for effectiveness in osteoporosis detection (Glηer, 1997; Njeh et al., 2000a). Calcaneal broadband ultrasonic attenuation (BUA) and speed of sound (SOS) are highly correlated with calcaneal bone mineral density (BMD) (Langton et al., 1984; Rossman et al., 1989; Tavakoli and Evans, 1991; Zagzebski et al., 1991; Njeh et al., 1996; Langton et al., 1996; Bouxsein and Radloff, 1997; Laugier et al., 1997; Chappard et al., 1997; Nicholson et al., 1998; Hans et al., 1999; Trebacz, and Natali, 1999; Njeh et al., 2000) which is in turn an useful indicator of osteoporotic fracture risk in the hip (Cummings et al., 1993). BUA (sometimes in combination with SOS) has been demonstrated to be predictive of hip and other fractures in women in prospective (Hans et al., 1996; Bauer et al., 1997) and retrospective (Schott, et al., 1995; Turner et al., 1995; Glüer et al., 1996; Thompson, et al.,1998) studies. Bone sonometry is less expensive, faster, simpler, and more portable than its x-ray counterparts: dual-energy x-ray absorptiometry (DEXA) and quantitative computed tomography (QCT). In addition, ultrasound produces no ionizing radiation.
Scattering from bone has received less attention than attenuation and sound speed. The study of scattering is important however because it can elucidate mechanisms responsible for attenuation (the combined result of absorption and scattering). In addition, scattering measurements have shown some diagnostic promise in their own right in studies in vitro (Roberjot et al. 1996; Wear and Armstrong, 2000; Hoffmeister et al., 2000) and in vivo (Wear and Garra 1997; Giat et al. 1997; Wear and Garra 1998). Backscatter is known to provide information regarding size, shape, number density, and elastic properties of scatterers (Faran 1951; Morse and Ingard 1986). In trabecular bone applications, trabeculae are likely candidates for scattering sites due to the high contrast in acoustic properties between mineralized trabeculae and marrow (Wear 1999; Luo et al. 1999). The diminished number and thicknesses of trabeculae within bone that are associated with increased fracture risk would be expected to reduce backscatter.
In a previous study, measurements of average frequency-dependent backscatter coefficient, η(f), from human calcaneal trabecular samples closely obeyed a power law dependence on frequency, η(f) = Afn throughout the typical diagnostic range (300 – 700 kHz) with n having a value slightly greater than 3, close to the cubic dependence expected from cylindrically shaped scatterers (e.g. trabeculae) (Wear, 1999). A subsequent study reproduced this finding (Chaffai et al., 2000). This result has implications with regard to the relative roles of scattering and absorption in determining attenuation in trabecular bone. Attenuation in the diagnostic range has been found in numerous studies to be approximately proportional to frequency to the first power. These two different co-existing frequency dependences could be consistent only if absorption is a larger component of attenuation than scattering. This result has been reinforced by studies of the anisotropy of backscatter and attenuation in trabecular bone (Wear, 2000).
Empirical estimates of the exponent (n) of the frequency dependence of backscatter coefficient have been demonstrated to be consistent with a model in which trabeculae correspond to cylinders that are long (longer than the beam width), thin (relative to the ultrasonic wavelength), and oriented approximately perpendicular to the ultrasound propagation direction (Wear, 1999). Measurements have also exhibited compatibility with an autocorrelation model (Chaffai et al., 2000). Another model in which scattering is assumed to be proportional to the mean fluctuation in sound speed in a random continuum has been proposed (Nicholson et al., 2000). In contrast to the studies listed above, this model predicts that commonly observed linear attenuation (in the diagnostic range of frequencies) can be explained by scattering. The random continuum model also predicts variations in acoustic parameters with porosity and scatterer size that are consistent with observations, including the reported nonlinear dependence of attenuation on porosity (Serpe and Rho, 1996).
Evaluation of models in relation to empirical findings requires knowledge of accuracy and precision of measurements. Lizzi et al. (1997) developed and validated a model for predicting precision of measurements of backscatter from liver and prostate. In the present paper, the model of Lizzi and co-workers is adapted to bone. As with liver and prostate, ultrasonic echoes from trabecular bone may be modeled as superpositions of signals from unresolvable scatterers throughout the transducer resolution cell (defined by the pulse duration in one dimension and the beam cross section in the orthogonal dimensions). Like liver and prostate, trabecular bone contains many scatterers (trabeculae) per resolution cell. One modification of Lizzi’s approach in the present paper is to model scattering as a power law, η(f) = Afn. Statistical and experimental methods along with results in tissue-mimicking phantoms and calcaneal samples are described below.
Methods
Statistical Methods
Power law fits to data may be obtained by performing least-squares linear fits to log transformed data. Formulas for variances in estimates of parameters from a least-squares linear fit (i.e. slope and intercept) may be found in many sources (e.g. Lindgren, 1962; Bevington and Robinson, 1992).
Lizzi et al. (1997) have presented an analysis of the statistical properties of estimates of the spectral slope (dB/MHz) and mid-band fit (dB) of the logarithm of the ratios of backscattered power spectra to calibration spectra (obtained from echoes reflected from a glass plate) vs. frequency data. (Note that this is not a power law fit because the frequency data was NOT log transformed). Lizzi et al. have provided analytic forms for the probability density function for log-transformed power spectral measurements for speckle-like targets commonly encountered in medical ultrasound in which there are many scatterers per resolution cell (Wagner et al., 1983). This pdf is shown in Figure 1.
Figure 1.
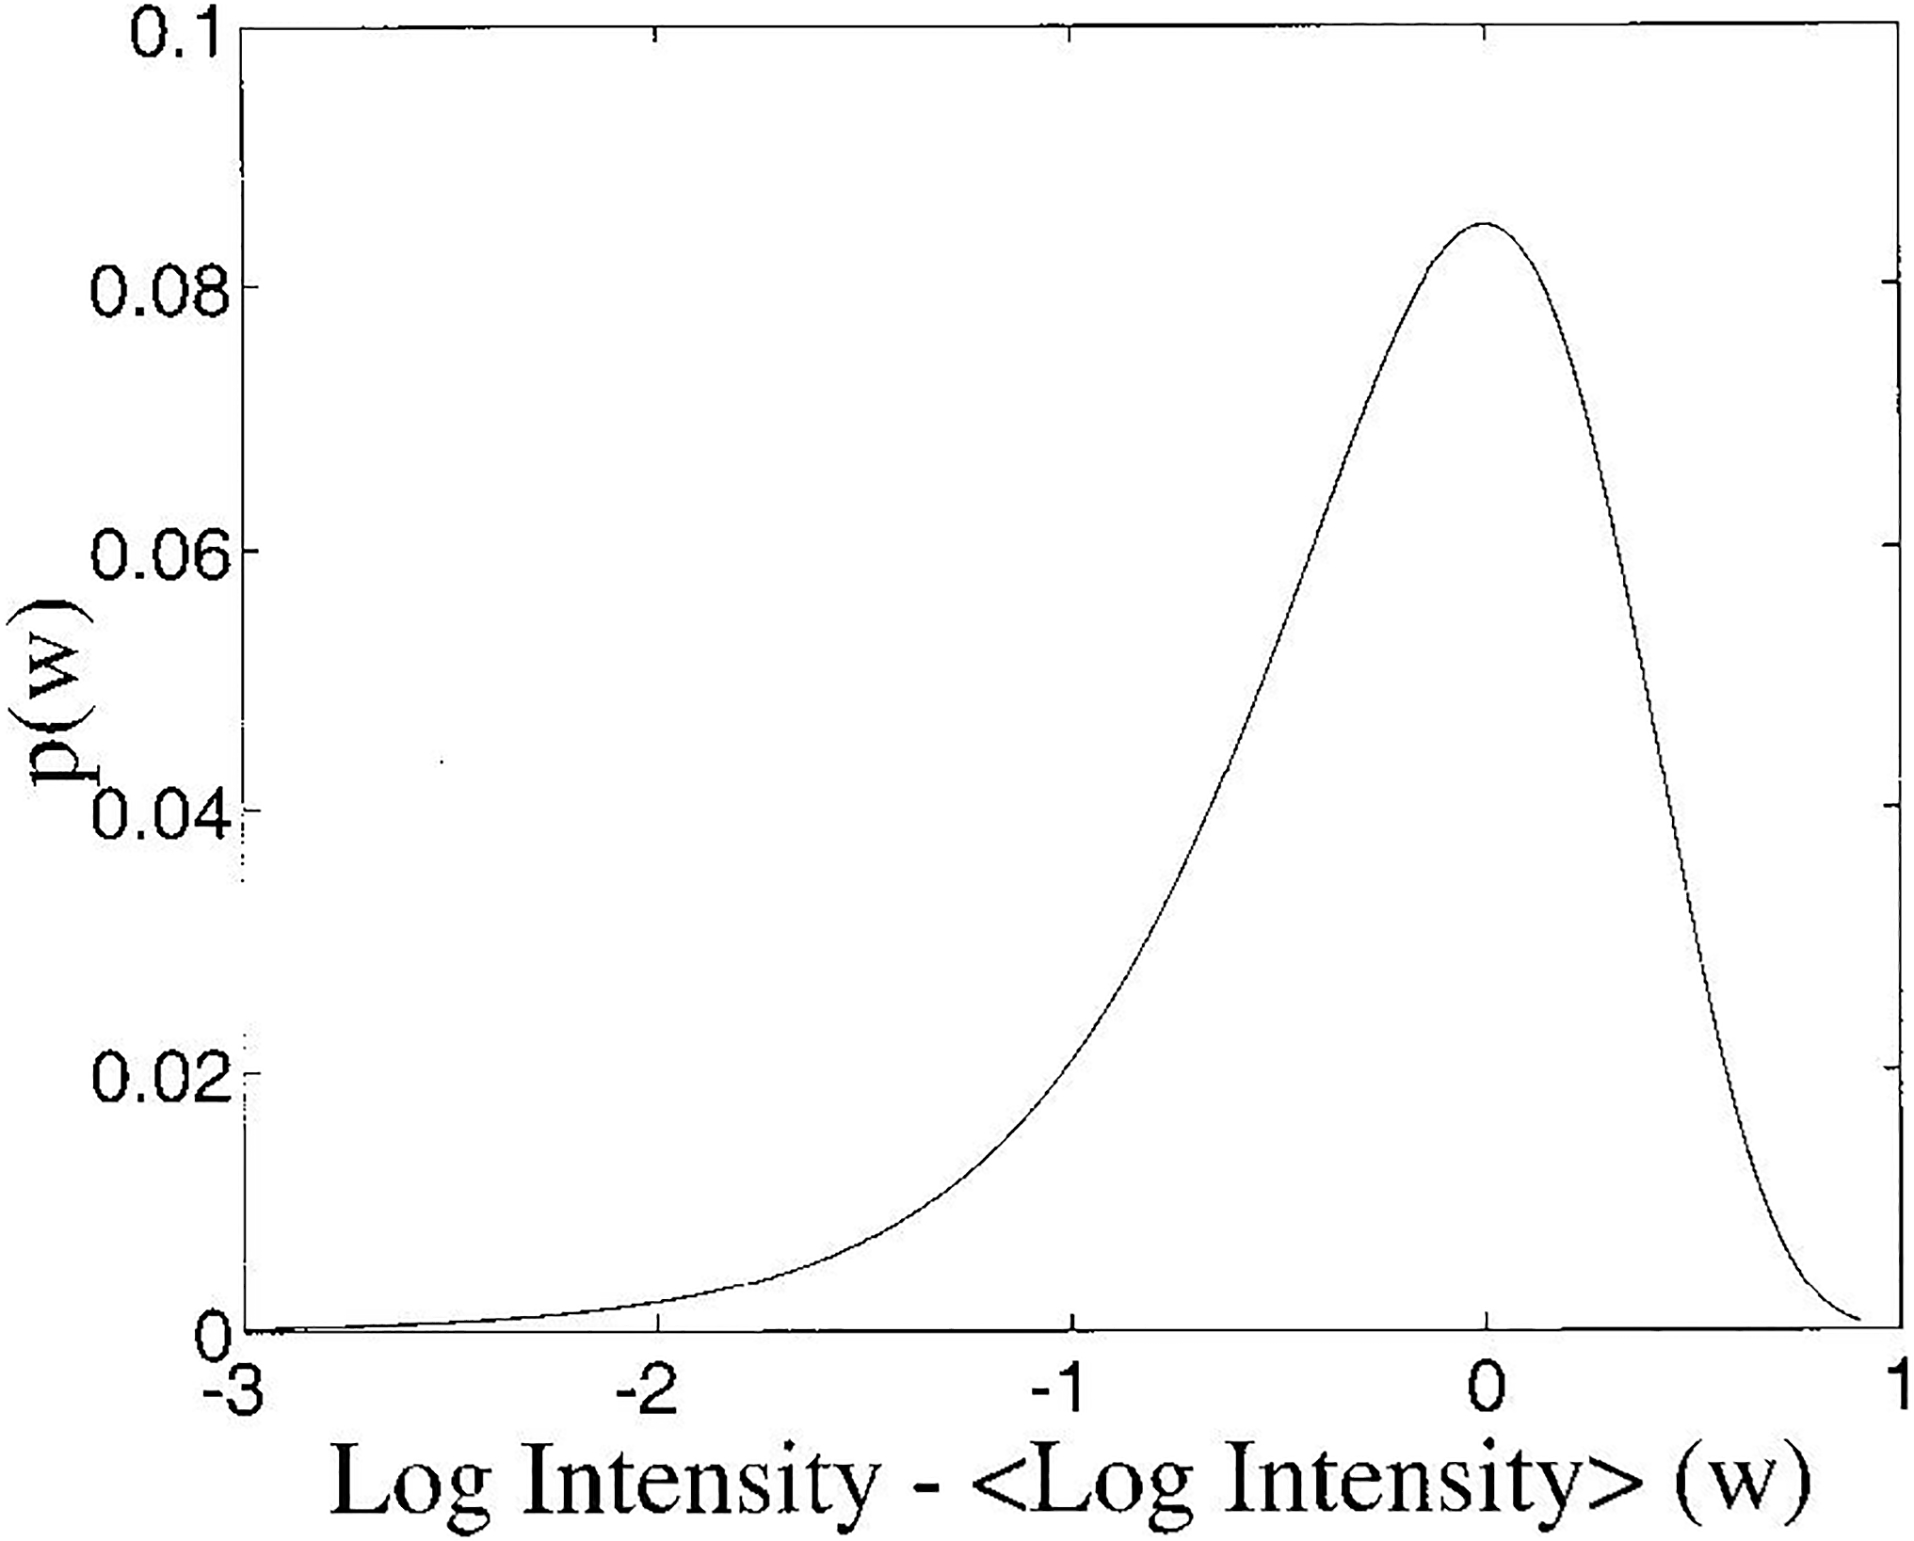
Probability density function for spectral intensity from a speckle-target. Angular brackets (< >) denote mean.
Backscatter coefficients may be measured using a reference phantom method (Zagzebski et al., 1993, Wear, 1999). A reference phantom with known frequency-dependent backscatter coefficient, ηR(f), and attenuation coefficient, αR(f), placed in the water tank at the same distance as for the bone samples is used. Power spectra from the bone samples, IB(f), and the phantom IR(f) are measured. The backscatter coefficient, ηB(f), is then obtained from
| (1) |
where T is the amplitude transmission coefficient at the water/bone interface. Due to the high degree of porosity of the samples, T may be assumed to be one (Droin et al., 1998) The function G[α(f), l] compensates for attenuation effects and is given by (O’Donnell and Miller, 1981)
| (2) |
where l is the gate length. The logarithm of the estimated backscatter coefficient is then
| (3) |
Assuming that the various measurements are uncorrelated with each other, the variance of the estimate of log ηB(f) is equal to the sum of the variances of the estimates of the five terms on the right side of Equation (3) (Bevington and Robinson, 1992, Equation 3.13). The backscattering and attenuation properties of the reference phantom are presumed to be known and have fixed values (zero variances). Therefore they do not contribute to the variance of the estimated log backscatter coefficient. Therefore,
| (4) |
where “Var” denotes “the variance of” and “^” denotes “the estimate of.” Typically, the first term, , contributes the most to . The reasons for this are as follows. IR(f) is usually known to much greater precision than IB(f) (and therefore has far lower variance) since well-designed reference phantoms are relatively homogeneous and big enough to enable much spatial averaging for the measurement of reference backscattered spectra. (See Ultrasonics Methods section below). The third term on the right side of Equation (4) is due to variance in attenuation estimates. Attenuation in bone samples is typically measured with a through-transmission method. Through-transmission signals have relatively high signal-to-noise ratios and are not plagued by the random interference effects that characterize speckle-like backscatter. So, for practical purposes,
| (5) |
The validity of Equation (5) is tested experimentally in this paper.
In this paper, backscatter coefficient η(f) is assumed to obey a power law dependence on frequency, f, so that η(f) = Afn. A linear fit of the form, y(x) = log A + nx is performed where y is the logarithm of the backscatter coefficient, x is the logarithm of frequency, log A is the intercept, and n is the slope (or power law exponent for the non-log transformed data). Note that, after log transformation, a constant value may be added or subtracted from each of the log frequency (x) data points so that the intercept corresponds to any particular frequency of interest (such as mid-band value or transducer center frequency) rather than zero frequency.
Bevington and Robinson give the following relations for the variances in estimates of linear-regression coefficients (Bevington and Robinson, 1992): σ2log A=(1/Δ)Σ(xi2/σi2) and σn2=(1/Δ)Σ(1/σi2) where
| (6) |
The variance of measurements of log spectral intensity (or log backscatter coefficient) at a frequency corresponding to xi is denoted by σi2. Conveniently, for speckle targets (as Lizzi et al. point out) σi is a constant equal to 0.56 (or 5.6 dB in the formulation of Lizzi et al.) for all frequencies in the usable band of the transducer. Interestingly, these results are applicable regardless of the frequency dependence of scattering. The power law exponent may be 3 (thin cylinders), 4 (small spheres) or any other physically realizable value.
Calcaneus Samples
Twenty-four human (gender and age unknown) calcaneus samples were obtained. They were defatted using a trichloro-ethylene solution. Defatting was presumed not to significantly affect measurements since attenuation (Langton et al., 1996; Alves et al., 1996) and speed of sound (Alves et al., 1996; Njeh and Langton, 1997) of defatted trabecular bone have been measured to be only slightly different from their counterparts with marrow left intact. The cortical lateral sides were sliced off leaving two parallel surfaces with direct access to trabecular bone. The thicknesses of the samples varied from 14 to 21 mm. In order to remove air bubbles, the samples were vacuum degassed underwater in a desiccator. After vacuum, samples were allowed to thermally equilibrate to room temperature prior to ultrasonic interrogation. Ultrasonic measurements were performed in distilled water at room temperature. The temperature was measured for each experiment and ranged between 19.1 °C and 21.2 °C. The relative orientation between the ultrasound beam and the calcanea was the same as with in vivo measurements performed with commercial bone sonometers, in which sound propagates in the mediolateral (or lateromedial) direction.
Ultrasonic Methods
A tissue-mimicking phantom (manufactured at the University of Wisconsin) was also scanned in order to validate the expressions for variance of estimates of magnitude and frequency dependence of backscatter. The phantom had an attenuation coefficient of 0.52 dB/cmMHz and a backscatter coefficient of 8.84 × 10⁻⁶ × f3.56 cm−1Sr−1.
A Panametrics (Waltham, MA) 5800 pulser/receiver was used. Samples were interrogated in a water tank using Panametrics broadband transducers with the following characteristics: 1 MHz center frequency, 1” diameter (d), 1.5” focal length (z) (for bone measurements) and 3.5 MHz, 0.75” diameter, 1.5” focal length (for phantom measurements). Received ultrasound signals were digitized (8 bit, 10 MHz) using a LeCroy (Chestnut Ridge, NY) 9310C Dual 400 MHz oscilloscope and stored on computer (via GPIB) for off-line analysis.
Radio-frequency (RF) echo signals from 10 lines within the test phantom were acquired. (The transducer was translated laterally between successive acquisitions). Twenty RF lines were acquired from a reference phantom. (Backscatter coefficients were computed from one test phantom RF line at a time using the average power spectrum, based on all 20 lines, from the reference phantom. This resulted in a 20:1 ratio of reference lines to test lines so that backscatter coefficient variance was dominated by the statistical properties of the test lines as discussed above). Six RF lines were acquired from each bone sample (compared with 32 lines from the reference phantom).
The number of independent measurements available from each bone sample was limited by the ratio of the calcaneal surface area to the beam cross section. In the middle of the usable bandwidth (0.8 MHz, see Data Analysis section), an estimate for the beam width (width of the main lobe of the Airy pattern, Goodman, 1968) is 2.44λz/d = 7 mm corresponding to a beam cross sectional area of 1.6 cm2. This estimate tends to be conservative (low) since the beam diverges beyond the focal plane due to diffraction and the distorting effects of propagating through inhomogeneous tissue. Spectra were estimated from the squared modulus of the Fast Fourier Transform (FFT). A Hamming window was applied prior to taking the FFT.
Backscatter coefficients were measured using a reference phantom method (Zagzebski et al., 1993; Wear, 1999) as discussed above. Attenuation measurements were required in order to compensate signals prior to backscatter coefficient estimation. Attenuation was measured using a standard through-transmission substitution method as previously described (Wear, 1999).
Data Analysis
A central band of frequencies (corresponding to the usable bandwidth) from the frequency-dependent backscatter coefficient data was used for analysis. For the phantom data acquired at 3.5 MHz, the band was 2.5 – 4.0 MHz. For the bone data acquired at 1.0 MHz, the band was 0.4 – 1.2 MHz. Over the selected band, the logarithm of the backscatter coefficient vs. logarithm of frequency data were least-squares fit to a straight line. The slope of the fit (n) of the log transformed data corresponded to the exponent of the power law fit of backscatter coefficient, η(f) = Afn. The parameters of the fit (A, n) were also used to estimate the logarithm of the backscatter coefficient at the transducer center frequency, m = log(Af0n) where f0 was 3.5 MHz (phantom) or 1.0 MHz (bone).
For the phantom data, precision of estimates of log magnitude (m) and frequency dependence (n) as functions of gate length were investigated. Gate length (L) is determined by gate duration (T) according to L=cT/2 for reflection mode where c = speed of sound. Gate duration determines resolution in the frequency domain, Δf = 1/T for rectangular window and Δf = 1.33/T for Hamming window (Lizzi et al., 1997). The frequency resolution determines the number of independent samples in the least squares fit, N = B/Δf where B is the analysis bandwidth.
Each of the 10 RF lines acquired from the phantom was partitioned along its length into q equal segments for q = 1, 2, 3, 4, 5, 6, 8, 10, and 12. This yielded nine data sets, each one containing 10q RF segments of length 1.8/q cm and duration 23.4/q microsec. Spectral and regression analysis were applied to yield estimates of m and n for each segment. The means (μm and μn) and the standard deviations (σm and σn) of m and n were computed for each segment length. The variances of the estimates of σm and σn were computed using the bootstrap method (Efron, 1993). The bootstrap technique entails multiple resampling (with replacement) from the acquired data in order to generate a distribution of a parameter (such as σm and σn), from which statistics such as means and variances may be derived.
For the bone data, precision of estimates as functions of analysis bandwidth was explored. The usable band of frequencies was 0.4 MHz to 1.2 MHz. Using a lower limit of 0.4 MHz, the upper limit was varied from 0.5 MHz to 1.2 MHz in increments of 0.1 MHz with spectral and regression analysis applied for each frequency band. As the bandwidth was increased, the number of independent samples used (N = B/Δf) also increased, thus reducing variabilities of estimated parameters.
Results
The variation of σm (precision of estimate of log magnitude) with gate length for the phantom is shown in Figure 2. Though the dependences on gate length are similar, the theory (solid line) tends to underestimate the observed variance (asterisks) somewhat. This is probably due to sources of variance not incorporated into the model, such as the two right-most terms in Equation (4) and/or some degree of spatial inhomogeneity in the phantom.
Figure 2.
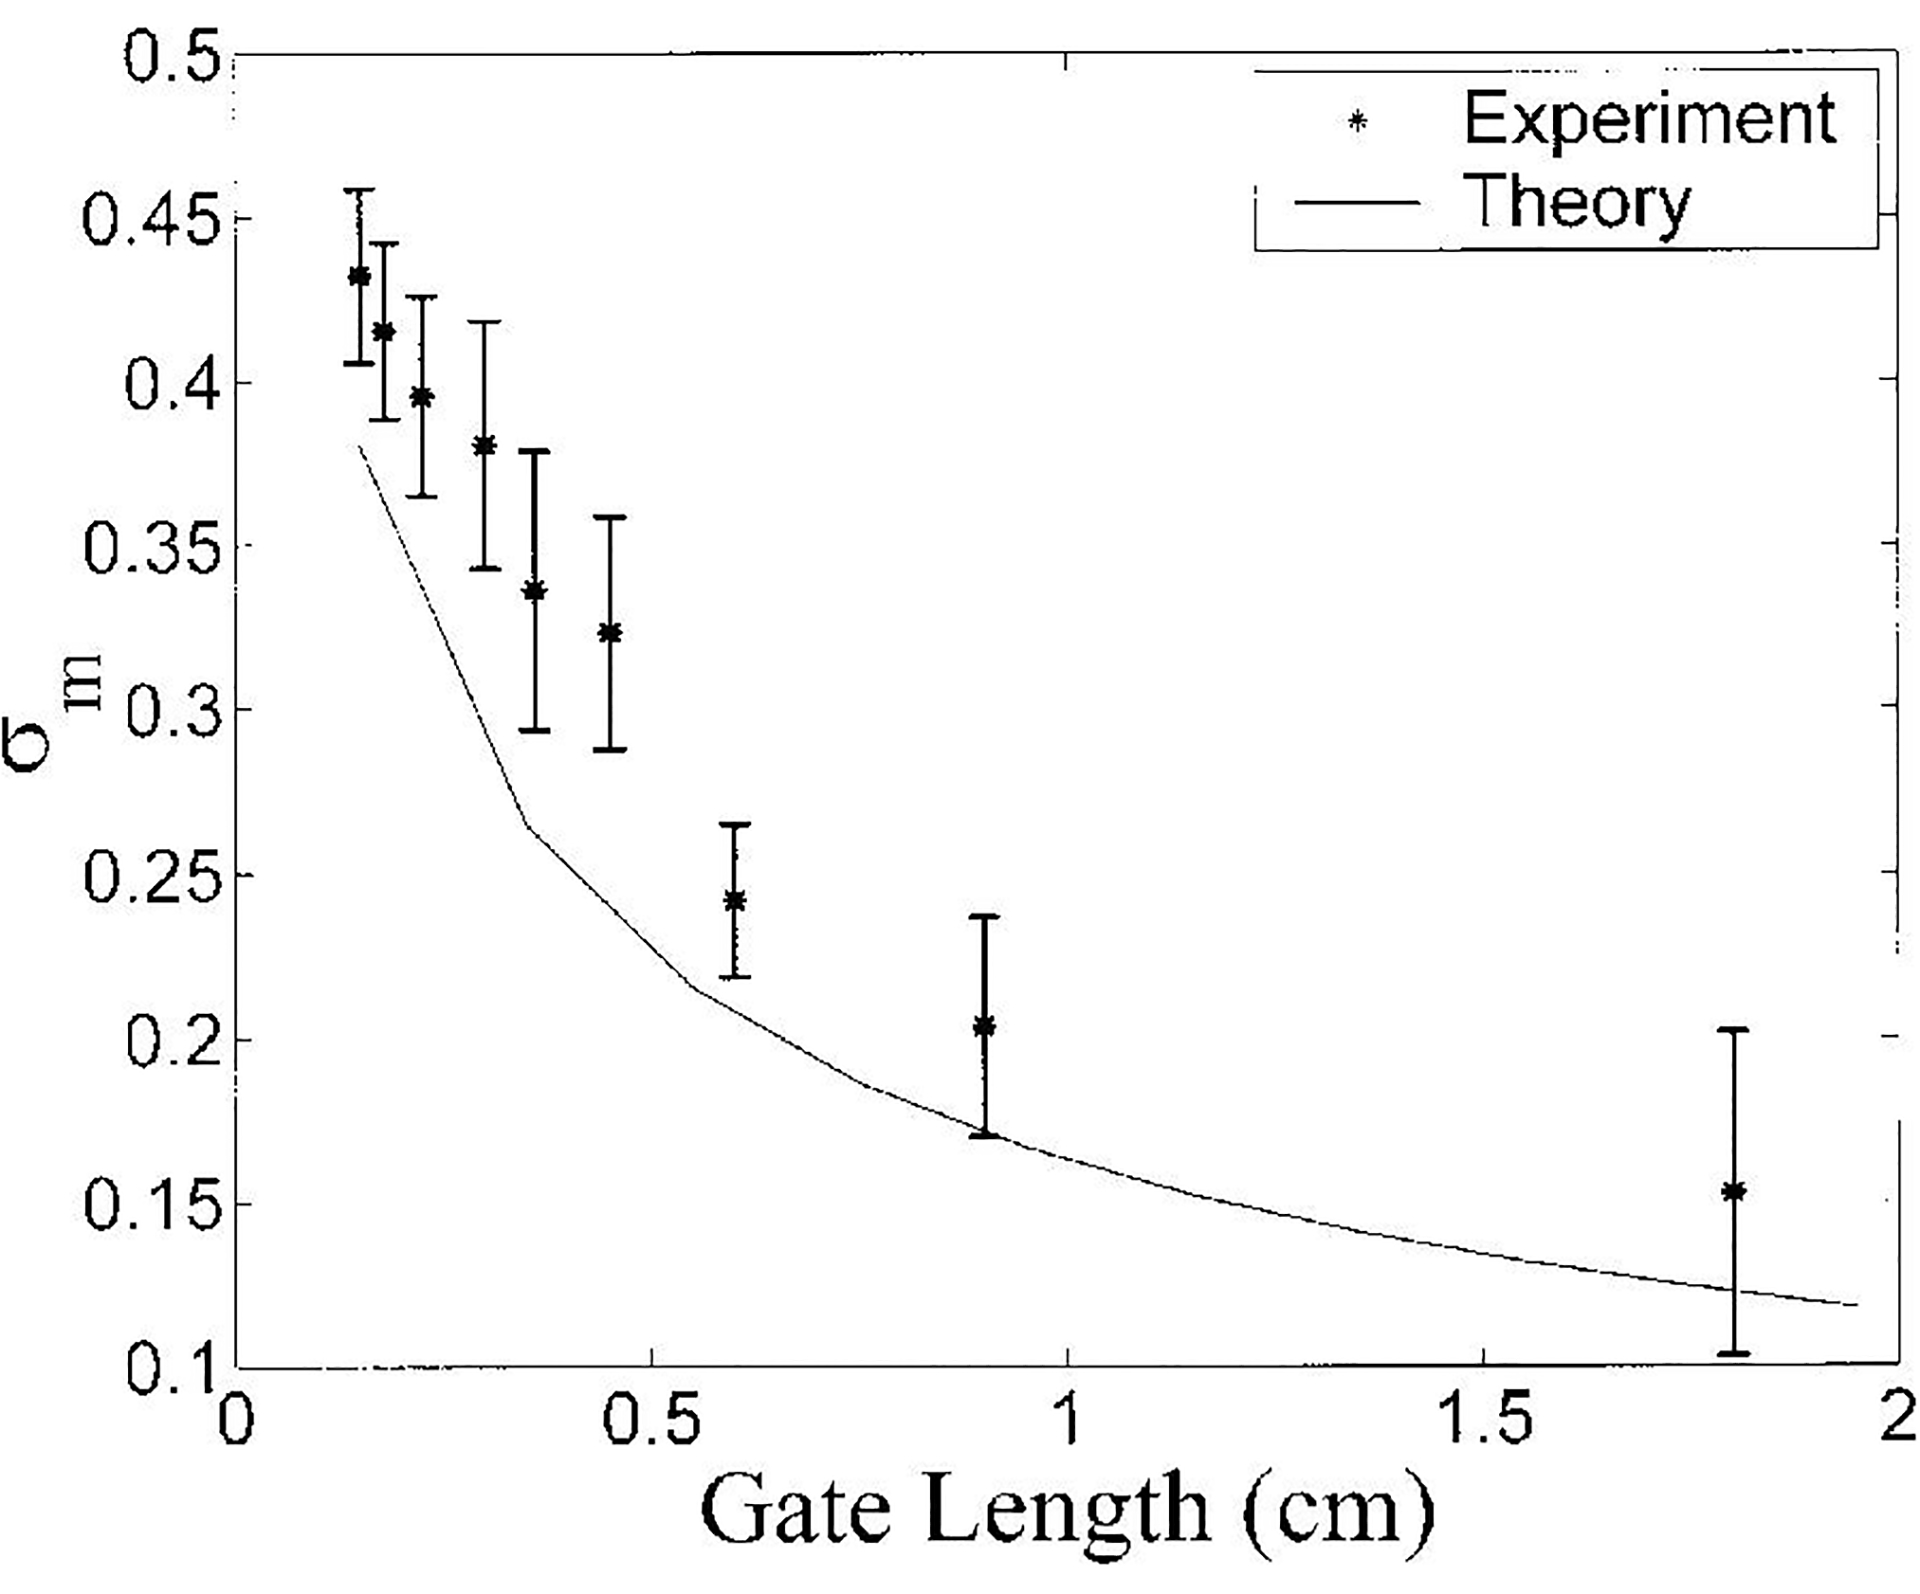
Variation of σm with gate length for the phantom. Both theory (solid line) and experimental data (asterisks) are shown. Error bars denote standard deviations.
The variation of σn (precision of estimate of frequency dependence) with gate length for the phantom is illustrated in Figure 3. There is excellent agreement between theory (solid line) and experimental data (asterisks), somewhat better than that seen in Figure 2. This may be due to the fact that spatial variations in scatterer concentration would be expected to contribute additional variance in the magnitude of backscatter (Figure 2) but not in the frequency dependence (Figure 3). The frequency dependence of backscatter depends on scatterer size but not concentration provided that multiple scattering and coherent scattering are not big effects.
Figure 3.
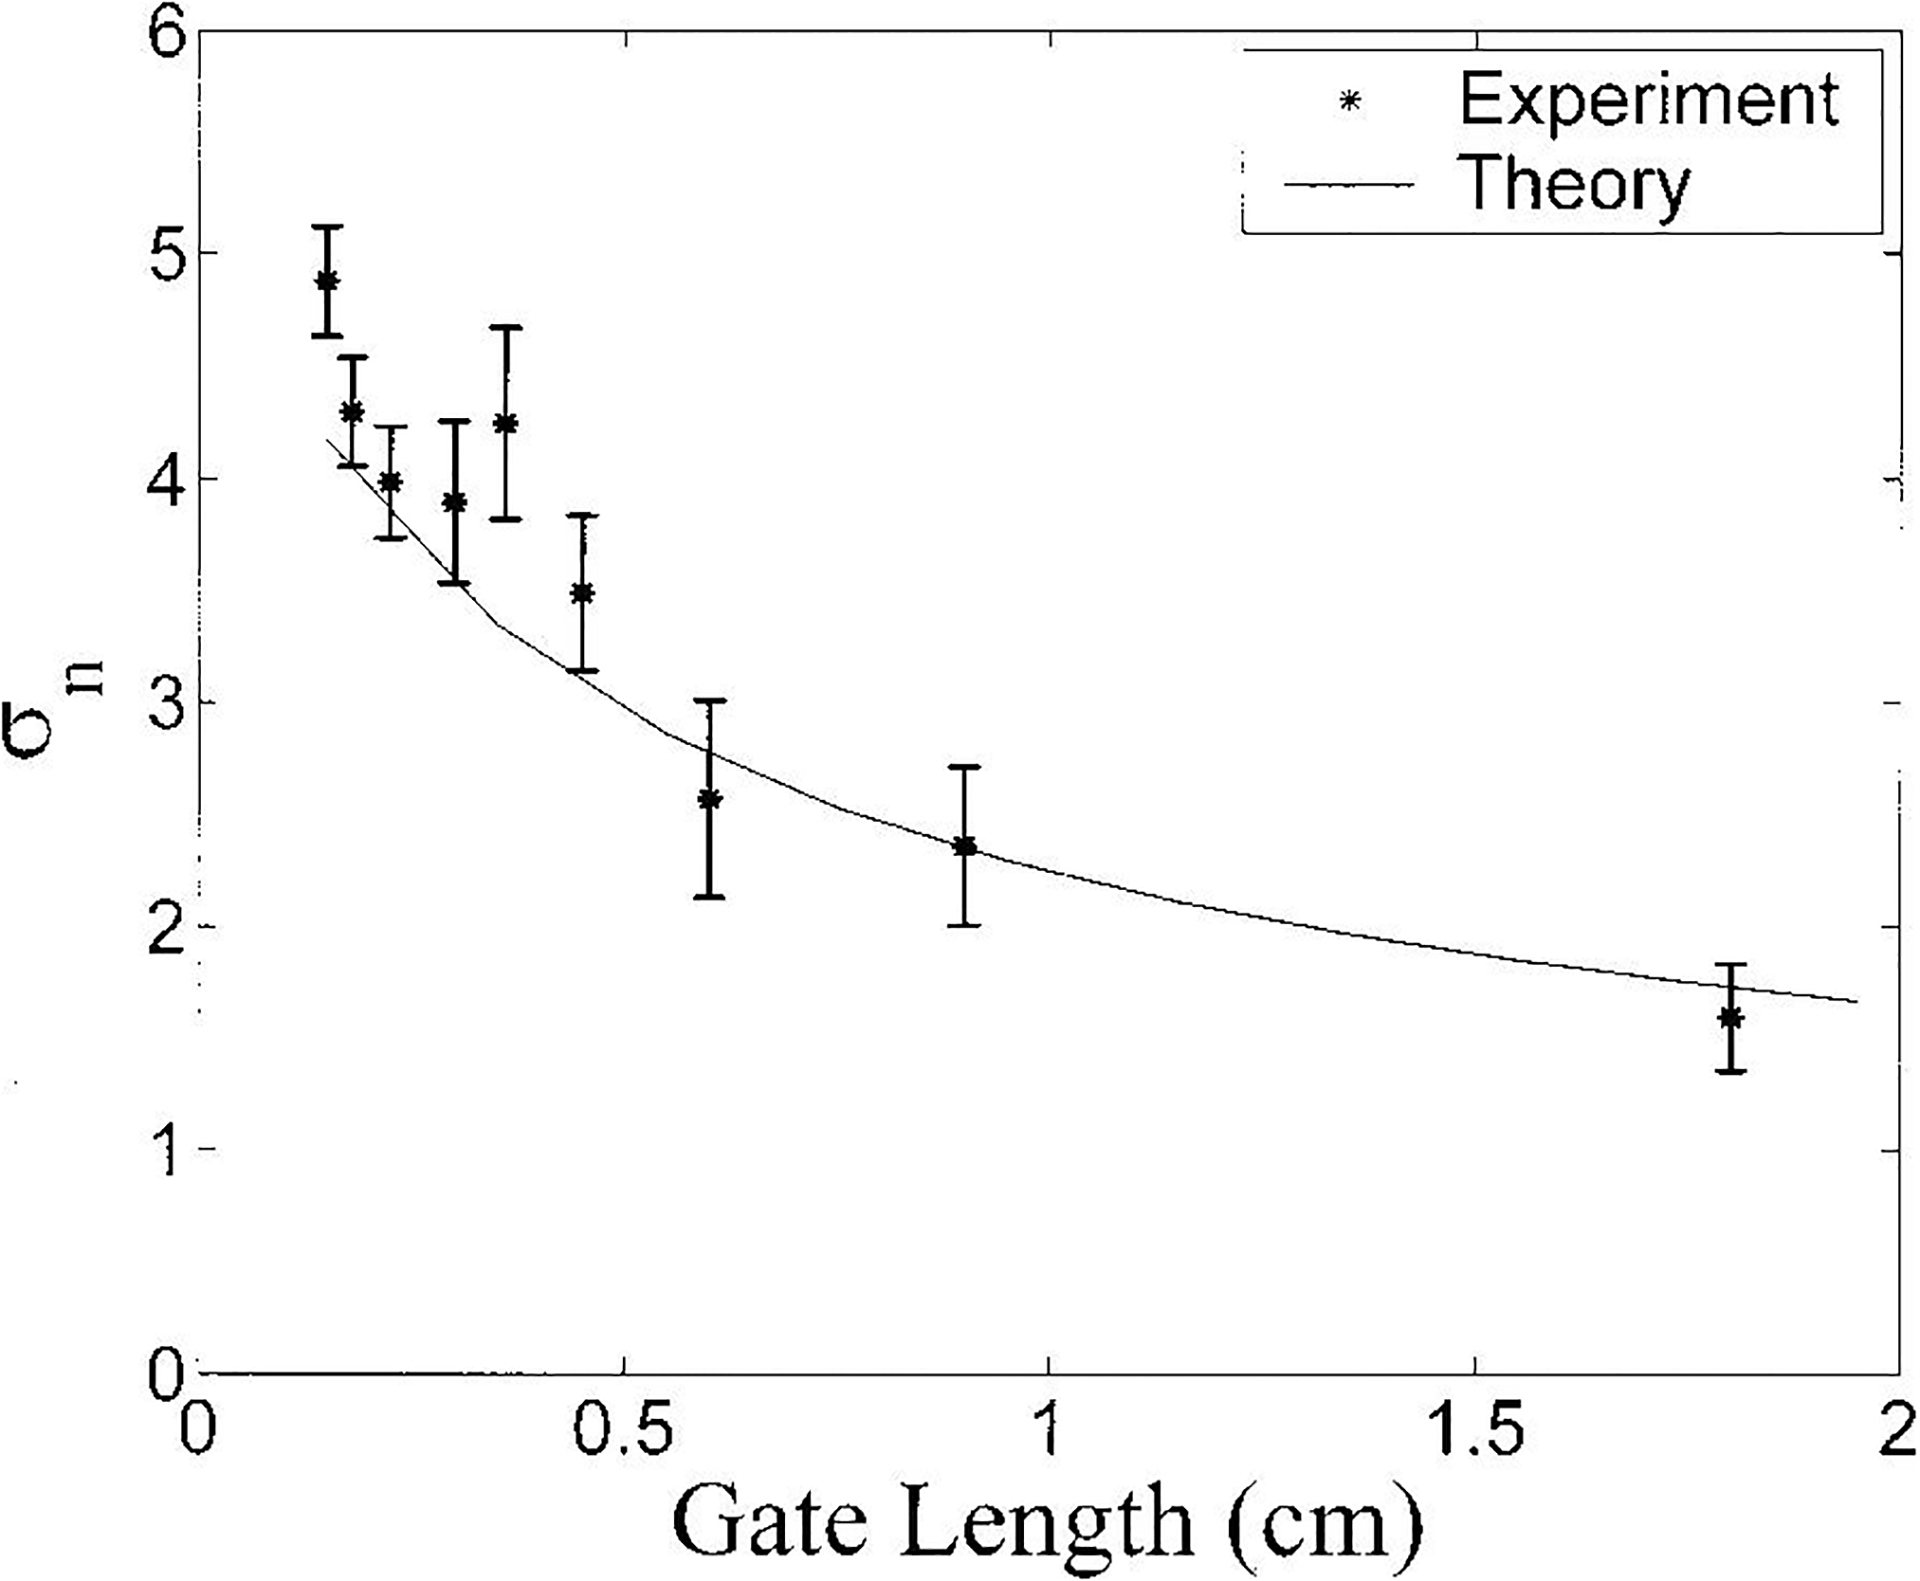
Variation of σn with gate length for the phantom. Both theory (solid line) and experimental data (asterisks) are shown. Error bars denote standard deviations.
The variation of σm with upper frequency band limitation for the bone samples is depicted in Figure 4. While the theory and experimental data exhibit similar dependences on the upper frequency limit for analysis, the theory tends to underestimate the observations. This could again be attributable to increased variance due to the two right-most terms in Equation (4) and/or biological variations in scatterer (trabecular) concentration and size. This possibility will be explored in the next section.
Figure 4.
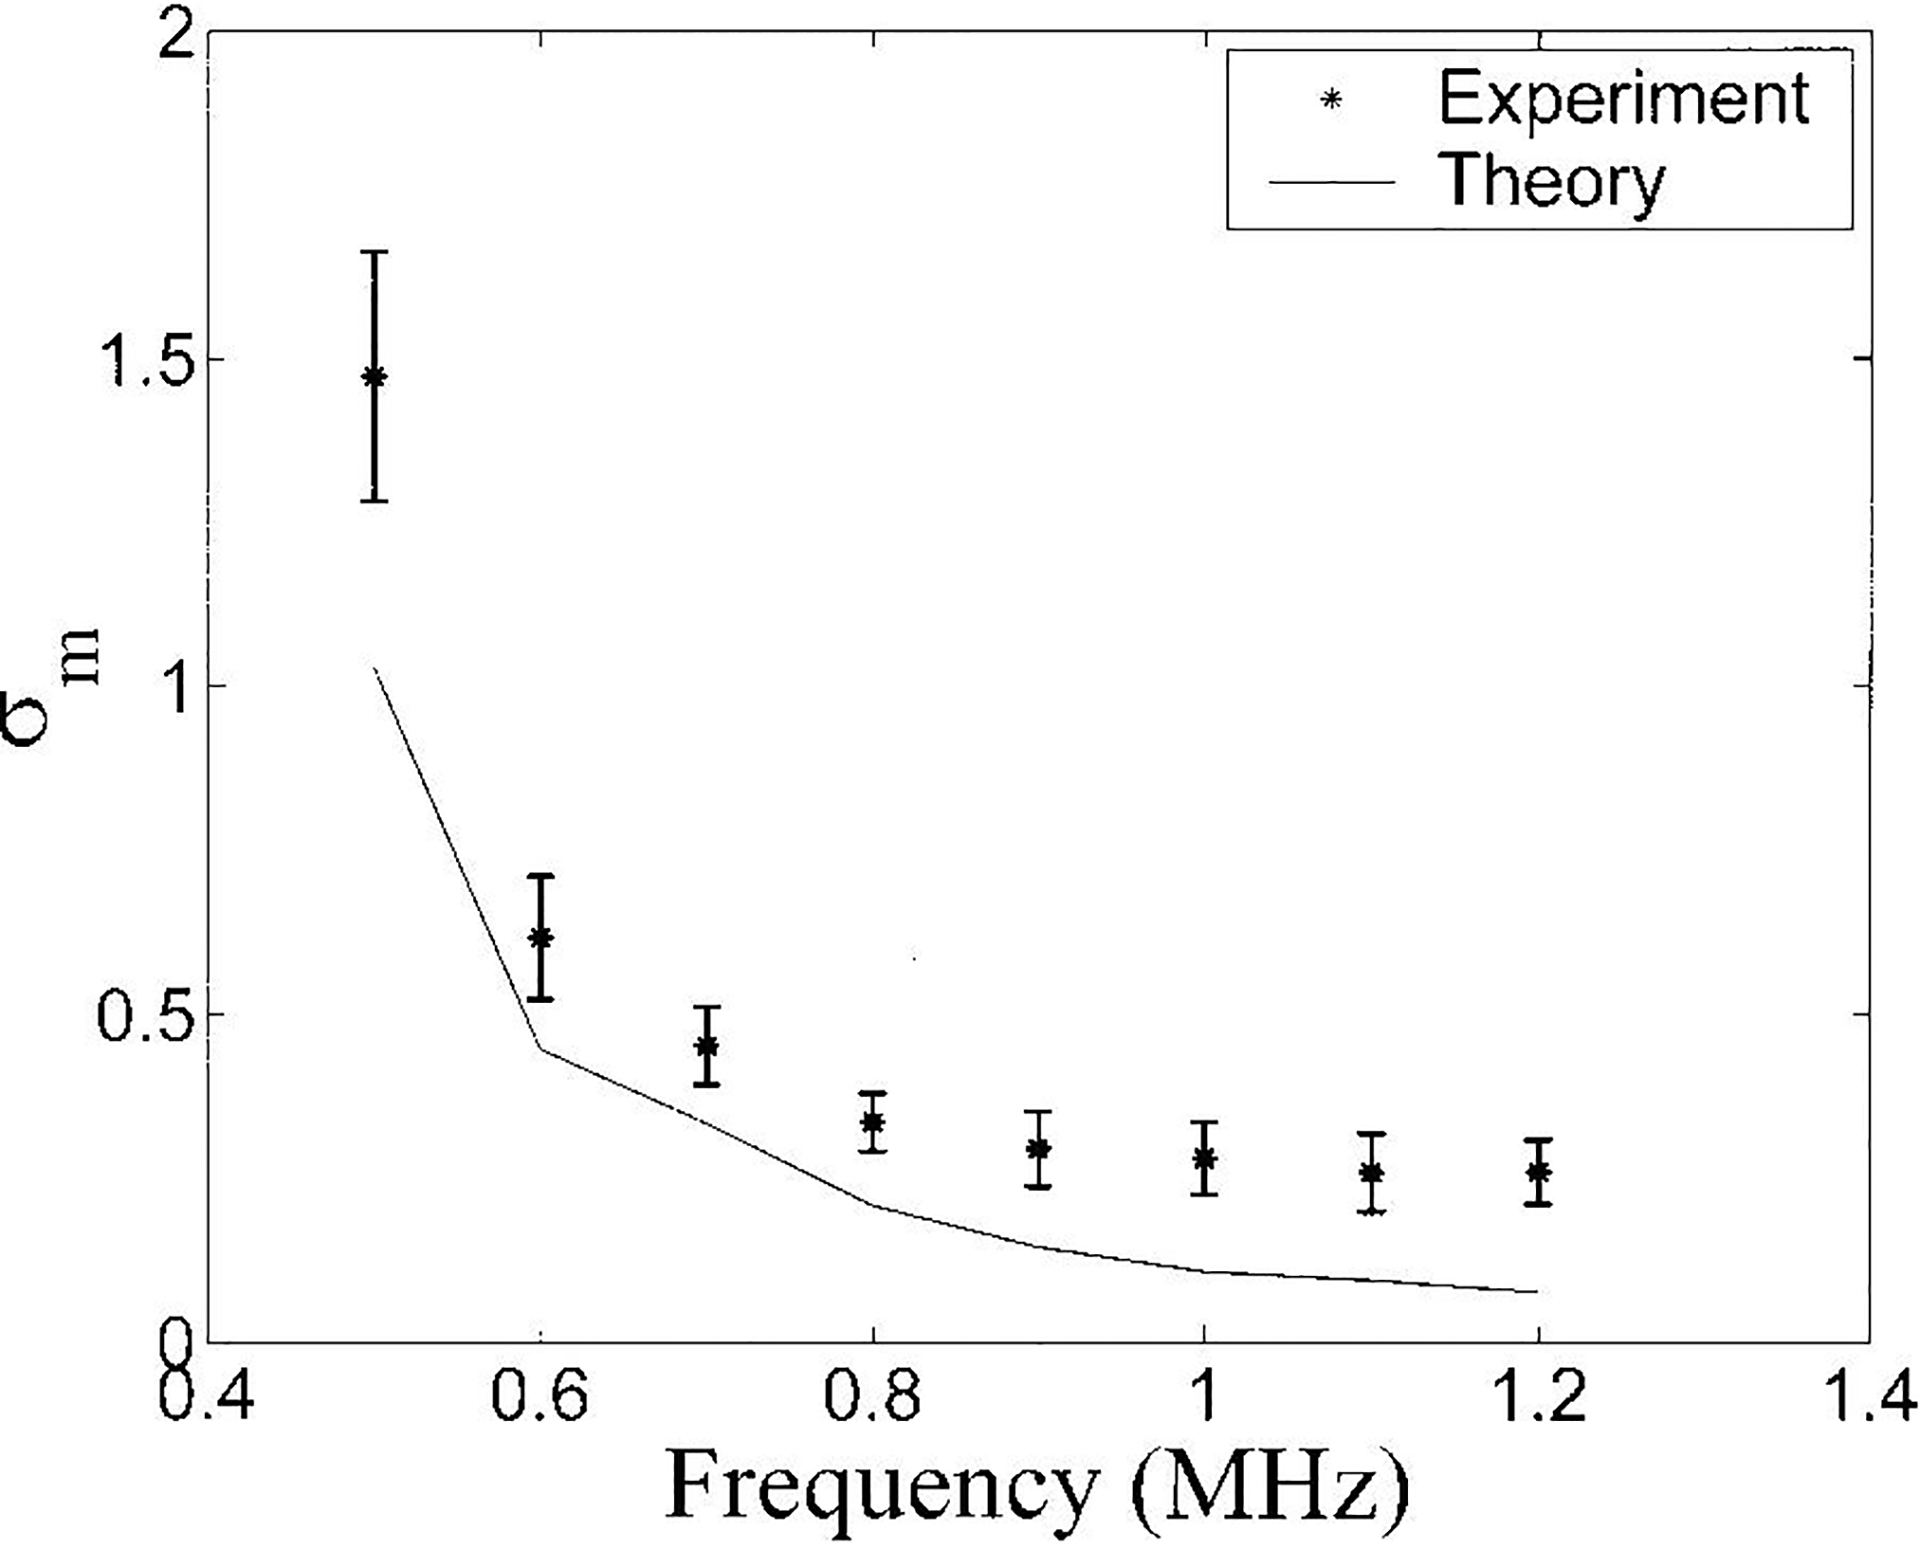
Variation of σm with gate length for the bone samples. . Both theory (solid line) and experimental data (asterisks) are shown. Error bars denote standard deviations.
The variation of σn with upper frequency band limitation for the bone samples is shown in Figure 5. As with the phantom, there is excellent agreement between theory and experiment. In this case, virtually all of the observed variance is predicted by the fundamental precision limitation of the measurement method.
Figure 5.
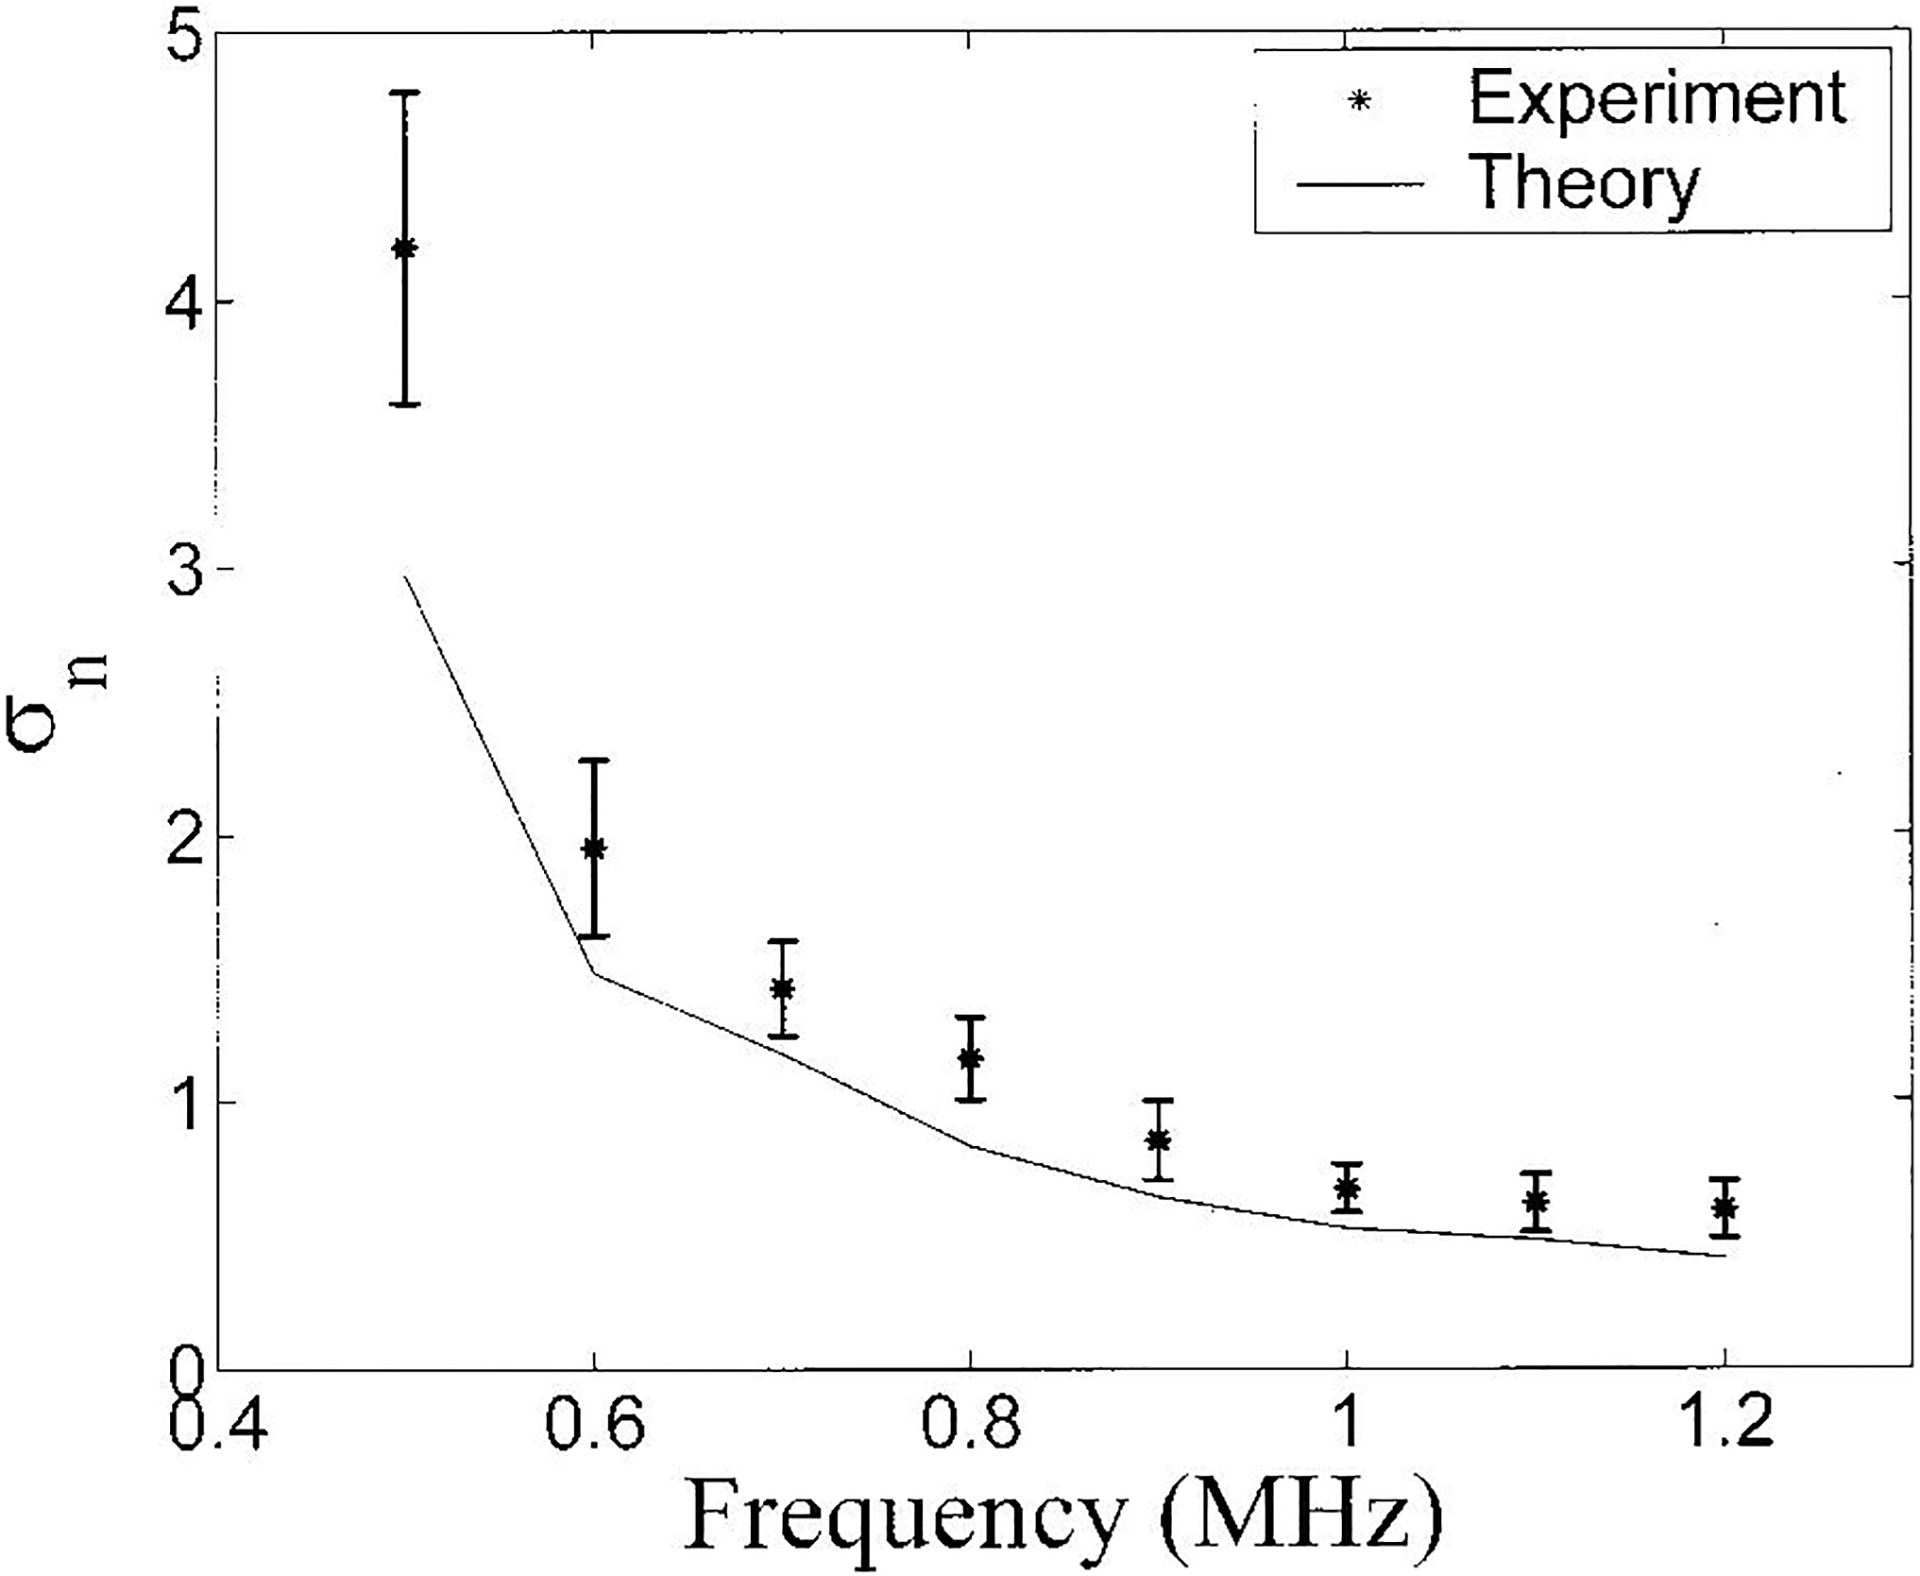
Variation of σn with gate length for the bone samples is shown in Figure 4. . Both theory (solid line) and experimental data (asterisks) are shown. Error bars denote standard deviations.
Discussion
The results presented above suggest that the statistical considerations explored here are powerful for predicting virtually all observed variations in frequency dependence of backscatter. The statistical model tends to underestimate observed variations in magnitude of backscatter however. Qualitatively, the co-existence of these two results can be explained in terms of scattering targets (e.g. phantom or trabecular bone) that have the following properties: (1) many scatterers per resolution cell, (2) scatterers with similar frequency dependences of differential scattering cross section (e.g. n=3 for thin cylinders, n=4 for small spheres, or any other physically realizable value for n), (3) scatterers potentially exhibiting a range of variation of differential scattering cross section magnitudes, and (4) spatial or biological variations in scatterer concentration. In this Discussion section, these ideas will be elaborated quantitatively.
In Figure 6, predicted backscatter coefficients for three trabecular thicknesses (with constant scatterer concentration), as functions of frequency, assuming a cylinder scatterer model (Wear, 1999) are shown. The three values correspond to the mean ± two standard deviation reported for human calcaneal trabecular thickness (Ulrich et al., 1999). It may be seen that throughout this four standard deviation variation in trabecular thickness, the magnitude of backscatter coefficient varies considerably while the frequency dependence of backscatter remains roughly constant.
Figure 6.
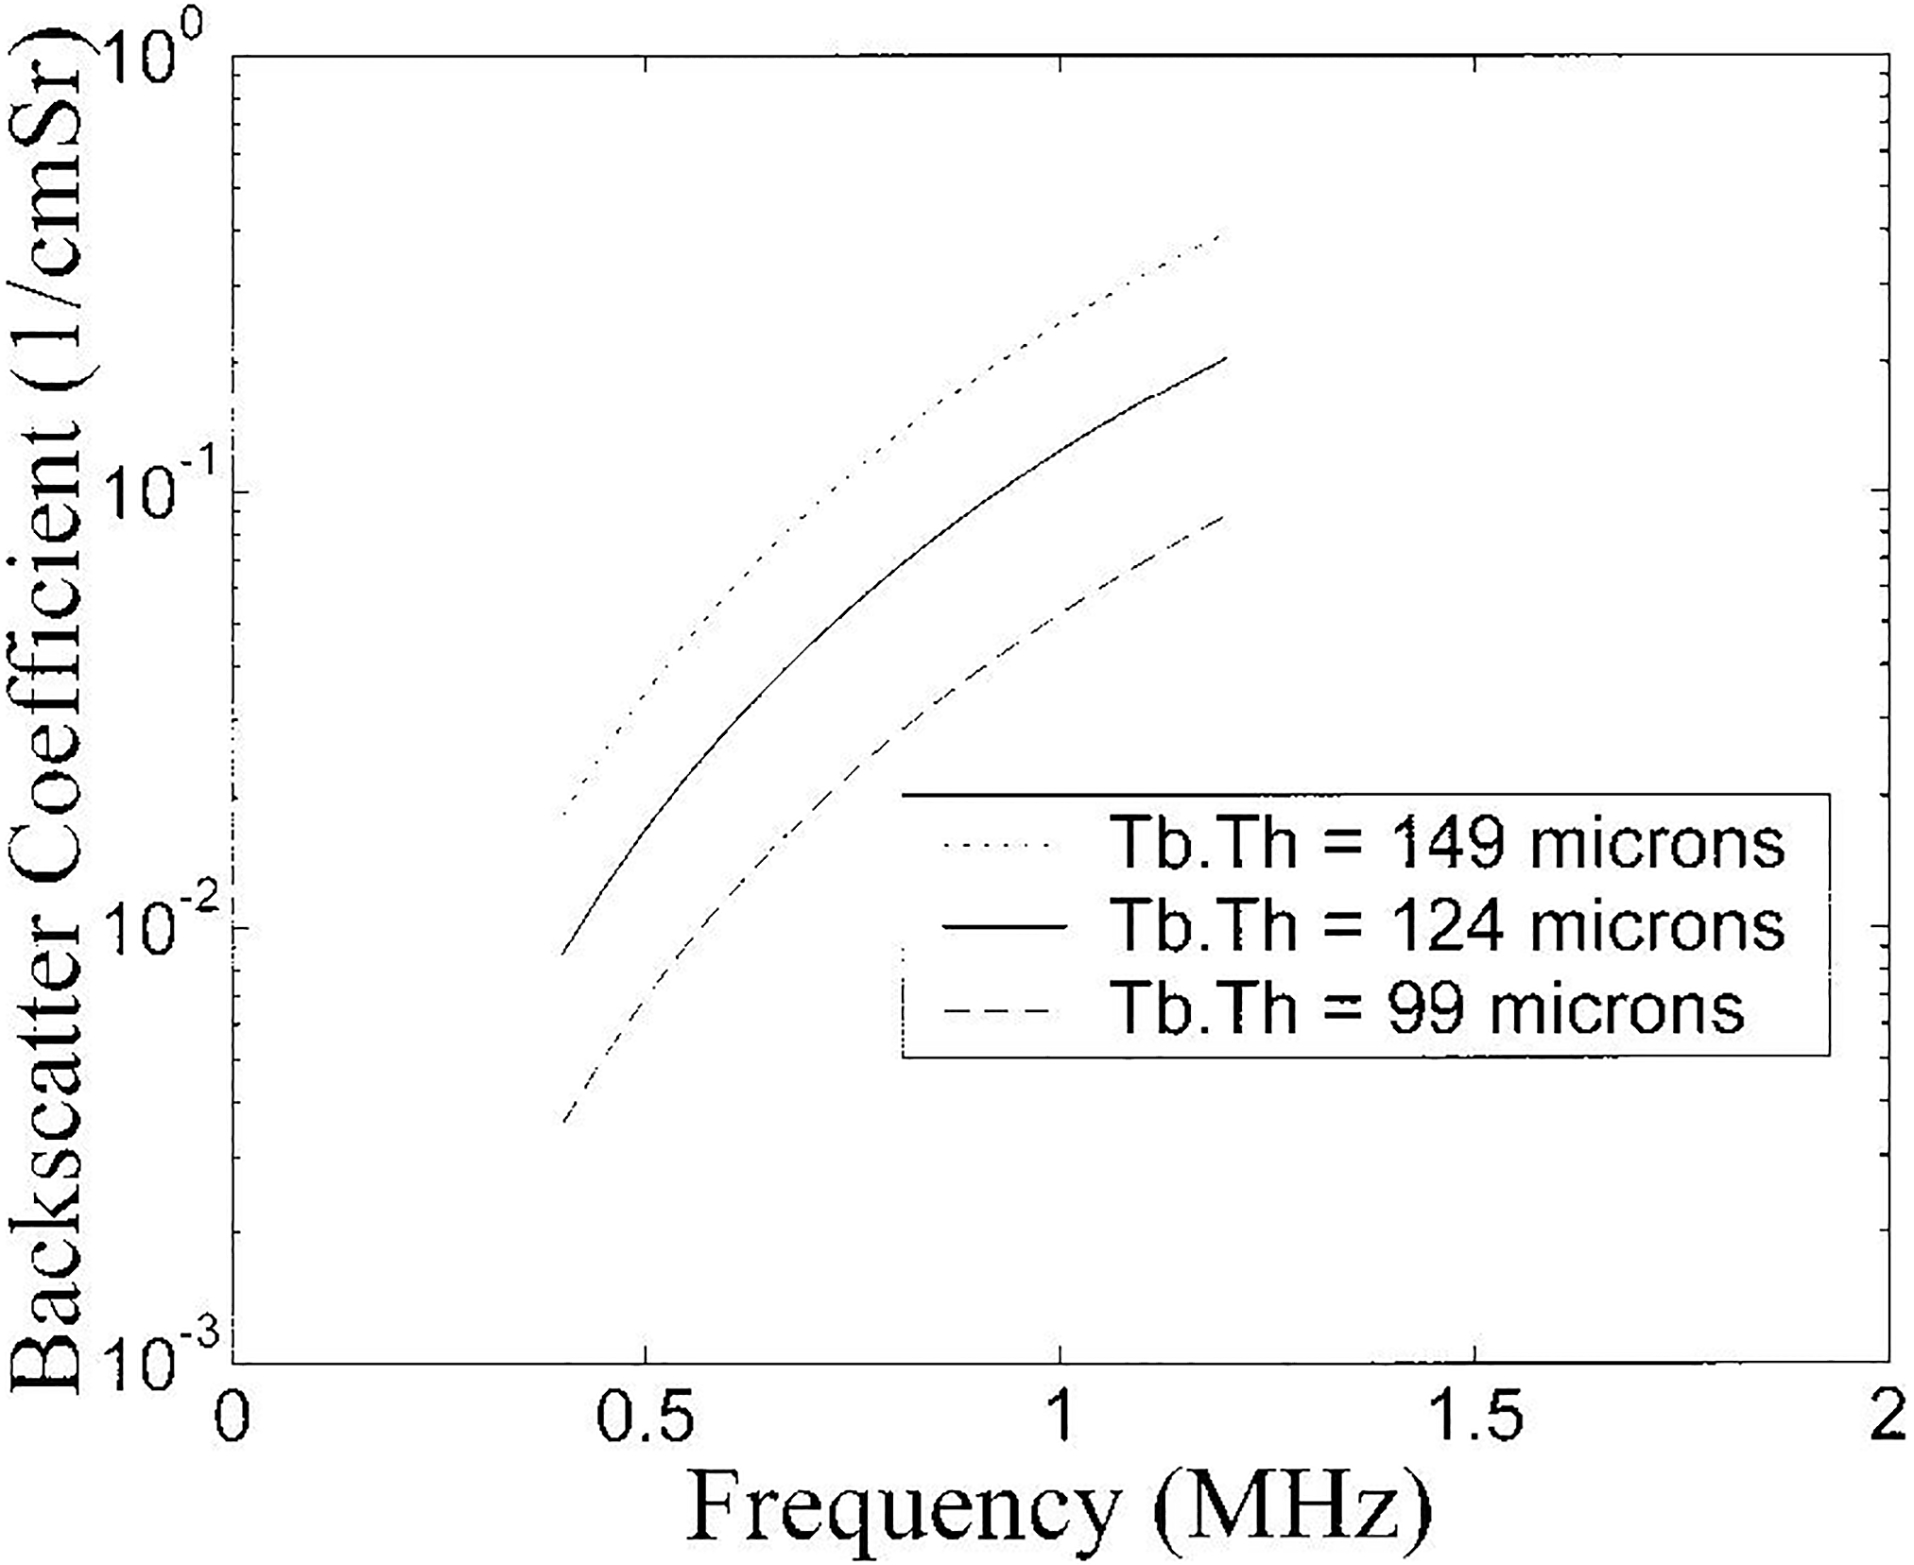
Frequency dependent backscatter coefficient for three different mean trabecular thicknesses (93, 127, and 161 microns). The three values correspond to the mean ± two standard deviations reported for human calcaneal trabecular thickness (Ulrich et al., 1999).
In Figure 7, the variation of backscatter coefficient at 1.0 MHz with trabecular thickness over a range of trabecular thicknessess corresponding to the mean ± two standard deviations reported for human calcaneal trabecular thickness (Ulrich et al., 1999) is illustrated. Over this range, the backscatter coefficient varies by about a factor of five. A change of one standard deviation in trabecular thickness would correspond to a change of (log 5) / 4 = 0.17 in log magnitude. An effect of this magnitude is sufficient to approximately account for the discrepancy between the statistically predicted and empirical variations shown in Figure 4.
Figure 7.
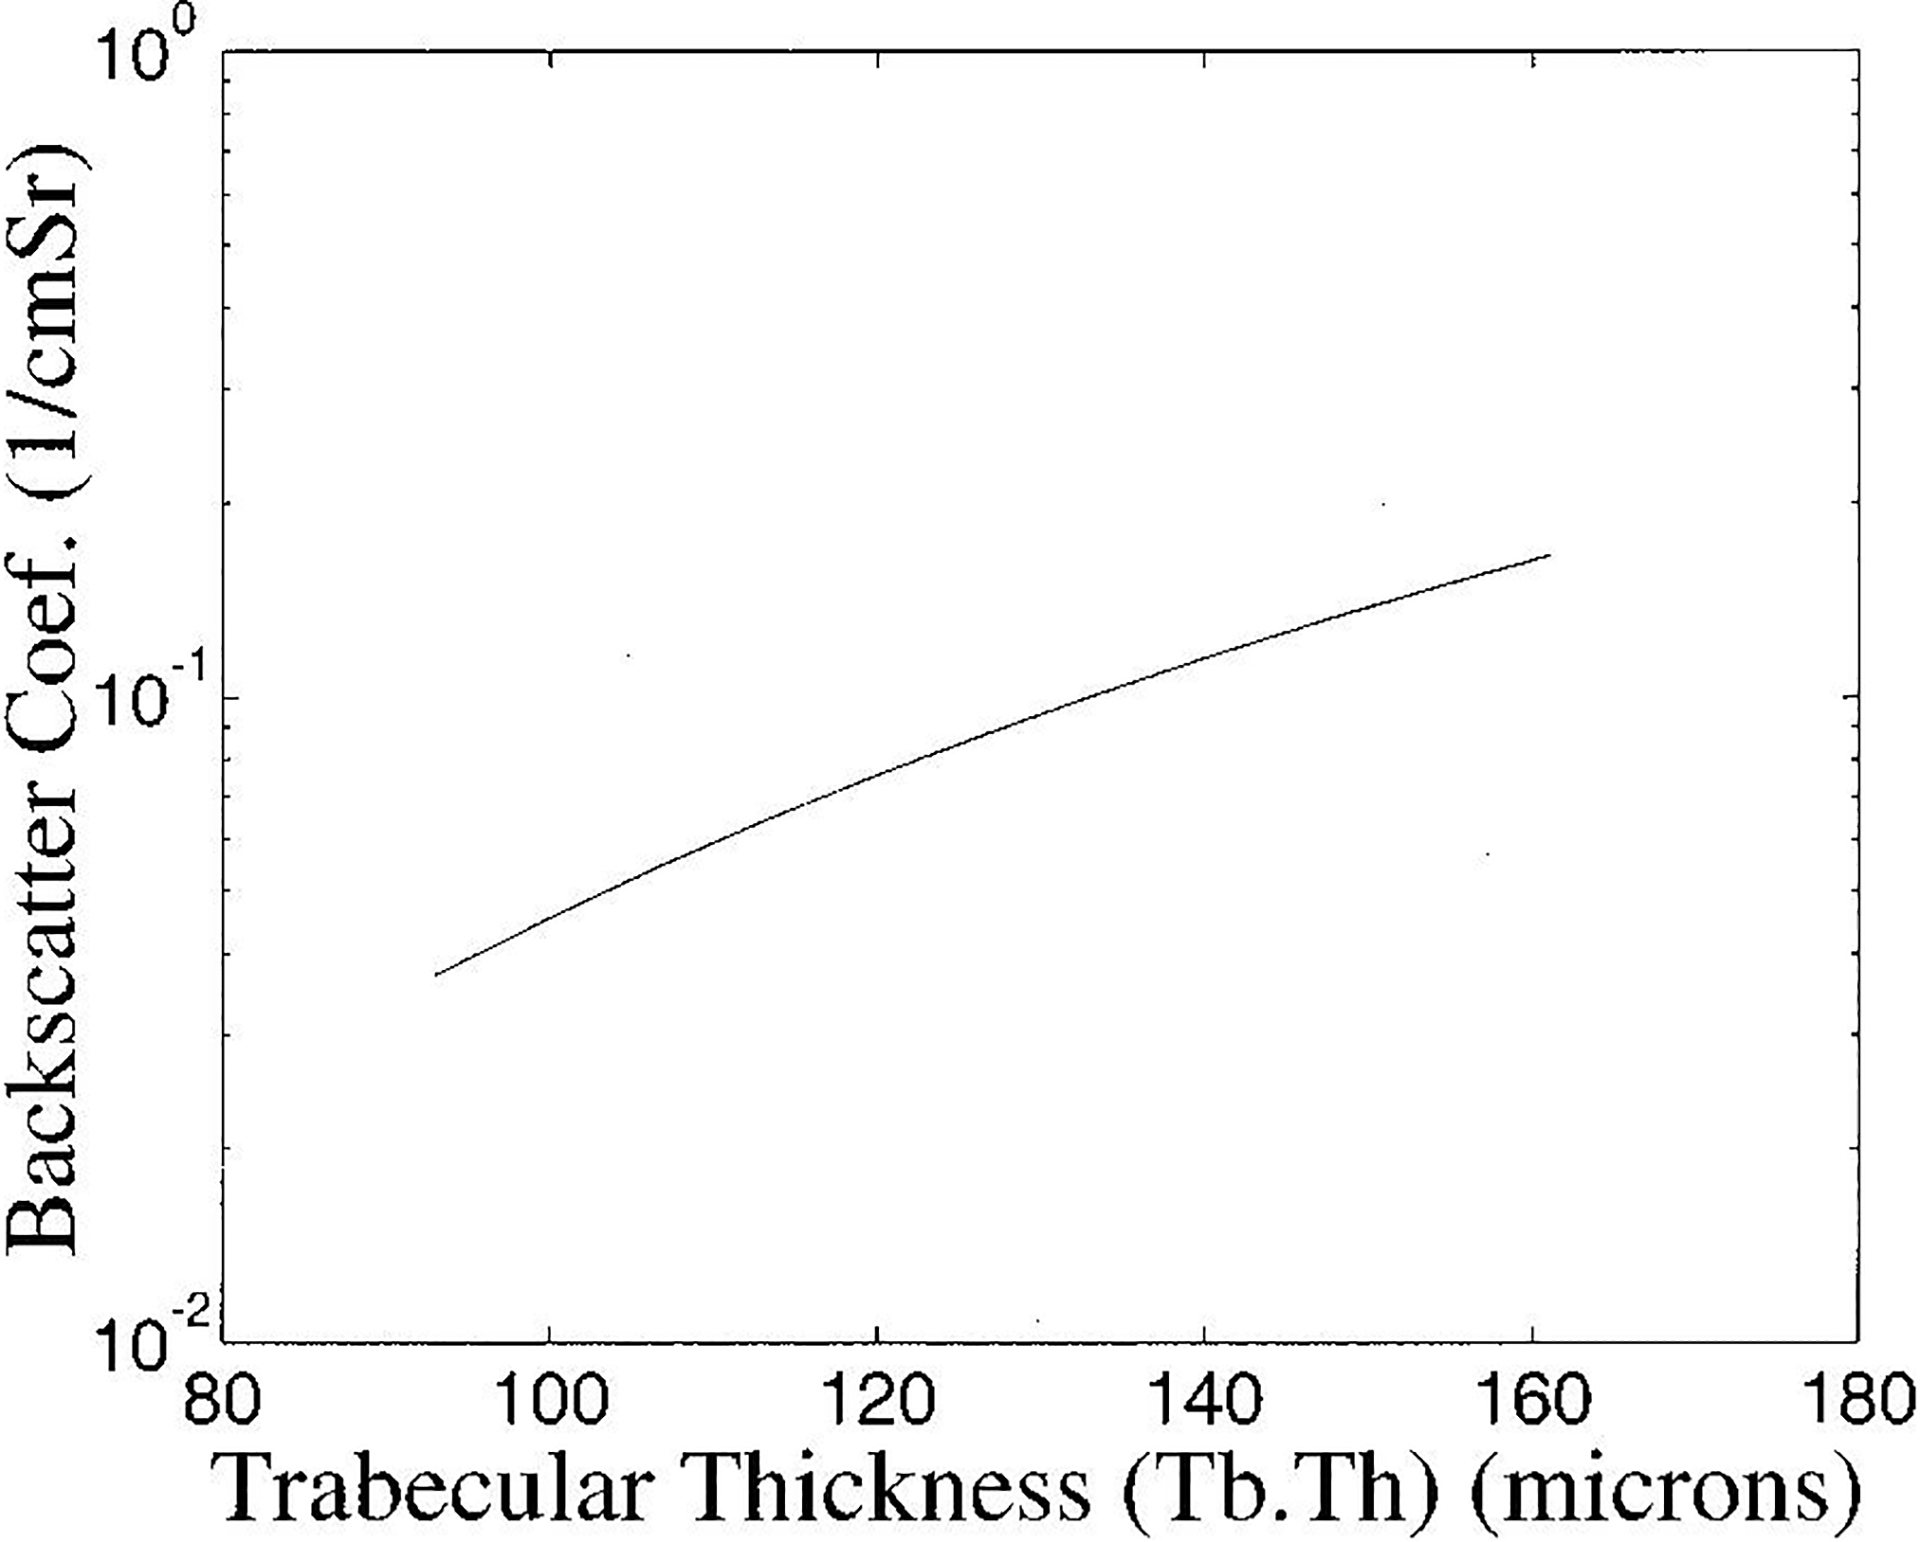
Backscatter coefficient at 1.0 MHz as a function of trabecular thickness. The range of trabecular thicknessess shown corresponds to the mean ± two standard deviations reported for human calcaneal trabecular thickness (Ulrich et al., 1999).
Moreover, variations in scatterer concentration may contribute to additional variations in backscatter coefficient. Measurements of means and standard deviations of mean trabecular spacing in human calcaneus have been reported to be 630 ± 110 microns (Hausler et al., 1999) and 684 ± 109 microns (Ulrich et al., 1999) corresponding to a coefficient of variation (CVTb.Sp) of 16–17%. This would lead to a coefficient of variation for scatterer concentration or backscatter coefficient, CVconc. = (1 + CVTb.Sp)−2 − 1 = 26–27% or 0.13 – 14 variation in the logarithm of the backscatter coefficient.
In Figure 8, the variation of n with trabecular thickness over a range of trabecular thicknessess corresponding to the mean ± two standard deviations reported for human calcaneal trabecular thickness (Ulrich et al., 1999) is shown. The variation is quite small, ranging from 2.91 (at 93 microns) to 2.75 (at 161 microns). This range corresponds roughly to a standard deviation of 0.16/4 = 0.04 and is small relative to the precision of the measurement, predicted here to be 0.41 and measured to be 0.60 ± 0.08.
Figure 8.
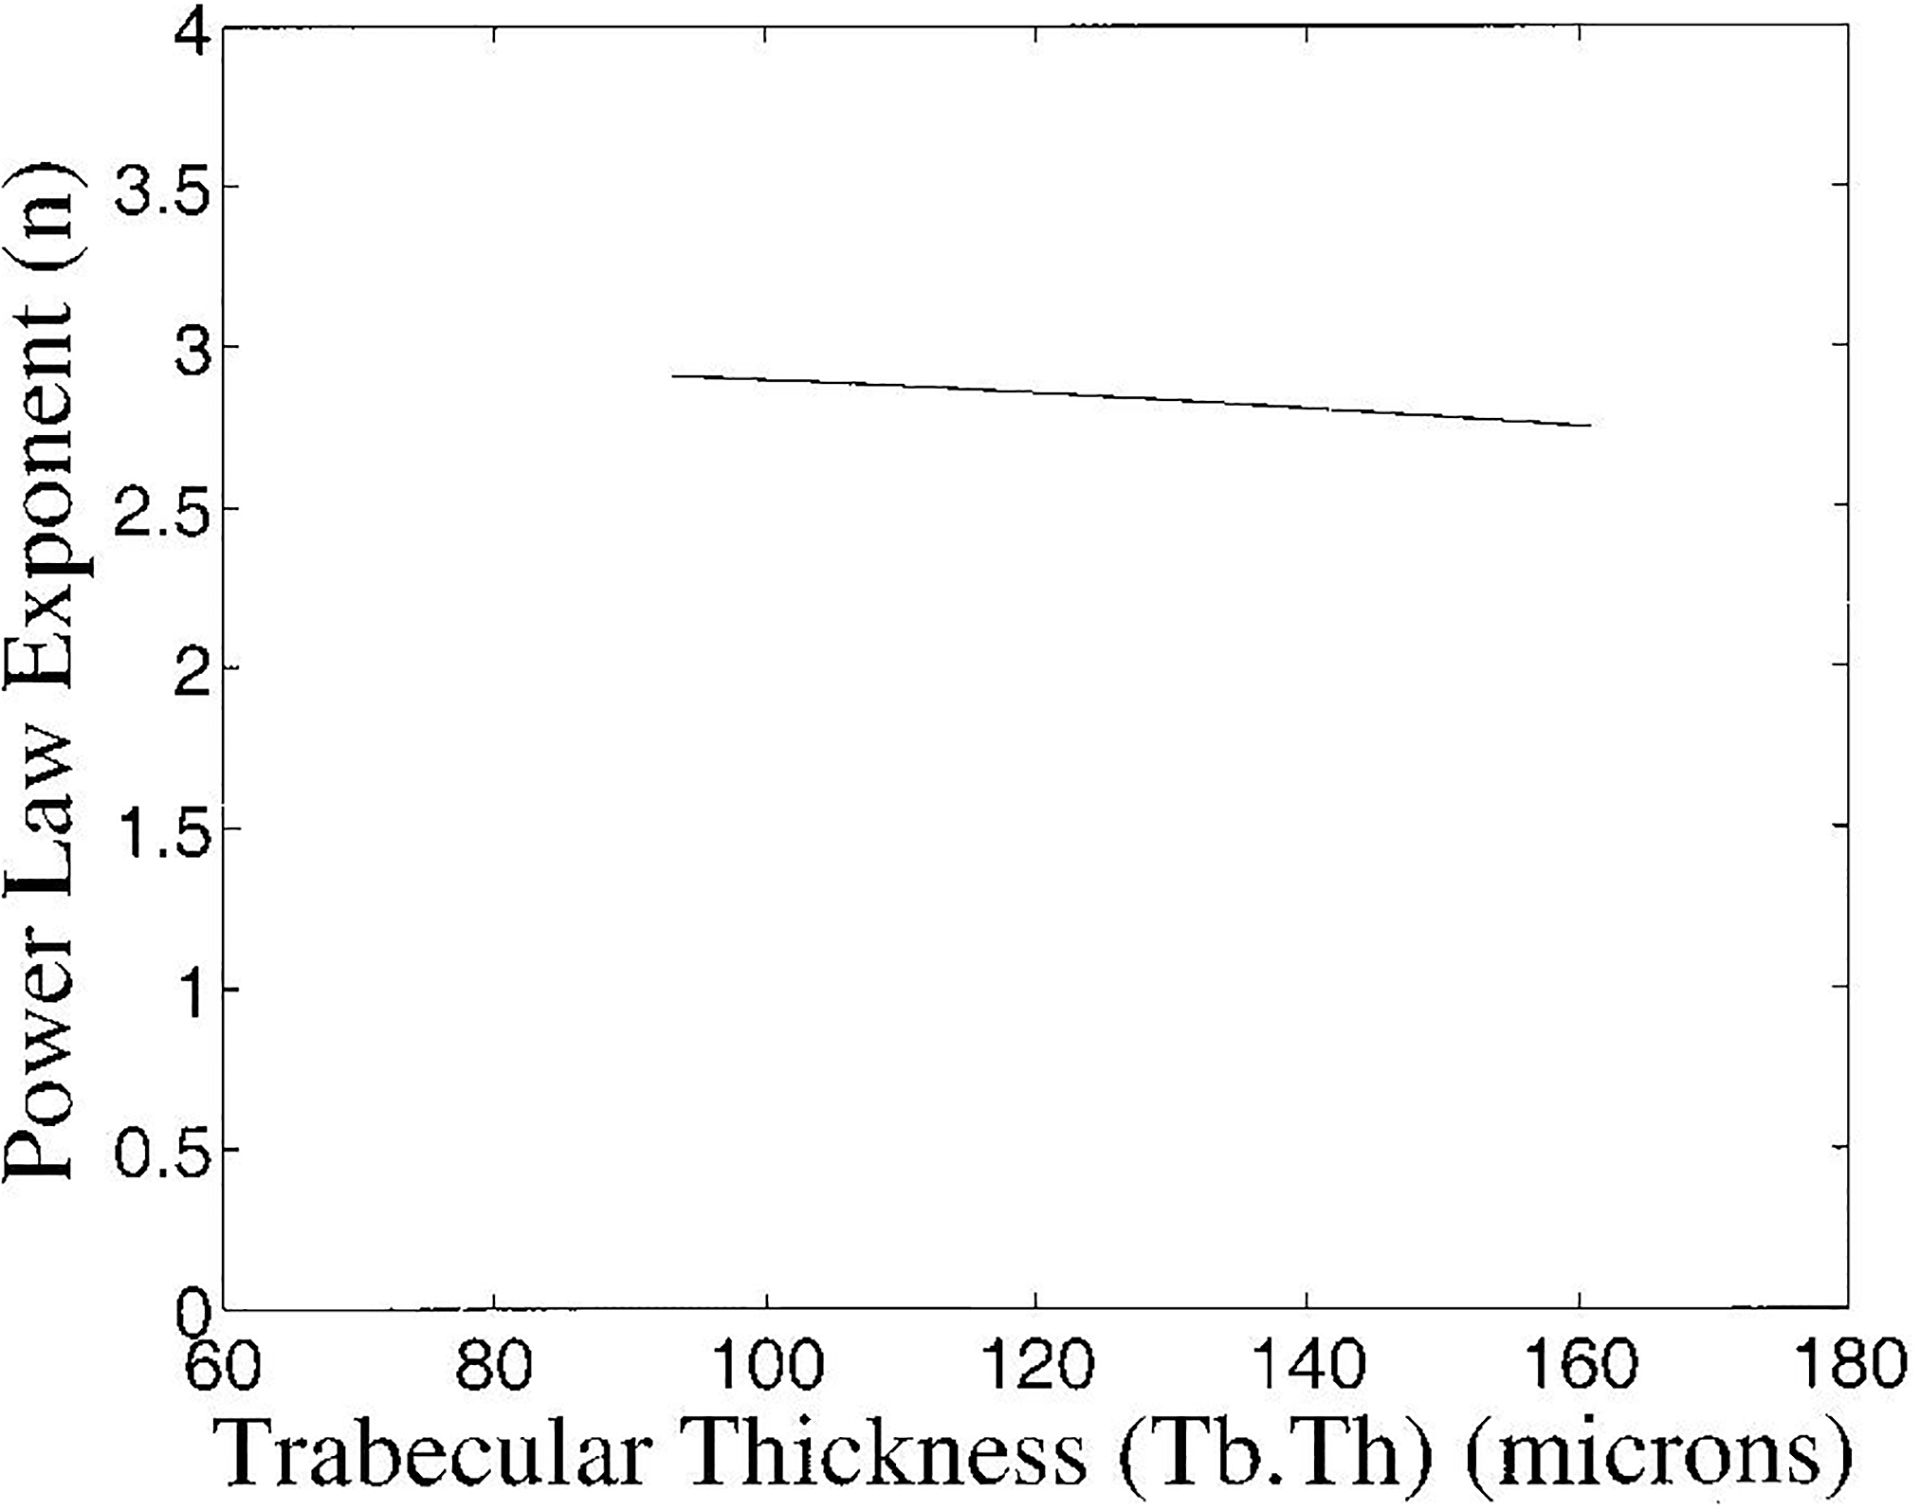
Exponent of power law fit to frequency-dependent backscatter coefficient as a function of trabecular thickness. The range of trabecular thicknessess shown corresponds to the mean ± two standard deviations reported for human calcaneal trabecular thickness (Ulrich et al., 1999).
Conclusion
Several models to predict frequency dependence of backscatter from bone have been proposed. Some have been evaluated by direct comparison to experimental measurements. Knowledge of measurement precision is essential in order to understand the limitations of such comparisons. In this paper, a model to predict uncertainties in measurements of frequency-dependent backscatter in soft-tissue-mimicking phantoms and bone has been proposed and validated. This model predicts fluctuations in estimates of power law exponents (n) consistent with measured values. The primary source of this variability is random interference of echoes emanating from individual scatterers within resolution cells rather than biological variability.
Chaffai and co-workers (2000) reported measurements of n from individual human calcaneus samples ranging from 2.76 to 3.86. (In these experiments, as in the present paper, a 1 MHz broadband transducer and an analysis range of 0.4 – 1.2 MHz were used). They speculated that the extent of this range may be attributable to variations in microarchitecture but could alternatively be explained by precision limitations. The present paper strongly supports the latter interpretation. The variabilities of estimates of n observed by Chaffai et al. and seen in Figure 5 are almost entirely accounted for by precision limitations. Trabecular thicknesses, for example, may exhibit a wide range of biological variability but trabeculae are always narrow compared to typical ultrasonic wavelengths, resulting in a small range of true backscatter power law exponent (n) (see Figure 8) relative to measurement precision.
Measured average values of power law exponent (n) in the low frequency range have been reported as 3.26 (Wear, 1999) and 3.38 (Chaffai et al., 2000), which are a little higher than would be predicted by the cylinder model. Certainly, the cylinder model is only an approximation. The existence of plate-like structures in addition to rod-like trabeculae complicates the situation. However, as seen in Figure 9, it is not unreasonable to postulate that cylinder-like objects (trabeculae) contribute a substantial portion of the scattering. In addition, only those plate-like structures oriented approximately perpendicular to the ultrasound propagation direction can measurably affect the frequency dependence of scattering. Finally, plates are comparatively rare in bones from older subjects, upon which the data from the studies mentioned above are based.
Figure 9.
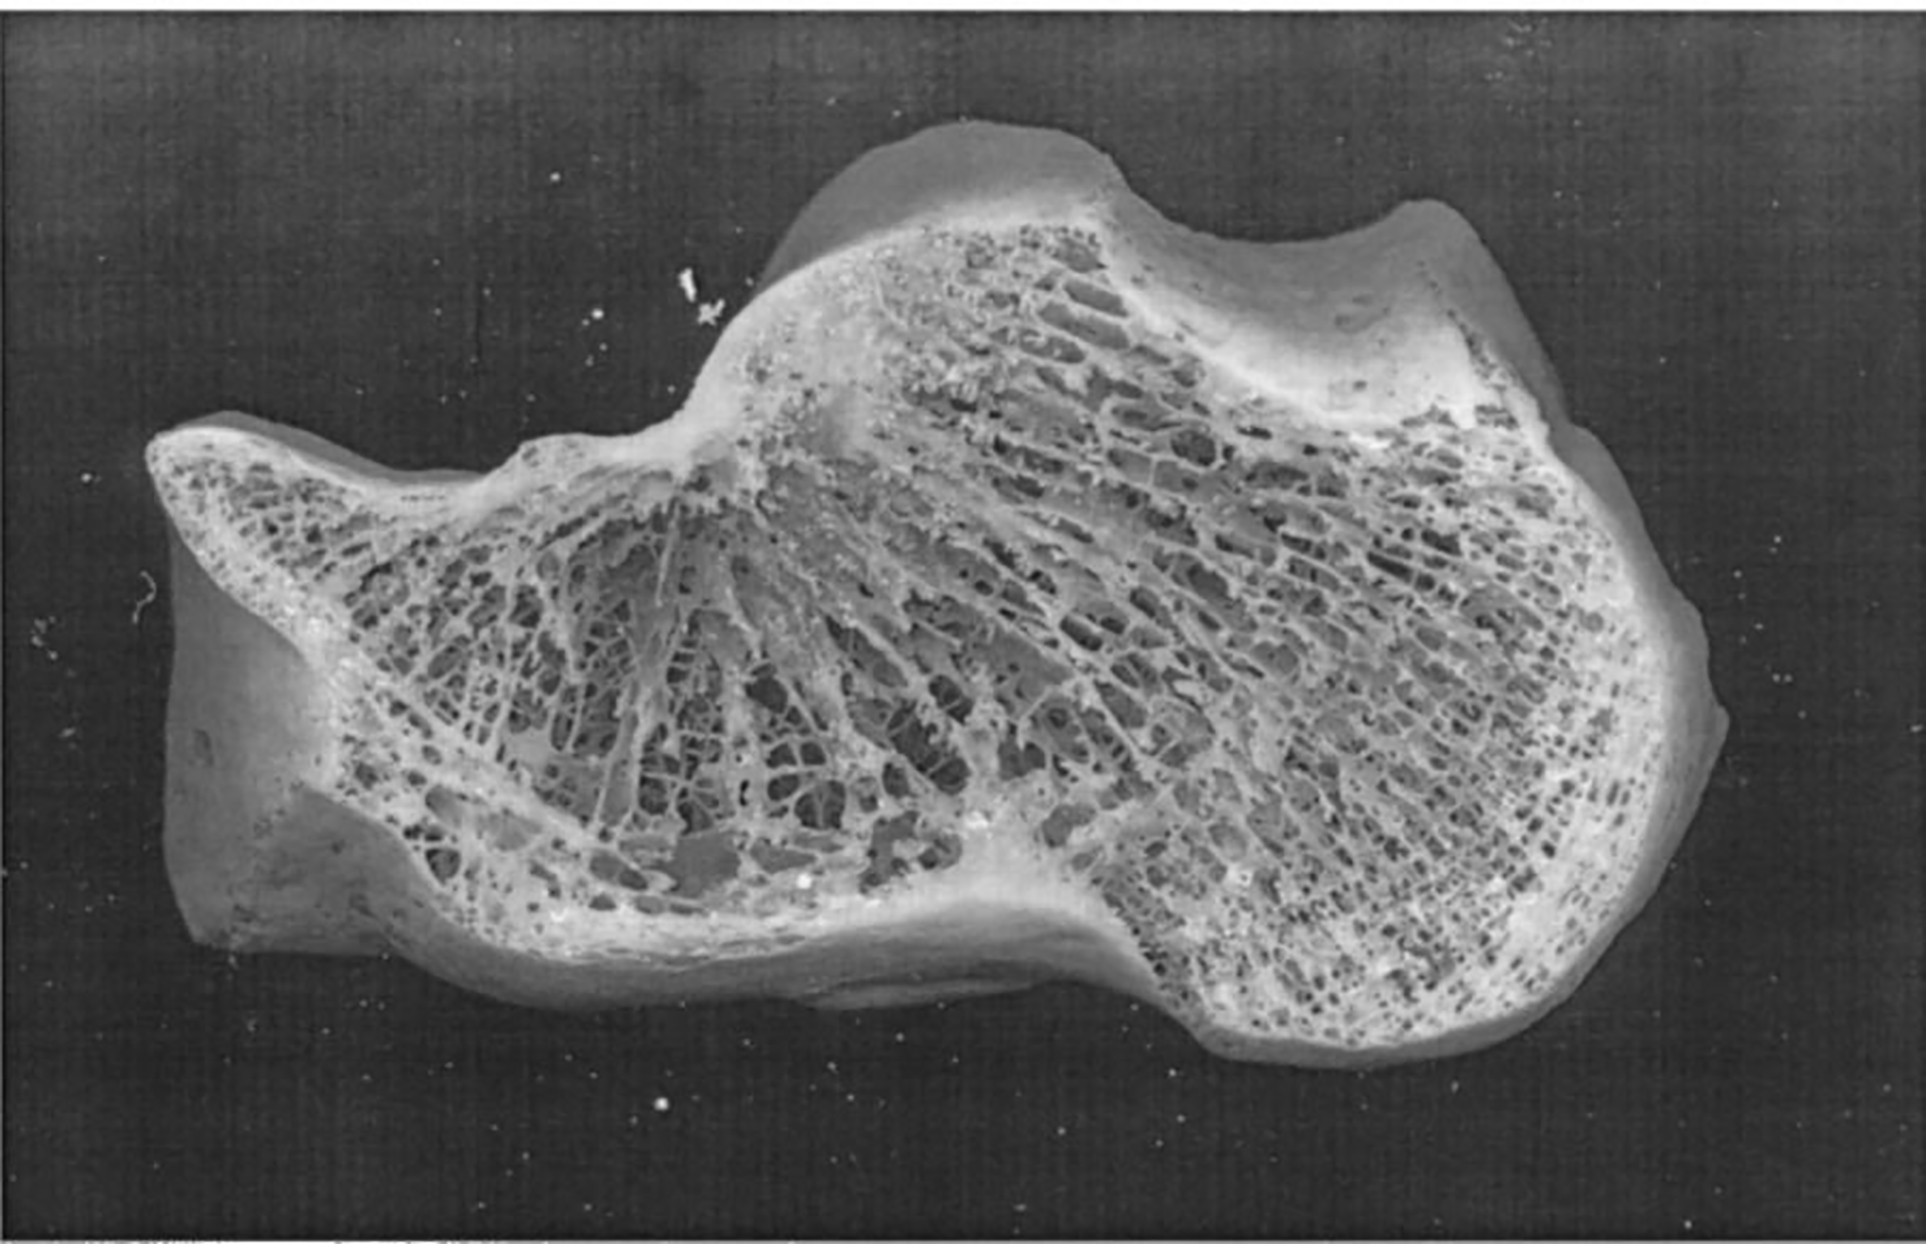
Human calcaneus with lateral cortical plates sliced off.
Other models (Chaffai et al., 2000; Nicholson et al., 2000) are useful alternatives that also demonstrate some consistency with experimental results and have the advantage of not being as geometrically restrictive as the cylinder model. One advantage of the cylinder model compared with these however is that it is not restricted to scatterers (trabeculae) with small deviations in acoustic properties compared with the embedding medium (marrow). Specifically these assumptions refer to (if ρ is density, c is sound speed and subscripts 1 and 2 denote the scatterers and the embedding medium) impedance (|ρ1c1 − ρ2c2| << |ρ1c1 + ρ2c2|/2) (Chaffai et al., 2000; Ueda et al., 1985), sound speed (|c1 − c2| << |c1 + c2|/2) or density (|ρ1 − ρ2| << |ρ1 + ρ2|/2) (Nicholson et al., 2000; Sehgal and Greenleaf, 1984; Sehgal 1993; Chivers 1977). These assumptions may be more appropriate for soft tissues than bone as estimates for relevant parameters have been reported to be 2501 m/s < c1 < 3800 m/s , 1.73 g/cc < ρ1 < 1.96 g/cc (Hosokawa and Otani, 1997; Luo et al., 1998; Gong et al., 1964; Lang et al., Williams, 1992; Rho et al., 1993 Ashman et al., 1993), whereas 1450 m/s < c2 < 1570 m/s (Macovski, 1983) and 0.92 g/cc < ρ2 < 1.05 g/cc (Duck, 1990). In addition, unlike the other models, the cylinder model allows for the propagation within trabeculae of shear waves, which have been demonstrated to propagate in cortical bone (Grenoble et al., 1972). Nevertheless, the various models for ultrasonic scattering from bone are useful in that they help explain certain observations. Given the complexity of the problem, it is not unexpected that all current models, including the cylinder model, are somewhat simplistic in some respect.
In addition to the precision limitations discussed in this paper, the frequency-dependent backscatter measurement has accuracy limitations as well. As mentioned previously (Wear, 1999), the potential effects of coherent scattering, multiple scattering, small measurement volumes (often only a few wavelengths deep), ultrasonic beam distortion (due to propagation through an inhomogeneous medium, bone), and phase cancellation compromise accuracy. Given these numerous complicating factors, it may not be possible to ascertain at present the extent to which any discrepancy between theoretical predictions and measurements is attributable to imperfect modeling as opposed to experimental uncertainty.
Acknowledgements
The author is grateful for funding provided by the US Food and Drug Administration Office of Women’s Health. The author thanks Ernest Madsen, University of Wisconsin, and Timothy Hall, University of Kansas, for providing the test and reference phantoms used in this study. The author is also appreciative of the helpful suggestions of Sandy Stewart, Food and Drug Administration.
References
- Alves JM, Ryaby JT, Kaufman JJ, Magee PP, and Siffert RS. (1996). Influence of marrow on ultrasounic velocity and attenuation in bovine trabecular bone. Calc. Tissue. Int, 58, 362–367. [DOI] [PubMed] [Google Scholar]
- Bauer DC, Gluer CC, Cauley JA, Vogt TM, Ensrud KE, Genant HK, and Black DM. (1997). “Broadband ultrasound attenuation predicts fractures strongly and independently of densitometry in older women,” Arch. Intern, Med 157, pp. 629–634 1997. [PubMed] [Google Scholar]
- Bevington PR and Robinson DK, (1992). Data Reduction and Error Analysis for the Physical Sciences (McGraw-Hill, New York, NY: ), 2nd edition, chapter 6. [Google Scholar]
- Bouxsein ML and Radloff SE. (1997). “Quantitative ultrasound of the calcaneus reflects the mechanical properties of calcaneal trabecular bone,” J. Bone Miner. Res 12, pp. 839–846. [DOI] [PubMed] [Google Scholar]
- Chaffai S, Roberjot V, Peyrin F, Berger G, and Laugier P. (2000). Frequency dependence of ultrasonic backscattering in cancellous bone: Autocorrelation model and experimental results. J. Acoust. Soc. Am 108, 2403–2411. [DOI] [PubMed] [Google Scholar]
- Chappard C, Laugier P, Fournier B, Roux C, and Berger G, (1997). “Assessment of the relationship between broadband ultrasound attenuation and bone mineral density at the clacaneus using BUA Imaging and DXA,” Osteo. Int, 7, pp. 316–322. [DOI] [PubMed] [Google Scholar]
- Chivers RC, (1977), “The scattering of ultrasound by human tissues – some theoretical models,” Ultrasound in Med. & Biol, 3, pp. 1–13, Appendix. [DOI] [PubMed] [Google Scholar]
- Cummings SR, Black DM, Nevitt MC, Browner W, Cauley J, Ensrud K, Genant HK, Palermo L, Scott J, and Vogt TM. (1993). “Bone density at various sites for prediction of hip fractures.” Lancet, 341, pp. 72–75. [DOI] [PubMed] [Google Scholar]
- Droin P, Berger G, and Laugier P. Velocity dispersion of acoustic waves in cancellous bone. IEEE Trans. Ultrason. Ferro. Freq. Cont 45, 581–592 (1998) [DOI] [PubMed] [Google Scholar]
- Efron B and Tibshirani RJ, (1993). An Introduction to the Bootstrap, Chapman & Hall, New York, NY. [Google Scholar]
- Duck FA, (1990). Physical Properties of Tissues. San Diego, CA. Academic Press, Inc., chapter 5. [Google Scholar]
- Faran JJ, Sound scattering by solid cylinders and spheres, (1997). J. Acoust. Soc. Am, 23, 405–418. [Google Scholar]
- Giat P, Chappard C, Roux C, Laugier P, and Berger G. (1997). Preliminary clinical assessment of the backscatter coefficient in osteoporosis, Proc. 22nd Int. Symp Ultrason. Imag. and Tissue Char, Washington, DC, 16. (Abstract). [Google Scholar]
- Glüer C, Cummings SR, Bauer DC, Stone K, Pressman A, Mathur A, and Genant HK. (1996). “Osteoporosis: Association of recent fractures with quantitative US findings”, Radiology, 199, pp. 725–732. [DOI] [PubMed] [Google Scholar]
- Gluer CC, (1997). “Quantitative ultrasound techniques for the assessment of osteoporosis: expert agreement on current status,” J. Bone Miner. Res 12, pp. 1280–1288, 1997. [DOI] [PubMed] [Google Scholar]
- Goodman JW, (1968). Introduction to Fourier Optics (McGraw-Hill, New York: ). [Google Scholar]
- H≅usler KD, Rich PA, Smith PC, Barry EB. (1999). “Relationships between static histomorphometry and ultrasound in the human calcaneus,” Calc. Tissue. International, 64, pp. 477–480. [DOI] [PubMed] [Google Scholar]
- Grenoble DE, Katz JL, Dunn KL, Gilmore RS, and Linga Murty K, (1972), “The elastic properties of hard tissues and apatites,” J. Biomed. Mater. Res, 6, pp. 221–233. [DOI] [PubMed] [Google Scholar]
- Hans D, Dargent-Molina P, Schott AM, Sebert JL, Cormier C, Kotzki PO, Delmas PD, Pouilles JM, Breart G, and Meunier PJ. (1996). “Ultrasonographic heel measurements to predict hip fracture in elderly women: the EPIDOS prospective study,” Lancet, 348, pp. 511–514. [DOI] [PubMed] [Google Scholar]
- Hans D, Wu C, Njeh CF, Zhao S, Augat P, Newitt D, Link T, Lu Y, Majumdar S, and Genant HK. (1999). “Ultasound velocity of trabecular cubes reflects mainly bone density and elasticity.” Calcif. Tissue Intl 64, pp. 18–23. [DOI] [PubMed] [Google Scholar]
- Hoffmeister BK, Whitten SA, and Rho JY , (2000). “Low megahertz ultrasonic properties of bovine cancellous bone,” Bone, 26, pp. 635–642. [DOI] [PubMed] [Google Scholar]
- Hausler KD, Rich PA, Smith PC, and Barry EB, “Relationships between static histomorphometry and ultrasound in the human calcaneus,” Calcif. Tissue. Int, 64, 477–480, 1999. [DOI] [PubMed] [Google Scholar]
- Hoffmeister BK, Whitten SA, Kaste SC, and Rho JY, Effect of collagen and mineral content on the high frequency ultrasonic properties of human cancellous bone, Bone, in press. [DOI] [PubMed] [Google Scholar]
- Langton CM, Palmer SB, and Porter RW. (1984). “The measurement of broadband ultrasonic attenuation in cancellous bone.” Eng. in Med 13, pp. 89–91. [DOI] [PubMed] [Google Scholar]
- Langton CM , Njeh CF, Hodgskinson R, and Carrey JD, (1996). “Prediction of Mechanical Properties of the Human Calcaneus by Broadband Ultrasonic Attenuation,” Bone, 18, pp. 495–503. [DOI] [PubMed] [Google Scholar]
- Laugier P, Droin P, Laval-Jeantet AM, and Berger G. (1997). “In vitro assessment of the relationship between acoustic properties and bone mass density of the calcaneus by comparison of ultrasound parametric imaging and quantitative computed tomography.” Bone, 20, pp. 157–165. [DOI] [PubMed] [Google Scholar]
- Lindgren BW, (1958). Statistical Theory, (McGraw-Hill, New York, NY, 1958), 31–89 and 280–282. [Google Scholar]
- Lizzi FL, Feleppa EJ, Astor M, and Kalisz A, (1997). “Statistics of ultrasonic spectral parameters for prostate and liver examinations,” IEEE Trans. Ultrason. Ferro. Freq. Cont, 44, 935–942. [Google Scholar]
- Luo G, Kaufman JJ, Chabrera A, Bianco B, Kinney JH, Haupt D, Ryaby JT, and Siffert RS, (1999). Computational methods for ultrasonic bone assessment. Ultrasound Med. & Biol, 25, 823–830. [DOI] [PubMed] [Google Scholar]
- Macovski A. (1983). Medical Imaging Systems. Englewood Cliffs, NJ, Prentice-Hall, Inc., chapter 9, p. 196. [Google Scholar]
- Morse PM and Ingard KU, (1986). Theoretical Acoustics. Princeton, NJ, Princeton University Press. [Google Scholar]
- Nicholson PHF, Muller R, Lowet G, Cheng XG, Hildebrand T, Ruegsegger P, Van Der Perre G, Dequeker J, and Boonen S. (1998). “Do quantitative ultrasound measurements reflect structure independently of density in human vertebral cancellous bone?” Bone. 23, pp. 425–431. [DOI] [PubMed] [Google Scholar]
- Nicholson PHF, Strelitzki R, Cleveland RO, and Bouxsein ML, (2000). “Scattering of ultrasound in cancellous bone: predictions from a theoretical model,” J. Biomech 33, 503–506. [DOI] [PubMed] [Google Scholar]
- Njeh CF, Hodgskinson R, Currey JD, and Langton CM. (1996). “Orthogonal relationships between ultrasonic velocity and material properties of bovine cancellous bone.” Med. Eng. Phys, 18, pp. 373–381, 1996. [DOI] [PubMed] [Google Scholar]
- Njeh F and Langton CM. (1997). “The effect of cortical endplates on ultrasound velocity through the calcaneus: an in vitro study.” Brit. J. Radiol, 70, pp. 504–510. [DOI] [PubMed] [Google Scholar]
- Njeh CF, Fuerst T, Diessel E, and Genant HK, (2000a). “Is quantitative ultrasound dependent on bone structure? A reflection,” Osteo. Int’l, 12, 1 –15. [DOI] [PubMed] [Google Scholar]
- Njeh CF, Hans D, Li J, Fan B, Fuerst T, He YQ, Tsuda-futami E, Lu Y, Wu CY, and Genant HK, (2000b). Comparison of six calcaneal quantitative ultrasound devices: precision and hip fracture discrimination, Osteo. Int, 11, 1051–1062. [DOI] [PubMed] [Google Scholar]
- O’Donnell M and Miller JG, Quantitative broadband ultrasonic backscatter: An approach to nondestructive evaluation in acoustically inhomogeneous materials, J. Appl. Phys 52, 1056–1065 (1981) [Google Scholar]
- Roberjot V, Laugier P, Droin P, Giat P, and Berger G. (1996). Meaurement of integrated backscatter coefficient of trabecular bone. Proc. 1996 IEEE Ultrason. Symp Vol. 2, 1123–1126. [Google Scholar]
- Rossman P, Zagzebski J, Mesina C, Sorenson J, and Mazess R, (1989). “Comparison of Speed of Sound and Ultrasound Attenuation in the Os Calcis to Bone Density of the Radius, Femur and Lumbar Spine,” Clin. Phys. Physiol.Meas, 10, pp. 353–360. [DOI] [PubMed] [Google Scholar]
- Sehgal CM and Greenleaf JF, (1984), “Scattering of ultrasound by tissues,” Ultrason. Imaging 6, pp. 60–80, p. 67. [DOI] [PubMed] [Google Scholar]
- Sehgal CM, (1993) “Quantitative relationship between tissue composition and scattering of ultrasound,” J. Acoust. Soc. Am, 94, pp. 1944–1952, p. 1945. [DOI] [PubMed] [Google Scholar]
- Serpe L and Rho JY, (1996). “The nonlinear transition period of broadband ultrasound attenuation as bone density varies,” J. Biomech, 29, pp. 963–966. [DOI] [PubMed] [Google Scholar]
- Schott M, Weill-Engerer S, Hans D, Duboeuf F, Delmas PD, and Meunier PJ, (1995). “Ultrasound discriminates patients with hip fracture equally well as dual energy X-ray absorptiometry and independently of bone mineral density,” J. Bone Min. Res, 10, pp. 243–249. [DOI] [PubMed] [Google Scholar]
- Tavakoli MB and Evans JA. (1991). “Dependence of the velocity and attenuation of ultrasound in bone on the mineral content.” Phys. Med. Biol, 36, pp. 1529–1537. [DOI] [PubMed] [Google Scholar]
- Thompson P, Taylor J, Fisher A, and Oliver R, (1998). “Quantitative heel ultrasound in 3180 women between 45 and 75 years of age: compliance, normal ranges and relationship to fracture history,” Osteo. Int’l, 8, pp. 211–214. [DOI] [PubMed] [Google Scholar]
- Trebacz H, and Natali A. (1999). “Ultrasound velocity and attenuation in cancellous bone samples from lumbar vertebra and calcaneus,” Osteo. Int’l, 9, 99–105. [DOI] [PubMed] [Google Scholar]
- Turner H, Peacock M, Timmerman L, Neal JM, and Johnston CC Jr., (1995). “Calcaneal ultrasonic measurements discriminate hip fracture independently of bone mass,” Osteo. International, 5, pp. 130–135. [DOI] [PubMed] [Google Scholar]
- Ueda M and Ozawa Y, (1985), “Spectral analysis of echoes for backscattering coefficient measurement,” J. Acoust. Soc. Am, 77, pp. 38–47, p. 39. [Google Scholar]
- Ulrich D, van Rietbergen B, Laib A, and Ruegsegger P, (1999). “The ability of three-dimensional structural indices to reflect mechanical aspects of trabecular bone,” Bone, 25, 55–60. [DOI] [PubMed] [Google Scholar]
- Wagner RF, Smith SW, Sandrik JM, and Lopez H, (1983). “Statistics of speckle in ultrasound B-scans,” IEEE Trans. Son. Ultrason 30, 156–163. [Google Scholar]
- Wear KA and Garra BS. (1997). Assessment of bone density using broadband ultrasonic backscatter, Proc. 22nd Int. Symp Ultrason. Imag. and Tissue Char, Washington, DC., 14 (Abstract). [Google Scholar]
- Wear KA and Garra BS. (1998). Assessment of bone density using ultrasonic backscatter. Ultrason. Med. & Biol 24, 689–695. [DOI] [PubMed] [Google Scholar]
- Wear KA. (1999). Frequency dependence of ultrasonic backscatter from human trabecular bone: theory and experiment. J. Acoust. Soc. Am 106, 3659–3664. [DOI] [PMC free article] [PubMed] [Google Scholar]
- Wear KA. (2000). Anisotropy of ultrasonic backscatter and attenuation from human calcaneus: Implications for relative roles of absorption and scattering in determining attenuation. J. Acoust. Soc. Am, 107, 3474–3479. [DOI] [PMC free article] [PubMed] [Google Scholar]
- Wear KA and Armstrong DW, (2000). The relationship between ultrasonic backscatter and bone mineral density in human calcaneus, IEEE Trans. Ultrason. Ferro. Freq. Cont, 47, 777–780, 2000. [DOI] [PMC free article] [PubMed] [Google Scholar]
- Zagzebski JA, Rossman PJ, Mesina C, Mazess RB, and Madsen EL, (1991). “Ultrasound transmission measurements through the os calcis,” Calcif. Tissue Int’l, 49, pp. 107–111, 1991. [DOI] [PubMed] [Google Scholar]
- Zagzebski JA, Yao LX, Boote EJ, and Lu ZF. (1993). Quantitative Backscatter Imaging in Ultrasonic Scattering in Biological Tissues, edited by Shung KK and Thieme GA, CRC Press, Boca Raton, FL, (1993). [Google Scholar]


