

ABSTRACT
Clofazimine is classified as a WHO group B drug for the treatment of rifampin-resistant tuberculosis. QT prolongation, which is associated with fatal cardiac arrhythmias, is caused by several antitubercular drugs, including clofazimine, but there are no data quantifying the effect of clofazimine concentration on QT prolongation. Our objective was to describe the effect of clofazimine exposure on QT prolongation. Fifteen adults drug-susceptible tuberculosis patients received clofazimine monotherapy as 300 mg daily for 3 days, followed by 100 mg daily in one arm of a 2-week, multiarm early bactericidal activity trial in South Africa. Pretreatment Fridericia-corrected QT (QTcF) (105 patients, 524 electrocardiograms [ECGs]) and QTcFs from the clofazimine monotherapy arm matched with clofazimine plasma concentrations (199 ECGs) were interpreted with a nonlinear mixed-effects model. Clofazimine was associated with significant QT prolongation described by a maximum effect (Emax) function. We predicted clofazimine exposures using 100-mg daily doses and 2 weeks of loading with 200 and 300 mg daily, respectively. The expected proportions of patients with QTcF change from baseline above 30 ms (ΔQTcF > 30) were 2.52%, 11.6%, and 23.0% for 100-, 200-, and 300-mg daily doses, respectively. At steady state, the expected proportion with ΔQTcF of >30 ms was 23.7% and with absolute QTcF of >450 ms was 3.42% for all simulated regimens. The use of loading doses of 200 and 300 mg is not predicted to expose patients to an increased risk of QT prolongation, compared with the current standard treatment, and is, therefore, an alternative option for more quickly achieving therapeutic concentrations.
KEYWORDS: Monte Carlo simulation, multidrug resistance, pharmacodynamics, population pharmacokinetics, tuberculosis
INTRODUCTION
Clofazimine, a repurposed leprosy drug, is a key component of WHO-recommended treatment regimens for drug-resistant tuberculosis (DR-TB) (1). Clofazimine undergoes duration-dependent accumulation in tissue macrophages and the reticuloendothelial system. (2) Clofazimine pharmacokinetics is characterized by multicompartment disposition kinetics, very long terminal half-life (∼30 days), and huge peripheral volume of distribution, causing steady-state concentrations to be achieved only after approximately 5 months of repeated daily dosing. With the current 100-mg daily dose, the average daily clofazimine plasma concentrations before steady state are much lower than the recommended critical concentration of 1 mg/liter and published MIC distributions in drug-resistant Mycobacterium tuberculosis strains. Alternative dosing regimens are being evaluated to optimize treatment by using loading doses to attain concentrations more quickly above the therapeutic target (3, 4).
The toxicities associated with clofazimine include skin discoloration, increased liver enzymes, and QT prolongation, but it is unknown how these toxicities relate to clofazimine dose or plasma concentrations (5–7). Clofazimine exerts its cardiotoxic effects by inhibiting the human ether-a-go-go-related (hERG) channel (6). Clofazimine-induced QT prolongation is a concern since several other drugs recommended by WHO for DR-TB (bedaquiline, fluoroquinolones, and delamanid) also prolong the QT interval, and a pharmacodynamic drug-drug interaction is often observed when QT-prolonging drugs are used in combination (8).
The STREAM study compared outcomes of a long (20 month) regimen with a shorter (9 to 11 months) regimen, including clofazimine and high-dose moxifloxacin for the treatment of multidrug-resistant tuberculosis (MDR-TB). QT intervals above 500 ms, where the risk of ventricular arrhythmias is highest (9), were recorded in 6% of participants in the long regimen arm (a locally used WHO-approved MDR-TB regimen in accordance with 2011 WHO MDR-TB treatment guidelines) versus 11% in the short regimen arm. In a phase 2 study of bedaquiline in MDR-TB regimens, the mean increase in Fridericia-corrected QT (QTcF) from baseline at 24 weeks was 31.9 ms and 12.3 ms, with and without concomitant clofazimine (10). A previous analysis using the current study data showed that clofazimine monotherapy was associated with an increase in Bazett’s heart rate-corrected QT interval above baseline (ΔQTcB) by 16 to 20 ms over 14 days in participants with drug-sensitive tuberculosis (7).
While the reports above provide reassurance about QT prolongation during clofazimine treatment at the current dose levels, the relationship between clofazimine concentration and QT prolongation has not been characterized. Such knowledge is of particular importance to adequately evaluate how alternative dosing regimens, especially with loading doses, may affect exposure safety and efficacy relationships.
Model-based approaches are a powerful tool with which to analyze pharmacokinetic-pharmacodynamic relationships, and their advantage over traditional noncompartmental analysis is particularly marked when interpreting data from slowly accumulating drugs with long terminal half-life (11), such as clofazimine.
In this analysis, we explored the relationship between clofazimine exposures and QTcF prolongation in a randomized controlled trial by comparing the early bactericidal activity (EBA) of several antituberculosis drugs or regimens (7). We used population modeling to characterize the concentration-QTcF relationship and then simulate the effect of different clofazimine dosing regimens and loading dose strategies.
RESULTS
Demographics.
The baseline characteristics of the 105 participants included in 7 different treatment arms for drug-sensitive tuberculosis are summarized in Table 1.
TABLE 1.
Clinical characteristics of 15 patients treated with clofazimine for drug-sensitive tuberculosis
| Characteristica | Clofazimine monotherapy arm datab |
|---|---|
| Age (yr) | 24 (22–37.5) |
| Males | 9 (60) |
| HIV-1+ | 1 (6.67) |
| Total body wt (kg) | 54 (45–61.9) |
| FFM (kg) | 38 (34–51.8) |
| BMI (kg/m2) | 18 (17–20.8) |
| Overall baseline QTcF (ms) | 389 (379–400) |
| Predose QTcF(ms) | 388 (379–401) |
| 5-h QTcF(ms) | 391 (381–397) |
| 10-h QTcF(ms) | 389 (380–340) |
| Overall baseline HR (bpm) | 88 (75–98.3) |
| Predose HR (bpm) | 89.3 (74.7–101) |
| 5-h HR (bpm) | 86.3 (76.3–92.3) |
| 10-h HR (bpm) | 87.3 (75.8–95) |
FFM, fat-free mass; BMI, body mass index; bpm, beat per minute; HR, heart rate.
Data are presented as median (IQR) or n (%).
Model development and final parameters.
The pretreatment data from all 105 patients was used to characterize the baseline QTcF and between-subject variability. The model then accounted for circadian variation in QTcF using three cosine functions (objective function value [ΔOFV] of 37, degrees of freedom [df] = 7, P = 4.69e-06). The effects of covariates we explored in the baseline model (electrolytes, age, weight, lean body mass, and sex) were not statistically significant. The model estimated a baseline QTcF value of 391 ms and 3.75% between-subject variability. Individual model-predicted instantaneous concentrations at the same time as the electrocardiogram (ECG) measurement were found to be the best predictor of the QTcF-clofazimine exposure relationship, and the relationship was best described by maximum effect (Emax function) (ΔOFV of 93, 2 degrees of freedom, P = 7.87e-22) versus the linear slope model (ΔOFV of 83, 1 df, P = 8.21e-20; ΔAICEmax-linear, −11.9). The median (95% confidence interval) Emax value was 28.0 (17.4 to 61.0) ms for the median tuberculosis patient observed in our cohort with 50% effective concentration (EC50) of 0.261 (0.0957 to 0.949) mg/liter. The unexplained residual variability was best described with an additive model. A visual predictive check showing adequate model fit to the data is depicted in Fig. 1. The final model parameters are summarized in Table 2.
FIG 1.
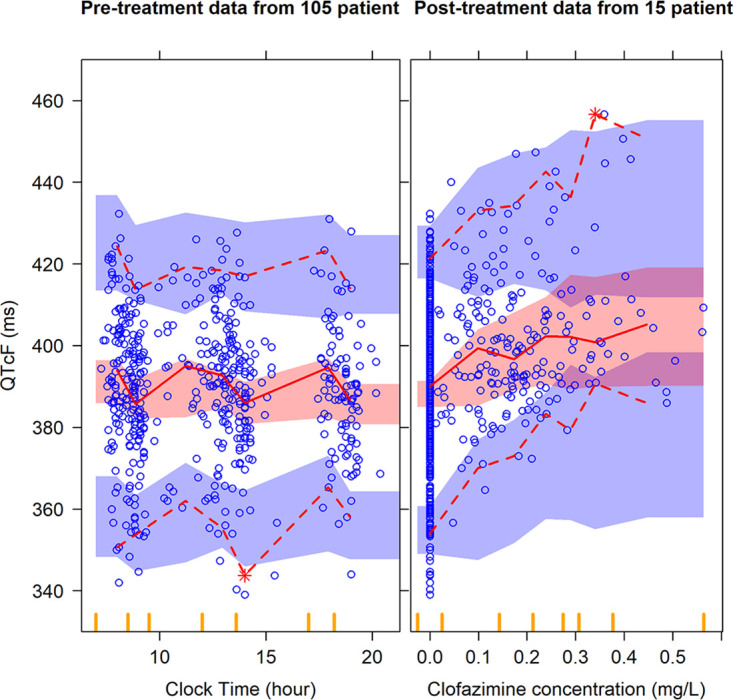
Visual predictive check (VPC) for QTcF (ms) versus clock time (hour) in the left panel and clofazimine concentration (mg/liter) in the right panel. Circles represent original data; dashed lines are the 5th and 95th percentiles of the original data; solid lines are the 50th percentiles of the original data; while the shaded areas are the corresponding 95% confidence intervals for the same percentiles, as predicted by the model. Vertical yellow ticks on the x axis represent bins for the sampling time points. An appropriate model is expected to have most observed percentiles within the simulated confidence intervals.
TABLE 2.
Final model parameters of clofazimine
| Parameter description | Typical value (95% CI)a |
|---|---|
| QTcF base (ms) | 392 (388–396) |
| Diurnal model parameters | |
| 24-h cycle amplitude (%) | 2.05 (1.34–2.94) |
| 12-h cycle amplitude (%) | 0.969 (0.495–1.73) |
| 6-h cycle amplitude (%) | 0.979 (0.640–1.37) |
| 24-h cycle acrophase (h) | 4.64 (3.57–6.23) |
| 12-h cycle acrophase (h) | 3.64 (3.15–4.12) |
| 6-h cycle acrophase (h) | 5.84 (5.44–6.22) |
| Additive error (ms) | 8.40 (8.03–8.87) |
| Drug-effect parameter | |
| Emax (ms) | 28.0 (17.4–61.0) |
| EC50 (mg/liter)b | 0.261 (0.0957–0.949) |
| Between-subject variability (%)c | |
| QTcF base (%CV) | 3.75 (3.34–4.34) |
| 12-h cycle amplitude (%CV) | 59.0 (17.9–143) |
95% confidence intervals obtained with sampling importance resampling (SIR).
EC50 was calculated as a fraction of Emax, as the two parameters are positively correlated and to stabilize the model estimates.
Between-subject variability (BSV) was assumed to be log-normally distributed and reported as approximate % coefficient of variation (%CV).
Simulations.
Figure 2 summarizes the simulation results for QTcF/ΔQTcF with the standard 100-mg daily dose and the 2-week loading dose strategy with 200 or 300 mg daily, followed by 100 mg daily. The median simulated QTcF/ΔQTcF reached a value of 418/25.3 for the 200-mg regimen and 420/28.0 ms for the 300-mg regimen at the end of the loading dose period compared with 414/21 ms after 2 weeks of daily dosing with the standard 100-mg regimen. The proportions for which the change from baseline was above 30 ms (ΔQTcF, >30) at the end of the loading dose period (2 weeks) were 14.3% and 31.1% for the 200- and 300-mg regimens, respectively, compared with 33.6% obtained at steady with either regimen. At steady state, all simulated regimens were predicted to have the same QT prolongation, with a median QTcF/ΔQTcF of 420/28.5 ms. The proportion with an absolute QTcF of >450 ms was 3.42% for all simulated regimens at steady state. The simulation results are summarized in Fig. 3. The proportions for the higher The International Council for Harmonisation of Technical Requirements for Pharmaceuticals for Human Use (ICH) cutoff points we explored (QTcF of >480 ms or QTcF of >500 ms) were negligible (12).
FIG 2.
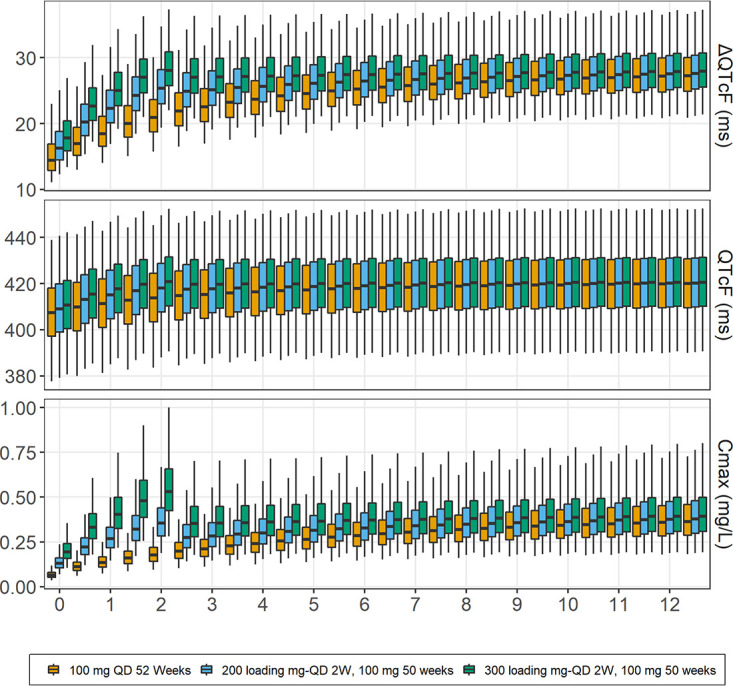
Simulated dQTcF, QTcF (ms), and peak concentrations (mg/liter) with standard 100-mg daily dosing and loading dose regimens for a typical TB patient observed in the cohort. The central lines in boxes represent median values; upper and lower horizontal lines are 75th and 25th percentiles, respectively; and whiskers are 2.5th and 97.5th percentiles.
FIG 3.
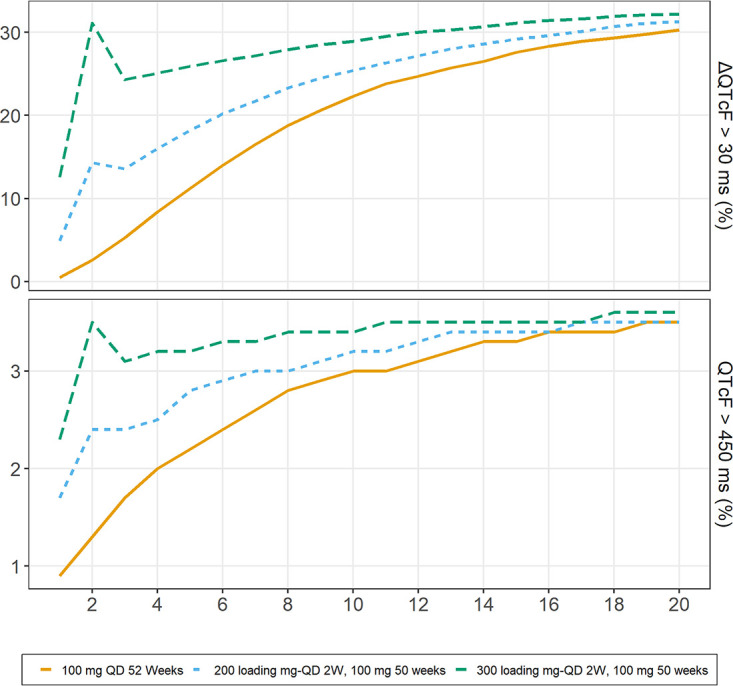
Proportions of simulated replicates with QTcF above 450 ms (bottom) and dQTcF above 30 ms (top) with standard 100-mg daily dosing and suggested loading dose regimens for a typical TB patient observed in the cohort.
DISCUSSION
We characterized the exposure-response relationship between clofazimine and QT interval prolongation, controlling for the circadian rhythm of QT and the slow accumulation of clofazimine concentrations. We simulated two different 2-week loading dose strategies, and while they resulted in more QT prolongation than the standard 100-mg daily dose during the first treatment weeks, the prevalence of ΔQTcF of >30 ms was not higher than the levels predicted with the current standard regimen at steady state, suggesting that the loading doses will have a minimal increased risk of greater QT prolongation compared with the standard 100-mg daily dose. At steady state with the standard clofazimine dosing regimen, we estimated absolute ΔQTcF to be 28.5 ms, which is higher than the ΔQTcF reported for moxifloxacin (standard and high dose), bedaquiline, or delamanid (13, 14). Our study highlights the importance of QT monitoring in patients treated with clofazimine-containing regimens for DR-TB, as the QT prolongation effect of clofazimine is likely to be additive.
The risk of life-threatening cardiac arrhythmias increases with a QT interval measured at >500 ms. Although none of the participants in the clofazimine monotherapy arm crossed the 500-ms threshold, the QT effect is significant considering clofazimine is usually included in DR-TB treatment regimens containing other QT-prolonging drugs (bedaquiline, delamanid, and fluoroquinolones) (15). Additive QT prolongation has been shown when clofazimine is combined with bedaquiline, resulting in a mean ± SE QTcF interval increase from a baseline of 41.5 ± 8.4 ms; by contrast, the QTcF interval increased by only 12.9 ± 4.1 ms in patients whose background regimen did not include clofazimine (6, 10).
Pretreatment data were used to account for inherent factors affecting the QT interval, such as circadian rhythm. Due to the limited size of our data set, QTcF was used rather than population-based correction methods; the results across different QT correction methods were not significantly different. Most of the pretreatment data were clustered around three time points and have less spread throughout the day, as shown in Fig. 1. Nevertheless, the model fit improved significantly (ΔOFV of 37, df = 7, P = 4.69e-06) after accounting for the circadian variation using harmonic functions (between-subject variability was retained only in one parameter). We also investigated the impact of circadian model on estimates of drug effect by repeating the analysis without the circadian model but found no significant difference. The circadian variation caused a maximum ΔQTcF of 13 ms; previous studies reported a maximum increase up to 20 ms in ΔQTcF (16). While the confidence intervals (CIs) for the estimates of Emax and EC50 are wide, namely, 17.4 to 61.0 (28.0) ms for Emax and 0.0957 to 0.949 (0.261) mg/liter for EC50, the uncertainty in these two parameters is highly correlated. This results in a relatively tight CI for the overall pharmacokinetic/pharmacodynamic (PK/PD) effect, as shown in Fig. 4. The median (95% CI) QT prolongation at the maximum observed concentration of 0.56 mg/liter was 19.0 (14.7 to 25.1) ms. The extrapolated QT at higher concentrations, up to 1 mg/liter, was 22.4 (16.0 to 32.9) ms. We also evaluated the simulation results assuming linear drug effect on QT (figures provided in supplemental material). Overall, the results between the two approaches were not significantly different.
FIG 4.
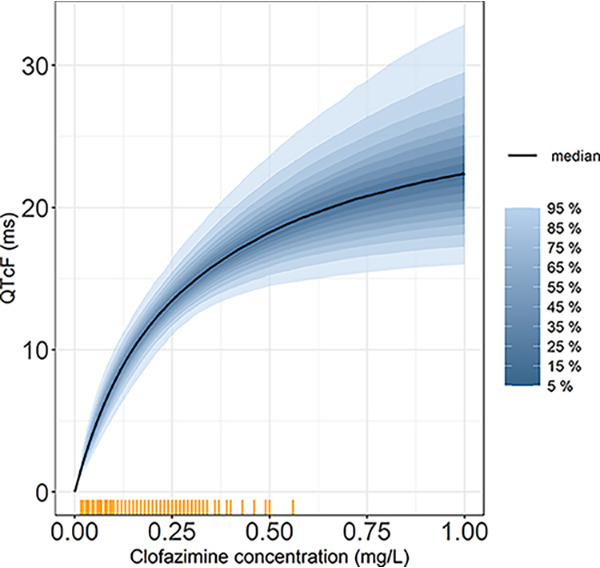
The percentiles of uncertainty distribution of the PK/PD relationship on QTcF (ms) versus clofazimine concentration (mg/liter). The yellow tick marks represent clofazimine concentrations observed in our data.
Limitations.
Our study has several limitations. First, we explored the effect of clofazimine exposure in the clofazimine monotherapy treatment arm only, and we were therefore unable to quantify the additive QT effect when clofazimine was included in a treatment regimen, including other QT-prolonging drugs. Second, the predicted QT effect was extrapolated to concentrations higher than those observed in the current data. These higher concentrations were predicted during the simulation of alternative dosing regimen in the population pharmacokinetic model (3); however, the large uncertainty around the extrapolated QT effect takes into account that these concentrations were not observed. as shown Fig. 4. Third, the population pharmacokinetic model used in the simulation has not been validated with steady-state concentrations. Last, the number of QT measurements included in our analysis is limited, as the ECG monitoring was performed as part of routine safety protocols.
Conclusions.
In conclusion, we have developed the first population pharmacokinetic-pharmacodynamic model characterizing the effect of clofazimine concentrations on QTcF prolongation in tuberculosis patients. Clofazimine has a significant QT-prolonging effect driven by plasma concentrations. Our model could be used to better understand the QT-prolonging effects of clofazimine when included with other QT-prolonging drugs for DR-TB. We also recommend more frequent ECG monitoring for patients receiving a loading of clofazimine as a part of multidrug regimen, at least during the initial phase of treatment, to identify patients with a higher risk of pronounced QTc prolongation.
MATERIALS AND METHODS
Adult treatment-naive drug-susceptible patients with pulmonary tuberculosis were enrolled in a 14-day phase 2A study of early bactericidal activity (EBA) of clofazimine, alone or in combination with other tuberculosis drugs. A total of 105 were randomized into 7 different treatment arms. Clofazimine was administered as a loading dose of 300 mg for 3 days, followed by 100 mg until day 14 of treatment (7).
QT monitoring.
Triplicate 12-lead ECGs performed approximately 5 minutes apart were scheduled on the day before treatment initiation and on days 1, 2, 3, 8, and 14 at the following time points: predose and 5 and 10 hours postdose. The pretreatment ECG measurements were performed at hours 0, 5, and 10 relative to the time the dosing was anticipated to occur at day 1 of treatment. As a reference, additional sets of triplicate ECGs were performed between 9 and 3 days prior to treatment initiation and on day 28 posttreatment cessation. QT intervals were measured by a central cardiology service and corrected for the effect of heart rate using Fridericia’s formula (QTcF). Additional correction methods were explored, namely, Bazett’s (QTcB) and study-specific correction method (QTcN). The results were not significantly different among the three methods (data are not shown). QTcF was chosen, as it is widely accepted among clinicians and regulatory agencies. We used the arithmetic mean of triplicate QTcFs per time point to perform the data analysis and model building. Clofazimine plasma concentrations were obtained hourly from time zero to 5 h after dosing and again at 10, 16, and 24 h on day 14. Additional figures are presented in the supplemental material.
Model development.
A population pharmacokinetic model previously developed was used to predict clofazimine concentrations at each ECG measurement time point for the 15 patients in the clofazimine monotherapy arm. The population PK model was developed using pooled data from 2 clinical trials, an observational study in patients with drug-resistant TB (79 patients providing 367 plasma sample), and the PK data from the current study (60 participants providing 1203 plasma sample). The median (interquartile range [IQR]) duration of clofazimine daily dosing was 94 (48 to 180) days (3).
The observed QTcF was analyzed using the following general model:
where BSL represents the baseline QTcF when drug effect and circadian variation are zero, Circ represents diurnal variation in ECG measurements, and ERR is the residual error.
Diurnal variation was characterized by using multioscillator functions with different number of cosine terms and different periods (17), according to the following formula:
Where Ak represents the amplitude associated with each term, clock is the clock time of the ECG measurement, and ϕk is the acrophase parameter for each cosine term. We tested 1 to 3 cosine terms, with periods 24, 12, and 6 hours. First, the diurnal variation model was developed using pretreatment data from all study arms and then reevaluated after the data were pooled with the clofazimine monotherapy data. Between-subject variability was tested on amplitude and acrophase parameters. We tested different residual error models with both additive and proportional components.
Different exposure predictors (individual model-predicted concentrations, predicted peak plasma concentration, area under concertation time curve from time 0 to 24 h [AUC0-24], and average daily concentration) and relationship shapes (linear, Emax, and sigmoidal Emax) were tested to describe the effect of clofazimine. We tested covariates in a model developed using only pretreatment data and then revalidated our findings and also included the clofazimine monotherapy data. The covariates age, sex, body weight, fat-free mass, and electrolyte concentrations (calcium, potassium, and sodium) have been known to affect baseline QT, and we explored their effect in the model on the base QTcF parameter and circadian model parameters (18, 19).
The development of the model and the inclusion of covariates were based on physiological plausibility; inspection of diagnostic plots, including visual predictive checks (20); and significant decreases in the objective function value (OFV). Between-subject variability was considered and tested on all parameters assuming log-normal distribution. The statistically significant cutoff for an additional degree of freedom (inclusion of 1 parameter) was a drop in OFV of at least 3.84 points, corresponding to a P value of <0.05. We used NONMEM 7.4 (21) for parameter estimation and Pirana, Perl-speaks-NONMEM (PsN) version 4.9.0, and Xpose4 (22) to aid in the model development process. Precisions of the final model parameters were obtained using sampling importance resampling (SIR) available in PsN (23).
Simulations.
We used the final model parameters to explore the risk of QT prolongation when using clofazimine regimens with 2 weeks of loading doses with 200 or 300 mg daily, followed by 100 mg daily compared with the standard dose of 100 mg daily from treatment start. We performed a simulation of 10,000 replicates using final parameter estimates of a typical tuberculosis patient in our cohort weighing 55 kg with a fat-free mass of 42 kg. The simulations considered the variability in the parameters of the pharmacokinetic and pharmacodynamic models. The simulated QTcF and ΔQTcF values were analyzed according to The International Council for Harmonisation of Technical Requirements for Pharmaceuticals for Human Use (ICH) guidelines, which recommend the following different limits and cutoff points when analyzing QT/QTc interval prolongation data (12): absolute QTc interval prolongation of >450, >480, and >500 ms or a change in QTc from baseline at >30 and >60 ms, respectively.
ACKNOWLEDGMENTS
We are grateful to the patients for their participation in the study and Jerry R. Nedelman for sharing the data.
The National Research Foundation provided funding to P.D. (grant 109056). M.T.A., P.D., and E.M.S. were supported by the Swedish Foundation for International Cooperation in Research and Higher Education (STINT) jointly with the South African National Research Council, National Research Foundation (NRF) (grant 101575). G.M. was supported by the Wellcome Trust (098316 and 203135/Z/16/Z), the South African Research Chairs Initiative of the Department of Science and Technology and National Research Foundation (NRF) of South Africa (grant no. 64787), NRF incentive funding (UID: 85858), and the South African Medical Research Council through its TB and HIV Collaborating Centers Program with funds received from the National Department of Health (RFA no. SAMRC-RFA-CC: TB/HIV/AIDS-01-2014). The 2-week bactericidal activity study was sponsored by TB Alliance (Global Alliance for TB Drug Development) with support from the Bill and Melinda Gates Foundation, the U.S. Agency for International Development, UK Department for International Development, Irish Aid, and Australia Department of Foreign Affairs and Trade.
Footnotes
Supplemental material is available online only.
REFERENCES
- 1.World Health Organization. 2020. WHO consolidated guidelines on tuberculosis: module 4: treatment: drug-resistant tuberculosis treatment. World Health Organization, Geneva, Switzerland. [PubMed] [Google Scholar]
- 2.Cholo MC, Mothiba MT, Fourie B, Anderson R. 2017. Mechanisms of action and therapeutic efficacies of the lipophilic antimycobacterial agents clofazimine and bedaquiline. J Antimicrob Chemother 72:338–353. 10.1093/jac/dkw426. [DOI] [PubMed] [Google Scholar]
- 3.Abdelwahab MT, Wasserman S, Brust JCM, Gandhi NR, Meintjes G, Everitt D, Diacon A, Dawson R, Wiesner L, Svensson EM, Maartens G, Denti P. 2020. Clofazimine pharmacokinetics in patients with TB: dosing implications. J Antimicrob Chemother 75:3269–3277. 10.1093/jac/dkaa310. [DOI] [PMC free article] [PubMed] [Google Scholar]
- 4.Xu J, Wang B, Hu M, Huo F, Guo S, Jing W, Nuermberger E, Lu Y. 2017. Primary clofazimine and bedaquiline resistance among isolates from patients with multidrug-resistant tuberculosis. Antimicrob Agents Chemother 61:e00239-17. 10.1128/AAC.00239-17. [DOI] [PMC free article] [PubMed] [Google Scholar]
- 5.Choudhri S, Harris L, Butany J, Keystone J. 1995. Clofazimine induced cardiotoxicity-a case report. Lepr Rev 66:63–68. [DOI] [PubMed] [Google Scholar]
- 6.Wallis RS. 2016. Cardiac safety of extensively drug-resistant tuberculosis regimens including bedaquiline, delamanid and clofazimine. Eur Respir J 48:1526–1527. 10.1183/13993003.01207-2016. [DOI] [PubMed] [Google Scholar]
- 7.Diacon AH, Dawson R, Von Groote-Bidlingmaier F, Symons G, Venter A, Donald PR, Van Niekerk C, Everitt D, Hutchings J, Burger DA, Schall R, Mendel CM. 2015. Bactericidal activity of pyrazinamide and clofazimine alone and in combinations with pretomanid and bedaquiline. Am J Respir Crit Care Med 191:943–953. 10.1164/rccm.201410-1801OC. [DOI] [PubMed] [Google Scholar]
- 8.Meid AD, Bighelli I, Mächler S, Mikus G, Carrà G, Castellazzi M, Lucii C, Martinotti G, Nosè M, Ostuzzi G, Barbui C, Haefeli WE. 2017. Combinations of QTc-prolonging drugs: towards disentangling pharmacokinetic and pharmacodynamic effects in their potentially additive nature. Ther Adv Psychopharmacol 7:251–264. 10.1177/2045125317721662. [DOI] [PMC free article] [PubMed] [Google Scholar]
- 9.Zareba W. 2007. Drug induced QT prolongation. Cardiol J 14:523–533. [PubMed] [Google Scholar]
- 10.Dannemann B, Bakare N, De Marez T, Lounis N, van Heeswijk R, Meyvisch P, Haxaire-Theeuwes M, Andries K, Everitt D, Upton A. 2012. QTcF prolongation in a Phase II trial of TMC207 plus background regimen as treatment for multidrug-resistant tuberculosis: effect of co-administration with clofazimine. 52nd Interscience Conference on Antimicrobial Agents and Chemotherapy, San Francisco, CA. [Google Scholar]
- 11.Svensson EM, Acharya C, Clauson B, Dooley KE, Karlsson MO. 2016. Pharmacokinetic interactions for drugs with a long half-life—evidence for the need of model-based analysis. AAPS J 18:171–179. 10.1208/s12248-015-9829-2. [DOI] [PMC free article] [PubMed] [Google Scholar]
- 12.ICH. 2005. The clinical evaluation of QT/QTc interval prolongation and proarrhythmic potential for non-antiarrhythmic drugs. http://www.ema.europa.eu/docs/en_GB/document_library/Scientific_guideline/2009/09/WC500002879.pdf. [PubMed]
- 13.Moon SJ, Lee J, An H, Yim DS, Chung JY, Yu KS, Cho JY, Lim KS. 2014. The effects of moxifloxacin on QTc interval in healthy Korean male subjects. Drugs R D 14:63–71. 10.1007/s40268-014-0040-1. [DOI] [PMC free article] [PubMed] [Google Scholar]
- 14.von Groote-Bidlingmaier F, Patientia R, Sanchez E, Balanag V, Ticona E, Segura P, Cadena E, Yu C, Cirule A, Lizarbe V, Davidaviciene E, Domente L, Variava E, Caoili J, Danilovits M, Bielskiene V, Staples S, Hittel N, Petersen C, Wells C, Hafkin J, Geiter LJ, Gupta R. 2019. Efficacy and safety of delamanid in combination with an optimised background regimen for treatment of multidrug-resistant tuberculosis: a multicentre, randomised, double-blind, placebo-controlled, parallel group phase 3 trial. Lancet Respir Med 7:249–259. 10.1016/S2213-2600(18)30426-0. [DOI] [PubMed] [Google Scholar]
- 15.Novartis Pharma. 2019. Lamprene (clofazimine) capsules: highlights of prescribing information. Novartis Pharmaceuticals Corporation, East Hanover, NJ. https://www.accessdata.fda.gov/drugsatfda_docs/label/2019/019500s014lbl.pdf. [Google Scholar]
- 16.Ishida S, Nakagawa M, Fujino T, Yonemochi H, Saikawa T, Ito M. 1997. Circadian variation of QT interval dispersion: correlation with heart rate variability. J Electrocardiol 30:205–210. 10.1016/S0022-0736(97)80005-2. [DOI] [PubMed] [Google Scholar]
- 17.Fernandez JR, Hermida RC, Mojon A. 2009. Chronobiological analysis techniques. Application to blood pressure. Philos Trans R Soc A 367:431–445. 10.1098/rsta.2008.0231. [DOI] [PubMed] [Google Scholar]
- 18.Malik M, Garnett C, Hnatkova K, Vicente J, Johannesen L, Stockbridge N. 2019. Implications of individual QT/RR profiles—part 1: inaccuracies and problems of population-specific QT/heart rate corrections. Drug Saf 42:401–414. 10.1007/s40264-018-0736-1. [DOI] [PMC free article] [PubMed] [Google Scholar]
- 19.Piotrovsky V. 2005. Pharmacokinetic-pharmacodynamic modeling in the data analysis and interpretation of drug-induced QT/QTc prolongation. AAPS J 7:E609–E624. 10.1208/aapsj070363. [DOI] [PMC free article] [PubMed] [Google Scholar]
- 20.Holfrod N. 2005. The visual predictive check—superiority to standard diagnostic (Rorschach) plot. The 14th Annual Meeting Population Approach Group Europe (PAGE), Pamplona, Spain. [Google Scholar]
- 21.Beal S, Sheiner L, Boeckmann A, Bauer RJ. 2019. NONMEM 7.4 users guides (1989–2019). ICON plc, Gaithersburg, MD. https://nonmem.iconplc.com/nonmem744. [Google Scholar]
- 22.Keizer RJ, Karlsson MO, Hooker A. 2013. Modeling and simulation workbench for NONMEM: tutorial on Pirana, PsN, and Xpose. CPT Pharmacometrics Syst Pharmaco 2:e50. 10.1038/psp.2013.24. [DOI] [PMC free article] [PubMed] [Google Scholar]
- 23.Lindbom L, Ribbing J, Jonsson EN. 2004. Perl-speaks-NONMEM (PsN)–a Perl module for NONMEM related programming. Comput Methods Programs Biomed 75:85–94. 10.1016/j.cmpb.2003.11.003. [DOI] [PubMed] [Google Scholar]
Associated Data
This section collects any data citations, data availability statements, or supplementary materials included in this article.
Supplementary Materials
Supplemental material. Download AAC.02687-20-s0001.pdf, PDF file, 1.0 MB (999.5KB, pdf)