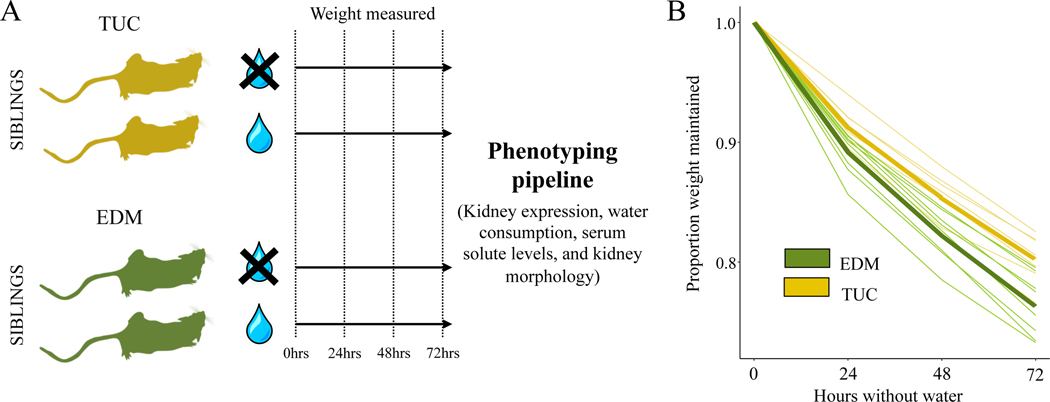
Figure 3. Experimental design and amount of weight maintained after water stress in two populations.
(A) Schematic of the experimental design utilized in this study. Siblings from the same litter were split between control (hydrated) and treatment (dehydrated) trials. They were weighed every 24 hours for 72 hours and then put through a phenotyping pipeline. (B) Tucson mice maintain significantly more weight after 72 hours of water restriction (p=0.027) exhibiting an attenuated response to water stress.

