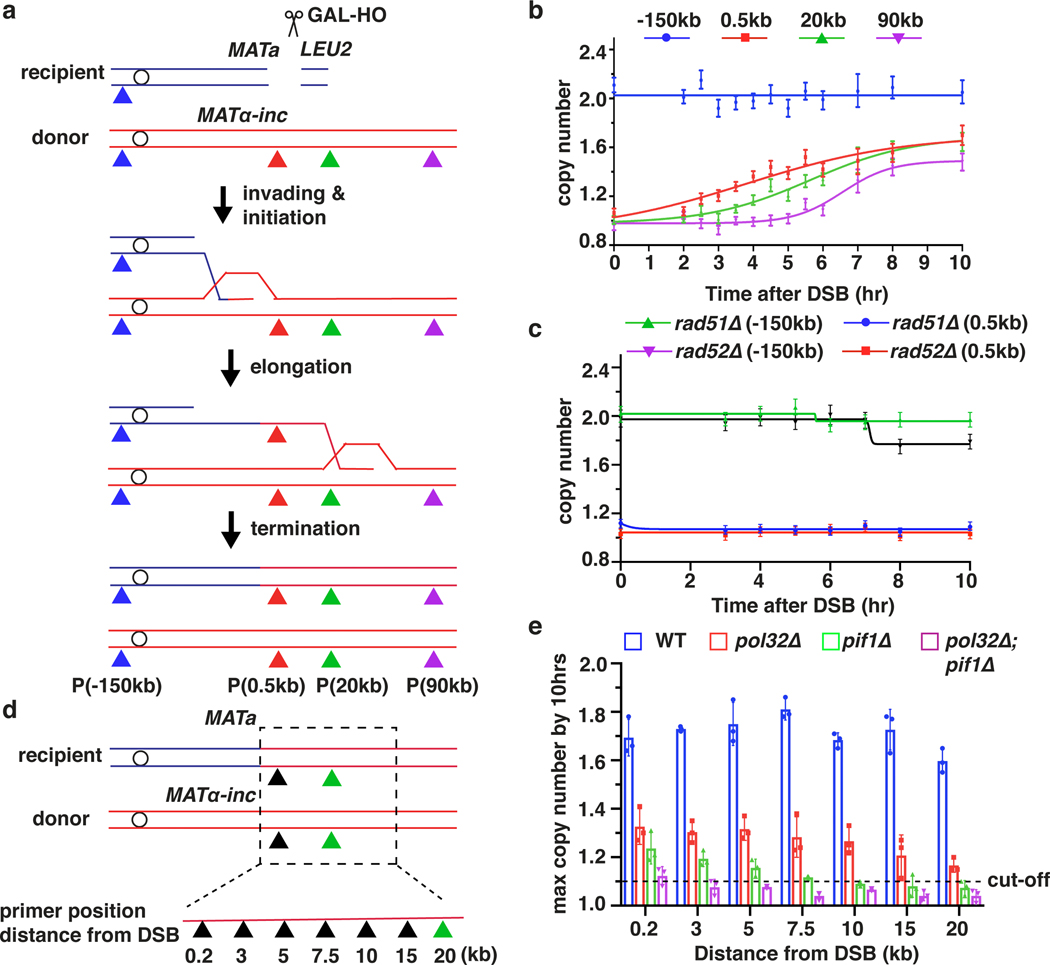
Figure 1. The dynamics, efficiency and rate of BIR synthesis determined by AMBER.
a, Schematic of BIR progression in disomic chromosome (Chr) III strain (AM1003) showing primer sets used for AMBER (see Methods). DSB is introduced into the recipient (top, blue) ChrIII by GAL-HO and repair occurs by copying the donor (bottom, red) ChrIII. Colored triangles: positions of primer sets with distance from MATα-inc indicated. b, DNA synthesis detected by AMBER. A Boltzmann sigmoidal 43 was used to fit the data (here and also most of figures generated from AMBER) and to determine (i) the time when 50% synthesis occurs and (ii) the rate of synthesis (the slope) at this time (V50) in this experiment for 0.5 kb, 20 kb and 90 kb (2.2 at 3.8hr, 1.5 at 5.6hr and 0.7 at 6.5hr respectively). c, AMBER analysis in rad51Δ and rad52Δ cells. b and c each represents one out of three independent biological repeats that showed similar results (see Supplementary Table 5 for other repeats). Mean values of target to reference (ACT1) loci ratios were calculated by Poisson distribution based on 10,000 droplets with error bars representing upper and lower Poisson 95%CI. (see Methods). d, Positions of primers used to characterize BIR in pol32Δ, pif1Δ, and pol32Δ pif1Δ indicated by triangles. e, The extent of DNA synthesis measured by AMBER in pol32Δ, pif1Δ, and pol32Δ pif1Δ at 10hr after galactose addition. The means ± SD are indicated (n=3 independent biological repeats).

