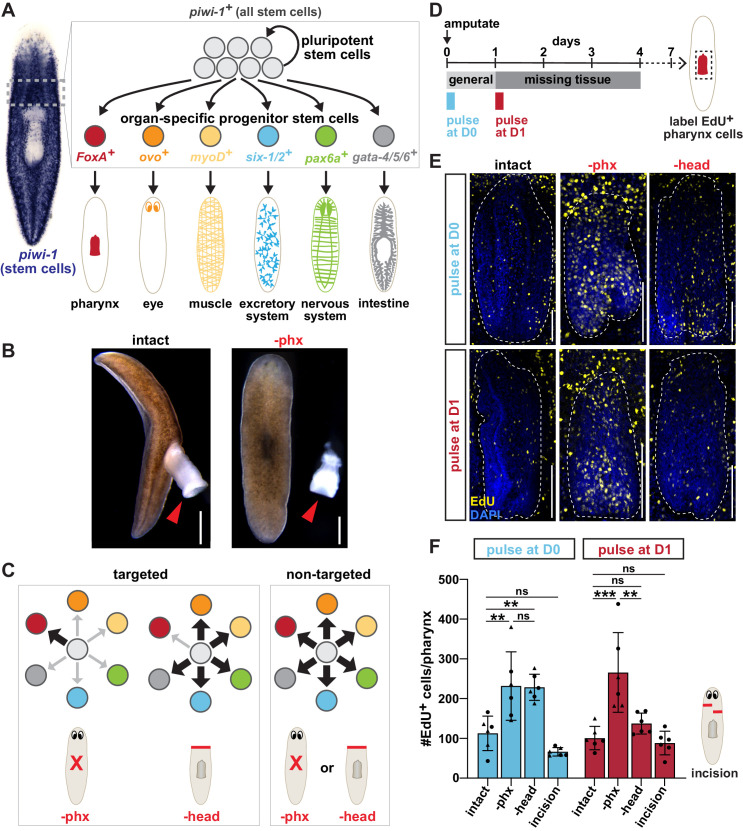
Figure 1. Both targeted and non-targeted mechanisms contribute to pharynx regeneration.
(A) Schematic of planarian stem cell lineage. Left, whole-mount in situ hybridization (WISH) for the stem cell marker piwi-1. Right, cartoon depiction of the dashed boxed region showing planarian stem cells consisting of pluripotent stem cells and organ-specific progenitors that produce planarian organs. Markers of organ-specific progenitors are indicated. (B) Live images of planarians before and after pharynx amputation. Arrows = pharynx; scale bars = 500 μm. (C) Models for targeted and non-targeted regeneration after different amputations (indicated by red lines). Progenitors are color coded as in A. (D) Schematic of F-ara-EdU delivery relative to amputation for E and F. (E) Confocal images of F-ara-EdU (yellow) in the pharynx (dashed outline) of intact animals, or 7 days after pharynx or head amputation. Dashed box in D = region imaged; DAPI = DNA (blue); scale bar = 100 μm. (F) Number of F-ara-EdU+ cells in the entire pharynx (dashed outline in E). Cartoon represents incision injuries. Graphs represent mean ± SD; symbols = individual animals; shapes distinguish biological replicates and; *, p≤0.05; **, p≤0.01; ***, p≤0.001; one-way ANOVA with Tukey test. Raw data can be found in Figure 1—source data 1.


