Abstract
Purpose
Sex determination can be done by morphological analysis of different parts of the body. The mastoid region, with its anatomical location at the skull base, is ideal for sex identification. Statistical shape analysis provides a simultaneous comparison of geometric information on different shapes in terms of size and shape features. This study aimed to investigate the geometric morphometry of the inter-mastoid triangle as a tool for sex determination in the Iranian population.
Materials and Methods
The coordinates of 5 landmarks on the mastoid process on the 80 cone-beam computed tomographic images (from individuals aged 17-70 years, 52.5% female) were registered and digitalized. The Cartesian x-y coordinates were acquired for all landmarks, and the shape information was extracted from the principal component scores of generalized Procrustes fit. The t-test was used to compare centroid size. Cross-validated discriminant analysis was used for sex determination. The significance level for all tests was set at 0.05.
Results
There was a significant difference in the mastoid size and shape between males and females (P<0.05). The first 2 components of the Procrustes shape coordinates explained 91.3% of the shape variation between the sexes. The accuracy of the discriminant model for sex determination was 88.8%.
Conclusion
The application of morphometric geometric techniques will significantly impact forensic studies by providing a comprehensive analysis of differences in biological forms. The results demonstrated that statistical shape analysis can be used as a powerful tool for sex determination based on a morphometric analysis of the inter-mastoid triangle.
Keywords: Mastoid, Cone-Beam Computed Tomography, Sex Determination Analysis by Skeleton
Introduction
Identification using human remains is legally and socially important. Sex determination of victims is one of the most vital steps in forensic identification. In critical situations and conditions, for reasons such as body decomposition and severe burns, sex determination based on skeletal remains is necessary.1,2
Sex determination can be done by morphological analysis of various body parts, such as the pelvis, skull, and teeth. Sex is mainly determined by the shape of the pelvic bone, but the pelvic bone may be unavailable under certain circumstances.3,4 The mastoid process, which is part of the temporal bone, is an area of the skull that can be used for sex determination due to its resistance to physical injury and its ability to differentiate between men and women.1,2,5,6,7,8 The mastoid process is a prominent and posterior conical bone protrusion located posterior to the outer auditory part of the temporal bone.5,6,7,8 The mastoid area is suitable for the study of sexual dimorphism as a portion of the skull that is immune to injury due to its anatomical location at the base of the skull. Numerous past examinations have indicated that the mastoid is a valuable cranial area for determining sex. The tip of the mastoid is vertical in males and internal in females. For the macroscopic determination of sex based on bones, the mastoid area is of particular importance.5,6,7,8,9
Analyses of the mastoid area morphology for sex determination, like many other shape-based biological investigations in the field of forensics, usually involve using a combination of linear measurements, angular measurements, or indicators derived from these measurements, and then applying standard univariate and multivariate statistical techniques to make a prediction from these measurements.1,2,5,6,7,8 However, those measurements may not provide a detailed description of the morphology of the area in question.
According to studies analyzing the mastoid process for sex determination, women have a smaller mastoid region than men. However, focusing on the size of the area can be confusing, as there are situations where the 2 sexes have mastoid processes of the same size, but with different shapes.9 A configuration-based analysis of landmarks allows one to work with the full geometry of objects, a problem ignored in other analyses.9
Geometric morphometry allows the separation of size information, while still retaining the full shape information of the study area. This feature enables a much broader spectrum of comparisons of groups or even sexes than traditional metric measurements. Geometrical morphometry has various applications in several scientific fields, including forensic anthropology, zoology, biology, and archeology. Geometrical morphometry also plays an important role in forensics.9,10,11,12,13,14
Statistical shape analysis, as a new branch of multivariate statistics, involves the analysis of the geometric properties of a set of shapes using statistical methods. Today, with rapid developments of technology, accessing geometric information on objects is straightforward and their shape analysis has become of vital importance.12
Sex determination using the morphological evaluation of skeletal areas is one of the most important issues in the field of forensic medicine. Moreover, statistical shape analysis provides a simultaneous comparison of geometric information for different shapes in terms of size and shape features. The purpose of this study was to investigate the geometric morphometry of the inter-mastoid triangle as a tool for sex determination using statistical shape analysis.
Materials and Methods
In this retrospective study, 80 cone-beam computed tomographic (CBCT) images from 42 females and 38 males drawn from patients referred to Department of Oral and Maxillofacial Radiology, Hamadan Dental School (in western Iran) aged 18 to 70 years were studied. The inclusion criteria were all CBCT scans designed for implant replacement and other therapeutic purposes. The exclusion criteria were images with severe artifacts, images that did not show anatomical details of the inter-mastoid region, and images of patients with a maxillofacial anomaly.
To ensure that this study followed appropriate ethical guidelines, all information provided was treated as personal by the researcher, and the names of individuals were not included in the analysis and reporting stage. Ethical approval for the study was granted by the Ethics Committee of Hamadan University of Medical Sciences (IR.UMSHA.REC.1399.323).
All reviewed CBCT scans were provided by NewTom 3G (QR srl, Verona, Italy) with a peak kilovoltage of 110 kVp, a tube current of 3.87 mA, an exposure time of 3.6 s, a voxel size of 180 µm voxel size, and a 12-inch field of view and stored in NNT viewer software version 10 (QR srl, Verona, Italy). First, the CBCT images were saved to Digital Imaging and Communications in Medicine format and transferred to On-Demand 3D dental software (version: 1.0.5385, Cybermed Inc, Seoul, Korea), and then a 3-dimensional (3D) image was created.
The patient's head position during the CBCT examination was fixed with the lateral head supports and nasal support of the CBCT device, and after adjusting the midsagittal line and Frankfurt line parallel to the ground, the correct position was ensured by the scout image. Furthermore, during the reconstruction, if necessary, the patient's head was rotated so that the Frankfurt plane was parallel to the ground. Therefore, the head was adjusted with a consistent orientation in the 3D image.
Indirect volume rendering or segmentation requires selection of the intensity or density of the gray-scale level of the voxels to be displayed within an entire data set, and it provides a volumetric surface reconstruction with depth; the gray-scale level of the voxels that is optimal for bone surface visualization was selected, and anatomical points were determined on this surface.
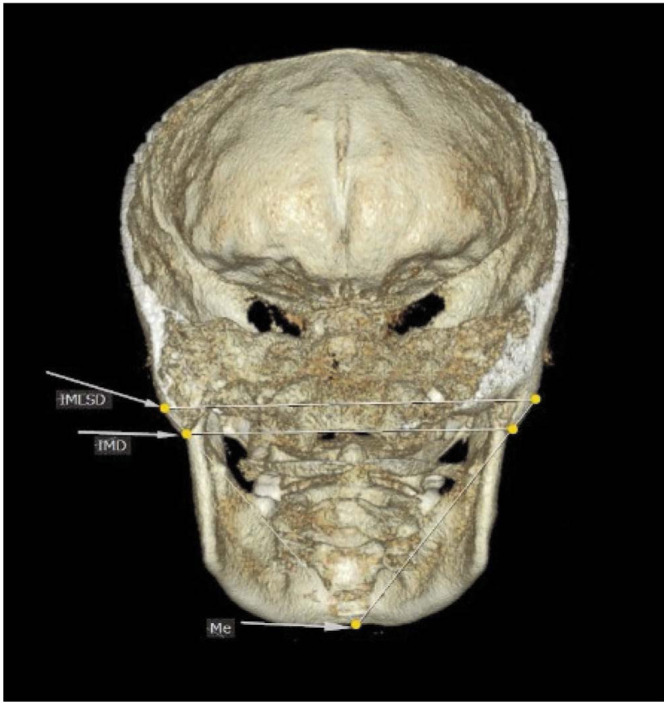
Using TpsDig2 (version 1.11, https://tpsdig2.software.informer.com/download), 2 anatomical landmarks on the right and left mastoids, respectively, and one landmark on the mandibular bone on the posterior view of the 3D image were identified. The identified landmarks were as follows; the most prominent point on the convex lateral surface of the mastoid process, the lowest point of the mastoid process (mastoidale), and the lowest point on the mandibular symphysis (menton). Then, the following lines were drawn: inter-mastoidal distance (defined as the distance between the right and left mastoidales), the inter-mastoidal lateral surface distance (defined as the distance between the most prominent point of the convex surface of the right and left mastoids), and the distance between the menton and the most prominent point of the convex surface of the right and left mastoids. Subsequent analyses are performed on the triangle resulting from the intersection of these lines.
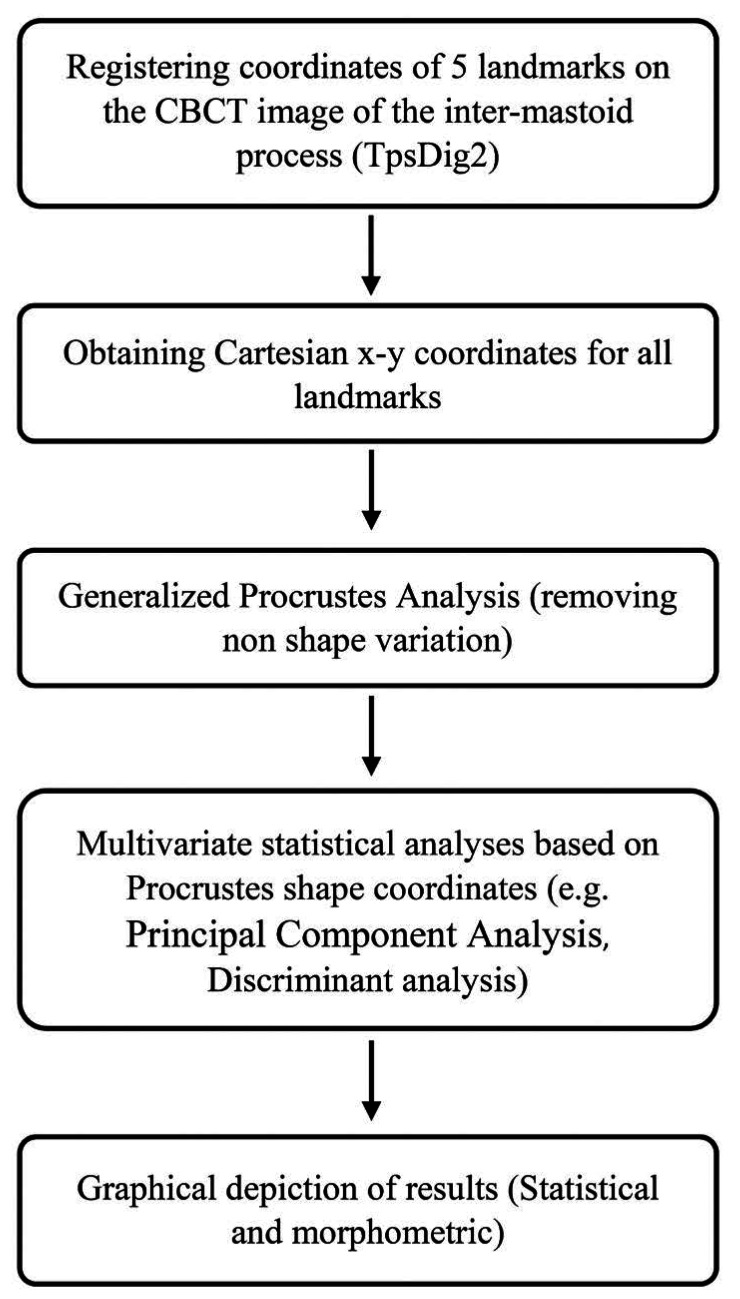
The steps of the statistical shape analysis are briefly presented in Figure 1. Shape analysis was performed based on a 2-dimensional geometric morphometric evaluation of outlines from photographs of the CBCT image of the intermastoid process. The coordinates of 5 landmarks on the mastoid process image were registered (Fig. 2) using the TpsDig2 software. Once the Cartesian x-y coordinates had been obtained for all landmarks, the shape information was extracted with a generalized Procrustes fit. Procrustes superimposition is a method that removes information regarding size, position, and orientation to standardize each specimen according to centroid size.11,12
Fig. 1. Methodological steps of the study.
Fig. 2. Landmark positions on a woman's skull.
The digitalization of landmarks was carried out by the same researcher in 2 replicates to compensate for possible errors. The Euclidean distance between repeated measurements of identical landmarks was calculated, and if the difference was larger than 1 mm, the whole set of landmarks was re-digitized.
Procrustes shape coordinates were used as variables in the following multivariate statistical analyses. The main axes of shape variation were described using principal component analysis from the Procrustes shape coordinates.12 Principal component analysis was performed to determine the percentage of the total variation explained by each principal component. The principal component scores were used as new variables to represent the shape.15 Mean shape differences were examined using permutation tests (1,000 iterations) based on the Procrustes distance and the T-square statistic for the Mahalanobis distances. The centroid size, which was calculated from the square root of the sum of the square distances of the anatomical landmarks to the centroid, was used to describe the mastoid size.16 The centroid size was saved as a separate variable for testing size differences. The t-test was used for comparing centroid size between 2 sexes.
Discriminant analysis with a cross-validation method was used for sex prediction based on the shape information of the mastoid region.17 Data were analyzed using R3.5.1 (R Core Team, 2020, https://www.R-project.org/) statistical software (with the shape package). The significance level for all tests was set at 0.05.
Results
No significant difference was found in mean age between males (32.31±11.25 years) and females (28.75±10.72 years) (P>0.05).
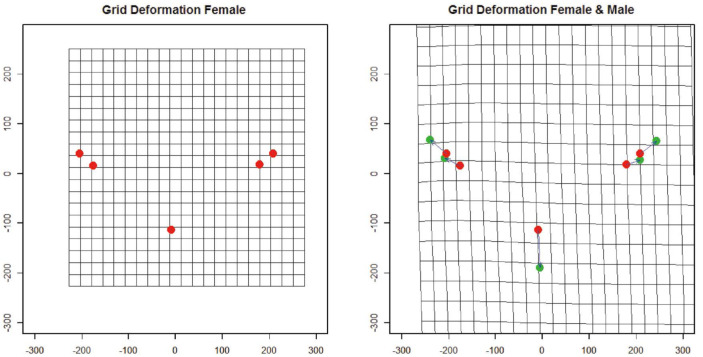
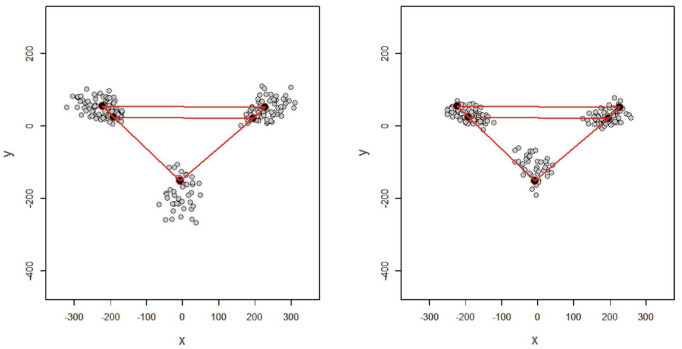
Shape variance was visualized in the form of wire-frame graphs (Fig. 3). The variation of all anatomical landmarks is shown in Figure 4. In both sexes, the anatomical landmarks that showed the greatest variation were, respectively: the menton (the lowest point on the edge of the mandible in the symphysis), which was shorter in females; and the most prominent point on the lateral surface of the convex mastoid triangle and the mastoidale (the lowest point of the mastoid triangle), and males showed a wider and larger mastoidale distance.
Fig. 3. Thin-plate spline transformation grids representing variation in the shape of the inter-mastoid process.
Fig. 4. Variation in each landmark sex after applying generalized Procrustes analysis (the most prominent point on the convex lateral surface of the mastoid process, the lowest point of the mastoid process [mastoidale], and the lowest point on the edge of the mandible in the symphysis [menton]).
The PROTEST, a permutation test based on a Procrustes statistic that was developed to compare multivariate data sets, was used to evaluate the differences between the 2 replicates of identical landmarks. The results confirmed that the series was highly correlated (Procrustes pseudo-correlation=0.96, P<0.05), indicating a high degree of consistency in landmark digitalization.
Sexual size dimorphism was observed, with males having larger mastoid sizes (Figs. 5 and 6). The difference in the mean mastoid size (centroid size) between males and females was statistically significant (mean±SD, males: 502.18±63.23 mm; females: 408.03±49.16 mm; P<0.05).
Fig. 5. Representation of landmarks in men and women and their comparison with the mean. A. Mean shape of male. B. Mean shape of female.
Fig. 6. Schematic comparison between the mean shapes of the mastoid process in males (dashed) and females (solid) registered using the Procrustes shape coordinate system.
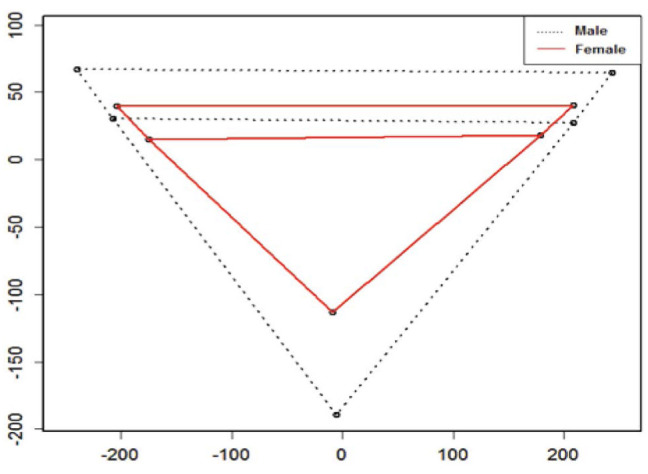
Additionally, the permutation test (1,000 iterations) using the Procrustes distance and the T-square statistic was used to test mean shape differences. A significant difference in mastoid shape was found between the sexes (Procrustes distance=0.1251395, P<0.05).
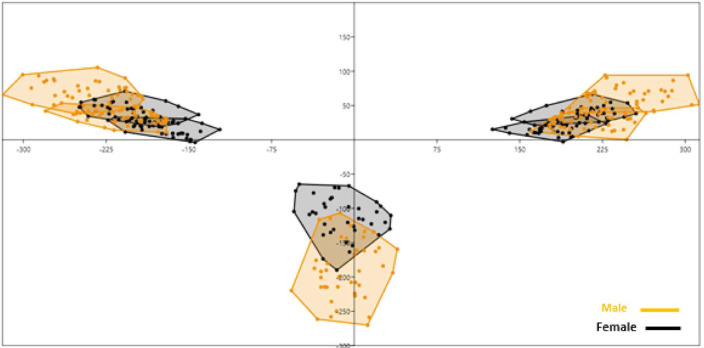
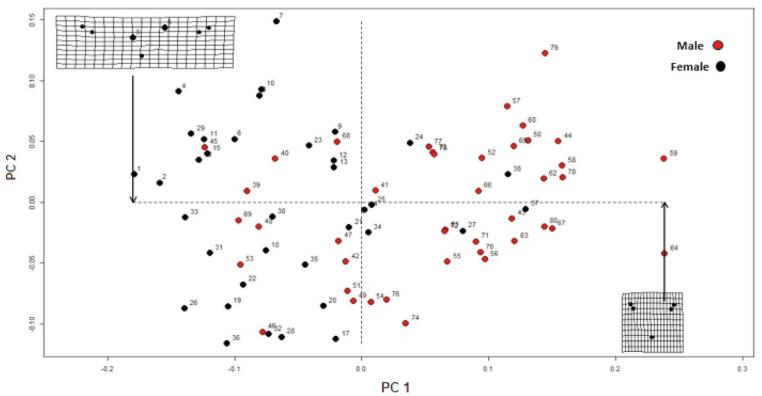
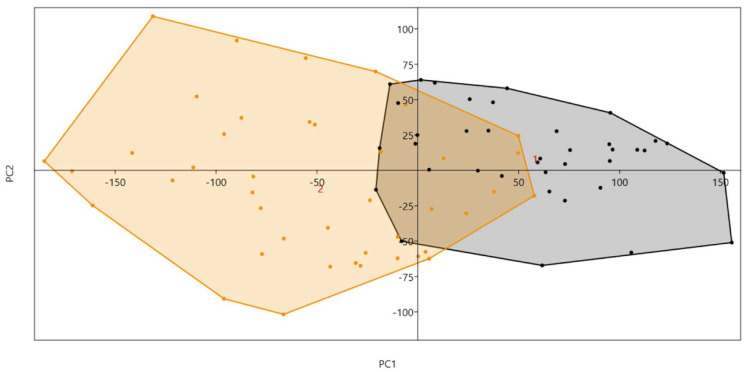
In the principal component analysis, the first 2 components of Procrustes shape coordinates explained 91.3% of shape variance between the sexes. Specimens of different sexes occupied different areas of the principal component space if they differed in shape (Figs. 7 and 8).
Fig. 7. The first 2 principal components of Procrustes shape coordinates explain shape variation between the sexes.
Fig. 8. Sex determination based on the first and second principal components.
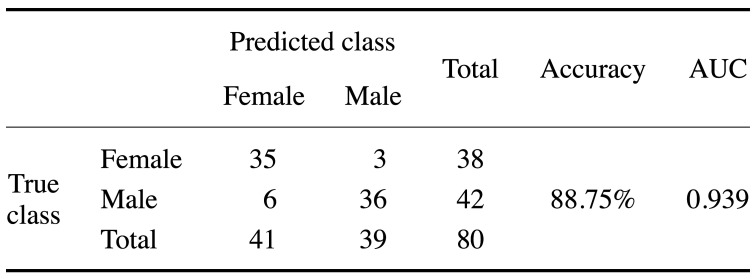
To analyze the classification of the 2 sexes based on shape variance (after the Procrustes fitting procedure), discriminant analysis was conducted. The reliability of the discrimination was assessed through leave-one-out cross-validation. The results showed that the percentage of correct classification from the discriminant analysis was 88.8%. The discriminant function misclassified only 9 out of 80 subjects (6 for females and 3 for males) (Table 1).
Table 1. Confusion matrix for sex determination based on discriminant analysis.
Discussion
The present study aimed to test sex identification based on the morphology of the inter-mastoid process using a 2-dimensional geometric morphometry method. Since this method can be used to independently assess variation in terms of size and shape, it is an ideal approach for exploring sex differences. By isolating size from the data, this method can detect shape differences more accurately than previous metric methods.
This study identified sex differences in the morphology of the inter-mastoid process in terms of both size and shape. Thus, sex identification can be conducted based on differences in the morphology of this area, even in people with similar mastoid sizes. However, since the present study was conducted among an Iranian population, more investigations should be conducted to generalize the results of the study to other communities.
A significant difference was found in mastoid size between males and females (as shown by mean centroid size). Females had a smaller mastoid process than males. Furthermore, based on the Procrustes distance, the mastoid shape was significantly different between the sexes. The results showed that the percentage of correct classification from the discriminant analysis based on shape variance after the Procrustes fitting procedure was 88.8%.
Our findings are novel in that no previous study has used a geometrical morphometric method to determine sex by measurements of the mastoid region. Many studies have used classical methods involving linear measurements of mastoid parameters for sex determination, including Mishra et al. in 2019, who analyzed sex determination using the mastoid process by studying 100 dry skulls. They showed that there were significant differences between men and women in linear measurements of the mastoid region.18
Amin et al. conducted a study in 2015 on sex determination using linear measurements of mastoid length and area from 192 3D skull images (96 females and 96 males). A discriminant analysis model using these linear measurements concluded that the classification model accurately distinguished 90.6% of males and females.2
In 2015, Passey et al.6 aimed to use linear measurements of the mastoid process as a tool for sex determination. The study examined 70 healthy skulls, including 44 men and 26 women whose sex was known. Mastoid lengths on the right and left sides of each skull were measured. The results of their study showed that mastoid length was significant for sex determination. Manoonpol et al.,1 in 2012, examined 100 skulls (60 males and 40 females) for sex determination. The mastoid triangle was measured between 3 points (the mastoidale, porion, and asterion). The distances between these 3 points were calculated using the Aaron formula. The t-test and linear discriminant analysis showed that the area of the triangular mastoid in men was significantly larger than in women. In 2018, Ibrahim et al.5 examined 388 computed tomographic scans of 231 men and 157 women skulls. A comparison of means using the t-test showed that there was no significant difference between the 2 sides (right and left) in both sexes, but the mastoid triangle perimeter showed a significant difference between men and women. Saini et al.8 conducted a study on sex determination using the mastoid skull process in the North Indian adult population. In this study, 8 parameters were measured from the mastoid area, and the results showed that the asterion-mastoidale and mastoid area identified the sex of individuals with 87% accuracy.
The application of morphometric geometric techniques will have a major impact on forensic studies by enabling a comprehensive analysis of differences in biological forms. In this study, statistical shape analysis for sex determination based on the mastoid process was evaluated. The results demonstrated that this powerful tool can be used in the field of forensic science.
Footnotes
This work was supported by the Dental Research Center, Vice-Chancellor of Research, Hamadan University of Medical Sciences. (Grant number: 9905283334)
Conflicts of Interest: None
References
- 1.Manoonpol C, Plakornkul V. Sex determination using mastoid process measurement in Thais. J Med Assoc Thai. 2012;95:423–429. [PubMed] [Google Scholar]
- 2.Amin W, Saleh MW, Othman D, Salhab D, Thunaibat H. Osteometric assessment of the mastoids for sex determination in Jordanians by discriminant function analysis. Am J Med Biol Res. 2015;3:117–123. [Google Scholar]
- 3.Afrianty I, Nasien D, Kadir MR, Haron H. Determination of sex from pelvic bones and patella in forensic anthropology: a comparison of classification techniques. In: Al-Dabass D, Saad I, Mohamad KA, Hijazi MH, editors. First International Conference on Artificial Intelligence, Modelling and Simulation; 2013 Dec 3-5; Kota Kinabalu, Sabah, Malaysia IEEE Inc. 2013. pp. 3–7. [Google Scholar]
- 4.Ramakrishnan K, Sharma S, Sreeja C, Pratima DB, Aesha I, Vijayabanu B. Sex determination in forensic odontology: a review. J Pharm Bioallied Sci. 2015;7(Suppl 2):S398–S402. doi: 10.4103/0975-7406.163469. [DOI] [PMC free article] [PubMed] [Google Scholar]
- 5.Ibrahim A, Alias A, Shafie MS, Das S, Nor FM. Osteometric estimation of sex from mastoid triangle in Malaysian population. Asian J Pharm Clin Res. 2018;11:303–307. [Google Scholar]
- 6.Passey J, Mishra SR, Singh R, Sushobhana K, Singh S, Sinha P. Sex determination using mastoid process. Asian J Med Sci. 2015;6:93–99. [Google Scholar]
- 7.Petaros A, Sholts SB, Slaus M, Bosnar A, Wärmländer SK. Evaluating sexual dimorphism in the human mastoid process: a viewpoint on the methodology. Clin Anat. 2015;28:593–601. doi: 10.1002/ca.22545. [DOI] [PubMed] [Google Scholar]
- 8.Saini V, Srivastava R, Rai RK, Shamal SN, Singh TB, Tripathi SK. Sex estimation from the mastoid process among North Indians. J Forensic Sci. 2012;57:434–439. doi: 10.1111/j.1556-4029.2011.01966.x. [DOI] [PubMed] [Google Scholar]
- 9.Ibrahim A, Alias A, Shafie MS, Nor FM. Application of three dimensional geometric morphometric analysis for sexual dimorphism of human skull: a systematic review. IIUM Med J Malaysia. 2019;18:131–143. [Google Scholar]
- 10.Azofra-Monge A, Alemán Aguilera I. Morphometric research and sex estimation of lumbar vertebrae in a contemporary Spanish population. Forensic Sci Med Pathol. 2020;16:216–225. doi: 10.1007/s12024-020-00231-6. [DOI] [PubMed] [Google Scholar]
- 11.Bookstein FL. Landmark methods for forms without landmarks: morphometrics of group differences in outline shape. Med Image Anal. 1997;1:225–243. doi: 10.1016/s1361-8415(97)85012-8. [DOI] [PubMed] [Google Scholar]
- 12.Dryden IL, Mardia KV. Statistical shape analysis: with applications in R. 2nd ed. Hoboken: John Wiley & Sons Inc; 2016. pp. 69–97. [Google Scholar]
- 13.Franklin D, Cardini A, O'Higgins P, Oxnard CE, Dadour I. Mandibular morphology as an indicator of human subadult age: geometric morphometric approaches. Forensic Sci Med Pathol. 2008;4:91–99. doi: 10.1007/s12024-007-9015-7. [DOI] [PubMed] [Google Scholar]
- 14.Zelditch ML, Swiderski DL, Sheets HD, Fink WL. Geometric morphometrics for biologists: a primer. San Diego: Elsevier Academic Press; 2004. pp. 1–20. [Google Scholar]
- 15.Masters BC, Fan V, Ross HA. Species Delimitation - a Geneious plugin for the exploration of species boundaries. Mol Ecol Resour. 2011;11:154–157. doi: 10.1111/j.1755-0998.2010.02896.x. [DOI] [PubMed] [Google Scholar]
- 16.Adams DC, Rohlf FJ, Slice DE. Geometric morphometrics: ten years of progress following the ‘revolution’. Ital J Zool. 2004;71:5–16. [Google Scholar]
- 17.Viscosi V, Cardini A. Leaf morphology, taxonomy and geometric morphometrics: a simplified protocol for beginners. PLoS One. 2011;6:e25630. doi: 10.1371/journal.pone.0025630. [DOI] [PMC free article] [PubMed] [Google Scholar]
- 18.Mishra R, Gupta M, Rajni, Adhikari SR. Morphometric measurements of mastoid process for gender differentiation in dried skull. IOSR-JDM. 2019;18:1–6. [Google Scholar]


