

Summary
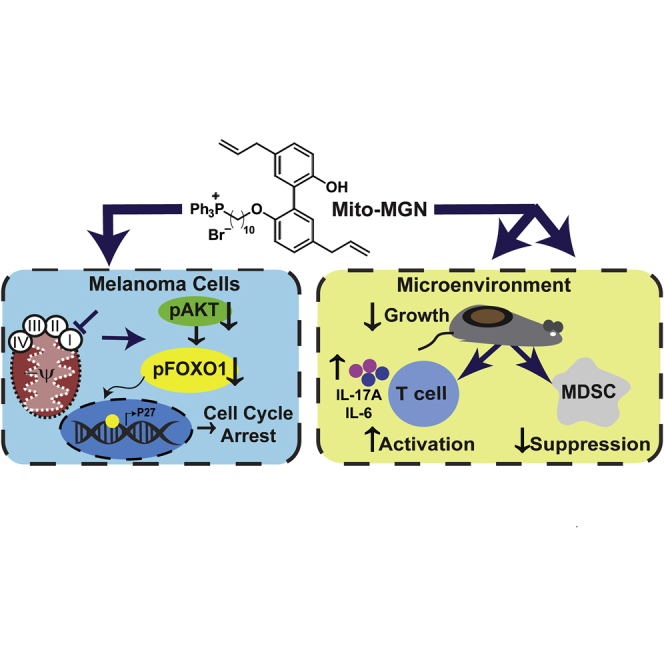
Metabolic heterogeneity within the tumor microenvironment promotes cancer cell growth and immune suppression. We determined the impact of mitochondria-targeted complex I inhibitors (Mito-CI) in melanoma. Mito-CI decreased mitochondria complex I oxygen consumption, Akt-FOXO signaling, blocked cell cycle progression, melanoma cell proliferation and tumor progression in an immune competent model system. Immune depletion revealed roles for T cells in the antitumor effects of Mito-CI. While Mito-CI preferentially accumulated within and halted tumor cell proliferation, it also elevated infiltration of activated effector T cells and decreased myeloid-derived suppressor cells (MDSC) as well as tumor-associated macrophages (TAM) in melanoma tumors in vivo. Anti-proliferative doses of Mito-CI inhibited differentiation, viability, and the suppressive function of bone marrow-derived MDSC and increased proliferation-independent activation of T cells. These data indicate that targeted inhibition of complex I has synchronous effects that cumulatively inhibits melanoma growth and promotes immune remodeling.
Subject areas: Components of the immune system, Cell biology, Cancer
Graphical abstract
Highlights
-
•
Mitochondria-targeted magnolol potently inhibits melanoma growth and progression
-
•
Mito-magnolol inhibits complex I and stimulates cell-cycle arrest
-
•
Mito-magnolol enhances T cell infiltration into melanoma tumors
-
•
Mito-magnolol enhances T cell activation, and inhibits MDSC function
Components of the immune system; Cell biology; Cancer
Introduction
Melanoma is among the most aggressive and detrimental forms of skin cancer, with increasing incidence and mortality rates (Batus et al., 2013) While kinase inhibitors and neutralizing immune checkpoint antibodies have improved clinical outcomes in melanoma patients, resistance to front-line therapies remains a significant concern (Abildgaard et al., 2014; Batus et al., 2013; Gide et al., 2018; Miller et al., 2016). Metabolic reprogramming of cancer cells from aerobic glycolysis to oxidative phosphorylation (OXPHOS), i.e. the reverse Warburg effect, is a key mechanism underlying therapeutic resistance (Abildgaard et al., 2014; Domingues et al., 2018; Tsao et al., 2004). Emerging research suggests that OXPHOS metabolism plays key roles in cancer progression, not only as an energy source but as a generator of building blocks to biosynthetic pathways that lead to the generation of glycosylation precursors, nucleotides, amino acids, and lipids (Kawada et al., 2017; Maertin et al., 2017; Sancho et al., 2015; Sousa et al., 2016; Vander Heiden et al., 2009; Zhou et al., 2018). Thus, the dependence of cancer cells on OXPHOS for survival provides a therapeutic window for inhibitors of mitochondrial respiration to mitigate tumor growth and therapeutic resistance (Molina et al., 2018). To date, in early clinical trials of OXPHOS inhibitors have had limited potency, selectivity, and/or confounding off-target effects that have hindered their translation to the clinic (Dykens et al., 2008; Molina et al., 2018; Sanchez et al., 2008; Wang et al., 2002).
Although the effects of OXPHOS inhibition on cancer cells in culture and preclinical models have shown promise (Boyle et al., 2018; Bridges et al., 2014; Cheng et al., 2014, 2015, 2016; Dykens et al., 2008; Kalyanaraman et al., 2018; Molina et al., 2018), numerous cancers develop a battery of cellular and acellular features that together promote immune evasion and suppression. Much like metabolic heterogeneity in transformed cancer cells, immune cells in the tumor microenvironment, including exhausted effector T cells, regulatory T cells (Treg), suppressive tumor-associated macrophages (TAM), and myeloid-derived suppressor cells (MDSC) that inhibit anti-tumor immune responses, rely on OXPHOS metabolism as a key energy source (Hossain et al., 2015; Le Bourgeois et al., 2018; Li et al., 2018; Sena et al., 2013). Indeed, recent reports have demonstrated that immunosuppressive cells carry out their suppressive function in part though metabolites downstream of OXPHOS and the TCA cycle (Dhanasekaran et al., 2005; Murray, 2016; Pan et al., 2018). Further, cancer cells may also promote the skewing of immune cells toward a more suppressive phenotype by depleting or sequestering essential metabolites necessary for anti-tumor immunity (Hossain et al., 2015; Le Bourgeois et al., 2018; Li et al., 2018; Murray, 2016; Sena et al., 2013). For instance, MDSC recruited by cancer cells have been implicated in depleting metabolites such as arginine and cysteine from the tumor microenvironment, exacerbating immune evasion by stifling cytotoxic T cells and promoting Treg proliferation (Hossain et al., 2015; Le Bourgeois et al., 2018; Li et al., 2018; Murray, 2016; Sena et al., 2013). Collectively, these reports suggest diverse and critical functions for OXPHOS metabolism and mitochondrial respiration in cancer immune evasion. Strategies to precisely influence metabolic reprogramming in immune cells to specifically inhibit suppressive cells and promote anti-tumor immunity and/or enhance immunotherapy could have significant potential.
Over the past decade our group has synthesized mitochondria-targeted agents by conjugating the triphenylphosphonium cation (TPP+) to varying chemical payloads to generate TPP+-linked agents that potently and selectively target the more negative mitochondria of cancer cells (Boyle et al., 2018; Cheng et al., 2012, 2014, 2015, 2016). These mitochondria-targeted agents preferentially accumulate in tumor cells relative to normal cells and lack the toxicity associated with traditional mitochondrial respiration inhibitors (Bridges et al., 2014; Kalyanaraman et al., 2018). Compared to the untargeted parent molecule, TPP+-conjugated analogs are 100 to 1,000 times more potent in inhibiting tumor cell proliferation and act as inhibitors of mitochondrial respiration (Kalyanaraman et al., 2018). Thus, OXPHOS metabolically reprogrammed cancer cells are predicted to be increasingly susceptible to mitochondria-targeted inhibitors. Further, T cells may possess a more hyperpolarized mitochondrial membrane potential, suggesting those cells may also be targeted by TPP-conjugated compounds (Sukumar et al., 2016). Here, we show that targeted inhibition of complex-I using Mito-MGN (Cheng et al., 2020) has tumor intrinsic and tumor extrinsic immune remodeling effects in an immune competent mouse model. Moreover, direct treatment of Mito-MGN stimulated the concomitant inhibition of melanoma proliferation with the proliferation-independent activation of T cells and inhibition of MDSC within tumors.
Results
Targeted inhibition of complex I attenuates melanoma proliferation in vitro and progression in vivo
A range of TPP+-conjugated Mito-CI probes potently inhibit mitochondrial respiration and inhibit cell proliferation in reductionist and preclinical xenograft models (Cheng et al., 2013, 2014, 2016). To improve the translational potential of these mitochondria-targeted probes we recently conjugated TPP+ to magnolol, a bioactive polyphenol from magnolia to create a new Mito-CI termed Mito-MGN (Figure 1A) (Cheng et al., 2020). Murine melanoma cells were selected as they readily engraft in immune competent mice, allowing rigorous dissection of tumor intrinsic as well as possible off-tumor, tumor extrinsic, mechanisms of targeted inhibition of complex I. Representative growth curves (FiguresS1A–S1D) and photomicrographs (Figure S1E) indicated that cell confluency, a surrogate measure of growth, was dose dependently decreased in two melanoma cell lines treated with Mito-MGN or magnolol (MGN). Logarithmic growth fit curve calculations revealed that Mito-MGN was ∼200 times more potent than MGN (Figures1B and 1C). Analyses of a non-mitochondria-targeted OXPHOS inhibitor, IACS-010759, currently in clinical trials (Molina et al., 2018), or a second cancer-inhibitory mitochondria-targeted compound, Mito-CP, revealed that Mito-MGN [B16F0 IC50 = 116 nM and B16F10 IC50 = 386 nM] (Figures1B and 1C) was more efficacious than either IACS-010759 [B16F0 IC50 = 0.68 μM and B16F10 IC50 = 0.58 μM] (FiguresS1F–S1H) or Mito-CP [B16F0 IC50 = 1.12 μM and B16F10 IC50 = 2.70 μM] (FiguresS1I–S1K) in inhibiting melanoma cell proliferation.
Figure 1.

Mito-MGN inhibitory effects on murine melanoma
(A) Chemical structure of TPP+-conjugated mitochondria-targeted magnolol (Mito-MGN).
(B and C) Logarithmic dose response fit curves of MGN (B) or Mito-MGN (C) on B16.F10 cell confluency. Values are mean ± SD. Mito-MGN, n = 4 and MGN, n = 3, biological replicates, each experiment completed in technical triplicates. IC50 values calculated from confluency curves shown in Figure S1.
(D) Melanoma engraftment and treatment schedule. B16.F10 melanoma engrafted mice were treated with 0.25, 0.5, 1.0 mg/tumor Mito-MGN or vehicle control.
(E) Kaplan-Meier survival curve. 1 mg Mito-MGN (n = 8-12). Significance was determined using a Mantel-Cox test (∗∗∗∗, p< 0.0001) of 8-12 individual mice from 2-3 separate replicate cohorts per group.
(F) Tumor area measured in situ from vehicle and Mito-MGN-treated mice. Values are mean ± SD of 5 individual mice.
(G) Tumor volume measured ex vivo from vehicle and Mito-MGN-treated mice. Values are mean ± SD. Significant differences were determined by Student's t-test (∗∗∗∗, p< 0.0001).
(H) Representative histopathologic images of H&E stained (upper panels) or Ki67 immunostained (lower panels) control or treated melanoma tumors. Data representative of 8-12 individual vehicle control or Mito-MGN-treated mice.
To date, studies of metabolic inhibitors have relied largely on xenograft models to measure preclinical efficacy. The B16 murine melanoma model is a well-established immunogenic tumor that forms palpable tumors in 5–10 days (Overwijk and Restifo, 2001). To test whether Mito-MGN controlled melanoma growth and tumor progression in vivo, we treated B16.F10 tumor-engrafted mice with 0.25, 0.5, or 1 mg Mito-MGN or vehicle as a control (Figure 1D). Mito-MGN provided a powerful survival benefit to melanoma-bearing mice, with the 1mg dose eliciting significantly longer survival with ∼80% surviving through study end, at which point each of the control mice had succumbed to tumor burden (Figure 1E). Mito-MGN significantly reduced tumor growth as measured by a decrease in in vivo tumor area (Figure 1F) and ex vivo tumor volume on day 20 (Figure 1G). Consistent with Mito-MGN inhibiting melanoma growth in vitro, Ki-67 immunostaining indicated a marked reduction in cell proliferation of Mito-MGN treated melanomas in vivo (Figure 1H). These anti-tumor effects of Mito-MGN in murine melanoma agree with our recent report in human melanoma cells and xenografts (Cheng et al., 2020).
Inhibition of mitochondrial complex I remodels the immune microenvironment
A key strength of the B16 melanoma model is the presence of an intact, physiologically relevant immune system that more stringently reproduces the human melanoma microenvironment compared to xenograft models. Multispectral flow cytometry was used as an unbiased approach to measure the potential impact of Mito-MGN on the melanoma immune microenvironment. The gating strategy employed is shown in (Figure S2). Mice were engrafted with B16.F10 cells and tumors allowed to establish for 12 days before initiating Mito-MGN treatment (Figure 2B). As shown in Figures 2B, 1 mg Mito-MGN led to pronounced regression in treated mice, with the significant decrease in melanoma size accompanied by a pronounced increase in CD45+ immune cells (Figure 2C). While CD3+ T cell viability remained unchanged (Figure 2D), there was an increased ratio of cytolytic CD8+ to helper CD4+ T cells infiltrating the tumor (Figure 2E). Moreover, tumor infiltrating CD8+ T cells expressed increased levels of granzyme B (Figure 2F). In contrast, the immunoregulatory CD4+CD25+FoxP3+ Treg population within treated tumors was unaffected by Mito-MGN treatment (Figure 2G).
Figure 2.

Mito-MGN induces melanoma regression and modulates the melanoma immune landscape
(A) Melanoma engraftment and treatment schedule. Tumors were harvested and dissociated into single cell suspension for flow cytometric analyses using the strategy shown in Figure S2.
(B) Tumor volumes measured ex vivo from mice treated with Mito-MGN or vehicle control.
(C) Percent viable CD45+ leukocytes from vehicle or Mito-MGN treated melanoma tumors measured by flow cytometry.
(D) Percent viable CD3+ T cells infiltrating vehicle control or Mito-MGN-treated melanoma tumors.
(E–G) Effects of Mito-MGN on the melanoma infiltrating T cells. Ratio of CD8+-to-CD4+ T cells (E), percent of CD3+CD8+ T cells expressing granzyme B (F), and levels of CD4+CD25+FoxP3+ regulatory T cells (Treg) (G).
(H and I) Enumeration of melanoma infiltrating myeloid cells. Percent CD11b+ myeloid cells (H), CD45+CD3−CD11b+CD11c−Ly6C−F4/80hi tumor-associated macrophages (TAM) (I), suppressive CD206+ TAM (J), monocytic MDSC (M-MDSC) (K), and granulocytic MDSC (PMN-MDSC) (L).
(M–O) Impact on peripheral immune populations measured. Ratio of splenic CD8+ to CD4+ T cells (M), CD11b+CD11c−Ly6ChiLy6G− M-MDSC (N), and CD11b+CD11c−Ly6CintLy6Ghi PMN-MDSC (O) as a percent of total CD45+ leukocytes in the spleen. Values in B-O are mean ± SD from 7-10 individual mice from 2 replicate cohorts. ∗, p< 0.05; ∗∗, p< 0.01; ∗∗∗, p< 0.001; ∗∗∗∗, p < 0.0001; ns, not significant as measured using Student's t-test.
We next profiled infiltrating myeloid lineages in treated tumors. In contrast to the elevation of activated effector CD8+ T cells there was a significant reduction in total CD11b+ myeloid cells (Figure 2H), CD45+,CD3-,CD11b+,CD11c−,Ly6C−,F4/80hi TAMs (Figure 2I), and M2-like immunosuppressive CD206hi TAMs (Figure 2J) compared to vehicle treated mice. Moreover, Mito-MGN treatment decreased levels of CD11b+,CD11c−,Ly6Chi,Ly6G− monocytic MDSC (M-MDSC) (Figure 2K) with minor changes in CD11b+,CD11c−,Ly6Cint,Ly6Ghi granulocytic MDSC (PMN-MDSC) (Figure 2L) populations within the treated tumors. Parallel analyses of the spleens assayed to measure peripheral immune responses in treated and vehicle control mice indicated little change in CD8+ to CD4+ T cell ratio or M-MDSC or PMN-MDSC levels (Figures2M–2O). These data indicate that Mito-MGN stimulates the concurrent elevation in cytolytic T cell populations with decreased levels of suppressive myeloid cells.
Mito-MGN accumulates within and inhibits tumor cell respiration and proliferation
To ascertain if Mito-MGN anti-tumor effects reflect direct effects on immune cells, LC-MS/MS analyses were used to measure Mito-MGN accumulation. As expected from our work in other cancers, Mito-MGN levels were ∼10-fold higher in melanoma cells consistent with those cells having a more negative mitochondria membrane potential compared to normal cells (Figure 3A). However, Mito-MGN was detectable in MSDC as well as both naive and activated T cells (Figure 3A), suggesting the possibility that while tumor cells are the primary target of TPP+-conjugated compounds, these lipophilic inhibitors may have off-tumor effects in immune cells. Moreover, consistent with the TPP+-conjugated probes’ ability to target the mitochondria we measured a dose-dependent disruption of mitochondrial membrane potential within tumor cells (Figure S3). Neither MGN nor the unconjugated TPP+ moiety altered mitochondrial membrane potential.
Figure 3.

Accumulation of Mito-MGN immune cells and its effects on cell cycle signaling mechanisms in melanoma cells
(A) LC-MS/MS quantification of Mito-MGN measured B16F10 melanoma cells, MDSC, naive or activated T cells treated 1 hr with 1μM Mito-MGN. Values are mean ± SD from 2-7 biological replicates.
(B) Representative mitochondrial stress test in Mito-MGN treated B16.F10 melanoma cells. Mitochondrial function was determined by injecting oligomycin (1 μg/mL) to inhibit ATP synthase, 2,4-dinitrophenol (50 μM) to uncouple the mitochondrial electron transport chain, and rotenone (1 μM) and antimycin A (10 μM) to inhibit complex I and complex III, respectively. Arrows indicate the time of compound injection. Values are mean ± SD of technical quadruplicates. Data representative of 3 independent biological replicates.
(C) Basal oxygen consumption rate (OCR) normalized to vehicle treated cells 24 hr after Mito-MGN treatment. Solid line represents the fitting curves used for determination of the IC50 value. Values are mean ± SD, n = 3 biological replicates completed with technical quadruplicates.
(D) Mitochondrial complex I oxygen consumption measured 24 hr after pretreatment with titrated doses of Mito-MGN. Solid line represents the fitting curves used for determination of the IC50 value. Values are mean ± SD from 3 biological replicates completed in technical quadruplicates.
(E–G) Representative immunoblot analyses (E) and densitometric quantification of phosphorylated and total AKT (F) and FOXO1 (G) in B16.F10 treated with 1, 5, 10 μM Mito-MGN. Values are mean ± SD from 3 biological replicates. Data for a B16.F0 cells are shown in Figure S4. Akt phosphorylation at the anti-proliferative IC50 dose of Mito-MGN is shown in Figure S5.
(H and I) Nuclear localization of FOXO1 in B16F10 melanoma cells treated with Mito-MGN, or vehicle as a negative and LY294002 as a positive control. Representative fluorescence micrograph images of FOXO1 localization (H). Scale bar = 10 μm. Immunofluorescence measurement of nuclear and cytoplasmic FOXO1 in treated cells (I) as outlined in Figure S6. Values are mean ± SD of 6 biological replicates.
(J) Representative immunoblot analyses and densitometric quantification of p27 in melanoma treated with Mito-MGN, vehicle, or LY294002. Values are mean ± SD of 5 biological replicates.
(K) Cell cycle analysis. Representative cell cycle progression in B16.F10 cells treated with vehicle or 0.2 μM Mito-MGN (upper panels). Values are mean ± SD, n = 3. Statistical differences in F, G, I, J and K were determined using Student's t-test (∗, p < 0.05; ∗∗, p < 0.01; ∗∗∗, p < 0.001; ∗∗∗∗, p < 0.0001).
Having shown Mito-MGN inhibition of cell growth in vitro and in vivo, we next used an iterative approach to dissect the molecular mechanism(s) for its anti-proliferative influence in murine melanoma. To determine if Mito-MGN measured within melanoma cells was functional a Seahorse XFe96 extracellular flux analyzer was used to assess mitochondrial respiration measured by oxygen consumption rate (OCR) (Figure 3B). Mito-MGN significantly and dose dependently reduced OCR in both B16.F10 cells (Figures3B and 3C) and B16.F0 cells (FiguresS4A and S4B) with nearly identical IC50s to the anti-proliferative dose. To investigate if decreased OCR reflected inhibition of specific mitochondrial complexes, experiments of permeabilized cells revealed that Mito-MGN inhibited complex I activity in both B16.F10 (Figure 3D) and B16.F0 (Figure S4C) melanoma cells. Activity of mitochondria complex II or complex III were unchanged following Mito-MGN treatment.
Close similarities between Mito-MGN IC50 values for inhibition of proliferation, OCR, and mitochondria complex I suggested that its anti-proliferative effects may be mechanistically linked to decreased bioenergetic metabolism. To evaluate the molecular mechanism(s) regulating Mito-MGN effect on melanoma metabolism, we focused on AKT as a key regulator of cell proliferation over-expressed in melanoma (Robey and Hay, 2009). Previous reports have demonstrated that decrease in oxygen consumption rate (OCR) and decrease in oxidative metabolism downregulates AKT activity (Cerniglia et al., 2015; Shaik et al., 2008). This mechanism has not previously been shown to influence the proliferation of melanoma cells. AKT activation measured by S473 phosphorylation obstructs apoptosis, increases proliferation, regulates energy sensing and homeostasis, and influences oncogenic mutation rates in melanoma (Robey and Hay, 2009). Forkhead transcription factors (FOXO), primarily FOXO1, control the cell cycle at the G1-S and G2-M transitions and are functional targets of active AKT signaling (Xintaropoulou et al., 2015). To evaluate if AKT/FOXO1 plays a role in the observed anti-proliferative and bioenergetic effects of Mito-MGN, AKT and FOXO1 phosphorylation and protein levels were assayed. Mito-MGN significantly reduced the levels of both phospho-AKT and phospho-FOXO1 in B16.F10 (Figures 3E–3G) and B16.F0 (FiguresS4D and S4E) cells. Mito-MGN similarly decreased AKT phosphorylation at the growth inhibitory dose (0.3 μM) at longer, 24 hr, treatment times (Figure S5). Decreases in phospho-FOXO1 are associated with FOXO1 translocation to the nucleus (Van Der Heide et al., 2004). Treatment with Mito-MGN or LY294002, used as a positive control, increased levels of FOXO1 within the nucleus in comparison with vehicle-treated cells (Figures 3H and 3I). The morphometric analysis pipeline is shown in Figure S6. Moreover, the downstream of FOXO1 cell cycle regulator p27 was upregulated upon the treatment with Mito-MGN (Figure 3J). Consistent with those results, Mito-MGN significantly increased the percent of B16.F10 cells within the G1 phase of the cell cycle (Figure 3K). Taken together these data indicate that Mito-MGN effectively inhibits melanoma progression. The decrease in melanoma proliferation reflected the dose-dependent inhibition of mitochondrial complex I and decreased OXPHOS metabolism in Mito-MGN treated melanoma cells. In agreement with its potent inhibitory effects on melanoma growth in vitro and in vivo, AKT and FOXO1 were deactivated, disrupting progression through the cell cycle in treated cells. Together, these data indicate that Mito-MGN potently inhibits cell proliferation in two murine melanoma cell lines in vitro.
MDSC viability and suppressive functions inhibited by Mito-MGN
As Mito-MGN accumulation was detectable in MDSC in culture (Figure 3A) and levels of M-MDSC and TAMs were altered in vivo (Figures2I–2L), we next investigated if Mito-MGN had effects on MDSC viability and differentiation. Separate cultures of bone marrow-derived monocytes were differentiated into either PMN-MDSC or M-MDSC in the presence or absence of Mito-MGN (Figure S7A). Melanoma-inhibitory doses of Mito-MGN significantly reduced MDSC viability in culture (Figure S7B). Further, Mito-MGN potently inhibited differentiation of CD11b+, CD11c−, Ly6Chi, Ly6G− M-MDSC (Figure S7C) while increasing levels of CD11b+, CD11c−, Ly6Cint, Ly6Ghi PMN-MDSC (Figure S7D). Given that melanoma treatment in vivo likely included treatment of MDSC localized within the tumor microenvironment, we next investigated the potential for Mito-MGN to affect fully differentiated MDSC. Fully differentiated bone marrow MDSC incubated with Mito-MGN (Figure 4A) demonstrated decreased viability (Figure 4B), with decreased levels of M-MDSCs (Figures4C and 4E) compared to PMN-MDSC (Figures4D and 4E), consistent with the latter preferentially using aerobic glycolysis (Jian et al., 2017). Moreover, Mito-MGN treated MDSC possessed reduced T cell suppressive functions (Figures4F and 4G). To investigate the effects of Mito-MGN on macrophages, bone marrow-derived monocytes were differentiated into either M1 or M2 macrophages, then treated with Mito-MGN (Figure S7E), levels of M2 macrophages were significantly reduced in comparison with M1 macrophages (Figure S7F). Furthermore, we investigated the ability of M1 or M2 macrophages to differentiate in the presence of Mito-MGN. Bone marrow-derived monocytes were differentiated into either M1 or M2 macrophages, with separate cultures in the presence or absence of Mito-MGN (Figure S7G). Survival of M2 macrophages was significantly reduced by Mito-MGN in comparison to M1-type macrophages (Figure S7H). These data support prior reports that M2 macrophages preferentially utilize mitochondrial respiration for energy metabolism (Halbrook et al., 2019). Cumulatively, these data suggest that MDSC and M2 suppressive-like macrophages, are sensitive to Mito-MGN.
Figure 4.

MDSC differentiation and viability are altered by Mito-MGN treatment
(A) Schematic for analyzing Mito-MGN effects on fully differentiated murine MDSC.
(B) Viability of differentiated MDSC. Values are mean ± SD of 3-8 biological replicate MDSC cultures.
(C–E) Changes in MDSC populations following Mito-MGN or vehicle control treatment. Percent monocytic (M-MDSC) (C) and granulocytic MDSC (PMN-MDSC) (D) following treatment with Mito-MGN, MGN, or TPP measured by flow cytometry. Representative Ly6C and Ly6G flow cytometry pseudo-color dot plot of vehicle (Veh) and Mito-MGN treated MDSC (E). Effects on MDSC differentiation is shown in Figures S7A–S7D.
(F and G) MDSC suppression assay. Representative T cell proliferation histograms of cell trace violet (CTV) fluorescence detected using flow cytometry (F). Each population represents a generation of divided cells (population 1: first generation; population 2; second generation of divided cells; population 3: third generation of divided cells. Quantification of T cell proliferation measured by flow cytometry (G). Values are mean ± SD of 3 biological replicates MDSC-T cell cocultures. Statistical differences in C, D, and G were determined using Student's t-test (∗p< 0.05; ∗∗p< 0.01; ∗∗∗, p< 0.001; ns, not significant).
Mito-MGN enhances T cell activation and effector functions to abrogate melanoma progression
Exhausted and memory T cells favor OXPHOS metabolism while activated effector T cells utilize glycolysis, with metabolic reprogramming in lymphocytes predictive of response to immunotherapy (Hodis et al., 2012; Ma and Zong, 2020). As we detected Mito-MGN in cultured T cells (Figure 3A) and the levels and functional activity of T cells were elevated in vivo (Figures2D–2F), we asked if Mito-MGN altered T cell proliferation and/or activation in vitro. Naive T cells were activated with anti-CD3/anti-CD28-conjugated beads in the presence or absence of Mito-MGN at the same concentrations shown to inhibit B16 melanoma proliferation (Figure S8A). Consistent with T cell proliferation measured within the melanoma microenvironment, Mito-MGN had no effect on T cell proliferation in vitro (Figure S8B). T cells treated with metformin, a weak mitochondrial complex I inhibitor (Cheng et al., 2016), were used as a comparator. We next examined the potential for Mito-MGN to influence T cell activation. Naive T cells were sequentially incubated 3 days with anti-CD3/CD28 beads to stimulate their proliferation and activation and the beads removed before the addition of Mito-MGN (Figure S8C). T cells activated with anti-CD3/CD28 beads prior to, and in combination with Mito-MGN, had increased levels of CD69 in both CD4+ and CD8+ T cells (FiguresS8D–S8F). Furthermore, T cells treated with Mito-MGN exhibited an overall skewing toward a more effector like phenotype defined as elevated CD44hiCD62Llo levels in both CD4+ and CD8+ T cells (Figures 5A–5D). Seahorse analyses confirmed increased extracellular acidification rate consistent with elevated aerobic glycolysis while OCR was unchanged (Figure 5E).
Figure 5.

Impact of Mito-MGN on T cell activation and effector functions
(A) Schematic for analyzing Mito-MGN effects on splenic T cells.
(B–D) Changes in T cell activation. Representative flow cytometry plots of CD44hiCD62Llo levels in T cells (B). Enumeration of activated T cells of CD4+ (C) and CD8+ (D) T cell subsets in Mito-MGN treated and vehicle control cells. Values are mean ± SD, n = 6 independent experiments. Statistical significance determined using a Student's t-test (∗∗, p< 0.01; ∗∗∗, p< 0.001). Effects of Mito-MGN on T cell proliferation and early activation markers are shown in Figure S8.
(E) Realtime measurement of extracellular acidification rate (ECAR) (left panel) and oxygen consumption rate (OCR) in treated T cells Values are mean ± SD of n = 3 biological replicates completed in technical quadruplicate. Statistical differences at individual time points were analyzed using Student's t-test (∗∗∗∗, p< 0.0001).
(F and G) IsoPlexis IsoLight assay measured Polyfunctionality Strength Index (PSI) scores (F) and effector or inflammatory cytokine levels (G) in Mito-MGN treated compared to vehicle control T cells. Values are mean ± SD from 2 biological replicates.
To rigorously dissect the increase in T cell activation, an unbiased screen of the functional effects of Mito-MGN on secreted cytokines was completed. Naive T cells were activated (Figure 5A) and loaded to IsoCode chips to determine single cell cytokine secretion. The polyfunctional profile (secreting >2 cytokines) of single cells was evaluated, and a polyfunctional strength index score generated, with further segregation into effector, stimulatory, chemoattraction, regulatory, and inflammatory categories. T cells treated with Mito-MGN exhibited a more effector and inflammatory phenotype, characterized by increased levels of IL-17A and IL-6 (Figures5F and 5G). Raw data from the IsoPlexis polyfunctional assay are listed in Table S1. Finally, to ascertain if the measured changes in vitro correlated with functional changes in vivo we investigated the potential for T cell activation to participate in the anti-tumor effect of Mito-MGN. For these experiments, CD4+ or CD8+ T cells were immunodepleted prior to treatment with Mito-MGN (Figure 6A). Immune depletion of either CD8+ or CD4+ T cells resulted in significantly larger tumors compared to mice treated with Mito-MGN alone (Figure 6B). Although not statistically different, the anti-tumor effect of Mito-MGN trended toward a stronger effect following CD8+ T cell depletion compared to CD4+ T cell depleted mice. Thus, immune depletion reveals key roles for cytolytic as well as helper T cells in Mito-MGN-induced tumor regression. Flow cytometric analyses of splenocytes and peripheral blood lymphocytes from control and treated tumor-bearing mice confirmed the successful depletion of more than 99% of T cells (Figures6C–6F). Taken together, these data reveal that Mito-MGN treatment abrogated tumor progression in immune competent melanoma, with smaller tumors paralleled by increased infiltration of cytotoxic T cells and decreased immune suppressive TAM and M-MDSC. T cell activation in cell culture was consistent with infiltration of activated effector lymphocytes in the treated melanoma in vivo. Cumulatively, these data indicate that T cells are potently activated by Mito-MGN in vitro and in vivo.
Figure 6.

Anti-tumor efficacy of Mito-MGN is attenuated by immune depletion
(A) Melanoma engraftment and treatment schedule.
(B) Tumor volume measured ex vivo from immune-depleted Mito-MGN treated and control mice.
(C–F) Levels of T cells in treated with either immune depleting or isotype control antibodies, and vehicle control treated mice. Levels of CD8+ T cells in the serum (C) or spleen (E) of experimental and control immune depleted mice. Levels of CD4+ T cells in the serum (D) or spleen (F) of experimental and control immune depleted mice. Values in B-F are mean ± SD from 7-10 individual mice in 2 replicate cohorts. Statistical differences were analyzed using Student's t-test (∗, p< 0.05; ∗∗, p< 0.01; ∗∗∗, p< 0.001; ∗∗∗∗, p< 0.0001).
Discussion
Nearly 50% of human melanomas possess an oncogenic BRAFV600E mutation with the remaining 50% composed of NRAS over-activation, CDNK2A deletion, or MITF amplified/altered mutations (Ma and Zong, 2020). Treatment of melanoma has been improved through the development of Raf GTPase or kinase signaling inhibitors and checkpoint inhibitors. Clinical benefit remains limited as patients develop therapeutic resistance, in part, due to metabolic reprogramming of cancer cells (Ma and Zong, 2020). First generation aerobic glycolysis inhibitors to specifically inhibit Warburg metabolic reprogramming failed to translate to the clinic. With the emerging recognition of reverse Warburg metabolic shift in established tumors, targeting mitochondrial metabolism has emerged as a promising alternative therapeutic option. Here, we have shown that Mito-CI, either the mitochondria-targeted polyphenol Mito-MGN or Mito-CP, each potently inhibits murine melanoma proliferation. Further, Mito-MGN more effectively inhibited melanoma growth than either the parent bioactive polyphenol magnolol or IACS-010759. Mito-MGN treatment decreased complex I-mediated cellular energy and increased the presence of damaged mitochondria in melanoma cell lines, likely rendering those cells unable to meet metabolic challenges following treatment with Mito-MGN. These mitochondria-targeted agents, while preferentially localizing within tumor cells, retain potent immune activating properties in T cells while abrogating suppressive effects of MDSC. Our data support the potential for exploiting metabolic reprogramming in multiple cell types to broadly inhibit tumor progression through the combination of tumor intrinsic and tumor extrinsic OXPHOS inhibition.
Mitochondrial function can be inhibited by a variety of agents targeted to the mitochondrial matrix. Lipophilic, delocalized cationic compounds were used to target tumor mitochondria because of a more polarized (more negative inside) mitochondrial transmembrane potential as compared to normal cells (Kurtoglu and Lampidis, 2009). Rhodamine-123, a lipophilic cationic fluorescent dye used as an indicator of mitochondrial transmembrane potential (Gao et al., 2019; Nadakavukaren et al., 1985; Summerhayes et al., 1982), was retained longer in the mitochondria of cancer compared to normal epithelial-derived cells, with increased uptake and retention correlated with enhanced toxicity. To hijack the increased membrane potential of cancer cell mitochondria, we have conjugated TPP+ to an array of biologically active effectors (Boyle et al., 2018; Cheng et al., 2014, 2015, 2016, 2020; Kalyanaraman et al., 2018). These TPP+-conjugated probes diffuse across cell membranes and increasingly localize within the more polarized mitochondrial membrane potential of cancer compared to normal epithelial cells (Kalyanaraman et al., 2018). We developed a next generation mitochondria-targeted compound by conjugating TPP+ to magnolol, the most abundant bioactive constituent of Magnolia officinalis used for centuries as a traditional Chinese herbal medicine (Cheng et al., 2020). Magnolol was rationally selected as its two equivalent hydroxyl groups could be derivatized into a single monosubstituted isomer enabling a convenient synthesis of large quantities of Mito-MGN.
The measured increased localization of TPP+-conjugated magnolol within melanoma cells is consistent with our prior reports of TPP+-conjugated probes primarily accumulating within tumor cell lines. While the nearly 10-fold higher accumulation of Mito-MGN in melanoma cells was expected, detectable levels of the compound were measured within lymphocytes and MDSCs. Given the ratio of the compound within those cells relative to melanoma, we believe the off-tumor accumulation likely reflects the inherent lipophilic nature of the TPP+ moiety. While levels within those immune cells were low, it resulted in discrete functional effects in T cells and MDSC. These off-tumor effects harmonize with on-tumor effects as immune depleting antibodies decreased the anti-melanoma effects of Mito-MGN. Taken together, our data suggest Mito-MGNs anti-tumor effects reflect a combination of on-tumor cell cycle inhibition with off-tumor T cell activation and depletion of suppressive myeloid cells.
Cancers with mutations in the genes encoding mitochondrial complex I proteins in the electron transport chain are more susceptible to mitochondrial inhibition (Gao et al., 2019; Izreig et al., 2020; Owen et al., 2000). Mitochondria-targeted TPP-conjugated agents such as Mito-Met, Mito-CP, or Mito-MGN disrupt complex I and mitochondrial bioenergetics, which in turn potently arrest tumor intrinsic proliferation of cancer cells (Kalyanaraman et al., 2018). We determined that Mito-MGN was more efficacious compared against a previously described OXPHOS inhibitor, IACS-10759, currently in clinical trials in blocking melanoma proliferation. We speculate that Mito-MGN inhibition of OXPHOS is the central mechanism dictating its anti-tumor effects by broadly disrupting redundant cell growth signaling pathways that abrogate cell proliferation. In B16 melanoma PTEN mutations dictate increased AKT signaling as a key proliferative mechanism (Chamcheu et al., 2019; Yadav et al., 2018). PI3-kinase–AKT also possess critical functions in sensing and influencing energy homeostasis and are often hyperactive in human melanoma where their over-active signaling correlates adversely with patient survival (Chamcheu et al., 2019; Yadav et al., 2018). Mito-MGN decreased AKT and FOXO1 phosphorylation, induced cell-cycle arrest, and decreased levels of Ki67 proliferating tumors in vivo. Together, these data suggest that AKT dampening of the cell cycle regulator FOXO1 is a key mechanism for Mito-MGN inhibitory effect on cell proliferation. However, we have previously reported in pancreatic and colon cancer cells that inhibition of mitochondria complex I stimulated AMPK and, in turn, induced cell-cycle arrest (Boyle et al., 2018; Cheng et al., 2016). Thus, AMPK signaling provides an alternative mechanism for Mito-MGN treatment, particularly in tumors with overactive KRAS or BRAF mutations. Indeed, we have previously demonstrated that Mito-MGN activation of AMPK inhibits cell proliferation in BRAF-overactive mutant human melanoma cell lines (Cheng et al., 2020).
The therapeutic efficacy of OXPHOS inhibitors has been limited by the reliance of the early studies on xenograft mouse models that lack T and B lymphocytes critical in the immune response to tumors. Like many cancers, there is a robust increase in immunosuppressive MDSC and Treg in melanoma. Furthermore, melanoma cells upregulate the expression of the programmed death-ligand 1 (PD-L1) which binds to PD1 receptors on T cells, thereby exacerbating immune suppression. While immunotherapy agents targeting PD-1 or PD-L1 have shown promise in the clinic, the response rate has plateaued, in part by the ability of cancer cells to become resistant to these therapies (Polak et al., 2007). For instance, transforming growth factor β, IL-10 and indoleamine-2, 3-dioxygenase in the melanoma microenvironment may directly impinge on T cell function and inhibit immune therapy efficacy (Monjazeb et al., 2016). Using an immune competent mouse model of melanoma, we discovered that targeted inhibition of complex I with a Mito-MGN potently inhibited tumor progression through tumor intrinsic and tumor extrinsic cellular mechanisms. Importantly, data using immune-depleting antibodies support the notion that T cell infiltration participates in Mito-MGN anti-tumor effects. The anti-tumor potential of those T cells was likely influenced by diminished M-MDSC, M2-type suppressive TAMs. While our data support a direct effect of OXPHOS inhibition, it remains possible that increased immune infiltration is a byproduct of the decreased ability of tumors to create an immune suppressive microenvironment or altered PD-L1 expression in cancer cells (Chamoto et al., 2017).
OXPHOS supports the energy demands of exhausted T cells, Tregs, suppressive and inflammatory TAMs, as well as M-MDSC. While we saw little change in Tregs within the tumor microenvironment we measured a strong decrease in both suppressive CD206+, M2-type, TAMs and M-MDSC following Mito-MGN treatment. The strong immune promoting effects of Mito-MGN underscore the likely role for OXPHOS as the primary metabolic engine for immune suppressive or immune anergic immune cells that cumulatively suppress anti-tumor immunity (Kawada et al., 2017; Maertin et al., 2017; Sancho et al., 2015; Sousa et al., 2016; Vander Heiden et al., 2009; Zhou et al., 2018). Indeed, TAM-produced OXPHOS metabolites may participate in gemcitabine chemoresistance in pancreatic cancer (Halbrook et al., 2019). M-MDSC appear to rely on OXPHOS for survival and suppressive function (Jian et al., 2017), with AKT and ERK signaling pathways driving MDSC differentiation from myeloid precursors (Gato-Cañas et al., 2015). While we measured preferential decrease of M-MDSC relative to PMN-MDSC viability and population changes in vivo suppressive capacity in Mito-MGN treated MDSC was significantly abrogated.
Consistent with the increase in activation and infiltration of T cells in vivo, treatment with Mito-MGN facilitated metabolic reprograming of T cells reflected in the increase in, proliferation independent activation of T cells, increase in ECAR, which indicates an increase in glycolytic capacity of T cells, and an increase in inflammatory cytokines profile in T cells. Following oligomycin treatment we observed a decrease in ECAR. The addition of oligomycin inhibits mitochondrial ATP synthase, so ECAR would be expected to increase, reflecting a greater requirement for glycolytic ATP. However, the significant drop in ECAR after oligomycin treatment reflects greater reliance on mitochondrial ATP to fuel Mito-MGN primed T cells. Mito-MGN's ability to inhibit complex I increases levels of reactive oxygen species (Cheng et al., 2014, 2015, 2016). We speculate that Mito-MGN inhibits complex I in T cells, leading to increased reactive oxygen species and activated mitochondrial function of tumor-reactive T cells. Short-lived effector cells (SLECs) and memory precursor effector cells (MPECs) are subsets of effector T cells that may also be impacted by mitochondria-targeted complex I inhibitors such as Mito-MGN. While our studies did not complete a detailed analysis of these subset's we not a prior report indicating that SLEC preferentially utilize aerobic glycolysis while MPEC rely on OXPHOS for their energy needs (Weyand and Goronzy, 2018). Thus, we would predict that Mito-MGN would enhance SLEC to MPEC ratio's in melanoma-bearing mice. Taken together, our data suggest that OXPHOS may be a key metabolic participant in immune suppression in cancer and may be exploited using mitochondria-targeted complex I inhibitors to selectively inhibit cells reliant on mitochondrial respiration. Moreover, mitochondria-targeted complex I inhibitors unravel an exciting potential in remodeling the immune microenvironment to promote anti-tumor immunity and potentially be used to enhance the response to front-line immunotherapies.
Limitations of study
Our in vivo and in vitro data indicate that Mito-MGN has effects on both melanoma cells and T cells. While we demonstrated a role for inhibiting mitochondrial respiration and the cell cycle in melanoma cells, experimental data defining the mechanisms whereby this mitochondria-targeted OXPHOS inhibitor alters T cell activation MDSC viability and suppressive capacity have yet to be established. Examination of the potential for Mito-MGN to work cooperatively with immune checkpoint blockade require additional optimization experiments to rigorously establish effects of Mito-MGN on melanoma PD-L1 or other checkpoint protein levels. Dissecting the sequence of combined treatment would also be required. The studies here focus on CD8+ cytolytic T cells as a key anti-tumor effect. Experiments to determine the impact of Mito-MGN on other immune cells, including natural killer or B cells would increase the breadth of the study findings.
STAR★methods
Key resources table
| REAGENT or RESOURCE | SOURCE | IDENTIFIER |
|---|---|---|
| Antibodies | ||
| Phospho-Akt (Ser473), clone D9E | Cell Signaling Technology | Cat # 4060 RRID: AB_2315049 |
| Akt (pan), clone 40D4 | Cell Signaling Technology | Cat #2920 RRID: AB_1147620 |
| Phospho-anti FoxO3a (Ser253)/FoxO1 (Ser251), clone D18H8 | Cell Signaling Technology | Cat #13129 RRID: AB_2687495 |
| β-Actin (13E5) Rabbit | Cell Signaling Technology | Cat #4970 RRID AB_2223172 |
| Anti-FoxO1, clone C29H4 | Cell Signaling Technology | Cat #2880 RRID: AB_2106495 |
| p27/ Kip1 (D69C12) | Cell Signaling Technology | Cat# 3686 RRID:AB_2077850 |
| Goat anti-Rabbit IgG (H+L) Cross-Adsorbed Secondary Antibody, Alexa Fluor 488 | Thermofisher Scientific | Cat# A-11008, RRID:AB_143165 |
| PerCP anti-mouse CD3epsilon antibody | BioLegend | Cat# 100326, RRID:AB_893317 |
| CD4 antibody | BD Biosciences | Cat# 563790, RRID:AB_2738426 |
| BUV805 Rat Anti-Mouse CD8a antibody | BD Biosciences | Cat# 564920, RRID:AB_2716856 |
| CD11b Monoclonal Antibody (M1/70), PE | Thermo Fisher Scientific | Cat# 12-0112-82, RRID:AB_2734869 |
| CD11c Monoclonal Antibody (N418), FITC | Thermo Fisher Scientific | Cat# 11-0114-82, RRID:AB_464940 |
| CD25 Monoclonal Antibody (PC61.5), PE | Thermo Fisher Scientific | Cat# 12-0251-81, RRID:AB_465606 |
| CD44 Monoclonal Antibody (IM7), PE-Cyanine7 | Thermo Fisher Scientific | Cat# 25-0441-81, RRID:AB_469622 |
| BV786 Rat Anti-Mouse CD45 antibody | BD Biosciences | Cat# 564225, RRID:AB_2716861 |
| CD62L (L-Selectin) Monoclonal Antibody (MEL-14), APC | Thermo Fisher Scientific | Cat# 17-0621-82, RRID:AB_469410 |
| CD206 (MMR) Monoclonal Antibody (MR6F3),APC | Thermo Fisher Scientific | Cat# 17-2061-82, RRID:AB_2637420 |
| F4/80 Monoclonal Antibody (BM8), PE-Cyanine7 | Thermo Fisher Scientific | Cat# 25-4801-82, RRID:AB_469653 |
| Armenian Hamster Anti-CD69 Monoclonal Antibody, FITC Conjugated, Clone H1.2F3 | BD Biosciences | Cat# 553236, RRID:AB_394725 |
| FOXP3 Monoclonal Antibody (FJK-16s), FITC | Thermo Fisher Scientific | Cat# 11-5773-80, RRID:AB_465242 |
| FITC anti-human/mouse Granzyme B antibody | BioLegend | Cat# 515403, RRID:AB_2114575 |
| Ly-6C Monoclonal Antibody (HK1.4), APC-eFluor 780 | Thermo Fisher Scientific | Cat# 47-5932-82, RRID:AB_2573992 |
| BUV395 Rat Anti-Mouse Ly-6G antibody | BD Biosciences | Cat# 563978, RRID:AB_2716852 |
| Ms I-A/I-E BUV805 M5/114.15.2 antibody | BD Biosciences | Cat# 748844, RRID:AB_2873247 |
| Chemicals, peptides, and recombinant proteins | ||
| Alexa Fluor™ 568 Phalloidin | Thermofisher Scientific | Cat#A12380 |
| Viability Dye | ThermoFisher Scientific | Cat#65-0863 |
| DMEM | Gibco | Cat# 11965084 |
| RPMI 1640 Medium | Gibco | Cat# 11875119 |
| IACS-010759 | Cayman Chemical | Cat# 25867 |
| TMRE | Thermofisher Scientific | Cat# T669 |
| InVivoPlus anti-mouse CD8α | Bio X Cell | Cat# BP0061 |
| InVivoPlus anti-mouse CD4α | Bio X Cell | Cat# BP0003 |
| InVivoPlus rat IgG2 k | Bio X Cell | Cat# BP0090 |
| Red Blood Lysis Buffer | Biolegend | Cat# 420301 |
| Recombinant murine M-CSF | Peprotech | Cat# 315-02 |
| Recombinant human IL-2 | Peprotech | Cat# 200-02 |
| Recombinant murine IL-6 | Peprotech | Cat# 216-16 |
| Recombinant murine GM-CSF | Peprotech | Cat# 315-03 |
| Recombinant murine G-CSF | Peprotech | Cat# 250-05 |
| Triphenylphosphine | Sigma-Aldrich | Cat#603-35-0 |
| 1,10-di-bromo-decane | Alfa Aesar | Cat#AAA1235722 |
| CH2Cl2-EtOH | Fisher Scientific Co | Cat#AC124050010 |
| CH2Cl2-EtOH | Sigma-Aldrich | Cat#75-09-2 |
| Magnolol | ASTATECH | Cat#528-43-8 |
| EverBrite™ Mounting Medium | Biotium | Cat#23001 |
| DMF | Fisher Scientific Co | Cat#D119-500 |
| Critical commercial assays | ||
| MOJO sort Kit | Biolegend | Cat# 480024 |
| Dynabeads™ Mouse T-Activator CD3/CD28 | Thermofisher Scientific | Cat# 1456D |
| Cell Trace Violet | Thermofisher Scientific | Cat# C34557 |
| Foxp3 Transcription Factor Staining Buffer | eBioscience | Cat# 00-5523-00 |
| DAPI (4',6-Diamidino-2-Phenylindole, Dihydrochloride) | Thermofisher Scientific | Cat#D1306 |
| Propidium iodide / RNase solution | Thermofisher Scientific | Cat#F10797 |
| Image J | RRID: SCR_003070 | |
| CellProfile PipeLine for immunofluorescence analyses | This Paper | https://github.com/Hill-Lab/Mito-MGN-Scripts |
| Experimental models: cell lines | ||
| Male murine melanoma B16.F0 | ATCC | Cat#CRL-6322; RRID:CVCL_0604 |
| Male murine melanoma B16.F0 | ATCC | Cat# CRL-6475; RRID:CVCL_0159 |
| Software and algorithms | ||
| ImageJ | Schindelin et al., 2012 | https://imagej.nih.gov/ij/ |
| CellProfiler | McQuin et al., 2018 | https://cellprofiler.org/ |
| Other | ||
| C57BL/6 | The Jackson Laboratories | Cat#0000664; RRID:IMSR_JAX:000664 |
Resource availability
Lead contact
The corresponding author, Dr. Michael Dwinell, will be the lead contact.
Michael B. Dwinell, PhD
Professor and Director
Department of Microbiology & Immunology
Center for Immunology
Medical College of Wisconsin
8701 Watertown Plank Road
Milwaukee, WI 53226
PH: 414-955-7427
EM: mdwinell@mcw.edu
Materials availability
This study did not generate new unique reagents.
Data and code availability
The CellProfile pipeline is freely available at the R. Blake Hill laboratory website (https://github.com/Hill-Lab/Mito-MGN-Scripts).
Experimental model details
Animal model
All animal studies were approved by the Institutional Animal Care and Use Committees at the Medical College of Wisconsin (AUA000076). C57BL/6 mice (RRID:IMSR_JAX:000664) were purchased from The Jackson Laboratory (Bar Harbor, ME). Six- to eight-week-old male or female mice were randomly assigned to treatment or control groups and implanted subcutaneously in the right flank with 1x10⁶ B16.F10 murine melanoma cells. Tumors were allowed to establish for 7-12 days before intra-tumoral treatment. In situ tumor area (length x width = mm2) was measured by calipers. Mice were randomly assigned to control or experimental treatment groups on day 11, immediately prior to treatment by an investigator blinded to the ex vivo tumor measurements or flow cytometric analyses. Tumors were excised and volume (length x width x depth = mm3) measured post-mortem using calipers. In survival studies, mice were sacrificed when in situ tumor area reached 2 cm2 or severe ulceration developed according to the IACUC approved protocol. For immunohistochemistry tumors were fixed in zinc formalin and cleared in 70% v/v ethanol. Separate groups of mice were depleted of CD8+ or CD4+ T cells 24 hr prior to treatment. Mouse experiments were repeated in 2-3 individual cohorts, with each cohort containing 3-5 individual control or experimental animals. Each replicate cohort included vehicle controls and Mito-MGN treatment groups.
Cell culture and proliferation measurements
Male murine melanoma B16.F0 (ATCC-CRL-6322, RRID:CVCL_0604) and B16.F10 (ATCC-CRL-6475, RRID:CVCL_0159) cell lines were maintained in DMEM containing 10% v/v fetal bovine serum (Omega Scientific, Inc. Tarzana, CA), penicillin (100 U/ml), and streptomycin (100 μg/ml). Cell proliferation was monitored using the IncuCyte-S3 Live-Cell Imaging system (Essen Bioscience Inc., Ann Arbor, MI) as a reproducible probe-free, noninvasive, measure of cellular confluence in real-time. Phase-contrast images were collected every 2 hr to measure changes in cellular confluency as a surrogate measurement of cellular proliferation. Additional OXPHOS inhibitors used were IACS-010759 (Cayman Chemicals Co., Ann Arbor, MI) (Molina et al., 2018) or Mito-CP synthesized in house at the Medical College of Wisconsin as described previously (Boyle et al., 2018). A full list of key reagents is detailed in the Key Resources Table.
Method details
Mito-MGN synthesis
Magnolol was conjugated to TPP+ to synthesize Mito-MGN using our previously described approach (Cheng et al., 2020). Briefly, a mixture of triphenylphosphine (Sigma-Aldrich Co., St. Louis, MO; 1g, 3.8 mmol) and 1,10-di-bromo-decane (Alfa Aesar, Haverhill, MA; 5.7 g, 19 mmol) was heated to 90°C for 6 hr. After cooling, the crude product was purified by flash chromatography to precipitate the corresponding phosphonium salt (1 g, 47% yield). To a mixture of magnolol (0.2 g, 0.75 mmol; AstaTech Inc., Bristol, PA) and anhydrous potassium carbonate (0.22 g, 1.5 mmol; AstaTech) in DMF was added 10-bromodecyltriphenylphosphonium bromide (0.42g, 0.75mmol) at 0°C. The mixture was stirred at 35°C for 24 hr and the residue diluted in water and extracted with CH2Cl2. The organic layer was dried over Na2SO4 and the solvent was removed under reduced pressure with ether added to precipitate the crude product. Purification by flash chromatography using the following gradient from CH2Cl2 and EtOH as eluent to deliver Mito-MGN (200 mg, 35% yield) and Mito-bis-magnolol (80 mg, 14% yield) as white solids.
Immune profiling
Following euthanasia, tumors were excised and collected in ice cold PBS with 0.5% w/v BSA. Tumors were minced and filtered through a 70 μm strainer. After washing, the resultant single-cell suspension was resuspended in Ficoll and lymphocytes were separated from tumor cells and dead cells by centrifugation (400×g). The lymphocyte layer was pipetted to FACS tubes for immediate immunostaining and flow cytometric analysis. Multispectral flow cytometry was carried using the gating strategies illustrated in Figure S2. Spleens were minced, erythrocytes lysed, and filtered through a 70 μm strainer and immunostained. Cell suspensions from tumors and spleens were stained with fixable viability dye in PBS. Extracellular surface antigen staining was performed in PBS in 0.5% w/v BSA. Following staining, cells were fixed with PBS in 1% w/v paraformaldehyde, or permeabilized for intracellular staining using Foxp3 Transcription Factor Staining Buffer (BD Biosciences Inc. San Jose, CA). A full list of antibodies and reagents for cellular labeling are detailed in Key Resources Table. Samples were acquired on BD LSRII or Fortessa X-20 flow cytometers and data analyzed using FlowJo software (FlowJo, LLC, Ashland, OR) (10.6.1; RRID:SCR_008520).
Seahorse bioenergetic analyses
Melanoma cells (25x104/well) or negatively selected and in vitro activated T cells (3x10⁵/well) were cultured in Seahorse XF96 plates (Agilent Technologies, Santa Clara, CA) and treated with increasing concentrations of Mito-MGN. Oxygen consumption rate was measured as a readout of mitochondrial function assessed by injecting oligomycin (1 μg/mL) to inhibit ATP synthase, 2,4-dinitrophenol (50 μM) to uncouple the mitochondria, and rotenone (1 μM) and antimycin A (10 μM) as inhibitors of complex I and complex III, respectively and normalized to the vehicle treated groups. Measurement of the mitochondrial respiratory complex I was carried out in permeabilized cells pretreated 24 hr with Mito-MGN. Oxygen consumption rate was derived from mitochondrial complex I activity measured before and after addition of specific complex I substrates (pyruvate + malate) and inhibitor (rotenone).
TMRE quantification
Tetramethylrhodamine ethyl ester perchlorate (TMRE) was used to quantify mitochondrial integrity as described previously (Boyle et al., 2018). Briefly, cells were treated with Mito-MGN, MGN, TPP or FCCP for 1 hr. Cells were then incubated 45 min in TMRE (200 nM) and mechanically lifted from culture dishes for analysis using a BD-LSR II flow cytometer and FlowJo 10.6.1 software (BD Biosciences).
Immunoblotting analyses
Melanoma cells (3x10⁶) were starved of glucose, glutamine, and serum for 5 hr and stimulated with Mito-MGN for 30 min. Cells were lysed in a modified RIPA buffer (50 mM Tris-HCl, pH 7.4, 150 mM NaCl, 0.25% v/v sodium deoxycholate, 1% v/v Nonidet P-40, 0.1% v/v SDS, 1 mM EDTA, 10 mM sodium orthovanadate, 40 mM β-glycerol phosphate, 20 mM sodium fluoride). Lysates were quantified, normalized for protein concentration, and 10 μg protein size separated using reducing SDS-PAGE. Proteins were electro-transferred to PVDF membranes (Millipore Corp., Burlington, MA) and probed using primary and horseradish peroxidase–conjugated secondary antibodies. Proteins were visualized by chemiluminescence and quantified by densitometric analysis using AlphaView software (Proteinsimple Inc., San Jose, CA).
Cell cycle analysis
B16.F10 cells (5x10⁵) were seeded to a 6-well plate and immediately treated with Mito-MGN in complete medium. At 24 hr after treatment, cells were fixed with 70% v/v ethanol, and stained using a propidium iodide/RNase solution. Data were collected using a BD-LSR II Flow Cytometer and analyzed using FlowJo 10.6.1.
Immunofluorescence
A total of 150 x 105 cells were plated to glass 4-chambered slides (Falcon). Cells were treated 24 hrs after plating with vehicle, 30μM LY294002, or Mito-MGN (0.3 and 0.5 μM) for an additional 24 hrs, fixed in 4% w/v paraformaldehyde for 25 min, permeabilized in 0.4% v/v triton X-100 for 15 min, washed in PBS and stained overnight at 4°C with anti-FOXO1 antibody (1:100) in 5% w/v normal goat serum and PBS. The primary antibody solution was aspirated, and the samples were washed 3 times in PBS/0.05% v/v Tween20 (PBS-T). Cells were incubated at room temperature for 1 hr with Alexa 488 goat anti-rabbit (1:500) and subsequently washed 3 times in PBS-T. Following the secondary antibody staining, cells were stained for actin using Alexa Flour 568 Phalloidin (1 unit) for 20 min at room temperature. Phalloidin was aspirated, cells were washed 3 times in PBS-T and incubated with DAPI (1:1000) to stain the nuclei for 5 min at room temperature. DAPI solution was aspirated, cells were washed 2 times in PBS-T and a final wash in PBS. Cells were mounted in EverBrite Mounting Medium (Biotum) and covered with a #1.5 glass coverslip and sealed with clear nail polish.
Cell imaging
Cells fixed and stained with DAPI, FOXO1 (Alexa 488) and Phalloidin (Alexa 568) were imaged using a Nikon Eclipse Ti2-E microscope equipped with a Yokogawa confocal scanner unit (CSU-W1), solid state diode lasers (405, 488 and 568 nm) and a Hamamatsu ORCA-Flash4.0 V3 sCMOS camera. Cells were imaged for mean intensity analysis using a 40x objective (CFI Super FLUOR; 0.9 NA) and the higher resolution images were captured with the 60x objective (Plan Apo; 1.40 NA oil). DIC images were collected for a single plane, while fluorescence images were collected every micron for 10 microns (the bottom slices including those below the nucleus and several out of focus planes were excluded from downstream mean intensity analysis; 7 slices were used for the analysis).
Object analysis
Nikon Elements .nd2 files were processed into single channel maximum intensity projections (first 7 slices) TIFF files using an ImageJ macro (Schindelin et al., 2012) (https://github.com/Hill-Lab/Mito-MGN-Scripts). These single channel images were then input into a CellProfiler pipeline (McQuin et al., 2018) (https://github.com/Hill-Lab/Mito-MGN-Scripts) to analyze the mean intensity of FOXO1 in the nucleus vs the cytosol. Images were first cropped and corrected for illumination variations. Primary objects were classified as nuclei using adaptive Otsu thresholding on the DAPI channel. Secondary objects were classified as cells using the FOX-O channel and the nuclei as input objects. Cells were identified using the Watershed – Image feature and the global Minimum Cross-Entropy thresholding method. Tertiary objects were classified as cytosol and were created by subtracting nuclei from cells. The cropped images and all object masks were compiled using an ImageJ (RRID: SCR_003070) macro (https://github.com/Hill-Lab/Mito-MGN-Scripts). The mean intensity of FOXO1 was measured in each of these objects and exported as a .csv file. The cell, nuclei and cytosol.csv files were merged using R and the mean intensity of FOXO1 in the nucleus was divided by the mean intensity of FOXO1 in the cytosol (R script also available on https://github.com/Hill-Lab/Mito-MGN-Scripts). Statistics were calculated using ANOVA followed by Tukey post hoc analysis within the R scripts. The immunofluorescence analytical workflow is detailed in Figure S6.
T cell culture and activation
Spleens were harvested from naive mice and single cell splenocyte suspensions made using manual dissection. Erythrocytes were lysed and CD3+ T cells were negatively selected using a biotin antibody cocktail followed by incubation with magnetic streptavidin nanobeads. The magnetically sorted fraction was retained by the use of a magnetic separator and the untouched CD3+ T cells collected. Cells were maintained in RPMI 1640 medium containing 10% v/v fetal bovine serum, penicillin (100 U/mL), and streptomycin (100 μg/mL). T cells were activated using CD3/CD28 Dynabeads (Thermofisher, Waltham, MA) in the presence of 20 U/mL of recombinant human IL-2 (PeproTech, Rocky Hill, NJ). For T cell proliferation experiments, T cells were labeled with Cell Trace Violet prior to the stimulation of Mito-MGN and data was acquired using Fortessa X20 Flow Cytometer and analyzed using FlowJo 10.6.1. Single cell poly-functionality and single cell cytokine secretion was assessed by loading ∼30,000 negatively selected T cells onto an IsoCode chip (IsoPlexis, Branford, CT) containing ∼12,000 microchambers pre-patterned with a 28-plex antibody array, imaged for single cell location in microchambers and incubated at 37°C, 5% CO2 for a total of 24 hr in the presence or absence of Mito-MGN. ELISA was used to measure cytokine secretion. Secreted cytokines were captured by antibody-barcoded slides, the polyfunctional profile (2+ proteins per cell) of single cells evaluated, and poly functionality strength index (PSI) score calculated using the provided software.
Bone marrow-derived MDSC culture and MDSC suppression assay
Mouse femurs were flushed with RPMI 1640 medium, erythrocytes were lysed, and bone marrow monocytes cultured as described (Solito et al., 2019). Briefly, monocytes were stimulated with recombinant mouse cytokines, 40 ng /mL IL-6, 40 ng/mL GM-CSF, and 50ng/mL G-CSF for 5-days to induce their differentiation into MDSC. MDSC presence was verified via flow cytometry using the reagents in (Key Resources Table) and characterized based on their corresponding markers. Equal numbers of cells were included for individual flow cytometric analyses and the percent is the change in MDSC population relative to the cell number at the start. Cultured MDSC were pre-treated with vehicle or Mito-MGN, lifted from the plate and then co-cultured with negatively selected T cells that were labeled with cell trace violet to measure T cell proliferation.
Bone marrow-derived macrophage culture
Mouse femurs were flushed with RPMI 1640 medium, erythrocytes were lysed, and bone marrow monocytes cultured as described (Solito et al., 2019). Briefly, monocytes were stimulated with recombinant 20 ng/mL M-CSF to stimulate macrophages, with medium refreshed on day 3 and day 5. Bone-marrow derived macrophage growth medium was supplemented 48 h with either 100 ng/mL lipopolysaccharide (LPS) to induce differentiation into M1-type cells or 10 ng/mL IL-4 to differentiate cells into M2-type macrophages.
Liquid chromatography-Mass Spectroscopy
Quantification of Mito-MGN intracellular accumulation was carried out as previously described (Cheng et al.). Briefly, melanoma cells (3x10⁶) and (3x10⁶) immune cells were treated with 1 μM Mito-MGN for 1 hr, supernatants removed, and cells lysed using 0.1% v/v Triton X-100. CH2Cl2 containing 1 μM TPP+-C10, as an internal standard. The organic layer was collected and evaporated then dissolved in (25% acetonitrile:75% water). LC-MS/MS analyses were performed simultaneously on a Shimadzu LCMS-8060 Triple Quadrupole Liquid Chromatograph Mass Spectrometer (Kyoto, Japan) using a Kinetex F5 column (100 mm × 2.1 mm, 1.7 μm, Phenomenex) equilibrated with water: acetonitrile mixture (3:1) containing 0.1% v/v formic acid. Mito-MGN was eluted by increasing the content of acetonitrile from 25% to 100% over 6 min, at flow rate of 0.4 mL/min. Mito-MGN and TPP+-C10 were detected using the MRM transitions of 667.3 > 262.0 and 403.1 > 183.0, respectively, in a positive mode. All samples were normalized to the internal standard and protein concentrations.
Quantification and statistical analysis
Statistical analyses were performed using Prism 8.0 software. Power analysis was performed using an α error probability of 0.05 and a power level of 0.8 to select rigorous sample sizes for immune monitoring, tumor size, and cell culture experiments. T cell numbers measured in flow cytometry studies were used to calculate that for a 2-sided test at 5% significance level, with 80% power, we can detect differences in CD4:CD8 ratios infiltrating the tumor with 7-9 mice per group. Unpaired sample comparisons between two groups were analyzed by Student’s t-test when data was normally distributed. The log rank Mantel-Cox test was used to compare differences in survival curves between experimental groups. Data was presented as mean ± standard deviation (SD). Mice were randomly assigned to groups treated with Mito-MGN and mice treated with vehicle, a negative control. Flow cytometry, and histopathology were completed by laboratory personnel blinded to the treatment conditions. Each group of mice had 3-4 animals and in vivo experiments were repeated in 2-3 replicate cohorts to ensure sufficient statistical power. Asterisk (∗) indicate a significance value p≤ 0.05, ∗∗ indicate significance value p ≤ 0.01, ∗∗∗ indicate significance value p≤ 0.001, ∗∗∗∗ indicate significance value p≤ 0.0001.
Acknowledgments
This work is supported in part by grants from the National Institutes of General Medicine R01 GM067180 (RBH), the National Cancer Institute, U01 CA178960 (BK, MBD) and R01 CA226279 (MBD), the MCW Cancer Center and The Advancing a Healthier Wisconsin Endowment, and continuing philanthropic support from the Bobbie Nick Voss Charitable Foundation. LC-MS/MS and Seahorse-XFe96-based analyses were performed in the MCW Cancer Center Redox & Bioenergetics Shared Resource. We thank Ms. Katie Chaney in the MCW Bone Marrow Transplant & Cell Therapy Laboratories for assistance with completing the IsoPlexis T cell cytokine analyses. We gratefully thank Children's Research Institute Flow Cytometry Shared Resource. The content is solely the responsibility of the author(s) and does not necessarily represent the official views of the NIH.
Author contributions
Conceptualization: MAE, BK, MBD.
Data curation: MCH.
Formal Analysis: MAE, DM, LM, JZ, MH.
Funding acquisition: RBH, BK, MBD.
Investigation: MAE, DM, LM, DD, GC, KAB, JZ, MCH.
Methodology: MAE, KAB, MH, JZ, BDJ, MCH, RBH, BK, MBD.
Project Administration: MBD.
Resources: JZ, MH, BDJ, RBH, BK, MBD.
Software: MCH, RBH.
Supervision: MBD.
Validation: MAE, DM, LM, JZ, MH, MCH.
Visualization: MAE, GC, JZ, KAB, MCH.
Writing – original draft: MAE.
Writing – review and editing: KAB, JZ, BDJ, RBH, GC, BK, MBD.
Declaration of interests
MBD is a co-founder and has ownership and financial interests in Protein Foundry, LLC and Xlock Biosciences, LLC. BK has a composition of matter and application of use patent on the manufacture and use of mito-magnolol in cancer (USPTO 62/779,795). RBH has significant financial interests in Cytegen Corp and is an inventor on issued and pending patents unrelated to the subject matter or materials discussed in this manuscript. The remaining authors have no conflicts to disclose.
Inclusion and diversity
We worked to ensure gender balance in the recruitment of non-human subjects. One or more of the authors of this paper self-identifies as an underrepresented ethnic minority in science.
Published: June 25, 2021
Footnotes
Supplemental information can be found online at https://doi.org/10.1016/j.isci.2021.102653.
Supplemental information
References
- Abildgaard C., Dahl C., Basse A.L., Ma T., Guldberg P. Bioenergetic modulation with dichloroacetate reduces the growth of melanoma cells and potentiates their response to BRAFV600E inhibition. J. Transl. Med. 2014;12:247. doi: 10.1186/s12967-014-0247-5. [DOI] [PMC free article] [PubMed] [Google Scholar]
- Batus M., Waheed S., Ruby C., Petersen L., Bines S.D., Kaufman H.L. Optimal management of metastatic melanoma: current strategies and future directions. Am. J. Clin. Dermatol. 2013;14:179–194. doi: 10.1007/s40257-013-0025-9. [DOI] [PMC free article] [PubMed] [Google Scholar]
- Boyle K.A., Van Wickle J., Hill R.B., Marchese A., Kalyanaraman B., Dwinell M.B. Mitochondria-targeted drugs stimulate mitophagy and abrogate colon cancer cell proliferation. J. Biol. Chem. 2018;293:14891–14904. doi: 10.1074/jbc.RA117.001469. [DOI] [PMC free article] [PubMed] [Google Scholar]
- Bridges H.R., Jones A.J., Pollak M.N., Hirst J. Effects of metformin and other biguanides on oxidative phosphorylation in mitochondria. Biochem. J. 2014;462:475–487. doi: 10.1042/BJ20140620. [DOI] [PMC free article] [PubMed] [Google Scholar]
- Cerniglia G.J., Dey S., Gallagher-Colombo S.M., Daurio N.A., Tuttle S., Busch T.M., Lin A., Sun R., Esipova T.V., Vinogradov S.A. The PI3K/Akt pathway regulates oxygen metabolism via pyruvate dehydrogenase (PDH)-E1α phosphorylation. Mol. Cancer Ther. 2015;14:1928–1938. doi: 10.1158/1535-7163.MCT-1914-0888. [DOI] [PMC free article] [PubMed] [Google Scholar]
- Chamcheu J.C., Roy T., Uddin M.B., Banang-Mbeumi S., Chamcheu R.N., Walker A.L., Liu Y.Y., Huang S. Role and therapeutic targeting of the PI3K/Akt/mTOR signaling pathway in skin cancer: a review of current status and future trends on natural and synthetic agents therapy. Cells. 2019;8:803. doi: 10.3390/cells8080803. [DOI] [PMC free article] [PubMed] [Google Scholar]
- Chamoto K., Chowdhury P.S., Kumar A., Sonomura K., Matsuda F., Fagarasan S., Honjo T. Mitochondrial activation chemicals synergize with surface receptor PD-1 blockade for T cell-dependent antitumor activity. Proc. Natl. Acad. Sci. U S A. 2017;114:E761–E770. doi: 10.1073/pnas.1620433114. [DOI] [PMC free article] [PubMed] [Google Scholar]
- Cheng G., Hardy M., Zielonka J., Weh K., Zielonka M., Boyle K.A., Abu Eid M., McAllister D., Bennett B., Kresty L.A. Mitochondria-targeted magnolol inhibits OXPHOS, proliferation, and tumor growth via modulation of energetics and autophagy in melanoma cells. Cancer Treat. Res. Commun. 2020;25:100210. doi: 10.1016/j.ctarc.2020.100210. [DOI] [PMC free article] [PubMed] [Google Scholar]
- Cheng G., Zielonka J., Dranka B.P., McAllister D., Mackinnon A.C., Jr., Joseph J., Kalyanaraman B. Mitochondria-targeted drugs synergize with 2-deoxyglucose to trigger breast cancer cell death. Cancer Res. 2012;72:2634–2644. doi: 10.1158/0008-5472.CAN-11-3928. [DOI] [PMC free article] [PubMed] [Google Scholar]
- Cheng G., Zielonka J., McAllister D., Hardy M., Ouari O., Joseph J., Dwinell M.B., Kalyanaraman B. Antiproliferative effects of mitochondria-targeted cationic antioxidants and analogs: role of mitochondrial bioenergetics and energy-sensing mechanism. Cancer Lett. 2015;365:96–106. doi: 10.1016/j.canlet.2015.05.016. [DOI] [PMC free article] [PubMed] [Google Scholar]
- Cheng G., Zielonka J., McAllister D., Tsai S., Dwinell M.B., Kalyanaraman B. Profiling and targeting of cellular bioenergetics: inhibition of pancreatic cancer cell proliferation. Br. J. Cancer. 2014;111:85–93. doi: 10.1038/bjc.2014.272. [DOI] [PMC free article] [PubMed] [Google Scholar]
- Cheng G., Zielonka J., McAllister D.M., Mackinnon A.C., Jr., Joseph J., Dwinell M.B., Kalyanaraman B. Mitochondria-targeted vitamin E analogs inhibit breast cancer cell energy metabolism and promote cell death. BMC cancer. 2013;13:285. doi: 10.1186/1471-2407-13-285. [DOI] [PMC free article] [PubMed] [Google Scholar]
- Cheng G., Zielonka J., Ouari O., Lopez M., McAllister D., Boyle K., Barrios C.S., Weber J.J., Johnson B.D., Hardy M. Mitochondria-targeted analogues of metformin exhibit enhanced antiproliferative and radiosensitizing effects in pancreatic cancer cells. Cancer Res. 2016;76:3904–3915. doi: 10.1158/0008-5472.CAN-15-2534. [DOI] [PMC free article] [PubMed] [Google Scholar]
- Dhanasekaran A., Kotamraju S., Karunakaran C., Kalivendi S.V., Thomas S., Joseph J., Kalyanaraman B. Mitochondria superoxide dismutase mimetic inhibits peroxide-induced oxidative damage and apoptosis: role of mitochondrial superoxide. Free Radic. Biol. Med. 2005;39:567–583. doi: 10.1016/j.freeradbiomed.2005.1004.1016. [DOI] [PubMed] [Google Scholar]
- Domingues B., Lopes J.M., Soares P., Populo H. Melanoma treatment in review. ImmunoTargets Ther. 2018;7:35–49. doi: 10.2147/ITT.S134842. [DOI] [PMC free article] [PubMed] [Google Scholar]
- Dykens J.A., Jamieson J., Marroquin L., Nadanaciva S., Billis P.A., Will Y. Biguanide-induced mitochondrial dysfunction yields increased lactate production and cytotoxicity of aerobically-poised HepG2 cells and human hepatocytes in vitro. Toxicol. Appl. Pharmacol. 2008;233:203–210. doi: 10.1016/j.taap.2008.1008.1013. [DOI] [PubMed] [Google Scholar]
- Gao P., Pan W., Li N., Tang B. Fluorescent probes for organelle-targeted bioactive species imaging. Chem. Sci. 2019;10:6035–6071. doi: 10.1039/c6039sc01652j. [DOI] [PMC free article] [PubMed] [Google Scholar]
- Gato-Cañas M., Martinez de Morentin X., Blanco-Luquin I., Fernandez-Irigoyen J., Zudaire I., Liechtenstein T., Arasanz H., Lozano T., Casares N., Chaikuad A. A core of kinase-regulated interactomes defines the neoplastic MDSC lineage. Oncotarget. 2015;6:27160–27175. doi: 10.18632/oncotarget.24746. [DOI] [PMC free article] [PubMed] [Google Scholar]
- Gide T.N., Wilmott J.S., Scolyer R.A., Long G.V. Primary and acquired resistance to immune checkpoint inhibitors in metastatic melanoma. Clin. Cancer Res. 2018;24:1260–1270. doi: 10.1158/1078-0432.CCR-17-2267. [DOI] [PubMed] [Google Scholar]
- Halbrook C.J., Pontious C., Kovalenko I., Lapienyte L., Dreyer S., Lee H.J., Thurston G., Zhang Y., Lazarus J., Sajjakulnukit P. Macrophage-released pyrimidines inhibit gemcitabine therapy in pancreatic cancer. Cell Metab. 2019;29:1390–1399.e1396. doi: 10.1016/j.cmet.2019.1302.1001. [DOI] [PMC free article] [PubMed] [Google Scholar]
- Hodis E., Watson I.R., Kryukov G.V., Arold S.T., Imielinski M., Theurillat J.P., Nickerson E., Auclair D., Li L., Place C. A landscape of driver mutations in melanoma. Cell. 2012;150:251–263. doi: 10.1016/j.cell.2012.1006.1024. [DOI] [PMC free article] [PubMed] [Google Scholar]
- Hossain F., Al-Khami A.A., Wyczechowska D., Hernandez C., Zheng L., Reiss K., Valle L.D., Trillo-Tinoco J., Maj T., Zou W. Inhibition of fatty acid oxidation modulates immunosuppressive functions of myeloid-derived suppressor cells and enhances cancer therapies. Cancer Immunol. Res. 2015;3:1236–1247. doi: 10.1158/2326-6066.CIR-1215-0036. [DOI] [PMC free article] [PubMed] [Google Scholar]
- Izreig S., Gariepy A., Kaymak I., Bridges H.R., Donayo A.O., Bridon G., DeCamp L.M., Kitchen-Goosen S.M., Avizonis D., Sheldon R.D. Repression of LKB1 by miR-17∼92 sensitizes MYC-dependent lymphoma to biguanide treatment. Cell Rep. Med. 2020;1:100014. doi: 10.101016/j.xcrm.102020.100014. [DOI] [PMC free article] [PubMed] [Google Scholar]
- Jian S.L., Chen W.W., Su Y.C., Su Y.W., Chuang T.H., Hsu S.C., Huang L.R. Glycolysis regulates the expansion of myeloid-derived suppressor cells in tumor-bearing hosts through prevention of ROS-mediated apoptosis. Cell Death Dis. 2017;8:e2779. doi: 10.1038/cddis.2017.2192. [DOI] [PMC free article] [PubMed] [Google Scholar]
- Kalyanaraman B., Cheng G., Hardy M., Ouari O., Lopez M., Joseph J., Zielonka J., Dwinell M.B. A review of the basics of mitochondrial bioenergetics, metabolism, and related signaling pathways in cancer cells: therapeutic targeting of tumor mitochondria with lipophilic cationic compounds. Redox Biol. 2018;14:316–327. doi: 10.1016/j.redox.2017.09.020. [DOI] [PMC free article] [PubMed] [Google Scholar]
- Kawada K., Toda K., Sakai Y. Targeting metabolic reprogramming in KRAS-driven cancers. Int. J. Clin. Oncol. 2017;22:651–659. doi: 10.1007/s10147-10017-11156-10144. [DOI] [PubMed] [Google Scholar]
- Kurtoglu M., Lampidis T.J. From delocalized lipophilic cations to hypoxia: blocking tumor cell mitochondrial function leads to therapeutic gain with glycolytic inhibitors. Mol. Nutr. Food Res. 2009;53:68–75. doi: 10.1002/mnfr.200700457. [DOI] [PMC free article] [PubMed] [Google Scholar]
- Le Bourgeois T., Strauss L., Aksoylar H.I., Daneshmandi S., Seth P., Patsoukis N., Boussiotis V.A. Targeting T cell metabolism for improvement of cancer immunotherapy. Front. Oncol. 2018;8:237. doi: 10.3389/fonc.2018.00237. [DOI] [PMC free article] [PubMed] [Google Scholar]
- Li W., Tanikawa T., Kryczek I., Xia H., Li G., Wu K., Wei S., Zhao L., Vatan L., Wen B. Aerobic glycolysis controls myeloid-derived suppressor cells and tumor immunity via a specific CEBPB isoform in triple-negative breast cancer. Cell Metab. 2018;28:87–103.e106. doi: 10.1016/j.cmet.2018.1004.1022. [DOI] [PMC free article] [PubMed] [Google Scholar]
- Ma L., Zong X. Metabolic symbiosis in chemoresistance: refocusing the role of aerobic glycolysis. Front. Oncol. 2020;10:5. doi: 10.3389/fonc.2020.00005. [DOI] [PMC free article] [PubMed] [Google Scholar]
- Maertin S., Elperin J.M., Lotshaw E., Sendler M., Speakman S.D., Takakura K., Reicher B.M., Mareninova O.A., Grippo P.J., Mayerle J. Roles of autophagy and metabolism in pancreatic cancer cell adaptation to environmental challenges. Am. J. Physiol. Gastrointest. Liver Physiol. 2017;313:G524–G536. doi: 10.1152/ajpgi.00138.02017. [DOI] [PMC free article] [PubMed] [Google Scholar]
- McQuin C., Goodman A., Chernyshev V., Kamentsky L., Cimini B.A., Karhohs K.W., Doan M., Ding L., Rafelski S.M., Thirstrup D. CellProfiler 3.0: next-generation image processing for biology. PLoS Biol. 2018;16:e2005970. doi: 10.2001371/journal.pbio.2005970. [DOI] [PMC free article] [PubMed] [Google Scholar]
- Miller K.D., Siegel R.L., Lin C.C., Mariotto A.B., Kramer J.L., Rowland J.H., Stein K.D., Alteri R., Jemal A. Cancer treatment and survivorship statistics, 2016. Cancer J. Clin. 2016;66:271–289. doi: 10.3322/caac.21349. [DOI] [PubMed] [Google Scholar]
- Molina J.R., Sun Y., Protopopova M., Gera S., Bandi M., Bristow C., McAfoos T., Morlacchi P., Ackroyd J., Agip A.A. An inhibitor of oxidative phosphorylation exploits cancer vulnerability. Nat. Med. 2018;24:1036–1046. doi: 10.1038/s41591-018-0052-4. [DOI] [PubMed] [Google Scholar]
- Monjazeb A.M., Kent M.S., Grossenbacher S.K., Mall C., Zamora A.E., Mirsoian A., Chen M., Kol A., Shiao S.L., Reddy A. Blocking indolamine-2,3-dioxygenase rebound immune suppression boosts antitumor effects of radio-immunotherapy in murine models and spontaneous canine malignancies. Clin. Cancer Res. 2016;22:4328–4340. doi: 10.1158/1078-0432.CCR-4315-3026. [DOI] [PMC free article] [PubMed] [Google Scholar]
- Murray P.J. Amino acid auxotrophy as a system of immunological control nodes. Nat. Immunol. 2016;17:132–139. doi: 10.1038/ni.3323. [DOI] [PMC free article] [PubMed] [Google Scholar]
- Nadakavukaren K.K., Nadakavukaren J.J., Chen L.B. Increased rhodamine 123 uptake by carcinoma cells. Cancer Res. 1985;45:6093–6099. [PubMed] [Google Scholar]
- Overwijk W.W., Restifo N.P. B16 as a mouse model for human melanoma. Curr. Protoc. Immunol. 2001;20:21. doi: 10.1002/0471142735.im0471142001s0471142739. [DOI] [PMC free article] [PubMed] [Google Scholar]
- Owen M.R., Doran E., Halestrap A.P. Evidence that metformin exerts its anti-diabetic effects through inhibition of complex 1 of the mitochondrial respiratory chain. Biochem. J. 2000;348 Pt 3:607–614. [PMC free article] [PubMed] [Google Scholar]
- Pan J., Lee Y., Cheng G., Zielonka J., Zhang Q., Bajzikova M., Xiong D., Tsaih S.W., Hardy M., Flister M. Mitochondria-targeted honokiol confers a striking inhibitory effect on lung cancer via inhibiting complex I activity. iScience. 2018;3:192–207. doi: 10.1016/j.isci.2018.04.013. [DOI] [PMC free article] [PubMed] [Google Scholar]
- Polak M.E., Borthwick N.J., Gabriel F.G., Johnson P., Higgins B., Hurren J., McCormick D., Jager M.J., Cree I.A. Mechanisms of local immunosuppression in cutaneous melanoma. Br. J. Cancer. 2007;96:1879–1887. doi: 10.1038/sj.bjc.6603763. [DOI] [PMC free article] [PubMed] [Google Scholar]
- Robey R.B., Hay N. Is Akt the "Warburg kinase"?-Akt-energy metabolism interactions and oncogenesis. Semin. Cancer Biol. 2009;19:25–31. doi: 10.1016/j.semcancer.2008.1011.1010. [DOI] [PMC free article] [PubMed] [Google Scholar]
- Sanchez M., Gastaldi L., Remedi M., Cáceres A., Landa C. Rotenone-induced toxicity is mediated by Rho-GTPases in hippocampal neurons. Toxicol. Sci. 2008;104:352–361. doi: 10.1093/toxsci/kfn1092. [DOI] [PubMed] [Google Scholar]
- Sancho P., Burgos-Ramos E., Tavera A., Bou Kheir T., Jagust P., Schoenhals M., Barneda D., Sellers K., Campos-Olivas R., Graña O. MYC/PGC-1α balance determines the metabolic phenotype and plasticity of pancreatic cancer stem cells. Cell Metab. 2015;22:590–605. doi: 10.1016/j.cmet.2015.1008.1015. [DOI] [PubMed] [Google Scholar]
- Schindelin J., Arganda-Carreras I., Frise E., Kaynig V., Longair M., Pietzsch T., Preibisch S., Rueden C., Saalfeld S., Schmid B. Fiji: an open-source platform for biological-image analysis. Nat. Methods. 2012;9:676–682. doi: 10.1038/nmeth.2019. [DOI] [PMC free article] [PubMed] [Google Scholar]
- Sena L.A., Li S., Jairaman A., Prakriya M., Ezponda T., Hildeman D.A., Wang C.R., Schumacker P.T., Licht J.D., Perlman H. Mitochondria are required for antigen-specific T cell activation through reactive oxygen species signaling. Immunity. 2013;38:225–236. doi: 10.1016/j.immuni.2012.10.020. [DOI] [PMC free article] [PubMed] [Google Scholar]
- Shaik Z.P., Fifer E.K., Nowak G. Akt activation improves oxidative phosphorylation in renal proximal tubular cells following nephrotoxicant injury. Am. J. Physiol. Ren. Physiol. 2008;294:F423–F432. doi: 10.1152/ajprenal.00463.02007. [DOI] [PMC free article] [PubMed] [Google Scholar]
- Solito S., Pinton L., De Sanctis F., Ugel S., Bronte V., Mandruzzato S., Marigo I. Methods to measure MDSC immune suppressive activity in vitro and in vivo. Curr. Protoc. Immunol. 2019;124:e61. doi: 10.1002/cpim.1061. [DOI] [PubMed] [Google Scholar]
- Sousa C.M., Biancur D.E., Wang X., Halbrook C.J., Sherman M.H., Zhang L., Kremer D., Hwang R.F., Witkiewicz A.K., Ying H. Pancreatic stellate cells support tumour metabolism through autophagic alanine secretion. Nature. 2016;536:479–483. doi: 10.1038/nature19084. [DOI] [PMC free article] [PubMed] [Google Scholar]
- Sukumar M., Liu J., Mehta G.U., Patel S.J., Roychoudhuri R., Crompton J.G., Klebanoff C.A., Ji Y., Li P., Yu Z. Mitochondrial membrane potential identifies cells with enhanced stemness for cellular therapy. Cell Metab. 2016;23:63–76. doi: 10.1016/j.cmet.2015.11.002. [DOI] [PMC free article] [PubMed] [Google Scholar]
- Summerhayes I.C., Lampidis T.J., Bernal S.D., Nadakavukaren J.J., Nadakavukaren K.K., Shepherd E.L., Chen L.B. Unusual retention of rhodamine 123 by mitochondria in muscle and carcinoma cells. Proc. Natl. Acad. Sci. U S A. 1982;79:5292–5296. doi: 10.1073/pnas.79.17.5292. [DOI] [PMC free article] [PubMed] [Google Scholar]
- Tsao H., Goel V., Wu H., Yang G., Haluska F.G. Genetic interaction between NRAS and BRAF mutations and PTEN/MMAC1 inactivation in melanoma. J. Invest. Dermatol. 2004;122:337–341. doi: 10.1046/j.0022-202X.2004.22243.x. [DOI] [PMC free article] [PubMed] [Google Scholar]
- Van Der Heide L.P., Hoekman M.F., Smidt M.P. The ins and outs of FoxO shuttling: mechanisms of FoxO translocation and transcriptional regulation. Biochem. J. 2004;380:297–309. doi: 10.1042/BJ20040167. [DOI] [PMC free article] [PubMed] [Google Scholar]
- Vander Heiden M.G., Cantley L.C., Thompson C.B. Understanding the Warburg effect: the metabolic requirements of cell proliferation. Science. 2009;324:1029–1033. doi: 10.1126/science.1160809. [DOI] [PMC free article] [PubMed] [Google Scholar]
- Wang D.S., Jonker J.W., Kato Y., Kusuhara H., Schinkel A.H., Sugiyama Y. Involvement of organic cation transporter 1 in hepatic and intestinal distribution of metformin. J. Pharmacol. Exp. Ther. 2002;302:510–515. doi: 10.1124/jpet.1102.034140. [DOI] [PubMed] [Google Scholar]
- Weyand C.M., Goronzy J.J. A mitochondrial checkpoint in autoimmune disease. Cell Metab. 2018;28:185–186. doi: 10.1016/j.cmet.2018.1007.1014. [DOI] [PMC free article] [PubMed] [Google Scholar]
- Xintaropoulou C., Ward C., Wise A., Marston H., Turnbull A., Langdon S.P. A comparative analysis of inhibitors of the glycolysis pathway in breast and ovarian cancer cell line models. Oncotarget. 2015;6:25677–25695. doi: 10.18632/oncotarget.24499. [DOI] [PMC free article] [PubMed] [Google Scholar]
- Yadav R.K., Chauhan A.S., Zhuang L., Gan B. FoxO transcription factors in cancer metabolism. Semin. Cancer Biol. 2018;50:65–76. doi: 10.1016/j.semcancer.2018.1001.1004. [DOI] [PMC free article] [PubMed] [Google Scholar]
- Zhou C., Sun H., Zheng C., Gao J., Fu Q., Hu N., Shao X., Zhou Y., Xiong J., Nie K. Oncogenic HSP60 regulates mitochondrial oxidative phosphorylation to support Erk1/2 activation during pancreatic cancer cell growth. Cell Death Dis. 2018;9:161. doi: 10.1038/s41419-41017-40196-z. [DOI] [PMC free article] [PubMed] [Google Scholar]
Associated Data
This section collects any data citations, data availability statements, or supplementary materials included in this article.
Supplementary Materials
Data Availability Statement
The CellProfile pipeline is freely available at the R. Blake Hill laboratory website (https://github.com/Hill-Lab/Mito-MGN-Scripts).