

Summary
The formation of stress granules (SGs) is an essential aspect of the cellular response to many kinds of stress, but its adaptive role is far from clear. SG dysfunction is implicated in aging-onset neurodegenerative diseases, prompting interest in their physiological function. Here, we report that during starvation stress, SGs interact with mitochondria and regulate metabolic remodeling. We show that SG formation leads to a downregulation of fatty acid β-oxidation (FAO) through the modulation of mitochondrial voltage-dependent anion channels (VDACs), which import fatty acids (FAs) into mitochondria. The subsequent decrease in FAO during long-term starvation reduces oxidative damage and rations FAs for longer use. Failure to form SGs, whether caused by the genetic deletion of SG components or an amyotrophic lateral sclerosis (ALS)-associated mutation, translates into an inability to downregulate FAO. Because metabolic dysfunction is a common pathological element of neurodegenerative diseases, including ALS, our findings provide a direction for studying the clinical relevance of SGs.
Keywords: stress granule, lipid metabolism, fatty acid oxidation, VDAC, mitochondria, porin, starvation, ALS, lipid droplet, metabolic adaptation
Graphical abstract
Highlights
-
•
Stress granules inhibit fatty acid oxidation
-
•
Stress granules regulate VDAC levels
-
•
Stress granules control mitochondrial permeability to fatty acids
-
•
Stress granules redirect fatty acids to lipid droplets
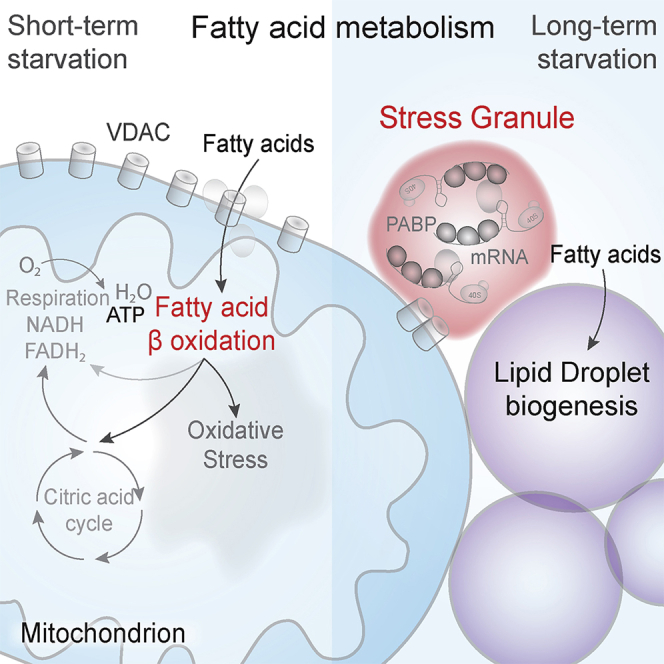
Amen and Kaganovich identify a regulatory function for stress granules in metabolic adaptation to stress. Starvation leads to a rapid activation of fatty acid oxidation, which not only provides energy but also causes oxidative damage and lipid depletion. Stress granules inhibit the import of fatty acids into mitochondria by modulating the VDAC porin. Cells derived from ALS patients fail to form functional stress granules, leading to uncontrolled fatty acid oxidation.
Introduction
Stress granule (SG) formation is a common feature of otherwise unrelated stress phenomena, which include heat stress, oxidative stress (e.g., arsenite), UV irradiation, endoplasmic reticulum (ER) stress, viral infection, and chronic nutrient starvation (Buchan et al., 2011; Jevtov et al., 2015; Moutaoufik et al., 2014; Piotrowska et al., 2010; Reineke et al., 2018; Walker et al., 2013). In certain cases, the protective function of SGs has been described. For example, during acute stress SGs inhibit pro-apoptotic kinases and therefore promote survival (Arimoto et al., 2008). In other instances, the connection between SGs and stress resistance is less clear. A number of additional functions have been reported for SGs, including mRNA quality control, spatiotemporal control of gene expression, regulation of nucleocytoplasmic transport, prevention of pathological protein aggregation, regulation of cell growth and kinase signaling, and alleviation of reactive oxygen species (ROS) damage (Kedersha and Anderson, 2007; Kedersha et al., 2005, 2013; Khong et al., 2017; Mann et al., 2019; McGurk et al., 2018; Panas et al., 2016; Takahashi et al., 2013; Zhang et al., 2018; Mediani et al., 2021; Amen and Kaganovich, 2020b). In the latter case, SGs are shown to be activated by oxidative stress (Kato et al., 2019) and to promote survival by activating the antioxidant activity of USP10, thereby reducing ROS production (Takahashi et al., 2013). In several other stress conditions, however, the precise role of SGs is not known. Additionally, it is not clear whether SGs carry out specific functions at different times and stresses, or whether their versatility allows them to simultaneously exert control over multiple levels of stress response by driving multiple functions all at once. Overall, the importance of SGs to cell survival is best demonstrated by disease states that are apparently brought about by SG dysfunction (Aulas and Vande Velde, 2015; Dewey et al., 2012; Cong et al., 2013). Many instances of a heritable form of amyotrophic lateral sclerosis (ALS), an aging-triggered neurodegenerative disease (ND), are attributed to mutations in SG constituent proteins or RNAs (Dewey et al., 2012; Lenzi et al., 2015; Cong et al., 2013; Mackenzie et al., 2017). These include the RNA-binding proteins TDP43, FUS, superoxide dismutase SOD1, C9ORF72, and others (Taylor et al., 2016). Some of these mutations, such as those in FUS and SOD1, have been shown to alter the physical properties of SGs, thereby compromising their function (Mateju et al., 2017; Patel et al., 2015); and others (e.g., TDP43 Q331K mutant) titrate a critical component of SGs, thereby suppressing their formation (Gordon et al., 2019; Orrù et al., 2016). The physiological functions of SGs are therefore of great interest, particularly in the context of seeking to understand the precise set of protections afforded by SGs to neurons and the way in which their breakdown leads to pathology.
We hypothesized that metabolic stress presents an opportunity to investigate SG function in a context that is relevant to ND pathology. Fuel starvation is a known physiological SG trigger (Buchan et al., 2011; Fritz et al., 2015; Reineke et al., 2018), leading to the assembly of SGs with distinct composition through a pathway that is initiated by the mechanistic target of rapamycin complex 1 (mTORC1) inhibition, leading to eIF4E dephosphorylation and inhibition of protein synthesis (Gingras et al., 1999; Reineke et al., 2018; Sengupta et al., 2010; Sfakianos et al., 2018). Chronic stress is in line with the age-induced emergence of ND pathology that spans decades, rather than be triggered by acute stress. Moreover, the response to nutrient starvation may be of particular importance to neurons, which are thought to have unusually high energy needs in specific sub-cellular environments for operating ion channels, transporting organelles across the axon, and maintaining a functional synapse (Knobloch et al., 2017; Pennetta and Welte, 2018). Indeed, most NDs have a mitochondrial dysfunction component, leading to aberrant metabolism (Johri and Beal, 2012; Lahtvee et al., 2016; Vandoorne et al., 2018). Pointedly, ALS can also be viewed as a set of metabolic problems, particularly hypermetabolism, which are characterized by increased energy demand, and a shift from glucose-fueled metabolism to the hyperactive depletion of lipid energy reserves (Liu et al., 2018; Pennetta and Welte, 2018; Szelechowski et al., 2018; Tefera and Borges, 2017; Allen et al., 2019; Scaricamazza et al., 2020).
During nutrient starvation, mammalian cells reconfigure their metabolic networks in order to switch from glucose metabolism to a greater reliance on lipids (Sengupta et al., 2010). Although a highly efficient energy source, reliance on lipids is not without drawbacks. In order to make the shift to fatty acid β-oxidation (FAO), cells must deploy fatty acids (FAs) stored as high-energy triacylglycerols in lipid droplets (LDs). FAs must then be imported into mitochondria for β-oxidation and for use in the citric acid cycle, requiring mitochondrial structural rearrangements. In order to be transferred to mitochondria, FAs must be liberated from LDs by lipases on the LD surface, or by lysosomal lipophagy during longer starvation bouts. However, despite the increase in lipid consumption, during starvation LD number and size typically increase (Nguyen et al., 2017). The reason for this might be that FAs in LDs need to be replenished for use in subsequent FAO, produced either through lipophagy or de novo synthesis. Severe depletion of lipids can fatally damage membranes, while high concentrations of free cytoplasmic FAs are toxic (Listenberger et al., 2003; Lu et al., 2010). In addition to the toxicity caused by free FAs, FAO also liberates high quantities of ROS and is therefore damaging to the cell in and of itself (Cortassa et al., 2017; Kajihara et al., 2017; Schönfeld and Wojtczak, 2008). It is essential that cells exert precise regulation over lipid flux, in order to produce ATP, have sufficient FAs for long-term starvation, and avoid toxic side-effects of FAO. It is thought that much of this critical regulation takes place on the mitochondrial membrane, in the form of local translation of mRNAs, LD biogenesis, lipid liberation from LDs, and mitochondrial import of FAs (Benador et al., 2019; Eliyahu et al., 2010).
Here, we report that during long-term nutrient starvation SGs initially form in association with mitochondria, peroxisomes, and LDs. SG formation, regardless of whether it is triggered by starvation or acute stress, results in the depletion of mitochondrial membrane porins—voltage-dependent anion channel 1 (VDAC1) and VDAC2. This makes mitochondria less permeable to FAs. The perturbation of this FAO downregulation process results in dysregulated lipid metabolism, aberrantly high ATP levels, and increased oxidative damage. Overall, our study provides insight for understanding the mechanism of metabolic remodeling in response to starvation and in disease and helps reconcile diverse models of SG function.
Results
SGs inhibit FAO during long-term starvation
Starving cells, in most cases, shift their metabolism to FAO in order to maintain energy levels (Mihaylova et al., 2018). Since starvation is also a trigger for SG formation, we set out to investigate the relationship between energy availability and the appearance of SGs over time, in short-term (0–6 h) and long-term (9–18 h) starvation. During short-term starvation, cells are indeed able to maintain their ATP levels (Figures 1A and 1B) by upregulating FAO (Figures 1C, S1A, S6A, and S6B). As expected, ATP levels were dependent on the presence of the mitochondrial HADHA (hydroxyacyl-coenzyme A [CoA] dehydrogenase trifunctional multienzyme complex subunit alpha) enzyme that catalyzes β-oxidation of FAs in mitochondria and were severely depleted in a CRISPR-Cas9 knockout (KO) of HADHA during starvation (Figures 1D and S1B). Accordingly, levels of HADHA increased during short-term starvation (Figures 1E and S1C–S1F).
Figure 1.

Stress granules (SGs) inhibit FAO
(A and B) Confocal ratiometric imaging of HEK293T cells expressing PercevalHR ATP/ADP ratio marker during starvation for 12 h. Representative confocal planes of the ratio (ex488/ex405) are shown. Scale bar, 5 μm. Graphs show normalized ATP/ADP ratio (ex488/ex405) in starvation and control conditions, mean ± SEM, ∗p < 0.05. Rotenone (4 μM) was added as a negative control.
(C) Oxygen consumption rate (OCR) used for fatty acid β-oxidation (FAO) in HEK293T cells in different conditions. Graph represents FAO dependency in mitochondria to maintain respiration, mean ± SEM, ∗p < 0.05.
(D) Confocal ratiometric imaging of control and HADHA knockout (KO) HEK293T cells expressing PercevalHR during control and starvation. Representative confocal planes are shown. Scale bar, 5 μm. Graph shows average ATP/ADP ratio (ex488/ex405) in starvation and control conditions, mean ± SEM, ∗p < 0.05.
(E) Western blot of HEK293T cells starved for 3 h or treated with PPAR activators clofibrate, rosiglitazone, and GW501516 (100 μM each) for 3 h. Quantification shows fold induction of HADHA relative to control conditions (lane 2), ∗p < 0.05.
(F) Blue graph shows fold change in FAO dependency of HEK293T cells in control medium or starved for 4 or 18 h, and green graph shows ratio of CRISPR-Cas9 PABPC1-DDR2 cells with SGs in the population during 18 h of starvation, mean ± SEM.
(G) Confocal microscopy of SG formation in CRISPR-Cas9-tagged PABPC1-DDR2 HEK293T cells incubated in fuel starvation media for indicated amounts of time. Representative confocal planes are shown. Arrows indicate SGs. Scale bar 5, μm.
(H) SG formation in cells with or without TDP43 Q331K mutation during starvation. Representative confocal images are shown. Scale bar, 5 μm. Hoechst (10 μg/mL) was used to stain the nucleus. Number in the top left corner of merged image represents percentage of cells with SGs in the population, mean ± SEM, ∗p < 0.05.
(I) FAO dependency in SH-SY5Y cells with or without TDP43 Q331K-GFP mutation during starvation, mean ± SEM, ∗p < 0.05.
(J) Confocal ratiometric imaging of ATP/ADP ratio in SH-SY5Y cells with or without TDP43 Q331K mutation expressing PercevalHR starved for 24 h. Hoechst was added 15 min prior to the imaging to enable cytoplasmic measurement. Representative confocal planes are shown. Scale bar, 5 μm. Graph shows ATP/ADP ratio (ex488/ex405), mean ± SEM, ∗p < 0.05.
(K) Confocal microscopy of oxidative stress levels in SH-SY5Y cells with or without TDP43 Q331K mutation starved for 24 h and stained with 2′,7′-dichlorofluorescin diacetate (H2-DFCDA) (100 μM) 1 h prior to the imaging. Scale bar, 5 μm.
(L) Graph shows average cytoplasmic fluorescence intensity in starvation and control conditions, mean ± SEM, ∗p < 0.01. Top panels: confocal ratiometric microscopy of SHSY-5Y cells with TDP43 Q331K mutation expressing PercevalHR incubated in starvation media for 18 h with vehicle or etomoxir (5 μM). Scale bar, 5 μm. Bottom panels: confocal microscopy of SHSY-5Y cells with TDP43 Q331K mutation incubated in starvation media with vehicle or etomoxir (5 μM) and stained with H2-DFCDA (100 μM) 1 h prior to the imaging. Scale bar, 5 μm. Quantification shows ATP/ADP ratio (ex488/ex405) in starvation and control condition (left) and cytoplasmic fluorescence intensity in starvation and control conditions (right), mean ± SEM, ∗p < 0.05.
(M) Western blot of U2OS WT and G3BP1/2 KO cell lines, ∗p < 0.01.
(N) Confocal microscopy of SGs formation in U2OS WT and G3BP1/2 KO cells grown in control and 16 h starvation conditions, fixed, and stained with anti-G3BP and anti-TIA1 antibodies. Scale bar, 5 μm. Quantification shows the ratio of cells with SGs in the population, mean ± SEM, ∗p < 0.01. See also Figures S3A and S3B.
(O) Analysis of FAO in U2OS WT and G3BP1/2 KO cells during short-term and long-term starvation, mean ± SEM, ∗p < 0.01.
Surprisingly, however, although FAO is a more efficient energy source than glycolysis, ATP levels nevertheless showed a marked decline during long-term starvation, starting at 9 h (Figure 1B), corresponding to a decline in FAO (Figures 1F, blue graph, and S6C). The timing of FAO decline correlated with the formation of SGs during long-term starvation (Figure 1F). We therefore investigated the relationship between SGs and FAO. In order to visualize SGs in live cells, we endogenously tagged PABPC1 with the Dendra2 fluorophore in HEK293T cells using CRISPR-Cas9 genome editing (Figures S1G–S1J) (Ran et al., 2013; Amen and Kaganovich, 2020a). SG formation kinetics range from minutes with arsenite to hours in fuel starvation media to days in gradual nutrient depletion (Figures 1G and S1K–S1M). The ATP/ADP ratio decline observed in wild-type (WT) cells becomes apparent around the time that SGs begin to form, around 9 h of growth on starvation media (Figures 1B and 1F). This raised the question of whether low ATP levels cause SG formation, or alternatively, whether SG formation affects ATP/ADP levels by regulating FAO. In order to rule out the possibility that SGs form as a result of declining ATP concentrations, we altered ATP/ADP ratio in cells carrying a PABPC1 copy endogenously tagged with the mCherry fluorophore (Figures S1N and S1O). SGs formed in cells with both high and low ATP levels, whereas depleting ATP by blocking electron transfer chain with rotenone and carbonyl cyanide m-chlorophenylhydrazone (CCCP) was not sufficient to trigger SG formation (Figure S1P). Since it is well known that fuel starvation results in the formation of SGs (Reineke et al., 2018; Aulas et al., 2017; Buchan et al., 2011), we focused on the functional role of SGs in metabolic regulation rather than on the formation mechanisms.
To determine whether there is a causative relationship between SGs and FAO, we decided to first explore SG formation timing and dynamics. Mutations in SG components affect SG dynamics and are known causes of ALS (Aulas and Vande Velde, 2015; Gordon et al., 2019; Cong et al., 2013; Mackenzie et al., 2017). We constructed a CRISPR-Cas9-modified cell line with a heterozygous Q331K mutation and a C-terminal GFP tag in a SG component, TDP43 (Figures S2A–S2D and S2G) (Ling et al., 2010). We noticed that SG formation was profoundly delayed in the mutant cell line during starvation (Figures 1H and S2E). Strikingly, during long-term starvation TDP43 Q331K mutants showed no decrease in FAO and ATP/ADP ratio (Figures 1I, 1J, S6A, and S6B) compared with control cells. As a result, these cells accumulated oxidative damage at a faster rate than control cells (Figure 1K), which was corrected by inhibiting FA import into mitochondria with etomoxir (Figures 1L and S2F).
In order to undergo β-oxidation, FAs are imported into mitochondria. We therefore asked whether the FAO increase observed in TDP43 Q331K mutant cells during long-term starvation can be rescued by inhibiting FA transport across the mitochondrial membrane in these cells (Figure S2H). This was indeed the case: FAO in these cells decreased dramatically, as did the RedOx stress and ATP/ADP ratios (Figures 1D and S3H). Given that the TDP43 Q331K mutant has a delay in its ability to form SGs (Figure 1H), these data appear to suggest that disruption of SG dynamics is associated with dysregulation of FAO. To rule out the possibility that SGs form as a consequence of FAO-induced oxidative stress during short-term starvation, we measured oxidative damage (Figures S2I and S2J). Despite high metabolic dependency on FAO, cells were able to maintain low levels of oxidative stress and high mitochondrial potential during short-term starvation (Figures S2I and S2J). Taking these data together, we posited a regulatory relationship between SGs and FAO (Figure 1F).
To further confirm the causative relationship between SG formation and FAO inhibition, we used the U2OS G3BP1/2 KO cell line that is unable to form SGs (Yang et al., 2020) (Figures 1M, 1N, S3A, and S3B). Notably, the metabolic experiments were performed before the onset of apoptosis, which is a known consequence of SG formation in starvation (Reineke et al., 2018) (Figures S3C and S3D). U2OS cells exhibited a high reliance on FAO even in control conditions, with no increase during short-term starvation (Figures 1O, S7C, S7D, and S8A). SG formation resulted in a decrease of FAO, while cells that were unable to form SGs continued to use FAO for energy production (Figures 1O and S4C).
ALS patient-derived iPSCs differentiated along neuronal lineage exhibit impaired FAO inhibition during long-term starvation
To test the validity of our model in a physiological context, we examined cells derived from an ALS patient with a mutation in TDP43, compared with a healthy control. First, we differentiated induced pluripotent stem cells (iPSCs) along a neuronal lineage in order to implement a starvation protocol without depriving cells of SC maintenance factors (Figures 2A, 2B, S3E, and S3F). Next, we optimized the time of starvation, according to the induced FAO changes, as it varies with the cell line and the type of starvation. We confirmed that increase in FAO is specific to FA import into mitochondria using inhibition of FA uptake (Figure S3G). TDP43 mutant cells failed to downregulate FAO during long-term starvation compared with the healthy controls, similar to what we observed in immortalized cell lines. Although far from a comprehensive survey of ALS patient-derived tissues, these patient-derived cell data provide substantial reinforcement to our hypothesis. Taken together, these and the above-mentioned data support a model whereby SGs are directly involved in FAO inhibition in response to starvation stress. We next explored the possible mechanisms of this inhibition.
Figure 2.

ALS patient-derived cells are unable to regulate FAO during long-term starvation
(A) Schematic of human iPSC differentiation. Refer to Figures S3E and S3F.
(B) Western blot of stem cell and neuronal lineage markers. Quantification shows fold change relative to glyceraldehyde 3-phosphate dehydrogenase (GAPDH). Refer to Figure S3F.
(C) Human iPSCs differentiated to neuronal progenitor cells with or without TDP43 mutation were starved for 2, 4, and 6 h. Line graph represents FAO dependency mean ± SEM, ∗p < 0.05.
SG interactome reveals mitochondrial and LD association
First, we asked whether starvation-induced SGs associate with membrane-bound organelles responsible for metabolic regulation (ER, mitochondria, LDs, Golgi, and peroxisomes) (Haimovich et al., 2016). This idea is not unprecedented, as SGs have recently been reported to make physical contacts with the ER, lysosomes, cytoskeletal elements, and membrane-bound compartments (Cioni et al., 2019; Lee et al., 2020; Liao et al., 2019; Lin et al., 2016; Amen and Kaganovich, 2020b; Pattabiraman et al., 2020). We examined SG association with membrane-bound compartments following 9 h of fuel depletion, when SGs first appear (Figures 2A and S4A). Live cell confocal microscopy indicated that SGs indeed form contiguously with cytoplasmic membrane-bound organelles (Figure 3A). In order to rule out bias and coincidental proximity, we generated random “SG-like” dots and scored the occurrence of random co-localization (Figure S4B). Organelles were considered proximal to SGs if there was an overlap in the intensity profiles generated from the section crossing both compartments. The limitation of this approach is that proximity to the high-coverage organelles, such as ER, cannot be reliably estimated due to the high abundance, hence high proximity scores in real and randomly generated samples. We then carried out a pairwise comparison of random samples with the observed SG proximity and quantified the difference (Figure 2B). Three membrane-bound organelles—LDs, mitochondria, and peroxisomes—showed strongly non-random association with SGs (Figures 3B and S4C). To confirm this association, we monitored SG, mitochondria, and LDs localization over time (Figure 3C). Our data show that SG-LD-mitochondria super-complexes can persist over the course of several minutes in live cells (Figure 3C), despite movement within the cell, reinforcing the observation of interaction between the organelles involved in FA trafficking.
Figure 3.

SGs interactome reveals mitochondrial association
(A) Confocal microscopy of SG-organelle proximity in HEK293T cells expressing CRISPR-Cas9-tagged PABPC1-DDR2 starved for 9 h. Organelles were visualized with live cell dyes (added 30 min prior to the imaging) or plasmid-encoded markers: LDs (Bodipy-C12), mitochondria (Mito Red), peroxisomes (mCH-SKL), nucleus (Hoechst), lysosome (Lamp1-mCH), endoplasmic reticulum (CALR21-mCH-KDEL), and Golgi apparatus (B4GALT182-mCH). Scale bar, 1 μm.
(B) Quantification of SG proximity to membrane-bound organelles showing absolute SG proximity compared with proximity of randomly generated SG sample. Graphs show the ratio of proximal SGs in a sample, mean ± SEM, n = 30.
(C) Confocal microscopy of the tripartite association between SG (PABPC1-DDR2), LD (Bodipy-C12), and mitochondria (Rhodamine800) in HEK293T cells expressing CRISPR-Cas9-tagged PABPC1-DDR2 starved for 9 h. Organelles were visualized with live cell dyes (added 30 min prior to the imaging). Kymograph was recorded with 2 s interval between frames for 5 min. Scale bar, 1 μm.
(D) Schematic of protein identification by mass spectrometry.
(E) Circle diagram shows PABPC1 interactome identified in all conditions.
(F) Network of proteins that are present in all SG conditions, but not in the control conditions. Mitochondrial membrane protein is indicated in red.
(G) Analysis of SG-enriched fraction by comparison with G3BP-interacting proteins (Isabelle et al., 2012). Mitochondrial membrane protein VDAC2 is indicated in red.
(H) Western blot of VDAC1, VDAC2, HADHA, TDP43, and beta-Tubulin in control and starvation conditions. WT HEK293T cells were grown in control and 18 h starvation conditions prior to lysis. Graph shows the ratio of VDAC isoforms to Tubulin in all conditions, mean ± SEM, ∗p < 0.01.
(I) Western blot of VDAC1, VDAC2, G3BP, and beta-Tubulin in control and starvation conditions. WT and G3BP1/2 KO cells were grown in control and 16-h starvation conditions prior to lysis. Graph shows the ratio of VDAC isoforms to Tubulin in all conditions, mean ± SEM, ∗p < 0.01.
(J) Western blot of CRISPR-Cas9 KO of VDAC2, ∗p < 0.05.
(K) GC-FID analysis of FA profiles in purified mitochondria in control and VDAC2 KO cells treated with exogenous FA-CoA. Purified mitochondrial FA profiles were obtained using GC-FID. Graph shows levels of imported exogenous FAs in purified mitochondria, mean ± SEM, ∗p < 0.05.
(L) Analysis of OCR used for FAO in control, VDAC2 KO, and HADHA KO HEK293T cells during short-term starvation, mean ± SEM, ∗p < 0.05.
We then asked whether the SG interactome contains mitochondria-associated proteins, using BioID analysis with PABPC1, in different SG conditions (Roux et al., 2012). We fused PABPC1 to BirA(R118G) and to GFP to be able to visualize SG formation while labeling interacting proteins (Figures 3D and S4D). The SG interactome was analyzed in starvation, arsenite, and 2-bromopalmitate SG formation conditions (Figure 3D) (Amen and Kaganovich, 2021). We normalized the data for PABPC1-interacting proteins in non-SG conditions by subtracting the control normal PABPC1 interactome from SG interactomes in different conditions. Biotinylation was started by addition of biotin to the media after SG formation treatment and incubation for 6 h, leading to enrichment of biotinylation in SGs (Figures S4E and S4F). Proteins enriched in SG conditions were scored as SG-interacting proteins (Table S1). Gene Ontology analysis shows a similar pattern of groups in different SG conditions, mainly comprised of RNA-binding proteins and known SG constituents (Figures 3E and S4J; Table S2). Interestingly, the interactome of PABPC1 didn’t drastically change during SG formation, keeping more than 70% of its interactors (Figure 3E). Only 4.7% of the proteins (15 proteins) were present in all SG conditions and not in the control conditions (Figure 3F). The BioID SG interactome of enriched proteins that we obtained has a significant overlap with previously determined SG component proteomes: 11.9% with FUS, 33.7% with TDP43, 27.1% with G3BP, and 30.2% with SG proteome (Figures 3G and S4G–S4I; Table S1) (Freibaum et al., 2010; Isabelle et al., 2012; Jain et al., 2016; Kamelgarn et al., 2016). Among 15 unique SG interactors that persisted across all conditions (Figure 2F) and were not present in control conditions, our interest was drawn to a mitochondrial porin: VDAC2. VDACs reside in the mitochondrial outer membrane and facilitate solute transfer. All three VDAC isoforms have been co-purified as part of an FA transfer complex together with carnitine palmitoyltransferase 1a (CPT1a) and long-chain acyl-CoA synthetase (ACSL) (Lee et al., 2011; Naghdi and Hajnóczky, 2016). Interestingly, VDAC2 was identified previously in the interactome of another SG component—G3BP (Figure 3G) (Isabelle et al., 2012)—and the yeast VDACs Por1 and Por2 were pulled down in the Saccharomyces cerevisiae Pab1 SG interactome (Amen and Kaganovich, 2020b).
SG formation reduces mitochondrial permeability
Using western blotting, we observed that the levels of VDACs decrease during long-term starvation (Figure 3H). One possibility is that the reduction in VDAC levels is a result of concomitant inhibition of translation that is known to accompany SG formation (Buchan and Parker, 2009; Sfakianos et al., 2018; Thedieck et al., 2013). We checked whether FAO-regulating transcripts are downregulated during SG formation. FAO transcripts are regulated by the peroxisome proliferator-activated receptor (PPAR) transcriptional activator (Poulsen et al., 2012; Shao et al., 2014; Varga et al., 2011); hence, we constructed a PPAR transcriptional reporter. We placed the mCherry fluorophore under the control of the PPAR response element (PPRE) (Tzeng et al., 2015) and measured mCherry expression by western blotting and fluorescent imaging (Figures S5D–S5F) (Tzeng et al., 2015). What these assays showed unequivocally is that despite translational inhibition and SG formation, PPRE-driven expression remains active and mCherry driven by PPRE escapes the overall translational inhibition (Figure S5E). To test whether the decline in the VDAC levels during SG formation is dependent on SGs, we again used the G3BP1/2 KO cell line, which is unable to form SGs. While major VDAC isoforms are depleted during long-term starvation, the depletion does not occur if SG formation is impaired (in the G3BP1/2 KO cells), suggesting that SG formation modulates VDAC levels (Figure 3I). In addition to lowering VDAC levels, SG formation corresponds to localized clustering of VDAC2 (Figures S5A and B).
VDACs are thought to import FAs into mitochondria (Fang and Maldonado, 2018; Kerner and Hoppel, 2000; Lee et al., 2011). Therefore, reduction in VDAC levels is sufficient to reduce FAO by partially blocking FA import into mitochondria. To confirm that VDACs can directly affect FA trafficking, we created a VDAC2 KO using CRISPR-Cas9 gene editing (Figures 3J and S5G). We measured exogenous FA uptake by WT and VDAC2 KO mitochondria, by incubating purified mitochondria with FA-CoA (substrate for the carnitine shuttle) and examining FA profiles (Figures 3K and S5H). KO of VDAC2 alone resulted in a significant decrease in the uptake of the FAs. However, the VDAC2 KO was still able to uptake FAs, possibly due to the presence of other VDAC isoforms (Figure S5H). Additionally, we measured fluorescent FA accumulation in mitochondria during starvation in control and VDAC2 KO (Figure S5I). We detected a significant difference between mitochondrial FA accumulation in VDAC2 KO cells and controls (Figure S5I). To independently confirm that the reduction of FA import in VDAC2 KO is sufficient to downregulate FAO, we measured FAO in VDAC2 KO, using a HADHA KO as a negative control (Figures 3C and S8B). VDAC2 KOs showed a decrease in FAO relative to WT in short-term starvation (Figure 3C). This confirms that downregulation of VDAC levels can lead to the inhibition of FAO. Overall, these data are consistent with the proposed VDAC role in mitochondrial import of FAs for FAO.
SG formation leads to FA re-routing from mitochondria to LDs
Together, our data suggest that SG formation leads to the reduction of VDAC porin levels that, in turn, reduces the import of FAs into mitochondria. This model poses an additional question: are FAs now redirected to other cellular locations? Typically, FA-CoAs are not allowed to remain free in the cytoplasm and are instead collected in LDs as triacylglycerides. We therefore tracked fluorescently tagged FAs during the starvation-induced SG formation time course in live cells. The appearance of SGs correlated directly with the pronounced accumulation of FAs in LDs (Figures 4A and 4B). The SG-triggered accumulation of FAs in LDs was independent of whether SGs were induced by starvation or by arsenite treatment (Figures 4C and 4D) (Amen and Kaganovich, 2021).
Figure 4.

FA redistribution during SG formation
(A and B) HEK293T cells expressing CRISPR-Cas9-tagged PABPC1-DDR2 were starved in a fuel- and serum-depleted media containing FA-free BSA for indicated amounts of time. FA dye (Bodipy-C12, 1 μM) was added 30 min prior to the imaging together with Hoechst (10 μg/mL). Arrows indicate SGs. Scale bar, 5 μm. Graph shows percentage of cells with SGs in the population and LD fluorescence intensity, mean ± SD. Pearson correlation coefficient (r) is 0.98. Fold change in FAO is overlaid.
(C and D) Quantification showing increase in accumulation of FAs in LDs during SG formation (SGs were formed by incubation for 60 min with arsenite 100 μM). Graphs show mean ± SEM, n = 30. Intensity profile of FAs accumulation in the LDs. Cells were incubated with arsenite for 1 h. Bodipy (1 μM, green) was added 30 min before the imaging to stain the LDs. FA (Bodipy-C12, 1 μM, red) was added at the start of the acquisition. Confocal images were taken every minute for 15 min. Intensity profiles of the images are shown. Scale bar, 1 μm.
Discussion
We report a vital function for SGs as regulators of FAO during long-term starvation. In nutrient stress conditions, cells profoundly alter lipid metabolism, upregulating FAO for an emergency burst of energy production (Douglas et al., 2016; Liu et al., 2018; Mihaylova et al., 2018). It has been unclear, however, how FAO levels are controlled, given that unregulated FAO can be profoundly harmful. We found that SGs trigger depletion of mitochondrial VDAC porins, resulting in a marked decrease of FAs imported into mitochondria for FAO. The lower rate of FAO allows cells to ration lipid resources for longer periods of starvation and has the added effect of dramatically reducing ROS production. The latter result is consistent with previous reports showing that SGs are triggered by ROS (Kato et al., 2019) and help manage oxidative stress (Takahashi et al., 2013).
We used genomically edited mutants of a SG component, TDP43, to investigate the effect of a physiological perturbation of SG properties on cellular metabolism during starvation stress. Mutations in TDP43, as well as many other SG component proteins, cause heritable forms of ALS, a disease characterized by SG dysfunction, wide-spread death of motor neurons, and severe metabolic dysregulation at the cellular and organismal levels (Cleveland and Rothstein, 2001; Dupuis and Loeffler, 2009; Kim et al., 2013; Cong et al., 2013; Ling et al., 2010; Mackenzie et al., 2017). The behavior of the ALS-associated TDP43 mutant Q331K was consistent with our model of the role of SGs in regulating metabolic adaptation and specifically FAO during starvation stress. TDP43 Q331K mutant cells had a lower level of SG formation during starvation (Figure 1H), possibly due to off-pathway aberrant aggregation of TDP43 (Gordon et al., 2019; Orrù et al., 2016), or increased stability of mutant TDP43 in the nucleus, as has been previously reported (Ling et al., 2010). However, it is also possible that SG function is disrupted independently of SG formation dynamics; for example, SGs that form due to aberrant aggregation (Mateju et al., 2017) may form faster, but their function maybe disrupted. As a result, we observed TDP43 mutant cells continue to have increased levels of FAO than WT cells over long periods of starvation. This gives TDP43 mutant cells significantly higher levels of ATP in long-term starvation, as well as significantly higher levels of oxidative stress. Inhibiting FAO using the drug etomoxir reduced the ATP/ADP ratios and the ROS levels in TDP43 mutant cells. Genetic ablation of SGs, by virtue of G3BP1/2 deletion, produced a remarkably similar effect. Cells that failed to form SGs also failed to downregulate FAO during long-term starvation (Figure 1O). Additionally, ALS patient-derived cells exhibited a similar profile of FAO regulation, continuing FAO during long-term starvation (whereas control cells were able to downregulate it). These data are consistent with a model in which SGs downregulate the flux of lipids into mitochondria, thereby reducing ROS and enabling a scare resource to last for longer.
Investigating the BioID SG interactome, and comparing it to previously published SG proteomic studies, we identified a candidate FA import channel, VDAC2. We show that SG formation corresponds to a decrease in cellular levels of all VDAC isoforms, as well as localized clustering of VDAC2 (Figures S5A and B), leading to the inhibition of FAO. Interestingly, VDAC levels are affected in cellular models of ALS, which suggests that VDACs should be examined more closely as an ALS biomarker and therapeutic target (Fukada et al., 2004; Naghdi and Hajnóczky, 2016). These data also prompt questions about the role of TDP43 in mitochondrial permeability and ALS-associated mitochondrial dysfunction (Lau et al., 2018; Smith et al., 2019; Muyderman and Chen, 2014; Manfredi and Xu, 2005; Mehta et al., 2019; Mann et al., 2019; Prasad et al., 2019; Arai et al., 2006; Arnold et al., 2013; Aulas and Vande Velde, 2015; Dewey et al., 2012; Walker et al., 2013).
VDACs have previously been proposed to function as regulators of FA import into mitochondria, and their expression is more abundant in cells that rely more heavily on FAO (Fang and Maldonado, 2018; Kerner and Hoppel, 2000; Naghdi and Hajnóczky, 2016). Therefore, SG-dependent depletion of VDACs would result in the depletion of FA from mitochondria, as confirmed in a VDAC2 KO, which exhibited a partial decrease in FAO. Another potential model for how VDACs might regulate FA trafficking involves association with LDs. VDAC2 was initially described as a mitochondrial outer membrane solute carrier, but was later pulled down in LD proteomes (Khor et al., 2014; Rösch et al., 2016). Thus, VDAC2 may be regulating LD interaction with mitochondria, thereby controlling the transfer of FAs for FAO. SG-dependent clustering of VDAC2 would therefore “trap” FAs in LDs. However, VDAC2 KO alone does not explain the full extent of FAO changes during starvation and thus other VDAC isoforms need to be considered. Additionally, recent studies have shown that VDAC can act as a pro-apoptotic factor (Chin et al., 2018; Lauterwasser et al., 2016; Naghdi and Hajnóczky, 2016). The depletion of VDACs by SGs would therefore delay apoptosis, which would be consistent with another proposed SG function, namely apoptosis regulation (Arimoto et al., 2008). Finally, VDAC carries various solutes across mitochondrial membrane; thus, FAO rates during long-term starvation may be reduced due to changes in the abundance of additional metabolites.
Overall, our data lead us to propose a model in which SG formation on the mitochondrial membrane acts as both the “gas” and the “breaks” of lipid metabolism during stress: directing FA uptake and trafficking, while inhibiting FAO itself sufficiently to ensure cells do not run out of their backup fuel source and minimizing the damage arising from utilizing it instead of glucose. SGs are known to regulate the function of nutrient-sensing kinases that regulate metabolism (Arimoto et al., 2008; Kobayashi et al., 2012; Takahara and Maeda, 2012; Thedieck et al., 2013). In particular, mTORC1 activity is regulated by SGs (and vice versa) (Jevtov et al., 2015; Sfakianos et al., 2018; Takahara and Maeda, 2012; Thedieck et al., 2013). It is possible that a local depletion in mTORC1 function due to SG formation leads to the activation of GSK3, which phosphorylates VDAC2 (Martel et al., 2013), leading to reversible VDAC clustering. The reversible clustering of VDAC may serve additional purposes during starvation and stress, since VDACs are permeable to multiple cellular metabolites in addition to FAs and regulate calcium homeostasis, oxidative stress, and apoptosis (Shoshan-Barmatz et al., 2010). SG-dependent VDAC clustering demonstrates how SG signaling pathways can induce multi-tiered architectural changes in the cell, affecting metabolism and cellular fate. As recent findings suggest, SG can form on the surface of membrane-bound organelles or cytoskeletal components regulating cellular functions such as kinase signaling, altering local translation (Cioni et al., 2019; Lee et al., 2020; Liao et al., 2019; Lin et al., 2016; Pattabiraman et al., 2020); herein, we show that SGs regulate mitochondrial function by altering local permeability.
The FAO regulatory model of SG function explains several important phenomena. Many recent studies have pointed to the contribution of metabolic dysregulation, particularly lipid and LD metabolism, to human neurodegenerative diseases including ALS (Kim et al., 2011; Fukada et al., 2004; Pennetta and Welte, 2018; Szelechowski et al., 2018; Tefera and Borges, 2017; Vandoorne et al., 2018). Our data establish a mechanistic connection between aberrant SG formation, which is another hallmark of ALS, and the metabolic abnormalities observed in the disease (Cong et al., 2013). ROS accumulation, which is observed in ALS-affected neurons, may result from aberrant FAO regulation as well (Barber and Shaw, 2010; Knobloch et al., 2017; Pollari et al., 2014). A recent report indicating a role for SGs in mediating ROS damage is therefore consistent with the idea that SGs downregulate FAO (Takahashi et al., 2013). So, too, is the observation made many years ago that heat shock is lethal for mammalian cells deprived of their preferred nutrients (Gomes et al., 1985). Heat shock triggers SG formation, thereby inhibiting FAO, which is the alternative for ATP generation in the absence of glucose and amino acids.
It is intriguing that our model is also able to account for the perplexing (putative) association between ALS risk and high-level athletic activity: a predisposition to over-reliance on FAO initially provides a fitness benefit to cells, characterized by higher ATP levels. All in all, we suggest that our findings relating to SG regulation of mitochondrial permeability, lipid flux, and FAO will lead to an improved understanding of stress response and ALS pathology.
Limitations
One of the main challenges when assigning a functional role to SGs is uncoupling the stress-induced SG formation process, which is itself incompletely understood, from the plethora of stress-induced changes, including changes in signaling regulation (e.g., mTOR inhibition), metabolism, and transcriptional response (Heberle et al., 2014). Many of these stress-induced changes have been reported to involve SGs (Sfakianos et al., 2018; Thedieck et al., 2013). Thus, the formation of SGs can simultaneously be seen as a consequence of stress and the platform for stress-response functions (Kaganovich, 2017). Another layer of complexity is added by the dynamic and mosaic nature of SGs. The co-clustering of multiple components invariably leads to a systemic change in multiple cellular functions. Thus, pinpointing a single metabolic alteration is challenging and may in fact limit our understanding of the complexity of starvation response, where multiple levels of regulation are activated simultaneously. In this manuscript, we tried to observe different aspects of FA metabolism, including FAO and LD formation, at the whole-cell level, without trying to assign the regulation to a single variable, but rather to the SG response as a whole.
The mechanism through which SGs regulate VDAC levels and function clearly warrants a separate study. The outstanding questions involve differential regulation of VDAC1-3 human isoforms during SG formation, tissue specificity of these isoforms, and the extent of their redundancy in the context of FAO. Indeed, although we and others pulled down VDACs from the SG proteome (Amen and Kaganovich, 2020b, Isabelle et al., 2012), we are still far from a mechanistic understanding of this interaction. It is clear that downregulation of one interacting isoform, VDAC2, is not enough to explain the extent of FAO changes during starvation. Nor is entirely clear how, precisely, SGs regulate VDAC function. We observed that endogenous VDAC2 undergoes clustering in SG-forming conditions (Figure S5A), a VDAC-specific phenomenon that has been well characterized previously, with little mechanistic explanation. VDAC clustering is clearly dependent on SG formation (Figure S5B), but it is still unclear how clustering affects VDAC function. VDAC2 clusters do not co-localize with SGs in human cells (Figure S5C). Moreover, SG formation also leads to an overall reduction in the levels of all VDAC isoforms, which seems to be a more logical link to a decrease in VDAC function. Nevertheless, how SGs regulate VDAC levels, and whether this is related to VDAC clustering, remains to be determined.
STAR★Methods
Key resources table
| REAGENT or RESOURCE | SOURCE | IDENTIFIER |
|---|---|---|
| Antibodies | ||
| monoclonal anti-G3BP | Sigma-Aldrich | WH0010146M1; RRID:AB_1841708 |
| polyclonal anti-TIA1 | Sigma-Aldrich | SAB4301803 |
| anti-GAPDH | Santa Cruz Biotechnology | sc-47724; RRID:AB_627678 |
| anti-DDR2 | Origene | RRID:AB_2622312 |
| anti-HADHA | Santa Cruz Biotechnology | sc-374497; RRID:AB_10987868 |
| anti-Tom22 | Santa Cruz Biotechnology | sc58308; RRID:AB_2287717 |
| anti-VDAC2 | Invitrogen | PA528106; RRID:AB_2545582 |
| anti-TARDBP | Santa Cruz Biotechnology | sc-376532; RRID:AB_11150837 |
| anti-VDAC1 | Santa Cruz Biotechnology | sc-390996; RRID:AB_2750920 |
| Critical commercial assays | ||
| Mito Fuel Test kit (Agilent) | Agilent | 103260-100 |
| Deposited data | ||
| BioID PABPC1 Stress Granule interactome | This paper | PXD025334 |
| Experimental models: Cell lines | ||
| PABPC1-Dendra2 HEK293T | Kaganovich Lab | N/A |
| TDP43(Q331K)-GFP SH-SY5Y | Kaganovich Lab | N/A |
| HADHA KO HEK293T | Kaganovich Lab | N/A |
| G3BP1/2 KO U2OS | J.P. Taylor Lab | Yang et al., 2020 |
| Recombinant DNA | ||
| pcDNA3.1 mCH∗4skl | This paper | N/A |
| pcDNA3.1 hLAMP1-mCH | This paper | N/A |
| pcDNA3.1 CALR(21)-mCHkdel | This paper | N/A |
| pcDNA3.1 Golgi-mCH | Cloned from Addgene plasmid #56221 | N/A |
| pUC19-5′PABPC1-DDR2-puro-3′PABPC1 | This paper | N/A |
| Px330-PABPC1-gRNA | This paper | N/A |
| GW1-PercevalHR | Addgene plasmid #49082 | N/A |
| pUC19-5′PABPC1-mCH-puro-3′PABPC1 | This paper | N/A |
| Px459-HADHA-KO-gRNA | This paper | N/A |
| Px330-HADHA-gRNA | This paper | N/A |
| pUC19-5′HADHA-GFP-puro-3′HADHA | This paper | N/A |
| Px330-VDAC2-KO-gRNA | This paper | N/A |
| Px330-TDP43- Ctag-gRNA | This paper | N/A |
| pUC19-5′TDP43-Q331K-GFP-puro-3′TDP43 | This paper | N/A |
| pcDNA-PABPC1-BirA(R118G)-GFP | This paper, PABPC1 from addgene plasmid #65807 | N/A |
| Software and algorithms | ||
| Matplotlib | Hunter, 2007 | https://matplotlib.org/gallery/lines_bars_and_markers/barchart.html |
| NIS Elements Software 4.10.04 | Nikon | https://www.microscope.healthcare.nikon.com/products/software/nis-elements |
| Other | ||
| 4-chamber glass bottom plates | Cellvis | D35C4200N |
Resource availability
Lead contact
Further information and requests for resources and reagents should be directed to and will be fulfilled by the Lead Contact, Daniel Kaganovich (dan@1basepharma.com).
Materials availability
Reagents generated in this study are available upon request.
Data and code availability
The mass spectrometry proteomics data have been deposited to the ProteomeXchange Consortium via the PRIDE (Perez-Riverol et al., 2019) partner repository with the dataset identifier PXD025334. Additional data that support the conclusions of this study are available on reasonable request. This study didn’t generate any code.
Experimental model and subject details
HEK293T and U2OS cells were maintained in high glucose DMEM supplemented with 10% fetal bovine serum (FBS), 1% penicillin/streptomycin, at 37°C/5% CO2, SH-SY5Y cells were maintained in high glucose 1:1 F12/DMEM media supplemented with 10% FBS, 1% penicillin/streptomycin at 37°C/5% CO2. Cells modified via CRISPR/Cas9 were maintained as above with addition of puromycin (2 μg/ml, Sigma) during selection of clonal populations. Patient-derived iPSCs (Cedar-Sinai) were maintained in mTeSR1 (STEM CELL Technologies) media on Matrigel-coated plates. Differentiation to neural progenitor cells was done using STEMdiff neural induction protocol (STEM CELL Technologies, with addition of SMADi). Neural progenitor cells were maintained in STEMdiff neural progenitor medium (STEM CELL Technologies).
Method details
Lipid import into LDs in live cells
Lipid droplets are pre-stained with either Bodipy (Green, 1 μM Thermo Fischer Scientific) or Bodipy-C12 (Red, 1 μM Thermo Fischer Scientific) for 30min. Fatty acids (bodipy-C12, 1 μM) were added at the start of the acquisition. Lipid droplets were monitored in live cells every 5 s for 15 min using Nikon A1r confocal microscope. Accumulation of lipid in lipid droplets was measured as an increase of fluorescent intensity of a corresponding lipid-bodipy fusion. Fluorescence intensity was quantified inside lipid droplet area in 30 cells.
Starvation protocol
Cells were grown to 70%–90% confluency. After PBS wash, media was replaced with freshly prepared DMEM media without FBS, glucose, pyruvate, L-glutamine, and with 0.25 g/100ml FA free bovine serum albumin (BSA). Cells were incubated in the starvation medium for indicated amounts of time, the viability was confirmed by microscopy. D-glucose (4g/L), L-glutamine (2mM), and synthetically defined lipid mixture 1 (1 μl/10ml media, Sigma) were added to the media in control conditions.
Natural starvation was performed by incubating 90% confluent cells for 4 days without changing the medium (Figure S1K).
Antibodies
We used the following reagents to detect proteins: monoclonal anti-G3BP (Sigma-Aldrich WH0010146M1), polyclonal anti-TIA1 produced in rabbit (Sigma-Aldrich SAB4301803), anti-GAPDH (sc-47724, Santa Cruz Biotechnology), anti-DDR2 (Origene, clone 1G6), anti-HADHA (sc-374497, Santa Cruz Biotechnology), anti-Tom22 (sc58308, Santa Cruz Biotechnology), anti-VDAC2 (PA528106, Invitrogen), and anti-TARDBP (sc-376532, Santa Cruz Biotechnology), anti-VDAC1 antibody (sc-390996, Santa Cruz Biotechnology).
Secondary antibodies for immunofluorescence: anti-Rabbit IgG Cy3-conjugated (Sigma-Aldrich C2306), anti-Mouse IgG Cy3-conjugated (Sigma-Aldrich C2181), anti-rabbit IgG Cy5 conjugated (Invitrogen A10523).
Chemicals
BODIPY 558/568 C12 (4,4-Difluoro-5-(2-Thienyl)-4-Bora-3a,4a-Diaza-s-Indacene-3-Dodecanoic Acid, Thermo Fischer Scientific), Mito Red 569/594 (Sigma), Hoechst (Sigma), Rhodamine800 (Sigma), sodium arsenite (Fischer Chemical), cycloheximide (Sigma), BODIPY 493/503 (ThermoFischer Scientific, D3922), Streptavidin-Cy3 (Thermo Fischer Scientific), Lipid Mix (Sigma), UK5099 (Sigma), Etomoxir (Sigma), BPTES (Sigma), Tetramethylrhodamine ethyl ester perchlorate (TMRE, Sigma), 2′,7′-Dichlorofluorescin diacetate (H2-DFCDA, Sigma), 2-bromopalmitic acid (2-BP, Sigma), Rotenone (Sigma), CCCP (Sigma), Streptavidin-HRP (Thermo Scientific), FA free BSA (PAN Biotech), DMEM (PAN Biotech), FBS (PAN Biotech), PBS (PAN Biotech), vanillin (Sigma), methanol (Roth), Chlorophorm (Sigma), biotin (Sigma), aprotinin (Roth), leupeptin (Roth), Phenylmethylsulfonyl fluoride (PMSF, Sigma).
CRISPR/Cas9
Knockout and endogenously tagged cell lines were constructed using CRISPR/Cas9 protocol and plasmids described in Ran et al. (2013). Knockout cell lines were verified by western blotting, immunofluorescence. Genomic DNA was sequenced to verify disrupted region in knockout or fidelity of endogenous tagging. Functional assay for knockout verification was performed where applicable (FAO dependency for HADHA knockout). Endogenous tagging was performed by fusing tagging construct pCtag (linker-GFP/DDR2/mCherry/mCherry-VenusC-polyA-Puromycin) to the region upstream of the stop codon (∼500bp) and downstream of stop codon (∼500bp). PCR product containing homologous regions flanking the tagging construct was co-transfected with px330-gRNA corresponding construct. Endogenous tagging was verified by western blotting, immunofluorescence staining, and genomic DNA sequencing. CRISPR specificity was profiled using Digenome-Seq web tool (http://www.rgenome.net/cas-offinder/) (Bae et al., 2014). Off targets were found for TDP43 endogenous tag; however the off-target was found within TDP43 pseudogene2 (13:60275990), thus wasn’t pursued. The following target sequences are used to modify genomic DNA: endogenous tagging of PABPC1 – ‘TTAAAGTGAGCTTTTCCCTC’, endogenous tagging of HADHA – ‘CCTAACAAGAAGTTCTACCAGTGAGC’, knockout of HADHA – ‘CTGCTGTCCTCTTCAGCTCAAGATGG’, knockout of VDAC2 – ‘TAAGTAAAGCTGGGATCTCTGCGGGA’, tagging of TDP43 – ‘GTCTTCTGGCTGGGGAATGTAGACAG’
Plasmid Construction
All plasmids were constructed using Escherichia coli strain DH5α. Plasmids used in this study are summarized in the key resources table. B4GALT182 fragment was cloned from mIFP-Golgi-7, which was a gift from Michael Davidson (Addgene plasmid # 56221; http://addgene.org/56221; RRID:Addgene_56221) (Yu et al., 2015). We used px459 plasmid to clone CRISPR/Cas9 constructs for gene knockout, and px330 plasmid to construct plasmids used for endogenous tagging. pSpCas9(BB)-2A-Puro (PX459) V2.0 was a gift from Feng Zhang (Addgene plasmid # 62988; http://addgene.org/62988; RRID:Addgene_62988) (Ran et al., 2013). pX330-U6-Chimeric_BB-CBh-hSpCas9 was a gift from Feng Zhang (Addgene plasmid # 42230; http://addgene.org/42230; RRID:Addgene_42230) (Cong et al., 2013). GW1-PercevalHR was a gift from Gary Yellen (Addgene plasmid # 49082; http://addgene.org/49082; RRID:Addgene_49082) (Tantama et al., 2013). pCI-MS2V5-PABPC1 was a gift from Niels Gehring (Addgene plasmid # 65807; http://addgene.org/65807; RRID:Addgene_65807) (Fatscher et al., 2014). Site directed mutagenesis was performed to obtain VDAC2 mutants. Plasmid maps and cloning information are available upon request, refer to the key resources table. We fused 2 repeats of PPRE consensus sequence (aagtcaaaggtca), replacing CMV enhancer in pcDNA3.1, to construct the PPAR reporter plasmid (pPPAR-mCH).
ATP/ADP ratiometric imaging
We used live cell ATP/ADP ratio sensor PercevalHR to measure the ATP/ADP ratio changes (Tantama et al., 2013). Cells were imaged with a confocal Nikon A1r microscope equipped with a cell culture environmental chamber maintaining 5% CO2/95% air gas mixture, 37°C, using a 60x PlanApo VC oil objective NA 1.40. PercevalHR was excited using 406nm and 488nm lasers (OBIS), emission was collected through a 525/50 nm band pass filter. Images were obtained every 30min during 6h. Rotenone was added to a negative control sample after first time loop at a 4 μM final concentration. Images were processed using NIS-Elements Software (Nikon). ATP/ADP ratios were calculated relative to a positive control as described in Tantama et al. (2013).
When using CRISPR/Cas9 tagged PABPC1-mCH together with PercevalHR, ratiometric and normal images were obtained sequentially.
Fatty acid oxidation dependency
Seahorse XFe96 Flux Analyzer (Agilent) was used to measure fatty acids metabolic dependency. Cells were seeded on a 96-well plate (Agilent), measurements were performed at a 70%–90% confluency, starvation was done for indicated amounts of time as described above, FA dependency in live cells was measured according to Mito Fuel Test kit (Agilent). FAO dependency indicates the reliance of the cells on the FAO, which cannot be compensated by glucose or glutamine oxidation. After the baseline read, the FAO inhibitor – etomoxir was injected, after monitoring the OCR for 40 min, alternative pathways are inhibited by injection of UK5099 and BPTES, the dependency (%) is quantified as the (baseline OCR-etomoxir inhibition)/(baseline OCR – all inhibitors)∗100 (refer to Figure S6A).
Oxidative stress assessment
Cells were incubated with 100 μM 2 ‘, 7’-dichlorodihydrofluorescein diacetate (H2-DFCDA) for 30 min prior to imaging. Fluorescence intensity (excitation with 488nm) was measured in the cytoplasm of single cells (n = 30) using NIS software (Nikon).
Extraction of biotinylated proteins
Cells expressing PABPC1-BirA(R118G)-GFP were grown to 80%–90% confluency. SGs were induced with 100 μM arsenite, 200 μM 2-BP, or 9 hour starvation. After that, cells were incubated with biotin (100 μM) for 4 hours, SG formation was visualized on the microscope. Lysis and affinity capture was done according to Roux et al. with minor modifications (Roux et al., 2012). Cells were washed with PBS and (subsequent steps at 4°C) lysed in the buffer (50mM Tris pH7.4, 500mM NaCl, 0.4%SDS, 5mM EDTA, 1mM DTT, and protease inhibitor cocktail (aprotinin, leupeptin, and PMSF, 10 μg) with glass beads 425-600 μm (Sigma). After 1min of vortex Triton X-100 was added to 2% concentration, after second round of vortex equal amount of 50mM Tris pH7.4 was added. After third round of vortex and centrifugation 5min 13000 rpm 300 μL of streptavidin-coated magnetic beads (NEB) were added to collected supernatants and incubated overnight at 4°C with agitation, 10% of the sample was collected for the Western Blot analysis. Beads were collected and (subsequent steps at room temperature) washed according to Roux et al.
Preparing samples for the Mass spectroscopy
The beads were washed free of detergents by two washes with 25 mM Tris-HCl pH 8.0. Then the packed beads were resuspended in 100 ul of 8M urea, 10 mM DTT, 25 mM Tris-HCl pH 8.0 and incubated for 20 min, followed by addition of iodoacetamide to a concentration of 55 mM and incubation for 20 min in the dark. The urea was diluted by the addition of 6 volumes of 25 mM Tris-HCl pH 8.0, 0.25 μg trypsin was added (Sigma) and the beads were incubated overnight at 37°C with gentle agitation. The released peptides were desalted by loading the whole bead supernatant on C18 Stage tips (Rappsilber et al., 2007). Eluted peptide material was used for MS analysis.
LC/MS/MS analysis
Protein digests were analyzed on a nanoflow chromatography system (Eksigent nanoLC425) hyphenated to a hybrid triple quadrupole-TOF mass spectrometer (TripleTOF 5600+) equipped with a Nanospray III ion source (Ionspray Voltage 2400 V, Interface Heater Temperature 150°C, Sheath Gas Setting 12) and controlled by Analyst TF 1.7.1 software build 1163 (all AB Sciex). In brief, peptides were dissolved in loading buffer (2% acetonitrile, 0.1% formic acid in water), enriched on a precolumn (0.18 mm ID x 20 mm, Symmetry C18, 5 μm, Waters, Milford/MA, U.S.A) and separated on an analytical RP-C18 column (0.075 mm ID x 250 mm, HSS T3, 1.8 μm, Waters) using a 90 min linear gradient of 5%–35% acetonitrile/0.1% formic acid (v:v) at 300 nL min-1.
Qualitative LC/MS/MS analysis was performed using a Top25 data-dependent acquisition method with an MS survey scan of m/z 350–1250 accumulated for 350 ms at a resolution of 30,000 full width at half maximum (FWHM). MS/MS scans of m/z 180–1600 were accumulated for 100 ms at a resolution of 17,500 FWHM and a precursor isolation width of 0.7 FWHM, resulting in a total cycle time of 2.9 s. Precursors above a threshold MS intensity of 125 cps with charge states 2+, 3+, and 4+ were selected for MS/MS, the dynamic exclusion time was set to 30 s. MS/MS activation was achieved by CID using nitrogen as a collision gas and the manufacturer’s default rolling collision energy settings. Two technical replicates per sample were acquired.
MS data analysis
Mass spectra data were processed using the MaxQuant computational platform, version 1.6.3.4 (Cox and Mann, 2008). Peak lists were searched against the human Uniprot FASTA sequence database (downloaded 02.01.19). The search included cysteine carbamidomethylation as a fixed modification and oxidation of methionine as variable modifications. Peptides with minimum of seven amino-acid length were considered and the required FDR was set to 1% at the peptide and protein level. Protein identifications required at least three unique or razor peptides per protein group. Relative protein quantification in MaxQuant was performed using the label free quantification (LFQ) algorithm (Cox et al., 2014). Identified proteins were analyzed with Perseus software (Tyanova et al., 2016). Gene ontology analysis was performed using STRING web tool (https://string-db.org/; Szklarczyk et al., 2015).
GC-FID
FA profiles were done using purified mitochondria. 50 million cells were used to prepare one sample. Mitochondria were purified using purification kit for cultured cells (Thermo Fischer Scientific).
Purified mitochondria were vortexed and pipetted into vials. Samples were methylated with 3N HCl in Methanol. FAMEs were extracted with hexane, then samples were neutralized with 3N KOH in water. After mixing and centrifuging the hexane phase was injected into the GC-FID. Analysis was performed on a 8890 GC with a split/splitless injector, a 7693A automatic liquid sampler, and flame ionization detector (Agilent Technologies, Palo Alto, CA). Separations was performed on a TR-FAME (30 m × 0.25 mm i.d. × 0.25 μm film thickness) column from Thermo Fisher Scientific.
For exogenous FAs, purified mitochondria were incubated with FA-CoAs synthesized by addition of ACC enzyme to the palmitic acid solution in the FA solubilization buffer (FA quantification kit, step 1, according to the manufacturer instructions, Sigma), mitochondria and FA-CoAs (10 μM) were incubated in the import buffer (Meisinger et al., 2001) supplemented with carnitine 0.1 μM and 1% FA-free BSA for 30min, followed by 3 times washing and GC-FID analysis as described above. Control samples not supplemented with FA-CoA were used to identify the fold change of the import of exogenous FAs.
RNA preparation and real time PCR
Total mRNA was extracted from cells using TRI Reagent (Sigma). cDNA synthesis was performed using first strand cDNA synthesis kit (NEB). Real time PCR was performed using QuantStudio3 (Thermo Fischer Scientific). mRNA levels were quantified using QuantStudio3 software. Experiments were repeated three times with 2 technical repeats and fold difference in expression was calculated by ΔΔ Ct method using GAPDH as a housekeeping gene (Livak and Schmittgen, 2001).
| Primers for real time PCR | Target |
|---|---|
| 5′-GCCAAGCTCCTGAAGCAGAAG | OCT4 |
| 5′-CCTCCACCCACTTCTGCAGC | OCT4 |
| 5′-CTCTTCCACCCAGCTGTGTG | NANOG |
| 5′-CGGCCAGTTGTTTTTCTGCC | NANOG |
| 5′-GGGGAAGGTGAAGGTCGGAGTC | GAPDH |
| 5′-GTGCCATGGAATTTGCCATGGG | GAPDH |
| 5′-GGGCCTACAGAGCCAGATCG | NES |
| 5′-CTGAAAGCTGAGGGAAGTCTTGG | NES |
| 5′-GGAATCAGAGAAGACAGGCCAGC | PAX6 |
| 5′-CCATGGTGAAGCTGGGCATAG | PAX6 |
Apoptosis quantification
Cells were incubated with AnnexinV-Cy3 (Sigma) and Propidium Iodide (1 μM) for 15 minutes prior to the imaging, apoptotic cells ratio was quantified.
Immunofluorescence
Cells were grown on glass bottom plates. Cells were fixed using 4% paraformaldehyde (with addition of 0.25% glutaraldehyde for VDAC2 immunofluorescence) for 10 minutes, followed by permeabilization with 0.5% Triton X-100, then blocked overnight in 5% BSA in PBS.
Microscopy
For live cell imaging we used 4-well microscope glass bottom plates (IBIDI), or Cellview cell culture dish (Greiner Bio One). Plates were coated with Concanavalin A (Sigma) for live cell imaging of yeast. Confocal images and movies were acquired using a dual point-scanning Nikon A1R-si microscope equipped with a PInano Piezo stage (MCL), temperature and CO2 incubator, using a 60x PlanApo VC oil objective NA 1.40. We used 406nm, 488nm, 561nm, and 640nm laser (Coherent, OBIS). Movies for kymographs were acquired in resonant-scanning mode. Image processing was performed using NIS-Elements software.
Quantification and statistical analysis
Three or more independent experiments were performed to obtain the data. P values were calculated by two-tailed Student t test, or one-way ANOVA for samples following normal distribution. Normal distribution of the data was verified using Shapiro-Wilk test and the equality of variances was verified by Levene’s test. Mann-Whitney, or Kruskal-Wallis tests were used when samples didn’t follow a normal distribution. The sample sizes were not predetermined.
Random scatterplots for organelle proximity screen were generated using Matplotlib (Hunter, 2007). Proximity of random sample was quantified by manually aligning the sample and reference image and quantifying interactions, followed by statistical analysis.
Sequence alignment and distance visualization was performed using ClustalW and Jalview tools (Sievers et al., 2011; Waterhouse et al., 2009).
Acknowledgments
We thank Maayan Kaganovich for comments on the manuscript. We thank the Outeiro lab for support with essential equipment as well as Christof Lenz, Lisa Neuenroth, and Thierry Wasselin at the UMG Core Facility Proteomics for obtaining mass spectrometry (MS) data. We thank Vitas Analytical Services (https://vitas.no) and Tore Bolstad for gas chromatography-flame ionization detection (GC-FID) data acquisition. We thank Matthias Dobbelstein for the gift of the U2OS WT cell line. We thank J. Paul Taylor for the gift of the U2OS G3BP1/2 KO cell line. We thank Roy Parker for valuable comments and feedback. This work was partially supported by the European Research Council under the European Union’s Seventh Framework Programme (FP/2007-2013)/ERC-StG2013 337713 DarkSide starting grant.
Author contributions
All aspects of the work comprising the manuscript were carried out jointly by D.K. and T.A.
Declaration of interests
D.K. is a co-founder and CSO of 1Base Pharmaceuticals.
Published: June 15, 2021
Footnotes
Supplemental information can be found online at https://doi.org/10.1016/j.celrep.2021.109237.
Supplemental information
References
- Allen S.P., Hall B., Woof R., Francis L., Gatto N., Shaw A.C., Myszczynska M., Hemingway J., Coldicott I., Willcock A. C9orf72 expansion within astrocytes reduces metabolic flexibility in amyotrophic lateral sclerosis. Brain. 2019;142:3771–3790. doi: 10.1093/brain/awz302. [DOI] [PMC free article] [PubMed] [Google Scholar]
- Amen T., Kaganovich D. Quantitative photoconversion analysis of internal molecular dynamics in stress granules and other membraneless organelles in live cells. STAR Protoc. 2020;1:100217. doi: 10.1016/j.xpro.2020.100217. [DOI] [PMC free article] [PubMed] [Google Scholar]
- Amen T., Kaganovich D. Stress granules sense metabolic stress at the plasma membrane and potentiate recovery by storing active Pkc1. Sci. Signal. 2020;13:eaaz6339. doi: 10.1126/scisignal.aaz6339. [DOI] [PubMed] [Google Scholar]
- Amen T., Kaganovich D. Small molecule screen reveals joint regulation of Stress Granule formation and Lipid Droplet biogenesis. Front. Cell Dev. Biol. 2021;8:606111. doi: 10.3389/fcell.2020.606111. [DOI] [PMC free article] [PubMed] [Google Scholar]
- Arai T., Hasegawa M., Akiyama H., Ikeda K., Nonaka T., Mori H., Mann D., Tsuchiya K., Yoshida M., Hashizume Y., Oda T. TDP-43 is a component of ubiquitin-positive tau-negative inclusions in frontotemporal lobar degeneration and amyotrophic lateral sclerosis. Biochem. Biophys. Res. Commun. 2006;351:602–611. doi: 10.1016/j.bbrc.2006.10.093. [DOI] [PubMed] [Google Scholar]
- Arimoto K., Fukuda H., Imajoh-Ohmi S., Saito H., Takekawa M. Formation of stress granules inhibits apoptosis by suppressing stress-responsive MAPK pathways. Nat. Cell Biol. 2008;10:1324–1332. doi: 10.1038/ncb1791. [DOI] [PubMed] [Google Scholar]
- Arnold E.S., Ling S.C., Huelga S.C., Lagier-Tourenne C., Polymenidou M., Ditsworth D., Kordasiewicz H.B., McAlonis-Downes M., Platoshyn O., Parone P.A. ALS-linked TDP-43 mutations produce aberrant RNA splicing and adult-onset motor neuron disease without aggregation or loss of nuclear TDP-43. Proc. Natl. Acad. Sci. USA. 2013;110:E736–E745. doi: 10.1073/pnas.1222809110. [DOI] [PMC free article] [PubMed] [Google Scholar]
- Aulas A., Vande Velde C. Alterations in stress granule dynamics driven by TDP-43 and FUS: a link to pathological inclusions in ALS? Front. Cell Neurosci. 2015;9:423. doi: 10.3389/fncel.2015.00423. [DOI] [PMC free article] [PubMed] [Google Scholar]
- Aulas A., Fay M.M., Lyons S.M., Achorn C.A., Kedersha N., Anderson P., Ivanov P. Stress-specific differences in assembly and composition of stress granules and related foci. J. Cell Sci. 2017;130:927–937. doi: 10.1242/jcs.199240. [DOI] [PMC free article] [PubMed] [Google Scholar]
- Bae S., Park J., Kim J.S. Cas-OFFinder: a fast and versatile algorithm that searches for potential off-target sites of Cas9 RNA-guided endonucleases. Bioinformatics. 2014;30:1473–1475. doi: 10.1093/bioinformatics/btu048. [DOI] [PMC free article] [PubMed] [Google Scholar]
- Barber S.C., Shaw P.J. Oxidative stress in ALS: key role in motor neuron injury and therapeutic target. Free Radic. Biol. Med. 2010;48:629–641. doi: 10.1016/j.freeradbiomed.2009.11.018. [DOI] [PubMed] [Google Scholar]
- Benador I.Y., Veliova M., Liesa M., Shirihai O.S. Mitochondria Bound to Lipid Droplets: Where Mitochondrial Dynamics Regulate Lipid Storage and Utilization. Cell Metab. 2019;29:827–835. doi: 10.1016/j.cmet.2019.02.011. [DOI] [PMC free article] [PubMed] [Google Scholar]
- Buchan J.R., Parker R. Eukaryotic stress granules: the ins and outs of translation. Mol. Cell. 2009;36:932–941. doi: 10.1016/j.molcel.2009.11.020. [DOI] [PMC free article] [PubMed] [Google Scholar]
- Buchan J.R., Yoon J.H., Parker R. Stress-specific composition, assembly and kinetics of stress granules in Saccharomyces cerevisiae. J. Cell Sci. 2011;124:228–239. doi: 10.1242/jcs.078444. [DOI] [PMC free article] [PubMed] [Google Scholar]
- Chin H.S., Li M.X., Tan I.K.L., Ninnis R.L., Reljic B., Scicluna K., Dagley L.F., Sandow J.J., Kelly G.L., Samson A.L. VDAC2 enables BAX to mediate apoptosis and limit tumor development. Nat. Commun. 2018;9:4976. doi: 10.1038/s41467-018-07309-4. [DOI] [PMC free article] [PubMed] [Google Scholar]
- Cioni J.M., Lin J.Q., Holtermann A.V., Koppers M., Jakobs M.A.H., Azizi A., Turner-Bridger B., Shigeoka T., Franze K., Harris W.A., Holt C.E. Late Endosomes Act as mRNA Translation Platforms and Sustain Mitochondria in Axons. Cell. 2019;176:56–72.e15. doi: 10.1016/j.cell.2018.11.030. [DOI] [PMC free article] [PubMed] [Google Scholar]
- Cleveland D.W., Rothstein J.D. From Charcot to Lou Gehrig: deciphering selective motor neuron death in ALS. Nat. Rev. Neurosci. 2001;2:806–819. doi: 10.1038/35097565. [DOI] [PubMed] [Google Scholar]
- Cong L., Ran F.A., Cox D., Lin S., Barretto R., Habib N., Hsu P.D., Wu X., Jiang W., Marraffini L.A., Zhang F. Multiplex genome engineering using CRISPR/Cas systems. Science. 2013;339:819–823. doi: 10.1126/science.1231143. [DOI] [PMC free article] [PubMed] [Google Scholar]
- Cortassa S., Sollott S.J., Aon M.A. Mitochondrial respiration and ROS emission during β-oxidation in the heart: An experimental-computational study. PLoS Comput. Biol. 2017;13:e1005588. doi: 10.1371/journal.pcbi.1005588. [DOI] [PMC free article] [PubMed] [Google Scholar]
- Cox J., Mann M. MaxQuant enables high peptide identification rates, individualized p.p.b.-range mass accuracies and proteome-wide protein quantification. Nat. Biotechnol. 2008;26:1367–1372. doi: 10.1038/nbt.1511. [DOI] [PubMed] [Google Scholar]
- Cox J., Hein M.Y., Luber C.A., Paron I., Nagaraj N., Mann M. Accurate proteome-wide label-free quantification by delayed normalization and maximal peptide ratio extraction, termed MaxLFQ. Mol. Cell. Proteomics. 2014;13:2513–2526. doi: 10.1074/mcp.M113.031591. [DOI] [PMC free article] [PubMed] [Google Scholar]
- Dewey C.M., Cenik B., Sephton C.F., Johnson B.A., Herz J., Yu G. TDP-43 aggregation in neurodegeneration: are stress granules the key? Brain Res. 2012;1462:16–25. doi: 10.1016/j.brainres.2012.02.032. [DOI] [PMC free article] [PubMed] [Google Scholar]
- Douglas D.N., Pu C.H., Lewis J.T., Bhat R., Anwar-Mohamed A., Logan M., Lund G., Addison W.R., Lehner R., Kneteman N.M. Oxidative Stress Attenuates Lipid Synthesis and Increases Mitochondrial Fatty Acid Oxidation in Hepatoma Cells Infected with Hepatitis C Virus. J. Biol. Chem. 2016;291:1974–1990. doi: 10.1074/jbc.M115.674861. [DOI] [PMC free article] [PubMed] [Google Scholar]
- Dupuis L., Loeffler J.P. Neuromuscular junction destruction during amyotrophic lateral sclerosis: insights from transgenic models. Curr. Opin. Pharmacol. 2009;9:341–346. doi: 10.1016/j.coph.2009.03.007. [DOI] [PubMed] [Google Scholar]
- Eliyahu E., Pnueli L., Melamed D., Scherrer T., Gerber A.P., Pines O., Rapaport D., Arava Y. Tom20 mediates localization of mRNAs to mitochondria in a translation-dependent manner. Mol. Cell. Biol. 2010;30:284–294. doi: 10.1128/MCB.00651-09. [DOI] [PMC free article] [PubMed] [Google Scholar]
- Fang D., Maldonado E.N. VDAC Regulation: A Mitochondrial Target to Stop Cell Proliferation. Adv. Cancer Res. 2018;138:41–69. doi: 10.1016/bs.acr.2018.02.002. [DOI] [PMC free article] [PubMed] [Google Scholar]
- Fatscher T., Boehm V., Weiche B., Gehring N.H. The interaction of cytoplasmic poly(A)-binding protein with eukaryotic initiation factor 4G suppresses nonsense-mediated mRNA decay. RNA. 2014;20:1579–1592. doi: 10.1261/rna.044933.114. [DOI] [PMC free article] [PubMed] [Google Scholar]
- Freibaum B.D., Chitta R.K., High A.A., Taylor J.P. Global analysis of TDP-43 interacting proteins reveals strong association with RNA splicing and translation machinery. J. Proteome Res. 2010;9:1104–1120. doi: 10.1021/pr901076y. [DOI] [PMC free article] [PubMed] [Google Scholar]
- Fritz M., Vanselow J., Sauer N., Lamer S., Goos C., Siegel T.N., Subota I., Schlosser A., Carrington M., Kramer S. Novel insights into RNP granules by employing the trypanosome’s microtubule skeleton as a molecular sieve. Nucleic Acids Res. 2015;43:8013–8032. doi: 10.1093/nar/gkv731. [DOI] [PMC free article] [PubMed] [Google Scholar]
- Fukada K., Zhang F., Vien A., Cashman N.R., Zhu H. Mitochondrial proteomic analysis of a cell line model of familial amyotrophic lateral sclerosis. Mol. Cell. Proteomics. 2004;3:1211–1223. doi: 10.1074/mcp.M400094-MCP200. [DOI] [PMC free article] [PubMed] [Google Scholar]
- Gingras A.C., Gygi S.P., Raught B., Polakiewicz R.D., Abraham R.T., Hoekstra M.F., Aebersold R., Sonenberg N. Regulation of 4E-BP1 phosphorylation: a novel two-step mechanism. Genes Dev. 1999;13:1422–1437. doi: 10.1101/gad.13.11.1422. [DOI] [PMC free article] [PubMed] [Google Scholar]
- Gomes M.I., Kim W.J., Lively M.K., Amos H. Heat-shock treatment lethal for mammalian cells deprived of glucose and glutamine: protection by alpha-keto acids. Biochem. Biophys. Res. Commun. 1985;131:1013–1019. doi: 10.1016/0006-291x(85)91340-3. [DOI] [PubMed] [Google Scholar]
- Gordon D., Dafinca R., Scaber J., Alegre-Abarrategui J., Farrimond L., Scott C., Biggs D., Kent L., Oliver P.L., Davies B. Single-copy expression of an amyotrophic lateral sclerosis-linked TDP-43 mutation (M337V) in BAC transgenic mice leads to altered stress granule dynamics and progressive motor dysfunction. Neurobiol. Dis. 2019;121:148–162. doi: 10.1016/j.nbd.2018.09.024. [DOI] [PubMed] [Google Scholar]
- Haimovich G., Cohen-Zontag O., Gerst J.E. A role for mRNA trafficking and localized translation in peroxisome biogenesis and function? Biochim. Biophys. Acta. 2016;1863:911–921. doi: 10.1016/j.bbamcr.2015.09.007. [DOI] [PubMed] [Google Scholar]
- Heberle A.M., Prentzell M.T., van Eunen K., Bakker B.M., Grellscheid S.N., Thedieck K. Molecular mechanisms of mTOR regulation by stress. Mol. Cell. Oncol. 2014;2:e970489. doi: 10.4161/23723548.2014.970489. [DOI] [PMC free article] [PubMed] [Google Scholar]
- Hunter J.D. Matplotlib: A 2D graphics environment. Comput. Sci. Eng. 2007;9:90–95. [Google Scholar]
- Isabelle M., Gagné J.P., Gallouzi I.E., Poirier G.G. Quantitative proteomics and dynamic imaging reveal that G3BP-mediated stress granule assembly is poly(ADP-ribose)-dependent following exposure to MNNG-induced DNA alkylation. J. Cell Sci. 2012;125:4555–4566. doi: 10.1242/jcs.106963. [DOI] [PubMed] [Google Scholar]
- Jain S., Wheeler J.R., Walters R.W., Agrawal A., Barsic A., Parker R. ATPase-Modulated Stress Granules Contain a Diverse Proteome and Substructure. Cell. 2016;164:487–498. doi: 10.1016/j.cell.2015.12.038. [DOI] [PMC free article] [PubMed] [Google Scholar]
- Jevtov I., Zacharogianni M., van Oorschot M.M., van Zadelhoff G., Aguilera-Gomez A., Vuillez I., Braakman I., Hafen E., Stocker H., Rabouille C. TORC2 mediates the heat stress response in Drosophila by promoting the formation of stress granules. J. Cell Sci. 2015;128:2497–2508. doi: 10.1242/jcs.168724. [DOI] [PMC free article] [PubMed] [Google Scholar]
- Johri A., Beal M.F. Mitochondrial dysfunction in neurodegenerative diseases. J. Pharmacol. Exp. Ther. 2012;342:619–630. doi: 10.1124/jpet.112.192138. [DOI] [PMC free article] [PubMed] [Google Scholar]
- Kaganovich D. There Is an Inclusion for That: Material Properties of Protein Granules Provide a Platform for Building Diverse Cellular Functions. Trends Biochem. Sci. 2017;42:765–776. doi: 10.1016/j.tibs.2017.08.002. [DOI] [PubMed] [Google Scholar]
- Kajihara N., Kukidome D., Sada K., Motoshima H., Furukawa N., Matsumura T., Nishikawa T., Araki E. Low glucose induces mitochondrial reactive oxygen species via fatty acid oxidation in bovine aortic endothelial cells. J. Diabetes Investig. 2017;8:750–761. doi: 10.1111/jdi.12678. [DOI] [PMC free article] [PubMed] [Google Scholar]
- Kamelgarn M., Chen J., Kuang L., Arenas A., Zhai J., Zhu H., Gal J. Proteomic analysis of FUS interacting proteins provides insights into FUS function and its role in ALS. Biochim. Biophys. Acta. 2016;1862:2004–2014. doi: 10.1016/j.bbadis.2016.07.015. [DOI] [PMC free article] [PubMed] [Google Scholar]
- Kato M., Yang Y.S., Sutter B.M., Wang Y., McKnight S.L., Tu B.P. Redox State Controls Phase Separation of the Yeast Ataxin-2 Protein via Reversible Oxidation of Its Methionine-Rich Low-Complexity Domain. Cell. 2019;177:711–721.e8. doi: 10.1016/j.cell.2019.02.044. [DOI] [PMC free article] [PubMed] [Google Scholar]
- Kedersha N., Anderson P. Mammalian stress granules and processing bodies. Methods Enzymol. 2007;431:61–81. doi: 10.1016/S0076-6879(07)31005-7. [DOI] [PubMed] [Google Scholar]
- Kedersha N., Stoecklin G., Ayodele M., Yacono P., Lykke-Andersen J., Fritzler M.J., Scheuner D., Kaufman R.J., Golan D.E., Anderson P. Stress granules and processing bodies are dynamically linked sites of mRNP remodeling. J. Cell Biol. 2005;169:871–884. doi: 10.1083/jcb.200502088. [DOI] [PMC free article] [PubMed] [Google Scholar]
- Kedersha N., Ivanov P., Anderson P. Stress granules and cell signaling: more than just a passing phase? Trends Biochem. Sci. 2013;38:494–506. doi: 10.1016/j.tibs.2013.07.004. [DOI] [PMC free article] [PubMed] [Google Scholar]
- Kerner J., Hoppel C. Fatty acid import into mitochondria. Biochim. Biophys. Acta Mol. Cell. Biol. Lipids. 2000;1486:1–17. doi: 10.1016/s1388-1981(00)00044-5. [DOI] [PubMed] [Google Scholar]
- Khong A., Matheny T., Jain S., Mitchell S.F., Wheeler J.R., Parker R. The Stress Granule Transcriptome Reveals Principles of mRNA Accumulation in Stress Granules. Mol. Cell. 2017;68:808–820.e5. doi: 10.1016/j.molcel.2017.10.015. [DOI] [PMC free article] [PubMed] [Google Scholar]
- Khor V.K., Ahrends R., Lin Y., Shen W.J., Adams C.M., Roseman A.N., Cortez Y., Teruel M.N., Azhar S., Kraemer F.B. The proteome of cholesteryl-ester-enriched versus triacylglycerol-enriched lipid droplets. PLoS ONE. 2014;9:e105047. doi: 10.1371/journal.pone.0105047. [DOI] [PMC free article] [PubMed] [Google Scholar]
- Kim S.M., Kim H., Kim J.E., Park K.S., Sung J.J., Kim S.H., Lee K.W. Amyotrophic lateral sclerosis is associated with hypolipidemia at the presymptomatic stage in mice. PLoS ONE. 2011;6:e17985. doi: 10.1371/journal.pone.0017985. [DOI] [PMC free article] [PubMed] [Google Scholar]
- Kim H.J., Kim N.C., Wang Y.D., Scarborough E.A., Moore J., Diaz Z., MacLea K.S., Freibaum B., Li S., Molliex A. Mutations in prion-like domains in hnRNPA2B1 and hnRNPA1 cause multisystem proteinopathy and ALS. Nature. 2013;495:467–473. doi: 10.1038/nature11922. [DOI] [PMC free article] [PubMed] [Google Scholar]
- Knobloch M., Pilz G.A., Ghesquière B., Kovacs W.J., Wegleiter T., Moore D.L., Hruzova M., Zamboni N., Carmeliet P., Jessberger S. A Fatty Acid Oxidation-Dependent Metabolic Shift Regulates Adult Neural Stem Cell Activity. Cell Rep. 2017;20:2144–2155. doi: 10.1016/j.celrep.2017.08.029. [DOI] [PMC free article] [PubMed] [Google Scholar]
- Kobayashi T., Winslow S., Sunesson L., Hellman U., Larsson C. PKCα binds G3BP2 and regulates stress granule formation following cellular stress. PLoS ONE. 2012;7:e35820. doi: 10.1371/journal.pone.0035820. [DOI] [PMC free article] [PubMed] [Google Scholar]
- Lahtvee P.J., Kumar R., Hallström B.M., Nielsen J. Adaptation to different types of stress converge on mitochondrial metabolism. Mol. Biol. Cell. 2016;27:2505–2514. doi: 10.1091/mbc.E16-03-0187. [DOI] [PMC free article] [PubMed] [Google Scholar]
- Lau D.H.W., Hartopp N., Welsh N.J., Mueller S., Glennon E.B., Mórotz G.M., Annibali A., Gomez-Suaga P., Stoica R., Paillusson S., Miller C.C.J. Disruption of ER-mitochondria signalling in fronto-temporal dementia and related amyotrophic lateral sclerosis. Cell Death Dis. 2018;9:327. doi: 10.1038/s41419-017-0022-7. [DOI] [PMC free article] [PubMed] [Google Scholar]
- Lauterwasser J., Todt F., Zerbes R.M., Nguyen T.N., Craigen W., Lazarou M., van der Laan M., Edlich F. The porin VDAC2 is the mitochondrial platform for Bax retrotranslocation. Sci. Rep. 2016;6:32994. doi: 10.1038/srep32994. [DOI] [PMC free article] [PubMed] [Google Scholar]
- Lee K., Kerner J., Hoppel C.L. Mitochondrial carnitine palmitoyltransferase 1a (CPT1a) is part of an outer membrane fatty acid transfer complex. J. Biol. Chem. 2011;286:25655–25662. doi: 10.1074/jbc.M111.228692. [DOI] [PMC free article] [PubMed] [Google Scholar]
- Lee J.E., Cathey P.I., Wu H., Parker R., Voeltz G.K. Endoplasmic reticulum contact sites regulate the dynamics of membraneless organelles. Science. 2020;367:eaay7108. doi: 10.1126/science.aay7108. [DOI] [PMC free article] [PubMed] [Google Scholar]
- Lenzi J., De Santis R., de Turris V., Morlando M., Laneve P., Calvo A., Caliendo V., Chiò A., Rosa A., Bozzoni I. ALS mutant FUS proteins are recruited into stress granules in induced pluripotent stem cell-derived motoneurons. Dis. Model. Mech. 2015;8:755–766. doi: 10.1242/dmm.020099. [DOI] [PMC free article] [PubMed] [Google Scholar]
- Liao Y.C., Fernandopulle M.S., Wang G., Choi H., Hao L., Drerup C.M., Patel R., Qamar S., Nixon-Abell J., Shen Y. RNA Granules Hitchhike on Lysosomes for Long-Distance Transport, Using Annexin A11 as a Molecular Tether. Cell. 2019;179:147–164.e20. doi: 10.1016/j.cell.2019.08.050. [DOI] [PMC free article] [PubMed] [Google Scholar]
- Lin Y., Mori E., Kato M., Xiang S., Wu L., Kwon I., McKnight S.L. Toxic PR Poly-Dipeptides Encoded by the C9orf72 Repeat Expansion Target LC Domain Polymers. Cell. 2016;167:789–802.e12. doi: 10.1016/j.cell.2016.10.003. [DOI] [PMC free article] [PubMed] [Google Scholar]
- Ling S.C., Albuquerque C.P., Han J.S., Lagier-Tourenne C., Tokunaga S., Zhou H., Cleveland D.W. ALS-associated mutations in TDP-43 increase its stability and promote TDP-43 complexes with FUS/TLS. Proc. Natl. Acad. Sci. USA. 2010;107:13318–13323. doi: 10.1073/pnas.1008227107. [DOI] [PMC free article] [PubMed] [Google Scholar]
- Listenberger L.L., Han X., Lewis S.E., Cases S., Farese R.V., Jr., Ory D.S., Schaffer J.E. Triglyceride accumulation protects against fatty acid-induced lipotoxicity. Proc. Natl. Acad. Sci. USA. 2003;100:3077–3082. doi: 10.1073/pnas.0630588100. [DOI] [PMC free article] [PubMed] [Google Scholar]
- Liu Y., Wang T., Ji Y.J., Johnson K., Liu H., Johnson K., Bailey S., Suk Y., Lu Y.N., Liu M., Wang J. A C9orf72-CARM1 axis regulates lipid metabolism under glucose starvation-induced nutrient stress. Genes Dev. 2018;32:1380–1397. doi: 10.1101/gad.315564.118. [DOI] [PMC free article] [PubMed] [Google Scholar]
- Livak K.J., Schmittgen T.D. Analysis of relative gene expression data using real-time quantitative PCR and the 2(-Delta C(T)) Method. Methods. 2001;25:402–408. doi: 10.1006/meth.2001.1262. [DOI] [PubMed] [Google Scholar]
- Lu X., Drocco J., Wieschaus E.F. Cell cycle regulation via inter-nuclear communication during the early embryonic development of Drosophila melanogaster. Cell Cycle. 2010;9:2908–2910. doi: 10.4161/cc.9.14.12557. [DOI] [PMC free article] [PubMed] [Google Scholar]
- Mackenzie I.R., Nicholson A.M., Sarkar M., Messing J., Purice M.D., Pottier C., Annu K., Baker M., Perkerson R.B., Kurti A. TIA1 Mutations in Amyotrophic Lateral Sclerosis and Frontotemporal Dementia Promote Phase Separation and Alter Stress Granule Dynamics. Neuron. 2017;95:808–816.e9. doi: 10.1016/j.neuron.2017.07.025. [DOI] [PMC free article] [PubMed] [Google Scholar]
- Manfredi G., Xu Z. Mitochondrial dysfunction and its role in motor neuron degeneration in ALS. Mitochondrion. 2005;5:77–87. doi: 10.1016/j.mito.2005.01.002. [DOI] [PubMed] [Google Scholar]
- Mann J.R., Gleixner A.M., Mauna J.C., Gomes E., DeChellis-Marks M.R., Needham P.G., Copley K.E., Hurtle B., Portz B., Pyles N.J. RNA Binding Antagonizes Neurotoxic Phase Transitions of TDP-43. Neuron. 2019;102:321–338.e8. doi: 10.1016/j.neuron.2019.01.048. [DOI] [PMC free article] [PubMed] [Google Scholar]
- Martel C., Allouche M., Esposti D.D., Fanelli E., Boursier C., Henry C., Chopineau J., Calamita G., Kroemer G., Lemoine A., Brenner C. Glycogen synthase kinase 3-mediated voltage-dependent anion channel phosphorylation controls outer mitochondrial membrane permeability during lipid accumulation. Hepatology. 2013;57:93–102. doi: 10.1002/hep.25967. [DOI] [PubMed] [Google Scholar]
- Mateju D., Franzmann T.M., Patel A., Kopach A., Boczek E.E., Maharana S., Lee H.O., Carra S., Hyman A.A., Alberti S. An aberrant phase transition of stress granules triggered by misfolded protein and prevented by chaperone function. EMBO J. 2017;36:1669–1687. doi: 10.15252/embj.201695957. [DOI] [PMC free article] [PubMed] [Google Scholar]
- McGurk L., Gomes E., Guo L., Mojsilovic-Petrovic J., Tran V., Kalb R.G., Shorter J., Bonini N.M. Poly(ADP-Ribose) Prevents Pathological Phase Separation of TDP-43 by Promoting Liquid Demixing and Stress Granule Localization. Mol. Cell. 2018;71:703–717.e9. doi: 10.1016/j.molcel.2018.07.002. [DOI] [PMC free article] [PubMed] [Google Scholar]
- Mediani L., Antoniani F., Galli V., Vinet J., Carrà A.D., Bigi I., Tripathy V., Tiago T., Cimino M., Leo G. Hsp90-mediated regulation of DYRK3 couples stress granule disassembly and growth via mTORC1 signaling. EMBO Rep. 2021;22:e51740. doi: 10.15252/embr.202051740. [DOI] [PMC free article] [PubMed] [Google Scholar]
- Mehta A.R., Walters R., Waldron F.M., Pal S., Selvaraj B.T., Macleod M.R., Hardingham G.E., Chandran S., Gregory J.M. Targeting mitochondrial dysfunction in amyotrophic lateral sclerosis: a systematic review and meta-analysis. Brain Commun. 2019;1:fcz009. doi: 10.1093/braincomms/fcz009. [DOI] [PMC free article] [PubMed] [Google Scholar]
- Meisinger C., Ryan M.T., Hill K., Model K., Lim J.H., Sickmann A., Müller H., Meyer H.E., Wagner R., Pfanner N. Protein import channel of the outer mitochondrial membrane: a highly stable Tom40-Tom22 core structure differentially interacts with preproteins, small tom proteins, and import receptors. Mol. Cell. Biol. 2001;21:2337–2348. doi: 10.1128/MCB.21.7.2337-2348.2001. [DOI] [PMC free article] [PubMed] [Google Scholar]
- Mihaylova M.M., Cheng C.W., Cao A.Q., Tripathi S., Mana M.D., Bauer-Rowe K.E., Abu-Remaileh M., Clavain L., Erdemir A., Lewis C.A. Fasting Activates Fatty Acid Oxidation to Enhance Intestinal Stem Cell Function during Homeostasis and Aging. Cell Stem Cell. 2018;22:769–778.e4. doi: 10.1016/j.stem.2018.04.001. [DOI] [PMC free article] [PubMed] [Google Scholar]
- Moutaoufik M.T., El Fatimy R., Nassour H., Gareau C., Lang J., Tanguay R.M., Mazroui R., Khandjian E.W. UVC-induced stress granules in mammalian cells. PLoS ONE. 2014;9:e112742. doi: 10.1371/journal.pone.0112742. [DOI] [PMC free article] [PubMed] [Google Scholar]
- Muyderman H., Chen T. Mitochondrial dysfunction in amyotrophic lateral sclerosis - a valid pharmacological target? Br. J. Pharmacol. 2014;171:2191–2205. doi: 10.1111/bph.12476. [DOI] [PMC free article] [PubMed] [Google Scholar]
- Naghdi S., Hajnóczky G. VDAC2-specific cellular functions and the underlying structure. Biochimica et Biophysica Acta (BBA) - Mol. Cell Res. 2016;1863:2503–2514. doi: 10.1016/j.bbamcr.2016.04.020. [DOI] [PMC free article] [PubMed] [Google Scholar]
- Nguyen T.B., Louie S.M., Daniele J.R., Tran Q., Dillin A., Zoncu R., Nomura D.K., Olzmann J.A. DGAT1-Dependent Lipid Droplet Biogenesis Protects Mitochondrial Function during Starvation-Induced Autophagy. Dev. Cell. 2017;42:9–21.e5. doi: 10.1016/j.devcel.2017.06.003. [DOI] [PMC free article] [PubMed] [Google Scholar]
- Orrù S., Coni P., Floris A., Littera R., Carcassi C., Sogos V., Brancia C. Reduced stress granule formation and cell death in fibroblasts with the A382T mutation of TARDBP gene: evidence for loss of TDP-43 nuclear function. Hum. Mol. Genet. 2016;25:4473–4483. doi: 10.1093/hmg/ddw276. [DOI] [PubMed] [Google Scholar]
- Panas M.D., Ivanov P., Anderson P. Mechanistic insights into mammalian stress granule dynamics. J. Cell Biol. 2016;215:313–323. doi: 10.1083/jcb.201609081. [DOI] [PMC free article] [PubMed] [Google Scholar]
- Patel A., Lee H.O., Jawerth L., Maharana S., Jahnel M., Hein M.Y., Stoynov S., Mahamid J., Saha S., Franzmann T.M. A Liquid-to-Solid Phase Transition of the ALS Protein FUS Accelerated by Disease Mutation. Cell. 2015;162:1066–1077. doi: 10.1016/j.cell.2015.07.047. [DOI] [PubMed] [Google Scholar]
- Pattabiraman S., Azad G.K., Amen T., Brielle S., Park J.E., Sze S.K., Meshorer E., Kaganovich D. Vimentin protects differentiating stem cells from stress. Sci. Rep. 2020;10:19525. doi: 10.1038/s41598-020-76076-4. [DOI] [PMC free article] [PubMed] [Google Scholar]
- Pennetta G., Welte M.A. Emerging Links between Lipid Droplets and Motor Neuron Diseases. Dev. Cell. 2018;45:427–432. doi: 10.1016/j.devcel.2018.05.002. [DOI] [PMC free article] [PubMed] [Google Scholar]
- Perez-Riverol Y., Csordas A., Bai J., Bernal-Llinares M., Hewapathirana S., Kundu D.J., Inuganti A., Griss J., Mayer G., Eisenacher M. The PRIDE database and related tools and resources in 2019: improving support for quantification data. Nucleic Acids Res. 2019;47(D1):D442–D450. doi: 10.1093/nar/gky1106. [DOI] [PMC free article] [PubMed] [Google Scholar]
- Piotrowska J., Hansen S.J., Park N., Jamka K., Sarnow P., Gustin K.E. Stable formation of compositionally unique stress granules in virus-infected cells. J. Virol. 2010;84:3654–3665. doi: 10.1128/JVI.01320-09. [DOI] [PMC free article] [PubMed] [Google Scholar]
- Pollari E., Goldsteins G., Bart G., Koistinaho J., Giniatullin R. The role of oxidative stress in degeneration of the neuromuscular junction in amyotrophic lateral sclerosis. Front. Cell Neurosci. 2014;8:131. doi: 10.3389/fncel.2014.00131. [DOI] [PMC free article] [PubMed] [Google Scholar]
- Poulsen L.l., Siersbæk M., Mandrup S. PPARs: fatty acid sensors controlling metabolism. Semin. Cell Dev. Biol. 2012;23:631–639. doi: 10.1016/j.semcdb.2012.01.003. [DOI] [PubMed] [Google Scholar]
- Prasad A., Bharathi V., Sivalingam V., Girdhar A., Patel B.K. Molecular Mechanisms of TDP-43 Misfolding and Pathology in Amyotrophic Lateral Sclerosis. Front. Mol. Neurosci. 2019;12:25. doi: 10.3389/fnmol.2019.00025. [DOI] [PMC free article] [PubMed] [Google Scholar]
- Ran F.A., Hsu P.D., Wright J., Agarwala V., Scott D.A., Zhang F. Genome engineering using the CRISPR-Cas9 system. Nat. Protoc. 2013;8:2281–2308. doi: 10.1038/nprot.2013.143. [DOI] [PMC free article] [PubMed] [Google Scholar]
- Rappsilber J., Mann M., Ishihama Y. Protocol for micro-purification, enrichment, pre-fractionation and storage of peptides for proteomics using StageTips. Nat. Protoc. 2007;2:1896–1906. doi: 10.1038/nprot.2007.261. [DOI] [PubMed] [Google Scholar]
- Reineke L.C., Cheema S.A., Dubrulle J., Neilson J.R. Chronic starvation induces noncanonical pro-death stress granules. J. Cell Sci. 2018;131:jcs220244. doi: 10.1242/jcs.220244. [DOI] [PMC free article] [PubMed] [Google Scholar]
- Rösch K., Kwiatkowski M., Hofmann S., Schöbel A., Grüttner C., Wurlitzer M., Schlüter H., Herker E. Quantitative Lipid Droplet Proteome Analysis Identifies Annexin A3 as a Cofactor for HCV Particle Production. Cell Rep. 2016;16:3219–3231. doi: 10.1016/j.celrep.2016.08.052. [DOI] [PubMed] [Google Scholar]
- Roux K.J., Kim D.I., Raida M., Burke B. A promiscuous biotin ligase fusion protein identifies proximal and interacting proteins in mammalian cells. J. Cell Biol. 2012;196:801–810. doi: 10.1083/jcb.201112098. [DOI] [PMC free article] [PubMed] [Google Scholar]
- Scaricamazza S., Salvatori I., Giacovazzo G., Loeffler J.P., Renè F., Rosina M., Quessada C., Proietti D., Heil C., Rossi S. Skeletal-Muscle Metabolic Reprogramming in ALS-SOD1G93A Mice Predates Disease Onset and Is A Promising Therapeutic Target. iScience. 2020;23:101087. doi: 10.1016/j.isci.2020.101087. [DOI] [PMC free article] [PubMed] [Google Scholar]
- Schönfeld P., Wojtczak L. Fatty acids as modulators of the cellular production of reactive oxygen species. Free Radic. Biol. Med. 2008;45:231–241. doi: 10.1016/j.freeradbiomed.2008.04.029. [DOI] [PubMed] [Google Scholar]
- Sengupta S., Peterson T.R., Laplante M., Oh S., Sabatini D.M. mTORC1 controls fasting-induced ketogenesis and its modulation by ageing. Nature. 2010;468:1100–1104. doi: 10.1038/nature09584. [DOI] [PubMed] [Google Scholar]
- Sfakianos A.P., Mellor L.E., Pang Y.F., Kritsiligkou P., Needs H., Abou-Hamdan H., Désaubry L., Poulin G.B., Ashe M.P., Whitmarsh A.J. The mTOR-S6 kinase pathway promotes stress granule assembly. Cell Death Differ. 2018;25:1766–1780. doi: 10.1038/s41418-018-0076-9. [DOI] [PMC free article] [PubMed] [Google Scholar]
- Shao M., Shan B., Liu Y., Deng Y., Yan C., Wu Y., Mao T., Qiu Y., Zhou Y., Jiang S. Hepatic IRE1α regulates fasting-induced metabolic adaptive programs through the XBP1s-PPARα axis signalling. Nat. Commun. 2014;5:3528. doi: 10.1038/ncomms4528. [DOI] [PubMed] [Google Scholar]
- Shoshan-Barmatz V., De Pinto V., Zweckstetter M., Raviv Z., Keinan N., Arbel N. VDAC, a multi-functional mitochondrial protein regulating cell life and death. Mol. Aspects Med. 2010;31:227–285. doi: 10.1016/j.mam.2010.03.002. [DOI] [PubMed] [Google Scholar]
- Sievers F., Wilm A., Dineen D., Gibson T.J., Karplus K., Li W., Lopez R., McWilliam H., Remmert M., Söding J. Fast, scalable generation of high-quality protein multiple sequence alignments using Clustal Omega. Mol. Syst. Biol. 2011;7:539. doi: 10.1038/msb.2011.75. [DOI] [PMC free article] [PubMed] [Google Scholar]
- Smith E.F., Shaw P.J., De Vos K.J. The role of mitochondria in amyotrophic lateral sclerosis. Neurosci. Lett. 2019;710:132933. doi: 10.1016/j.neulet.2017.06.052. [DOI] [PubMed] [Google Scholar]
- Szelechowski M., Amoedo N., Obre E., Léger C., Allard L., Bonneu M., Claverol S., Lacombe D., Oliet S., Chevallier S. Metabolic Reprogramming in Amyotrophic Lateral Sclerosis. Sci. Rep. 2018;8:3953. doi: 10.1038/s41598-018-22318-5. [DOI] [PMC free article] [PubMed] [Google Scholar]
- Szklarczyk D., Franceschini A., Wyder S., Forslund K., Heller D., Huerta-Cepas J., Simonovic M., Roth A., Santos A., Tsafou K.P. STRING v10: protein-protein interaction networks, integrated over the tree of life. Nucleic Acids Res. 2015;43:D447–D452. doi: 10.1093/nar/gku1003. [DOI] [PMC free article] [PubMed] [Google Scholar]
- Takahara T., Maeda T. Transient sequestration of TORC1 into stress granules during heat stress. Mol. Cell. 2012;47:242–252. doi: 10.1016/j.molcel.2012.05.019. [DOI] [PubMed] [Google Scholar]
- Takahashi M., Higuchi M., Matsuki H., Yoshita M., Ohsawa T., Oie M., Fujii M. Stress granules inhibit apoptosis by reducing reactive oxygen species production. Mol. Cell. Biol. 2013;33:815–829. doi: 10.1128/MCB.00763-12. [DOI] [PMC free article] [PubMed] [Google Scholar]
- Tantama M., Martínez-François J.R., Mongeon R., Yellen G. Imaging energy status in live cells with a fluorescent biosensor of the intracellular ATP-to-ADP ratio. Nat. Commun. 2013;4:2550. [Google Scholar]
- Taylor J.P., Brown R.H., Jr., Cleveland D.W. Decoding ALS: from genes to mechanism. Nature. 2016;539:197–206. doi: 10.1038/nature20413. [DOI] [PMC free article] [PubMed] [Google Scholar]
- Tefera T.W., Borges K. Metabolic Dysfunctions in Amyotrophic Lateral Sclerosis Pathogenesis and Potential Metabolic Treatments. Front. Neurosci. 2017;10:611. doi: 10.3389/fnins.2016.00611. [DOI] [PMC free article] [PubMed] [Google Scholar]
- Thedieck K., Holzwarth B., Prentzell M.T., Boehlke C., Kläsener K., Ruf S., Sonntag A.G., Maerz L., Grellscheid S.N., Kremmer E. Inhibition of mTORC1 by astrin and stress granules prevents apoptosis in cancer cells. Cell. 2013;154:859–874. doi: 10.1016/j.cell.2013.07.031. [DOI] [PubMed] [Google Scholar]
- Tyanova S., Temu T., Sinitcyn P., Carlson A., Hein M.Y., Geiger T., Mann M., Cox J. The Perseus computational platform for comprehensive analysis of (prote)omics data. Nat. Methods. 2016;13:731–740. doi: 10.1038/nmeth.3901. [DOI] [PubMed] [Google Scholar]
- Tzeng J., Byun J., Park J.Y., Yamamoto T., Schesing K., Tian B., Sadoshima J., Oka S.-I. An Ideal PPAR Response Element Bound to and Activated by PPARα. PLoS ONE. 2015;10:e0134996. doi: 10.1371/journal.pone.0134996. [DOI] [PMC free article] [PubMed] [Google Scholar]
- Vandoorne T., De Bock K., Van Den Bosch L. Energy metabolism in ALS: an underappreciated opportunity? Acta Neuropathol. 2018;135:489–509. doi: 10.1007/s00401-018-1835-x. [DOI] [PMC free article] [PubMed] [Google Scholar]
- Varga T., Czimmerer Z., Nagy L. PPARs are a unique set of fatty acid regulated transcription factors controlling both lipid metabolism and inflammation. Biochim. Biophys. Acta. 2011;1812:1007–1022. doi: 10.1016/j.bbadis.2011.02.014. [DOI] [PMC free article] [PubMed] [Google Scholar]
- Walker A.K., Soo K.Y., Sundaramoorthy V., Parakh S., Ma Y., Farg M.A., Wallace R.H., Crouch P.J., Turner B.J., Horne M.K., Atkin J.D. ALS-associated TDP-43 induces endoplasmic reticulum stress, which drives cytoplasmic TDP-43 accumulation and stress granule formation. PLoS ONE. 2013;8:e81170. doi: 10.1371/journal.pone.0081170. [DOI] [PMC free article] [PubMed] [Google Scholar]
- Waterhouse A.M., Procter J.B., Martin D.M., Clamp M., Barton G.J. Jalview Version 2--a multiple sequence alignment editor and analysis workbench. Bioinformatics. 2009;25:1189–1191. doi: 10.1093/bioinformatics/btp033. [DOI] [PMC free article] [PubMed] [Google Scholar]
- Yang P., Mathieu C., Kolaitis R.M., Zhang P., Messing J., Yurtsever U., Yang Z., Wu J., Li Y., Pan Q. G3BP1 Is a Tunable Switch that Triggers Phase Separation to Assemble Stress Granules. Cell. 2020;181:325–345.e28. doi: 10.1016/j.cell.2020.03.046. [DOI] [PMC free article] [PubMed] [Google Scholar]
- Yu D., Baird M.A., Allen J.R., Howe E.S., Klassen M.P., Reade A., Makhijani K., Song Y., Liu S., Murthy Z. A naturally monomeric infrared fluorescent protein for protein labeling in vivo. Nat. Methods. 2015;12:763–765. doi: 10.1038/nmeth.3447. [DOI] [PMC free article] [PubMed] [Google Scholar]
- Zhang K., Daigle J.G., Cunningham K.M., Coyne A.N., Ruan K., Grima J.C., Bowen K.E., Wadhwa H., Yang P., Rigo F. Stress Granule Assembly Disrupts Nucleocytoplasmic Transport. Cell. 2018;173:958–971.e17. doi: 10.1016/j.cell.2018.03.025. [DOI] [PMC free article] [PubMed] [Google Scholar]
Associated Data
This section collects any data citations, data availability statements, or supplementary materials included in this article.
Supplementary Materials
Data Availability Statement
The mass spectrometry proteomics data have been deposited to the ProteomeXchange Consortium via the PRIDE (Perez-Riverol et al., 2019) partner repository with the dataset identifier PXD025334. Additional data that support the conclusions of this study are available on reasonable request. This study didn’t generate any code.