

Abstract
Aims:
Measurement of self-reported lower urinary tract symptoms (LUTS) typically uses a recall period, for example, “In the past 30 days….” Compared to averaged daily reports, 30-day recall is generally unbiased, but recall bias varies by item. We examined the associations between personal characteristics (eg, age, symptom bother) and 30-day recall of LUTS using items from the Symptoms of Lower Urinary Tract Dysfunction Research Network Comprehensive Assessment of Self-reported Urinary Symptoms questionnaire.
Methods:
Participants (127 women and 127 men) were recruited from 6 US tertiary care sites. They completed daily assessments for 30 days and a 30-day recall assessment at the end of the study month. For each of the 18 tested items, representing 10 LUTS, the average of the participant’s daily responses was modeled as a function of their 30-day recall, the personal characteristic, and the interaction between the 30-day recall and the characteristic in separate general linear regression models, adjusted for sex.
Results:
Nine items representing 7 LUTS exhibited under- or overreporting (recall bias) for at least 25% of participants. Bias was associated with personal characteristics for six LUTS. Underreporting of incontinence was associated with older age, lower anxiety, and negative affect; overreporting of other LUTS was associated with , symptom bother, symptom variability, anxiety, and depression.
Conclusions:
We identified under- or overreporting that was associated with personal characteristics for six common LUTS. Some cues (eg, less bother and lower anxiety) were related to recall bias in an unexpected direction. Thus, providers should exercise caution when making judgments about the accuracy of a patient’s symptom recall based on patient demographic and psychosocial characteristics.
Keywords: humans, lower urinary tract symptoms, measurement, mental recall, patient-reported outcomes, self-report, urination
1 |. INTRODUCTION
Clinical urologists rely on the accuracy of patient self-reported lower urinary tract symptoms (LUTS) for clinical decision making, to guide treatment options, and to gauge treatment responsiveness. Patient-reported outcome measures (PROMs) are important tools used in research and clinical care for understanding patients’ experiences and evaluating treatment outcomes.1 PROMs typically query people with respect to a specific recall period, for example, “in the past 4 weeks” or “in the past 30 days.” A recall period should balance accuracy and burden because longer recall periods may be more prone to recall bias, whereas shorter recall periods may require more frequent assessments to cover the same time period.2 In urology, multiday bladder diaries are commonly used in addition to scales that use a 1-month recall period, including the American Urological Association Symptom Index,3 the International Consultation on Incontinence Modular Questionnaire,4,5 and the Overactive Bladder Symptom and Health-Related Quality of Life Questionnaire.6
To inform selection of an appropriate recall period for the Symptoms of Lower Urinary Tract Dysfunction Research Network (LURN)7 Comprehensive Assessment of Self-reported Urinary Symptoms (CASUS) for women and men,8,9 we conducted the LURN Recall Study.10 The study included a comparison of averaged daily recall over 30 days and 30-day recall of self-reported LUTS. We found that 30-day recall was good overall for most LUTS, but recall bias varied by item. Specifically, some symptoms had higher proportions of individuals with significant recall bias (systematic over- or underreporting of at least 10%), despite being relatively unbiased on average. For example, the median bias for urgency (a sudden need to urinate) was about 5%,10 but 38% of people overreported and 6% underreported their urgency on 30-day recall compared to their daily average.
The LURN Recall Study also sought to evaluate whether recall bias was related to participants’ demographic and psychosocial characteristics. To the best of our knowledge, no previous studies have examined whether an individual’s personal characteristics are related to the accuracy of LUTS recall for women and men across a variety of LUTS. One previous study of incontinence among women compared voiding diaries to recalled reports and found that worse concordance between the two was associated with higher symptom bother.11 In other non-LUTS contexts, multiple studies have demonstrated a relationship between recall bias and the variability of symptoms, including anger, depression, and fatigue,12 pain,13 and diabetes symptoms (eg, thirst, irritability, and neuropathy).14 Few studies have examined whether sexaffects recall, but in a study of 4-week recall of bowel habits compared to daily diary reports, men were more accurate than women in recalling the number of bowel movements,15 while in a comparison between 30-day recall of sexual function and daily reports, men overestimated frequency of sexual interest more than women.16 Emotional distress and mood have also been studied in relation to recall.16 In the current study, we evaluated whether disagreement between daily reports and 30-day recall of LUTS (recall bias) was a function of personal characteristics by testing the associations between LUTS recall and sex, age, symptom bother, depression, anxiety, mood, and symptom variability. Based on previous LUTS research,11 we hypothesized that greater symptom bother would be associated with overreporting symptoms at 30 days.
2 |. METHODS
2.1 |. Study design and population
Men and women over the age of 18 were recruited between May 2017 and April 2018 from 6 tertiary care sites. Participants needed to be able to complete electronic questionnaires and understand English. Cognitive impairment, planned changes in LUTS treatment during the 30-day study period (medication or surgery), current cancer treatment, general or spinal/epidural anesthesia in the past 3 months, and pregnancy/childbirth in the past 6 months were considered exclusion criteria. All participants provided informed consent. The study was approved by the Institutional Review Boards of each site and the Data Coordinating Center.
Participants were screened for several LUTS (Table S1) and enrolled if they endorsed at least one symptom as moderately severe (or higher) and bothersome in the past 2 weeks and the past 3 months. Moderately severe or higher was defined as a response of 3, 4, or 5 on a 1-to-5-point scale.
Additional details about the study design have been published.10 In brief, participants were randomly assigned in a 2:1:1 ratio to a study group (1, 2A, and 2B). The current analysis includes group 1, who completed a baseline assessment, 30 daily (end-of-day) assessments, four 7-day recall assessments at the end of each 7-day period, and one 30-day recall assessment at the end of the study.
2.2 |. Measures
The baseline assessment included all CASUS items using a 7-day recall period and sociodemographic characteristics. The daily, weekly, and 30-day assessments collected a subset of CASUS items (Table S2) using a 24-hour, 7-day, or 30-day recall period, respectively. The 30-day assessment also collected self-reported symptom bother over the 30-day period, concurrent mood (Positive and Negative Affect Schedule, [PANAS]),17,18 and depression and anxiety over the past week (Patient-Reported Outcomes Measurement Information System 4a short forms).19 For each participant who reported a symptom at least once during the study period, we computed two indicators of symptom variability. First, we classified participants as “high variability” with respect to a particular symptom if the participant’s responses were “yes” 40% to 60% of the time for binary items or the range of answers spanned ≥40% of the scale for ordinal items.10 Second, we assessed symptom variation over the 30-day study period using standard deviation and maximum deviation. Standard deviation was calculated assuming a Bernoulli distribution20 for binary recall items, and maximum deviation was calculated as the maximum daily recall value minus the minimum daily recall value, divided by the maximum possible recall item value.
2.3 |. Statistical analysis
To assess if there were associations between participants’ personal characteristics and LUTS recall, we tested each characteristic separately in general linear regression models. We included all participants who completed the 30-day recall assessment and had at least 3 weeks with 5 or more 24-hour recall assessments completed. Models for each item included participants who reported at least mild symptom severity or higher at least once during the study period. Due to the comparatively low frequency of incontinence symptoms reported among men, these models were assessed among women only, all other models were adjusted for sex. We averaged 24-hour recall responses for each participant to obtain their average daily recall value. This average was modeled as a function of the 30-day recall, the personal characteristic, and the interaction between the 30-day recall and the characteristic. If the joint significance test of the main effects and interaction was significant, we examined the interaction effect and, if not significant, fit the model again using only main effects. If the personal characteristic main effect was not significant (P > .05) we did not interpret the model. A significant main effect term implies that the characteristic may explain some or all of the bias in 30-day recall; a significant interaction term implies the bias varies across the characteristic groups (eg, older vs younger participants).
Given the large number of relationships evaluated, we adopted the following strategy for identifying noteworthy effects of patient characteristics. First, we determined whether there was a statistically significant (P ≤ .05) main effect and/or interaction involving the characteristic (Table 1). Second, if the effect was statistically significant, we examined the predicted regression lines (colored lines in the figures) to determine whether the effect of the characteristic resulted in some participants being predicted to be either over- or underreporting relative to others (eg, men compared to women or those with higher compared to lower symptom bother), where over- or underreporting was defined as 10% bias in either direction10 (represented by the gray triangles in the figures). Third, for those effects meeting the first two criteria, we examined the density of data points comprising the predicted regression lines and retained those effects for which data were not sparse in the area(s) that extended outside of the ±10% bias band. Noteworthy effects are summarized in Table 1 and depicted in the figures. All analyses were conducted using SAS software, version 9.4 (SAS Institute Inc., Cary, NC, 2013).
TABLE 1.
Summary of statistically significant and noteworthy model results
| Model P values |
|||||||
|---|---|---|---|---|---|---|---|
| Symptom | Associated characteristic | Bias and/or correlation | Sex | Main effect | Interaction | Direction of noteworthy effect | |
| Stress incontinence 1 | Leaking with laughing, sneezing, or coughing | Age | B | F | .028 | … | |
| Stress incontinence 1a | PANAS negative | B | F | .008 | … | Higher negative affect and underreporting | |
| Stress incontinence 1a | PROMIS anxiety | C | F | .0167 | .032 | Lower anxiety and underreporting | |
| Stress incontinence 2 | Leaking with physical activities | Age | C | F | .609 | .009 | |
| Stress incontinence 2 | Bother | C | F | .055 | .008 | ||
| Stress incontinence 2 | PANAS positive | C | F | .332 | <.001 | ||
| Urgency incontinencea | Leaking after feeling a sudden need to urinate | Age | B | F | <.001 | … | Older age and underreporting |
| Urgency incontinencea | PROMIS anxiety | B | F | .007 | … | Lower anxiety and underreporting | |
| Other incontinence 1 | Leaking for no identifiable reason | Age | C | F | .802 | <.001 | |
| Other incontinence 1 | PROMIS depression | C | F | .955 | .021 | ||
| Other incontinence 1 | PROMIS anxiety | C | F | .921 | .034 | ||
| Other incontinence 2 | Leaking without feeling it | Age | C | F | .889 | <.001 | |
| Other incontinence 2 | PROMIS depression | C | F | .819 | .024 | ||
| Other incontinence 2 | PROMIS anxiety | C | F | .738 | .013 | ||
| Other incontinence 3 | Leaking when getting up from a chair | Age | B | F | .006 | … | |
| Daytime frequency 1 | # of times urinated during waking hours | Bother | B, C | M/F | .026 | .005 | |
| Nocturia 1a | # times wake up and urinate | Sex | B, C | M/F | .009 | .019 | Male sex and overreporting |
| Nocturia 1 | Age | B | M/F | .015 | … | ||
| Nocturia 1 | Bother | B | M/F | <.001 | … | ||
| Nocturia 1 | PANAS negative | B | M/F | .007 | … | ||
| Nocturia 1 | Highly variable | B, C | F | <.001 | <.001 | ||
| Nocturia 2 | Woke up because of need to urinate | Highly variable | B, C | M/F | .003 | <.001 | |
| Nocturia 3 | Nighttime leak on the way to the bathroom | Bother | B | M/F | .022 | … | |
| Nocturia 3 | Highly variable | B, C | M/F | <.001 | <.001 | ||
| Urgency 1a | Frequency of feeling a sudden need to urinate | Bother | C | M/F | .059 | <.001 | Lower symptom bother and overreporting among women |
| Urgency 1a | PROMIS depression | B, C | M/F | .044 | .012 | Lower depression and overreporting | |
| Urgency 1a | PROMIS anxiety | B, C | M/F | .0206 | .0051 | Lower anxiety and overreporting | |
| Urgency 1a | Highly variable | B, C | M/F | <.001 | .005 | Higher symptom variability and overreporting | |
| Urgency 2 | Difficulty of waiting after feeling a need to urinate | PANAS positive | B | M/F | .009 | … | |
| Slow/weak stream | Frequency of slow/weak urine flow | Age | B | M/F | .031 | … | |
| Slow/weak streama | Bother | C | M/F | .531 | .009 | Lower symptom bother and overreporting | |
| Incomplete emptying | Frequency of feeling bladder not completely empty after urination | Bother | C | M/F | .689 | .01 | |
| Incomplete emptying | PANAS negative | B | M/F | .021 | … | ||
| Postmicturition dribble | Frequency of dribbling after urination | Sex | B, C | M/F | .292 | <.001 | |
| Postmicturition dribblea | Highly variable | B, C | M | .01 | .008 | Higher variability and overreporting | |
| Postmicturition dribblea | Highly variable | B | F | .009 | … | Higher variability and overreporting | |
Abbreviations: PANAS, Positive and Negative Affect Schedule; PROMIS, Patient-Reported Outcomes Measurement Information System.
Met criteria for noteworthy effect, as described in the manuscript.
3 |. RESULTS
Of 258 group 1 participants enrolled, four (1.5%) were excluded due to insufficient completion of daily recall assessments. Of the 254 participants included in this analysis, the mean age was 62 years among 127 men, and 58 years among 127 women (Table S1). The majority were white, non-Hispanic, married, and with a college degree. Each of the LUTS was reported by at least half of the sample at some point during the 30-day study. Anxiety and depression median scores were similar for men and women as well as to the US general population.19 PANAS scores were similar for men and women.
The 18 LUTS items tested were unbiased on average,10 but some items had higher proportions (>25%) of individuals with recall bias (Table S2); these included stress incontinence, urgency incontinence, nocturia, urgency, slow/weak stream, incomplete emptying, and postmicturition dribble. Regarding symptom variation over the 30-day study period, the distribution of the intraperson standard deviations and maximum deviations showed that the median was 0 or close to 0 for the incontinence items, while there was more variability (eg, SD ≥ 0.4 and maximum deviation ≥25%) in responses to other items, notably daytime and nighttime frequency (when phrased as the number of times someone urinated), as well as urgency, slow/weak stream, incomplete emptying, and postmicturition dribble.
3.1 |. Associations between patient characteristics and recall bias, by symptom
Eight urinary incontinence items were tested (women only), and multiple patient characteristics were associated with underreporting urinary incontinence. Older age (Figure 1) and lower anxiety (Figure S1) were associated with underreporting urgency incontinence. For stress incontinence (laughing, sneezing, or coughing), higher negative affect was associated with underreporting (Figure S2a), as was lower anxiety, especially among those with higher symptom severity (Figure S2b). Participant characteristics did not appear to have a noteworthy effect on recall for the other incontinence items.
FIGURE 1.
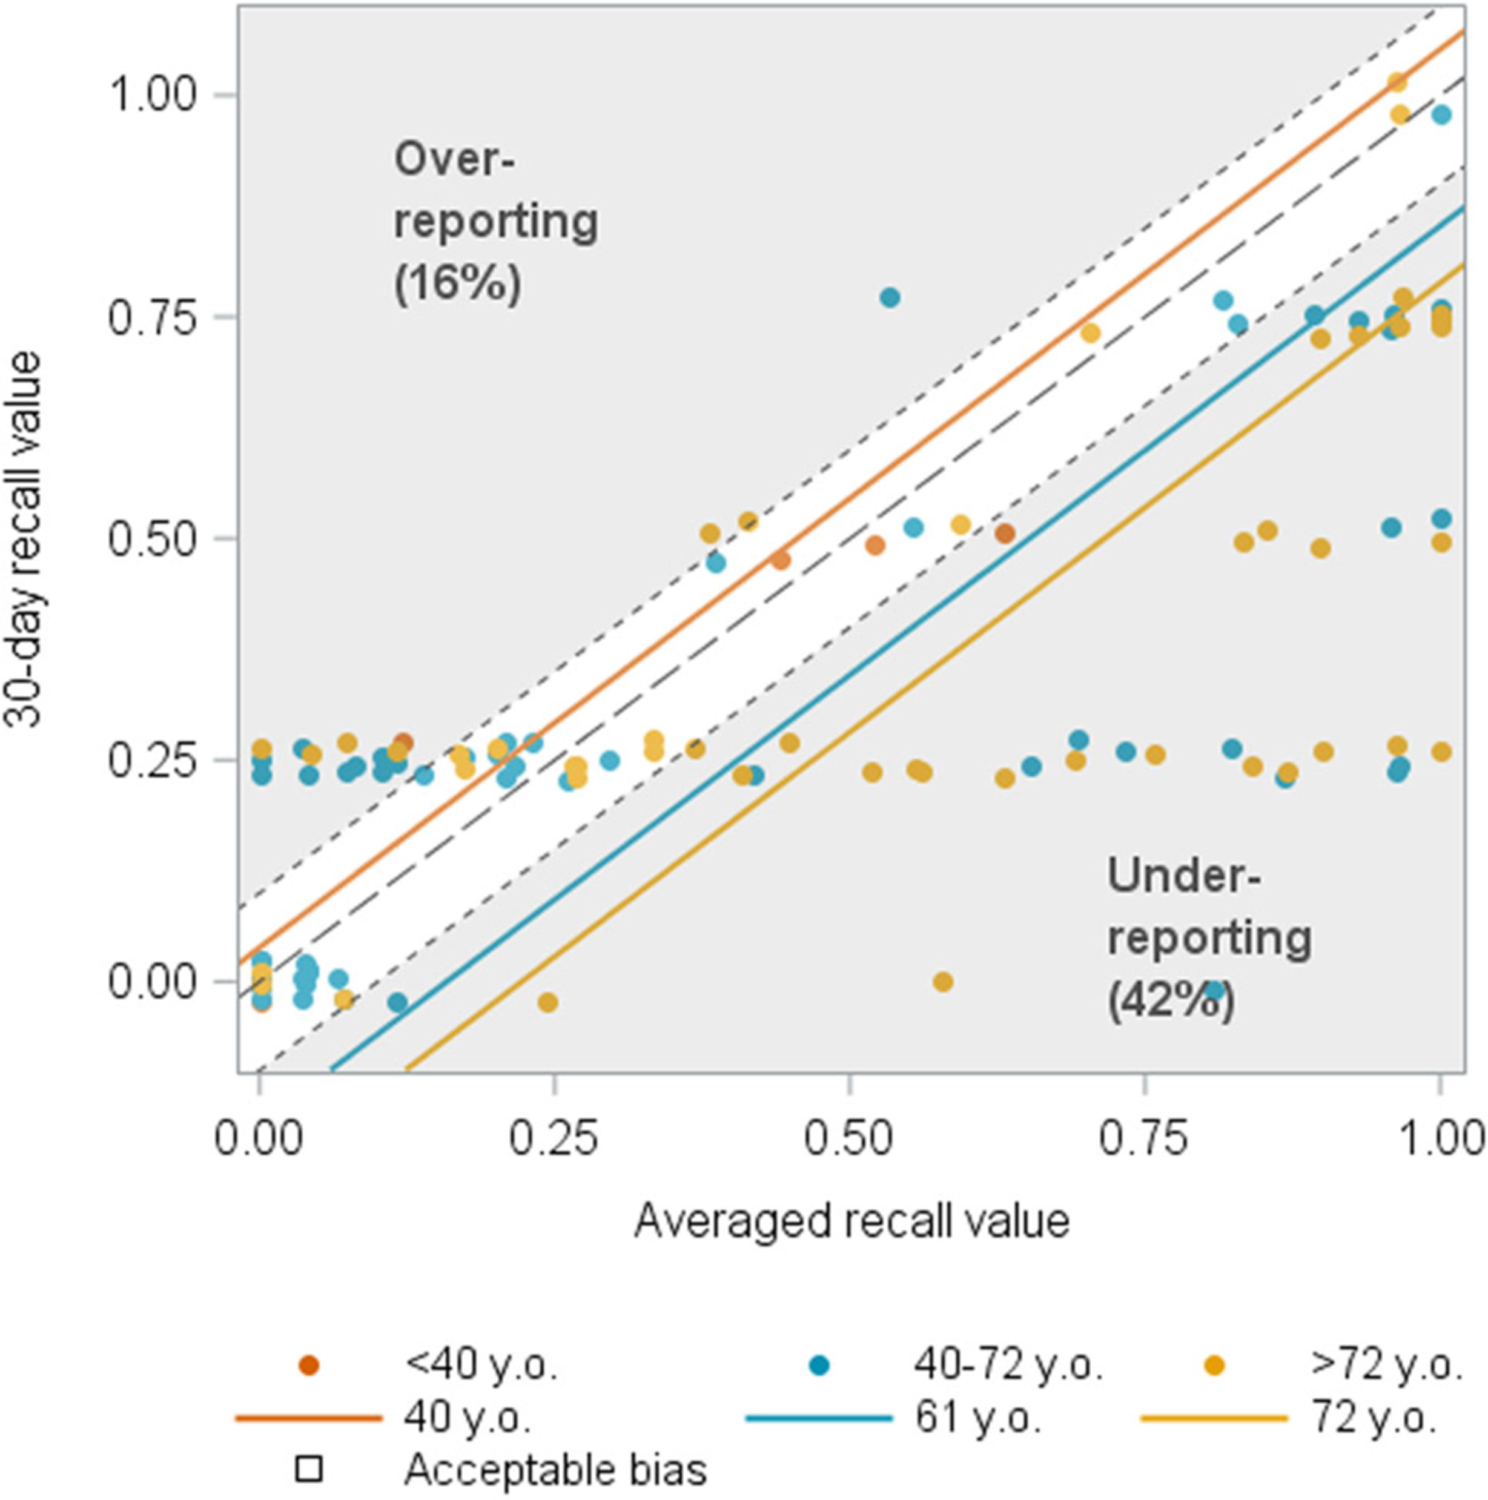
Age associated with recall of urgency incontinence among women (N = 110). The blue and yellow lines indicate the estimated mean averaged daily recall value for a given 30-day recall value for women aged 61 and 72 years old, respectively, and these fall in the lower right gray triangle, indicating underreporting. The presence of yellow and blue dots at all levels of severity in this lower right triangle indicates a sufficient number of participants in this age range with this behavior to support the conclusion that older age was associated with underreporting urgency incontinence.
No participant characteristics had a noteworthy effect on recall of daytime frequency (two items). For nocturia (how many times do you wake up and urinate), there was a statistically significant main effect, wherein men overreported nocturia compared to women, as well as a significant interaction effect, such that the overreporting was greater at higher severity levels (Figure 2). No characteristics had a noteworthy effect on recall for the other two nocturia items.
FIGURE 2.
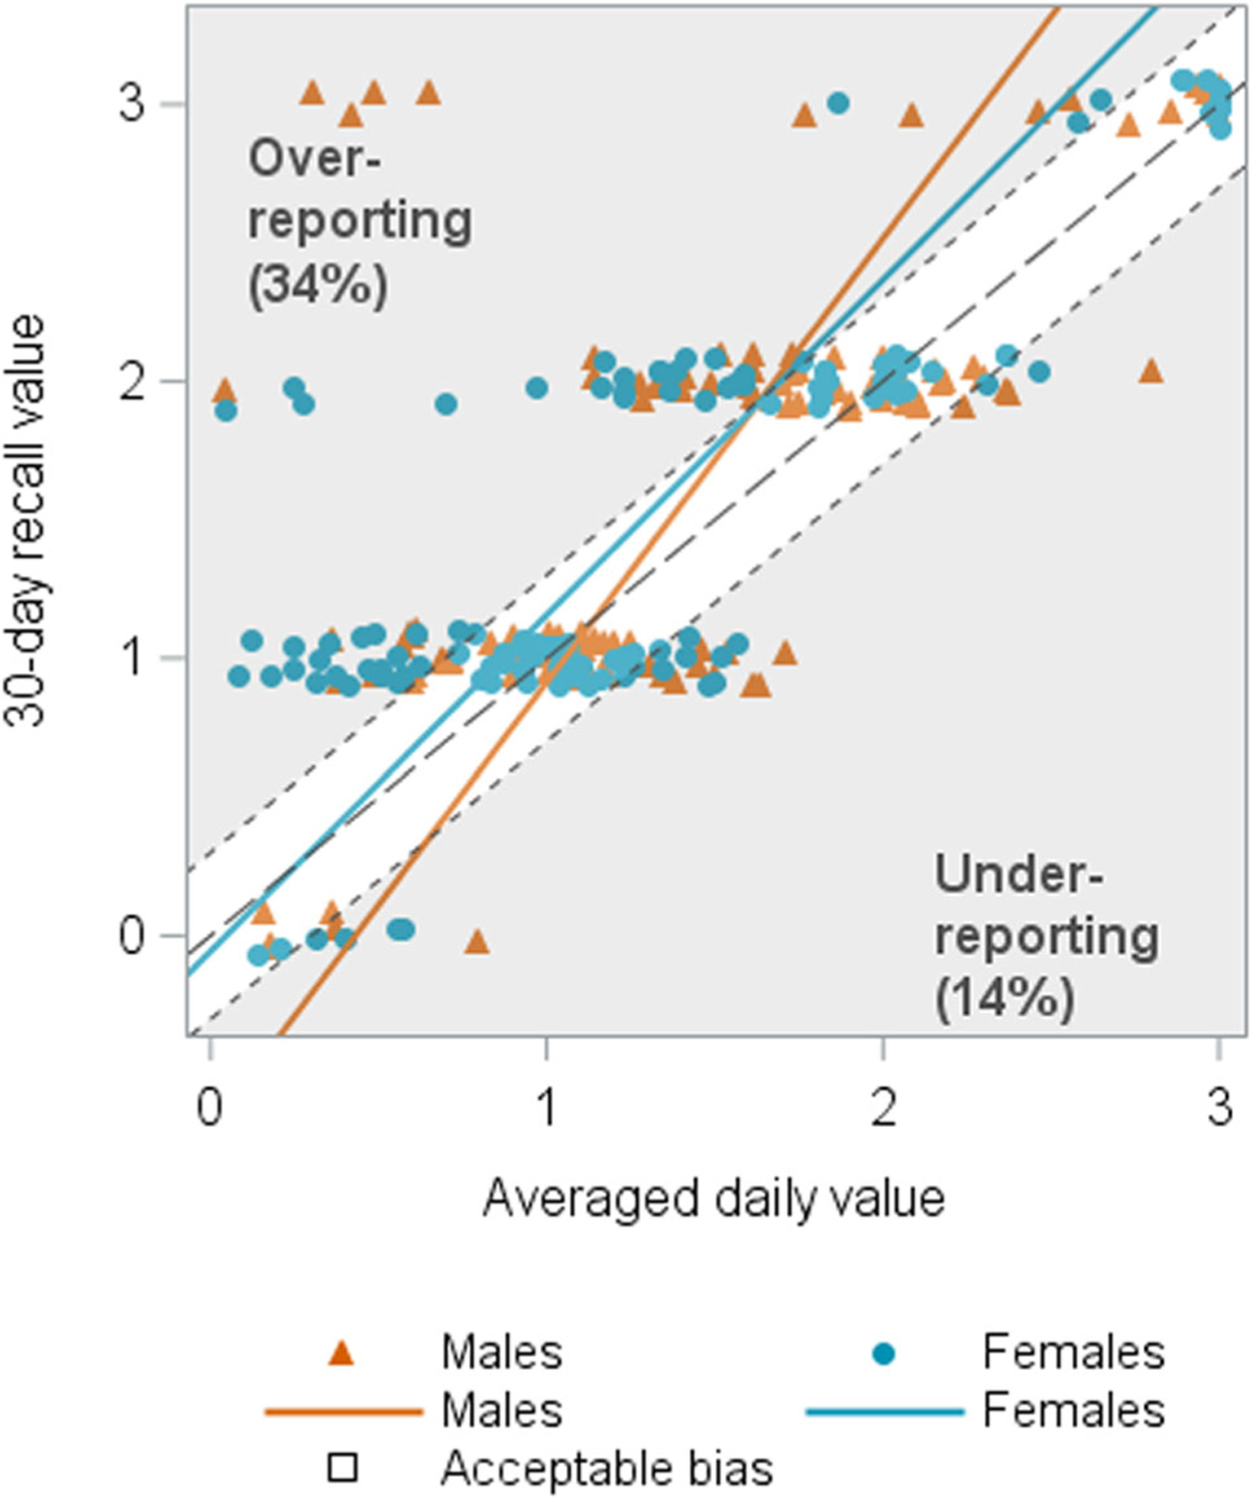
Sex associated with recall of nocturia (N = 243). The orange and blue lines represent the estimated mean averaged daily recall value for a given 30-day recall value for males and females, respectively. There was a statistically significant main effect, wherein men overreported nocturia compared to women, as well as a significant interaction effect, such that the overreporting was greater at higher severity levels (upper gray triangle).
For urgency (frequency of feeling a sudden need to urinate), four patient characteristics were associated with recall bias (Figure S3). Lower symptom bother was associated with overreporting of urgency among women, especially among those with higher symptom severity (S3a). Lower anxiety (S3b) and depression (S3c) were associated with overreporting of urgency among men and women. Finally, higher symptom variability was associated with overreporting of urgency (S3d).
Lower symptom bother was associated with overreporting of slow/weak stream among men and women (Figure 3). For incomplete emptying, no individual characteristics appeared to have a noteworthy effect on recall. For postmicturition dribble, lower symptom variability was associated with higher levels of overreporting among women (Figure S4a), although women with both low and high levels of symptom variability tended to overreport, while higher symptom variability only was associated with overreporting among men (Figure S4b). Of note, both men and women with highly variable symptoms who overreported postmicturition dribble tended to report more bother compared to those with less variable symptoms (100% vs 68% in men, 80% vs 53% in women).
FIGURE 3.
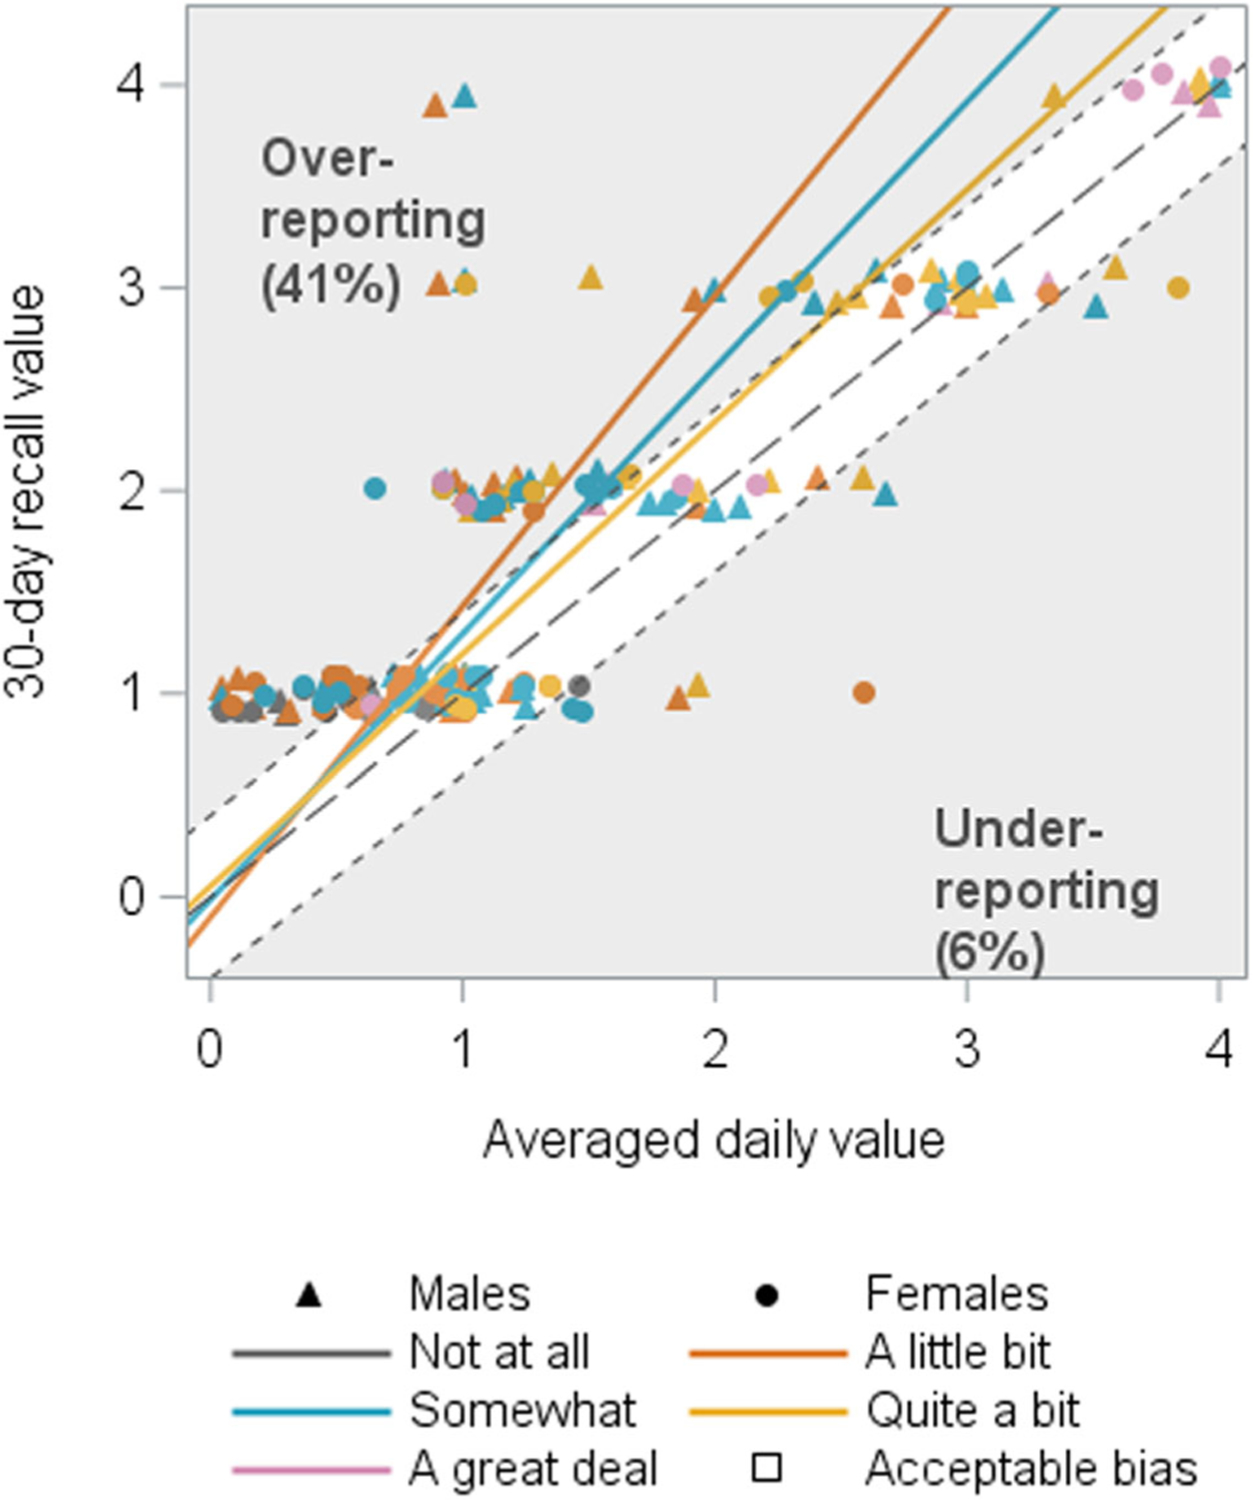
Symptom bother associated with recall of slow/weak stream (N = 188). The orange and blue lines represent the estimated mean averaged daily recall value for a given 30-day recall value for bother ratings of “a little bit” and “somewhat,” respectively, and fall in the upper gray triangle indicating overreporting by more than 10% on the 30-day recall questionnaire for lower bother ratings.
4 |. DISCUSSION
We previously demonstrated generally good agreement between 30-day recall of LUTS and average daily LUTS.10 However, some symptoms, despite being relatively unbiased on average, had higher proportions of individuals with recall bias; these included stress incontinence, urgency incontinence, nocturia, urgency, slow/weak stream, incomplete emptying, and postmicturition dribble. We tested 18 items covering 10 symptoms, of which nine items (50%) covering seven symptoms exhibited under- or overreporting for at least 25% of participants. For six items (33%) covering six symptoms, recall bias was associated with one or more personal characteristics in a noteworthy way, specifically with underreporting of incontinence and overreporting of other LUTS.
We had hypothesized that higher bother would be associated with overreporting of symptoms because of a previous study suggesting a relationship between bother and recall of incontinence among women. Kenton et al11 concluded that if recalled measures additionally reflect the impact of symptom bother, they “may be better outcomes than simple diary records” for clinical decision making. We detected a statistically significant relationship between bother and six different LUTS, but only two of them met our additional criteria for being noteworthy effects, and in the opposite direction than expected, with lower bother associated with more overreporting of urgency and slow/weak stream. Some possible explanations for these findings could be: (a) less attention paid to the frequency of symptoms by those who are not bothered by them; (b) there was not enough variability in bother to detect relationships; (c) there were high correlations between bother and symptom severity that meant little variability of symptom levels for any given level of bother; or (d) bother is not universally related to symptom recall.
For other LUTS, which were analyzed among men and women, the noteworthy associations with patient characteristics were with regard to overreporting. One previous study suggested overreporting of daytime frequency by women during medical histories compared to voiding diaries,21 whereas our study compared daily versus monthly reports. In our study, daytime frequency did not show significant recall bias, and there were no noteworthy associations between recall bias and patient characteristics. A previous study of men found overreporting of nocturia22; this was consistent with our finding that men were more likely to overreport nocturia than women.
Prior studies have demonstrated a relationship between recall bias and the variability of symptoms including anger, depression, fatigue,12 pain, thirst, irritability, and neuropathy.14 Stone et al13 found that higher variability in momentary pain assessments was strongly associated with overreporting pain in 7-day recall; they concluded that baseline differences in pain variability could mask changes in pain over time (such as in the evaluation of treatments). We found that symptom variability was associated with recall of two LUTS: urgency and postmicturition dribble. For the former, the direction was the same as in pain—higher symptom variability was associated with overreporting of urgency. For the latter, men with high symptom variability overreported dribble, while women with either high or low variability overreported dribble. Thus, for both urgency and dribble, studies that evaluate changes in these symptoms over time among patients with high symptom variability should consider using a shorter recall period.
Finally, for the few instances in which emotional distress was related to recall bias, more distress was associated with less bias; men and women without anxiety and depression overreported urgency, while women without anxiety underreported urgency incontinence and stress incontinence. One hypothesis is that anxiety sensitivity prompts higher levels of bodily awareness,23 leading to more accurate recall of LUTS. A limitation of our study in more fully exploring the relationship between anxiety, depression, and LUTS is that it only assessed anxiety or depression at the end of the study, in conjunction with the 30-day recall assessment of LUTS. A future study could use ecological momentary assessment to assess both emotional distress symptoms and LUTS to better understand these relationships.
To the best of our knowledge, this was the first and largest study to examine whether patient demographic and psychosocial characteristics are related to accuracy of LUTS recall for women and men across a variety of LUTS. As such, our results require replication in other populations and settings.
A limitation of the study is the sample of generally well-educated, English-speaking, specialty care-seeking participants, which does not represent all people with LUTS. Nevertheless, the sample was sufficiently diverse with respect to sex, age, and symptoms, with minimal dropout over the study. Another limitation was the lack of extant standards for interpreting degrees of recall bias in terms of severity. We chose a threshold of 10% for interpretation, but future research should explore the ramifications of bias of varying magnitudes on study outcomes. Finally, it is possible that providing daily reports makes daily experiences more memorable and thus easier to recall at later times. Due to this, the assessment of recall accuracy for 30-day reports should be considered an upper bound.
5 |. CONCLUSIONS
The accuracy of patient’s reports of their symptom experience is an important consideration for research and clinical decision making. We previously demonstrated that most patients’ 7- and 30-day recall of their symptoms are relatively accurate.10 In this paper, we sought to identify patient characteristics that might be associated with recall bias. Overall, our findings suggest that there are few reliable cues for detecting which patients are more likely to report inaccurately. Furthermore, some cues (eg, less bother and lower anxiety) were related to recall bias in an unexpected direction. Thus, providers should exercise caution when making judgments about the accuracy of a patient’s symptom recall based on patient demographic and psychosocial characteristics. These results may help researchers and clinicians assess the likelihood and direction of recall bias for 30-day recall settings, and they may have implications for other urologic conditions that rely on patient self-report.
Supplementary Material
ACKNOWLEDGMENTS
This study is supported by the National Institute of Diabetes and Digestive and Kidney Diseases through cooperative agreements (Grant nos. DK097780, DK097772, DK097779, DK099932, DK100011, DK100017, and DK099879), and also by the Northwestern University, in part, by the National Institutes of Health’s National Center for Advancing Translational Sciences, Grant no. UL1TR001422. The content is solely the responsibility of the authors and does not necessarily represent the official views of the National Institutes of Health.
Duke University, Durham, North Carolina (DK097780): PIs: Cindy Amundsen, MD, Eric Jelovsek, MD; Co-Is: Kathryn Flynn, PhD, Matthew O. Fraser, PhD, Todd Harshbarger, PhD, Aaron Lentz, MD, Nazema Siddiqui, MD, Jim Hokanson, PhD, Kevin Weinfurt, PhD Lisa Wruck, PhD; Study Coordinators: Yasmeen Bruton, Folayan Morehead, Nortorious Coleman-Taylor.
University of Iowa, Iowa City, IA (DK097772): PIs: Karl Kreder, MD, MBA, Catherine S Bradley, MD, MSCE; Co-Is: Bradley A. Erickson, MD, MS, Vince Magnotta, PhD, Daniel Fick, MD, Philip Polgreen, MD, MPH; Study Coordinators: Mary Eno, Stacy McMichael.
Northwestern University, Chicago, IL (DK097779): PIs: James W Griffith, PhD, Kimberly Kenton, MD, MS, Brian Helfand, MD, PhD; Co-Is: David Cella, PhD, Christina Lewicky-Gaupp, MD, Margaret Mueller, MD, Alex Glaser, MD, Carol Bretschneider, MD, Sarah Collins, MD, Julia Geynisman-Tan, MD; Study Coordinators: Michelle Taddeo, Meera Tavathia, Pooja Talaty, Sylwia Boroska, Melissa Marquez, Pooja Sharma. Dr. Helfand and Ms. Talaty are at NorthShore University HealthSystem.
University of Michigan Health System, Ann Arbor, MI (DK099932): PI: J Quentin Clemens, MD, FACS, MSCI; Co-Is: John DeLancey, MD, Dee Fenner, MD, Rick Harris, MD, Steve Harte, PhD, Anne P. Cameron, MD, Aruna Sarma, PhD; Study Coordinators: Linda Drnek, Greg Mowatt, Julie Tumbarello.
University of Washington, Seattle Washington (DK100011): PI: Claire Yang, MD; Co-I: Anna Kirby, MD; Study Coordinators: Alice Liu, MPH, Brenda Vicars, RN.
Washington University in St. Louis, St. Louis Missouri (DK100017): PI: H. Henry Lai, MD; Co-Is: Gerald L. Andriole, MD, Joshua Shimony, MD, PhD; Study Coordinators: Aleksandra Klim, RN, MHS, CCRC, Linda Black, Patricia Hayden.
Arbor Research Collaborative for Health, Data Coordinating Center (DK099879): PI: Robert Merion, MD, FACS; Co-Is: Abigail Smith, PhD, Victor Andreev, PhD, DSc, Brenda Gillespie, PhD; Project Manager: Melissa Fava, MPA, PMP; Clinical Monitor: Melissa Sexton, BA, CCRP; Research Analysts: Margaret Helmuth, MA, Jon Wiseman, MS, Jane Liu, MPH.
National Institute of Diabetes and Digestive and Kidney Diseases, Division of Kidney, Urology, and Hematology, Bethesda, MD: Project Scientist: Ziya Kirkali MD; Project Officer: Christopher Mullins PhD; NIH Personnel: Tamara Bavendam, MD, Robert Star, MD, Jenna Norton, MPH.
Funding information
National Institute of Diabetes and Digestive and Kidney Diseases, Grant/Award Numbers: DK097772, DK097779, DK097780, DK099879, DK099932, DK100011, DK100017; National Institutes of Health’s National Center for Advancing Translational Sciences, Grant/Award Number: UL1TR001422
Abbreviations:
- CASUS
Comprehensive Assessment of Self-Reported Urinary Symptoms
- ICIQ-LUTS
International Consultation on Incontinence Modular Questionnaire
- LURN
Symptoms of Lower Urinary Tract Dysfunction Research Network
- LUTS
lower urinary tract symptoms
- NIDDK
National Institute of Diabetes and Digestive and Kidney Diseases
- PANAS
Positive and Negative Affect Schedule
- PROMs
Patient-Reported Outcome Measures
Footnotes
SUPPORTING INFORMATION
Additional supporting information may be found online in the Supporting Information section.
REFERENCES
- 1.Wein AJ, Kavoussi LR, Novick AC, Partin AW, Peters CA. Campbell-Walsh Urology Ninth Edition Review. Philadelphia, PA: WB Saunders Company; 2007. ISBN-13: 978-1437723939, ISBN-10: 1437723934. [Google Scholar]
- 2.Norquist JM, Girman C, Fehnel S, DeMuro-Mercon C, Santanello N. Choice of recall period for patient-reported outcome (PRO) measures: criteria for consideration. Qual Life Res. 2012;21(6):1013–1020. [DOI] [PubMed] [Google Scholar]
- 3.Barry MJ, Fowler FJ Jr., O’Leary MP, et al. The American Urological Association symptom index for benign prostatic hyperplasia. The Measurement Committee of the American Urological Association. J Urol. 1992;148(5):1549–1557. [DOI] [PubMed] [Google Scholar]
- 4.Abrams P, Avery K, Gardener N, Donovan J, Board IA. The International Consultation on Incontinence Modular Questionnaire. J Urol. 2006;175(3 pt 1):1063–1066. [DOI] [PubMed] [Google Scholar]
- 5.Avery K, Donovan J, Peters TJ, Shaw C, Gotoh M, Abrams P. ICIQ: a brief and robust measure for evaluating the symptoms and impact of urinary incontinence. Neurourol Urodyn. 2004; 23(4):322–330. [DOI] [PubMed] [Google Scholar]
- 6.Coyne K, Revicki D, Hunt T, et al. Psychometric validation of an overactive bladder symptom and health-related quality of life questionnaire: the OAB-q. Qual Life Res. 2002;11(6):563–574. [DOI] [PubMed] [Google Scholar]
- 7.Yang CC, Weinfurt KP, Merion RM, Kirkali Z, Group LS. Symptoms of lower urinary tract dysfunction research network. J Urol. 2016;196(1):146–152. [DOI] [PMC free article] [PubMed] [Google Scholar]
- 8.Weinfurt KP, Griffith JW, Flynn KE, et al. The comprehensive assessment of self-reported urinary symptoms: a new tool for research on subtypes of patients with lower urinary tract symptoms. J Urol. 2019;201:1177–1183. [DOI] [PMC free article] [PubMed] [Google Scholar]
- 9.Griffith JW, Messersmith EE, Gillespie BW, et al. Reasons for seeking clinical care for lower urinary tract symptoms: a mixed methods study. J Urol. 2018;199(2):528–535. [DOI] [PMC free article] [PubMed] [Google Scholar]
- 10.Flynn KE, Mansfield SA, Smith AR, et al. Can 7- or 30-day recall questions capture self-reported lower urinary tract symptoms accurately? J Urol. 2019;202:770–778. [DOI] [PMC free article] [PubMed] [Google Scholar]
- 11.Kenton K, FitzGerald MP, Brubaker L. What is a clinician to do—believe the patient or her urinary diary? J Urol. 2006;176(2): 633–635. [DOI] [PubMed] [Google Scholar]
- 12.Schneider S, Broderick JE, Junghaenel DU, Schwartz JE, Stone AA. Temporal trends in symptom experience predict the accuracy of recall PROs. J Psychosom Res. 2013;75(2):160–166. [DOI] [PMC free article] [PubMed] [Google Scholar]
- 13.Stone AA, Schwartz JE, Broderick JE, Shiffman SS. Variability of momentary pain predicts recall of weekly pain: a consequence of the peak (or salience) memory heuristic. Pers Soc Psychol Bull. 2005;31(10):1340–1346. [DOI] [PubMed] [Google Scholar]
- 14.Bennett AV, Patrick DL, Bushnell DM, Chiou CF, Diehr P. Comparison of 7-day and repeated 24-h recall of type 2 diabetes. Qual Life Res. 2011;20(5):769–777. [DOI] [PubMed] [Google Scholar]
- 15.Bellini M, Bove A, Sormani MP, et al. The daily diary and the questionnaire are not equivalent for the evaluation of bowel habits. Dig Liver Dis. 2010;42(2):99–102. [DOI] [PubMed] [Google Scholar]
- 16.Weinfurt KP, Lin L, Dombeck CB, et al. Accuracy of 30-day recall for components of sexual function and the moderating effects of gender and mood. Journal of Sexual Medicine. 2013;11:678–696. [DOI] [PMC free article] [PubMed] [Google Scholar]
- 17.Watson D, Clark LA, Tellegen A. Development and validation of brief measures of positive and negative affect: the PANAS scales. J Pers Soc Psychol. 1988;54(6):1063–1070. [DOI] [PubMed] [Google Scholar]
- 18.Crawford JR, Henry JD. The positive and negative affect schedule (PANAS): construct validity, measurement properties and normative data in a large non-clinical sample. Br J Clin Psychol. 2004;43(pt 3):245–265. [DOI] [PubMed] [Google Scholar]
- 19.Pilkonis PA, Choi SW, Reise SP, et al. Item banks for measuring emotional distress from the Patient-reported outcomes measurement information system (PROMIS(R)): depression, anxiety, and anger. Assessment. 2011;18(3):263–283. [DOI] [PMC free article] [PubMed] [Google Scholar]
- 20.Evans M, Hastings N, Peacock B. Bernoulli distribution. Statistical Distributions. 3rd ed. New York, NY: Wiley; 2000:31–33. [Google Scholar]
- 21.Stav K, Dwyer PL, Rosamilia A. Women overestimate daytime urinary frequency: the importance of the bladder diary. J Urol. 2009;181(5):2176–2180. [DOI] [PubMed] [Google Scholar]
- 22.Yap TL, Cromwell DA, Brown C, Van der Meulen J, Emberton M. The relationship between objective frequency–volume chart data and the I-PSS in men with lower urinary tract symptoms. Eur Urol. 2007;52(3):811–818. [DOI] [PubMed] [Google Scholar]
- 23.Boswell JF, Farchione TJ, Sauer-Zavala S, Murray HW, Fortune MR, Barlow DH. Anxiety sensitivity and interoceptive exposure: a transdiagnostic construct and change strategy. Behav Ther. 2013;44(3):417–431. [DOI] [PMC free article] [PubMed] [Google Scholar]
Associated Data
This section collects any data citations, data availability statements, or supplementary materials included in this article.