



Abstract
MicroRNA miR-138, which is highly expressed in neurons, represses herpes simplex virus 1 (HSV-1) lytic-cycle genes by targeting viral ICP0 mRNA, thereby promoting viral latency in mice. We found that overexpressed miR-138 also represses lytic processes independently of ICP0 in murine and human neuronal cells, therefore we investigated whether miR-138 has targets besides ICP0. Using genome-wide RNAseq/PAR-CLIP followed by siRNA knockdown of candidate targets, we identified host transcription factors Oct-1 and Foxc1 as targets of miR-138 that are important for HSV-1 replication in neuronal cells. Oct-1 has a known role in initiation of HSV transcription. Overexpression of Foxc1, which was not known to affect HSV-1, promoted HSV-1 replication in murine neurons and ganglia. CRISPR/Cas9 knockout of Foxc1 reduced viral replication, lytic gene expression, and miR-138 repression in murine neuronal cells. Foxc1 also collaborated with ICP0 to decrease heterochromatin on viral genes and compensated for the defect of an ICP0-null virus. In summary, miR-138 targets ICP0, Oct-1 and Foxc1 to repress HSV-1 lytic-cycle genes and promote epigenetic gene silencing, which together enable favourable conditions for latent infection.
Introduction
MicroRNAs (miRNAs) are post-transcriptional regulators of gene expression in eukaryotic cells. In post-embryonic metazoan cells, miRNAs act mainly by reducing target mRNA levels via Argonaute (Ago) proteins, thereby extending and reinforcing gene regulatory patterns specified by transcriptional regulation1,2. Virus- and host-encoded miRNAs can also regulate virus infection by targeting individual viral mRNAs, regulating individual host factors or modulating the host’s immune response network3–6.
One interesting example of miRNA regulation of virus infection is regulation of herpes simplex virus 1 (HSV-1) latency, where repression of lytic (productive) infection benefits the virus. Following lytic infection in peripheral tissues, HSV-1 establishes lifelong latent infection in sensory neurons, thereby evading immune clearance. HSV-1 can reactivate from latency, permitting spread to new hosts7. During lytic infection, viral gene expression proceeds in an ordered cascade. After the viral genome enters the nucleus, the virion-delivered VP16 protein complexes with cellular proteins HCF-1 and Oct-18,9. This complex assembles on sequences in immediate-early (IE) promoters to recruit factors that drive IE gene transcription. Most IE gene products promote the expression of subsequent classes of viral genes—early (E) and late (L)—with the IE protein ICP0 also providing a positive feedback loop to induce enhanced expression of all classes of genes through its ubiquitin ligase activity7,10. These gene activation events coincide with the removal of histones associating with incoming viral genomes, the loss of heterochromatin modifications, and the gain of euchromatin modifications11–14. During establishment of latency, lytic promoters become increasingly associated with histones enriched for heterochromatin modifications15–19. When latency is fully established, lytic genes are largely silenced, with the only abundant viral gene products being the latency-associated transcripts7 and some viral miRNAs20,21. Upon reactivation, an early stage of de-repression independent of viral proteins is followed by a later stage that produces infectious viral particles through actions of viral proteins including VP1622–25.
Besides transcriptional regulation, a neuron-specific host miRNA, miR-138, represses ICP0 expression, by binding to two sites in the ICP0 3’ untranslated region (UTR)26. Mutations in these sites increase lytic gene expression in mouse neuronal cells and ganglia, and increase mouse mortality, indicating that miR-138 promotes latency by repressing ICP0. However the effects of this miRNA:mRNA interaction are limited, which has contributed to a debate on whether host miRNAs contribute to repression of viral replication3–6,27. To address this issue, we investigated whether miR-138 had additional targets that regulate HSV-1 infection.
Results
miR-138 represses HSV-1 replication independent of ICP0.
To investigate the effects of miR-138 on HSV-1 replication, we transfected Neuro-2a cells (mouse brain neuroblastoma cells) with miRNA mimics before infection with one of three viruses: WT-BAC virus28 (designated WT here), M138 virus26, which has mutations in the miR-138 binding sites in ICP0 mRNA (Fig. 1a), and ICP0-null mutant virus 713429. We used three control miRNA mimics: a scrambled sequence, miR-M138, and miR-M138b (Fig 1a). miR-M138 contains mutations complementing the M138 mutations in ICP0 mRNA whereas miR-M138b contains a mutant seed region complementary to neither WT ICP0 nor M138 ICP0. Consistent with previous results26, WT and M138 virus yields were similar after transfection with scrambled and miR-M138b controls (Fig. 1b). The viruses did not differ significantly for any effects on expression of miR-138 (Extended Data Fig. 1a). While transfected miR-138 reduced WT virus yields by almost 10-fold compared to the three controls, it also reduced M138 virus yields by ~4-fold compared to scrambled and miR-M138b controls at 48 h postinfection (hpi) (Fig. 1b). The effects on WT virus can be partially attributed to miR-138’s activity against ICP0 because the fold change caused by miR-138 in multiple replicate experiments was on average ~2-fold higher for WT than M138 virus (Extended Data Fig. 1b). Also, miR-M138, which should target the ICP0 of M138 virus due to the compensatory mutations, suppressed M138 virus replication by ~2-fold (Fig. 1b). However, ICP0-independent suppression contributed more (4- to 5-fold) as estimated from the impact of miR-138 on M138 virus. Moreover, transfected miR-138 reduced ICP0-null virus yields in Neuro-2a cells (Fig. 1c). Furthermore, transduction of human neurons derived from induced pluripotent stem cells (iPSCs) with a lentivirus expressing miR-138 significantly reduced replication of both WT and M138 viruses relative to a control lentivirus, with WT virus showing a greater reduction (Fig. 1d). However, in 293T (human embryonic kidney) cells transfected miR-138 more modestly suppressed replication of WT, M138 and ICP0-null viruses (Extended Data Fig. 1c), and in Vero cells transfected miR-138 had little effect on WT and M138 virus (Extended Data Fig. 1d). Overall, we observed cell-type specific effects of miR-138 on HSV-1 replication that were both ICP0-dependent and independent, with greater effects in neuronal cells.
Fig. 1. ICP0 independent suppression of viral replication by miR-138 in Neuro-2a cells.
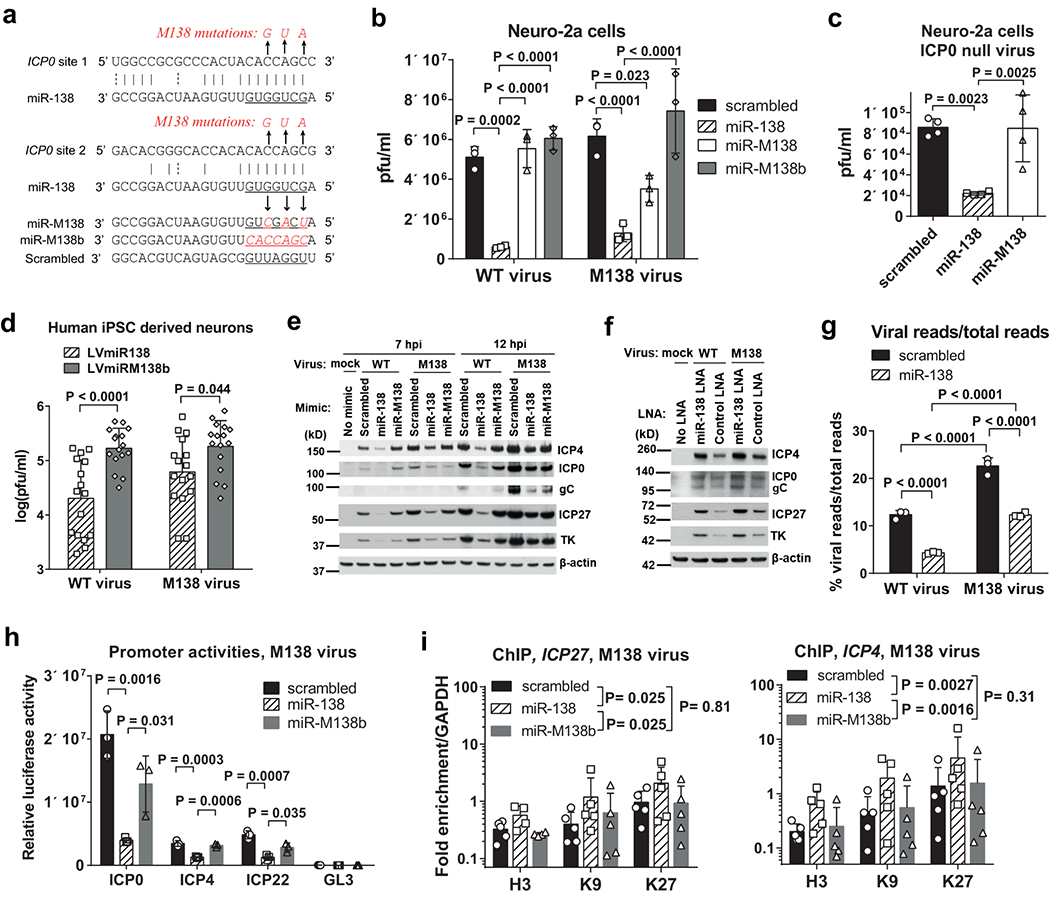
a, Sequences of miR-138, its target sites in the ICP0 3’ UTR, the M138 mutations, and synthetic miRNA mimics. Underlined are seed regions. Arrows point to nucleotide substitutions. b, Neuro-2a cells were transfected with 10 nM miRNA mimic for 16 h, then infected at a multiplicity of infection (MOI) of 1 for 48 h before viral titer measurements. c, Same as b, except that 40 nM miRNA mimic was transfected and cells were infected with 7134 virus (MOI = 5). d, Human neurons differentiated from iPSCs were transduced with a lentivirus expressing miR-138 (LVmiR138) or one with the miR-138 seed region mutated to that of miR-M138b (LVmiRM138b), then infected with WT or M138 virus (MOI of 1) for 48 h before viral titer measurements. Data were combined from 4 independent replicate experiments, each with 4 biologically independent samples per condition (The data from each experiment were first normalized to the value from the LVmiRM138b-WT virus group before being combined), so n = 16 biologically independent samples per condition. e, Neuro-2a cells were transfected with 40 nM miRNA mimic for 16 h, then infected (MOI = 5) for 7 or 12 h before Western blot analysis. This experiment was repeated once with similar results. f, Neuro-2a cells were transfected with 40 nM LNA for 8 h, then infected (MOI = 3) for 16 h before Western blot analysis. This experiment was repeated three times with similar results. g, Neuro-2a cells were transfected with 40 nM miRNA mimic for 24 h, then infected (MOI = 10) for 16 h before RNAseq analysis. h, Neuro-2a cells were co-transfected with 100 ng/ml luciferase plasmid and 16 nM miRNA mimic for 24 h, then infected (MOI = 1) with M138 virus for 6 h before measurements of luciferase activity. i, Neuro-2a cells were transfected with 60 nM miRNA mimic for 24 h, then infected with M138 virus (MOI = 5) for 6 h before ChIP-qPCR analysis of total histone H3 (H3), H3K9me3 (K9) and H3K27me3 (K27) at ICP27 and ICP4 promoters. Log transformations of means from each of 2 experiments (a total of 5 biologically independent samples) were analyzed by two-way repeated measures ANOVA with Holm-Sidak’s multiple comparisons tests for main effects of the miRNA treatment factor. For other panels, n = 3 (b, g, h) or 4 (c) biologically independent samples per condition and data were analyzed by one-way (c, h) or two-way (b, g) ANOVA with Bonferroni’s multiple comparisons tests. Data are presented as mean values ± standard deviations (S.D.).
miR-138 regulates viral gene expression and chromatin.
To determine effects on gene expression, we conducted Western blot analyses after transfection-infection of Neuro-2a cells. In WT-infected cells, transfected miR-138 reduced expression of all viral proteins analyzed at 7 and/or 12 hpi compared to scrambled and miR-M138 controls (Fig. 1e). In M138 virus-infected cells, these proteins were also reduced by miR-138 compared to the scrambled control, indicating ICP0-independent repression. Relative to the scrambled control, miR-M138 also reduced protein expression from M138 virus, presumably by miR-M138 targeting of mutant ICP0 mRNA. Importantly, a locked nucleic acid (LNA) inhibitor of miR-138 increased protein expression from both WT and M138 viruses at 16 hpi relative to a negative LNA control (Fig. 1f).
We next performed RNAseq on Neuro-2a cells that had been transfected with miRNA mimics and infected with WT or M138 virus for 16 h. We observed ~2-fold higher ratios of viral reads/total reads in M138-infected relative to WT-infected cells following transfection with the scrambled mimic, which we ascribe to loss of repression of ICP0 by endogenous miR-138. Relative to the scrambled control, transfected miR-138 reduced the ratios of viral reads/total reads for both WT (~2.8-fold) and M138 (~1.8-fold) viruses (Fig. 1g). Therefore, ICP0-dependent and independent mechanisms contributed ~1.5 (2.8/1.8) and ~1.8-fold repression, respectively. The average read numbers for each viral transcript decreased upon miR-138 transfection by 2.3–3.6-fold for WT and 1.5–2.3-fold for M138 virus (Extended Data Fig. 2) with no transcripts being particularly affected.
Given these global effects, we tested effects of miR-138 on virus gene transcription by co-transfecting Neuro-2a cells with a miRNA mimic and one of three plasmids with an IE promoter of ICP0, ICP4 or ICP22 gene driving luciferase expression before infection with M138 virus for 6 h. The luciferase activities, which were dramatically induced following infection, were reduced by transfected miR-138 (Fig. 1h). We then examined whether miR-138 affects viral chromatin status. After transfection with miRNA mimics, we infected Neuro-2a cells with M138 virus for 6 h before chromatin immunoprecipitation (ChIP). Compared to both scrambled and miR-M138b controls, transfected miR-138 increased association of total histone H3, as well as H3K9me3 and H3K27me3 modifications with ICP27 and ICP4 promoters (Fig. 1i). Together, miR-138 globally represses lytic gene expression, independent of ICP0, at least in part by a mechanism that increases heterochromatin on viral genes.
miR-138 reduces lytic gene expression in murine ganglia.
To investigate this repression in vivo, we used a previously described virus, WTLyt138, here named WTmiR138,with miR-138-expressing sequences inserted between US11 and US12 coding regions in WT virus30. We also constructed a virus with the same insertion in the M138 background, designated M138miR138 (Fig. 2a). Control viruses with the same insertion but a mutated seed region were also constructed and designated WTnomiR-138 or M138nomiR138. Northern blot hybridization showed no detectable expression of the mutated miRNA (Extended Data Fig. 3a). We also restored the WT seed sequence to these nomiR138 viruses to result in a second pair of independently constructed miR-138 expressing viruses named WTmiR138R or M138miR138R. All six recombinant viruses expressed WT levels of US11 or US12 mRNA in Vero cells (Extended Data Fig. 3b). All four miR-138 expressing viruses significantly increased miR-138 levels in both Neuro-2a and 293T cells (Fig. 2b; Extended Data Fig. 3c).
Fig. 2. miR-138 reduces viral gene expression in acutely infected mouse TG.

a, Genomic location of inserted miR-138 expressing sequences. The HSV-1 genome is depicted as a horizontal line at the top with long (TRL and IRL) and short (IRS and TRS) repeat sequences shown as gray boxes. Below, the insertion location is expanded, with bars representing CDS and arrows representing mRNAs. The inserted sequences are further expanded to show miR-138 and miR-M138b sequences (seed regions underlined) that correspond to the recombinant viruses shown to the left. The order of virus derivation is indicated by arrows connecting the virus names. b, miR-138 expression (relative to let-7a expression) from Neuro-2a cells infected by the indicated recombinant viruses (8 hpi, MOI = 10) as measured by qRT-PCR. n = 3 biologically independent samples per condition. Data are presented as mean values ± S.D. c, Viral titers in eye swabs at 1 dpi following corneal inoculation of mice with 2 x 10⁵ pfu/eye of the indicated viruses. d, Viral transcript levels (as measured by qRT-PCR) normalized to viral genome levels (as determined by qPCR) in TG at 5 dpi with the indicated viruses. For c and d, each point represents a value from one mouse (c) or TG (d), the horizontal lines represent the geometric means, and the numbers of mice used (n) are displayed above the horizontal axies. For b, c and d, data were analyzed by one-way ANOVA with Bonferroni’s multiple comparisons.
We next infected mice with these viruses at the cornea. Pairwise comparisons showed similar viral genome levels but significantly decreased lytic transcript (ICP0, TK and gC) levels from the miR-138 expressing viruses (WTmiR138 and WTmiR138R) relative to the control virus (WTnomiR138) in trigeminal ganglia (TG) at 5 days postinfection (dpi) (Extended Data Fig. 4a, b). We next examined the M138-derived viruses to assess whether the effects depended on ICP0. The three viruses showed similar eye swab titers at 1 dpi (Fig. 2c). At 5 dpi, the two miR-138 expressing viruses, M138miR138 and M138miR138R both showed lower levels of ICP0, TK and gC transcripts (normalized to genome levels) than the control virus, M138nomiR138, with all but one of the differences being statistically significant (Fig. 2d and Extended Data Fig. 4c). Thus, ectopically expressed miR-138 can repress viral gene expression independent of ICP0 in acutely infected mouse ganglia.
ICP0 is the only confirmed HSV-1 target of miR-138.
To understand the ICP0-independent repression, we first looked for other viral targets by photoactivatable ribonucleoside-enhanced crosslinking and immunoprecipitation (PAR-CLIP). We constructed 293T138 and 293Tcontrol cells by transducing 293T cells with miR-138 expressing and empty lentiviruses, respectively. 293T138 cells expressed 500-fold more miR-138 than 293Tcontrol cells (Extended Data Fig. 5a). Following a PAR-CLIP experiment that compared 293T138 and 293Tcontrol cells (Extended Data Fig. 5b), we found >100-fold more miR-138 reads in Ago immunoprecipitates from 293T138 than 293Tcontrol cells at both 4 and 8 hpi (Extended Data Fig. 5c). Of 22 viral mRNA sequences complementary to the miR-138 seed sequence (GCUGGUG), besides the two sites in the ICP0 3’UTR, only one site in the UL39 coding sequence (CDS) fulfilled our criteria (>20 reads in 293T138 cells, and >2-fold more reads in 293T138 than 293Tcontrol cells) at one or both of the time points (Extended Data Fig. 5c). However, transfected miR-138, which decreased ICP0 expression from an ICP0-expressing plasmid, did not decrease UL39 expression from a UL39-expressing plasmid (Extended Data Fig. 5d). Thus, ICP0 mRNA was the only viral target of miR-138 that we could confirm.
Identification of Oct-1 and Foxc1 as targets of miR-138.
We next searched for host targets of miR-138. Human transcripts were analyzed using the above PAR-CLIP data from 293Tcontrol and 293T138 cells that had been infected for 4 h. To identify host targets in neuronal cells, we derived N2A138 cells from Neuro-2a cells that expressed 5-fold more miR-138 than Neuro-2a cells using the same method as for 293T138 cells (Extended Data Fig. 5e). Considering the high endogenous expression of miR-138 in Neuro-2a cells, we also constructed N2Aanti138 cells using lentivirus expressing “Tough Decoy” antisense sequences (Extended Data Fig. 5f)31. We then performed a PAR-CLIP experiment comparing uninfected N2A138 and N2Aanti138 cells. In the PAR-CLIP data, miR-138 reads were ~5-fold higher in N2A138 than N2Aanti138 cells (Extended Data Fig. 5g). For PAR-CLIP data from cell lines derived from both 293T and Neuro-2a cells, counts of canonical seed-matching reads aligned to the 5’ UTR, CDS and 3’ UTR of each transcript were calculated separately. After applying criteria for both read counts and fold differences (Fig. 3a), we identified 5, 176, and 121 transcripts with sites in 5’ UTRs, CDS, and 3’ UTRs, respectively, in 293T cells, and 4, 200, and 111 transcripts with sites in these regions, respectively, in Neuro-2a cells (Fig. 3b).
Fig. 3. Host targets of miR-138 identified using PAR-CLIP/RNAseq/siRNA screening.
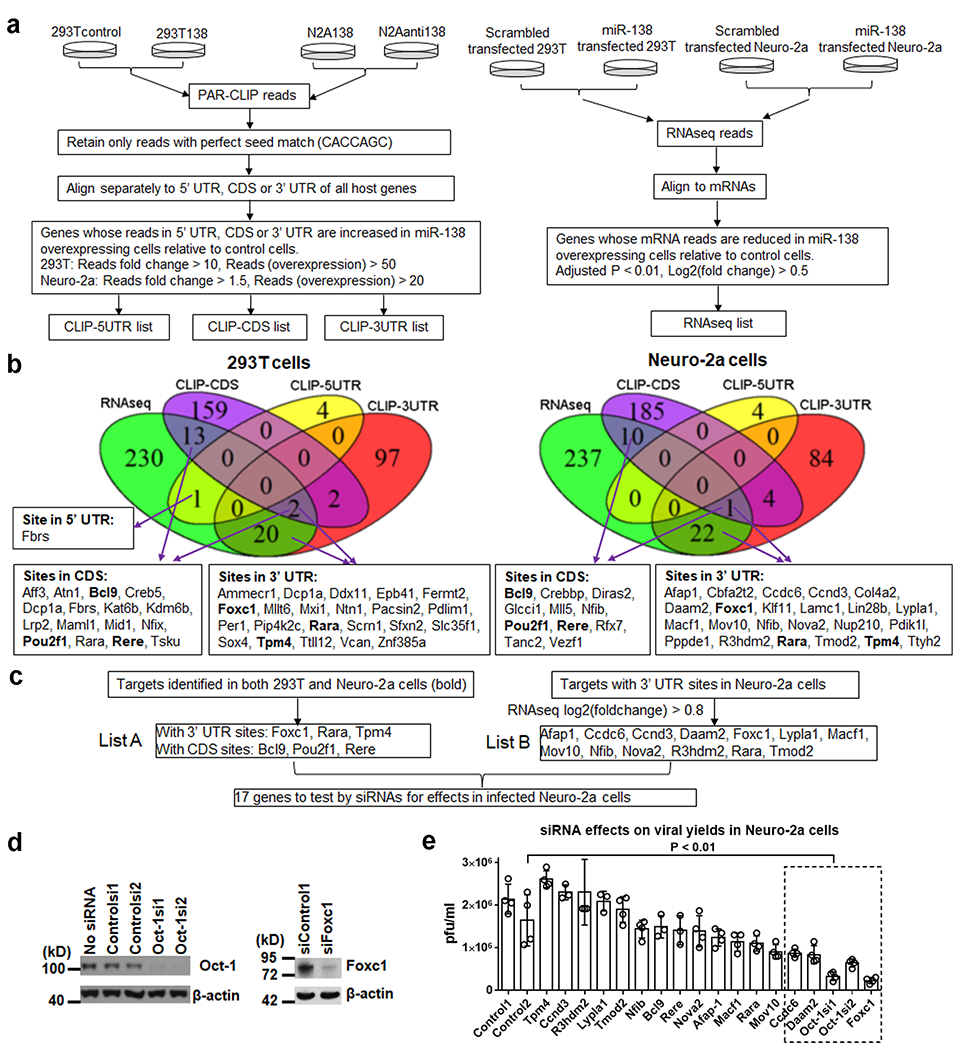
a, Outline of the procedures used to perform and analyze PAR-CLIP and RNAseq. b, Top, Venn diagrams generated using the lists obtained in a. The 4 boxes just below the Venn diagrams show the lists of genes found in both the RNAseq list and the CLIP-CDS, CLIP-5UTR or CLIP-3UTR list. Purple arrows point from the locations of the genes in the Venn diagram to those in the boxes. Genes found in both 293T and Neuro-2a cells are shown in bold letters. c, Criteria for further selection of genes for siRNA experiments. d, Neuro-2a cells were transfected with 80 nM of the indicated siRNA and harvested at 48 hpi for Western blot analysis of Oct-1 (left), Foxc1 (right), and β-actin (both). These experiments were repeated once with similar results. e, Neuro-2a cells were transfected with 80 nM of the siRNAs against the indicated genes for 48 h, then infected with WT virus (MOI = 0.1) for 48 h before viral titer measurements. n = 3 or 4 biologically independent samples per condition. Data are presented as mean values ± S.D. The box with dashed lines indicate siRNAs that reduced viral titers significantly relative to Control2 siRNA (P < 0.01, one-way ANOVA with Bonferroni’s multiple comparisons tests).
We next combined PAR-CLIP and RNAseq to detect transcripts that both bind to miR-138 and exhibit reduced abundance in its presence. RNAseq analyses showed that relative to the scrambled control, transfected miR-138 significantly (P < 0.01) reduced levels of 266 and 270 transcripts in 293T and Neuro-2a cells, respectively, by log2 decreases > 0.5 (Fig. 3a, b). Comparisons of the PAR-CLIP and RNAseq results resulted in 1, 15, and 22 transcripts identified in both assays with sites in 5’ UTRs, CDS, and 3’ UTRs, respectively, in 293T cells, and 0, 11, and 23 transcripts with sites in these regions, respectively, in Neuro-2a cells. Relative to the single PAR-CLIP approach, the combined approach identified significantly higher fractions of targets with 3’ UTR sites (Extended Data Fig. 5h).
In the final PAR-CLIP/RNAseq results, six transcripts (List A, Fig. 3c) were identified in both 293T and Neuro-2a cells, namely Bcl9, Pou2f1, and Rere with CDS sites, and Foxc1, Rara, and Tpm4 with 3’ UTR sites. Being particularly interested in neuronal cells, we applied more stringent criteria (log2fold-change > 0.8) to targets with 3’ UTR sites identified only in Neuro-2a cells to form List B. Combining List A and B yielded 17 transcripts (Fig. 3c, Supplementary Table 1). For each of them, we designed siRNAs and selected the most effective one. The expression of each gene other than Nova2 was reduced by 50-95% by the selected siRNA as assessed by Western blots (Fig. 3d) and/or qRT-PCR (Extended Data Table 2). We then infected siRNA transfected Neuro-2a cells with WT virus. Compared to two control siRNAs, siRNAs against Ccdc6, Daam2, Pou2f1 and Foxc1 significantly reduced viral yields (Fig. 3e). We focused on Pou2f1 and Foxc1 in the following experiments because their siRNAs had the greatest effects. Interestingly, they are both transcription factors and Pou2f1 encodes the aforementioned co-factor of VP16, Oct-1.
miR-138 represses Oct-1 and Foxc1.
The Oct-1 CDS has two canonical (perfect seed-matching) sites (Fig. 4a). Both are conserved between humans and mice and belong to the 8mer type, a target site type with the highest efficacy1. Following co-transfection with Oct-1 expressing plasmids, miR-138 repressed expression of human and mouse Oct-1 (Fig. 4b). The effect on human Oct-1, which was ~2-fold for WT, was less when either site alone was mutated, and largely eliminated when both sites were mutated (Fig. 4c), suggesting that miR-138 represses Oct-1 through these sites.
Fig. 4. Repression of Oct-1 and Foxc1 expression by miR-138.

a, miR-138 binding sites in Oct-1 CDS. The horizontal line represents Oct-1 mRNA. The thick green arrow represents Oct-1 CDS. The two small orange boxes represent miR-138 binding sites, whose sequences and how they pair with miR-138 (seed region underlined) are shown. b, 40 nM miRNA mimic and 100 ng/ml Oct-1 expressing plasmid were co-transfected into 293T cells for 30 h before Western blot analysis. This experiments was repeated twice with similar results. c, Same as b, but using plasmids expressing WT human Oct-1 or its variants with mutations at site1 (M1), site2 (M2) or both sites (M12). This experiment was repeated once with similar results. d, Foxc1 mRNA and luciferase constructs are illustrated with the pink horizontal bar representing Foxc1 mRNA and the embedded green arrow representing Foxc1 CDS. The two small orange boxes represent miR-138 binding sites, whose sequences and how they pair with miR-138 (seed region underlined) are shown. Blue X’s indicate mutated sites. e, Left and middle, 293T cells were co-transfected with 40 nM miRNA mimic and 100 ng/ml plasmid and harvested at 48 h for assay of luciferase activity. Right, 293T cells were co-transfected with 20 nM of miR-138 mimic, 20 nM of miR-138 or control LNA and 40 ng/ml luciferase plasmid with human or mouse Foxc1 3’ UTR before being harvested at 48 h for assay of luciferase activity. RLU, relative luciferase unit. Data were analyzed by two-tailed, unpaired t tests. f, 293T or Neuro-2a cells were transfected with 80 nM miRNA mimic or 20 nM LNA and harvested for Western blot analysis at 72 h after transfection. Dilutions of lysates of non-transfected cells are indicated as none, none/3, etc. This experiment was repeated once with similar results. g, Oct-1 and Foxc1 mRNA levels in Neuro-2a cells and neurons purified from mouse TG were analyzed by qRT-PCR. For e and g, n = 3 biologically independent samples per condition and data are presented as mean values ± S.D.
Both human and mouse Foxc1 have two canonical sites in their 3’ UTRs, and, unusually, site1 in human but not mouse Foxc1 can bind miR-138 in two ways (Fig. 4d). Following co-transfection with luciferase constructs, miR-138 repressed luciferase activity from mRNAs with human as well as with mouse Foxc1 3’ UTRs, and repression was alleviated by co-transfection with an LNA inhibitor (Fig. 4e). For both human and mouse Foxc1 3’ UTRs, repression was greatly attenuated when site1 was mutated and obliterated when both sites were mutated, suggesting that miR-138 represses Foxc1 through both sites.
We then examined regulation of endogenous Oct-1 and Foxc1 expression by miR-138. Transfected miR-138 reduced Foxc1 and Oct-1 expression by ~3-fold and ~2-fold, respectively, in 293T and Neuro-2a cells (Fig. 4f). A transfected miR-138 LNA inhibitor increased Foxc1 (~2-fold) and Oct-1 (<2-fold) expression in Neuro-2a cells (Fig. 4f). Relative to 293T cells, Neuro-2a cells exhibited >3-fold lower Oct-1 and >27-fold lower Foxc1 protein levels (Fig. 4f). Relative to Neuro-2a cells, neurons isolated from mouse TG exhibited ~4-fold lower Oct-1 and similar Foxc1 mRNA levels (Fig. 4g). Data from a database (mousebrain.org) also showed low, albeit detectable Oct-1 and Foxc1 mRNA levels in ganglionic neurons. Moreover, immunofluorescence assays showed that although TG cryo-sections displayed strong signals when stained with a neuronal marker Tuj1, neither Oct-1 nor Foxc1 was detected meaningfully above background in cells expressing Tuj1 using validated antibodies (Extended Data Fig. 6). Thus, Oct-1 and Foxc1 are expressed poorly in ganglionic neurons, the site of HSV-1 latency, correlating with high miR-138 expression in such neurons20,26.
Foxc1 increases HSV-1 replication in neurons.
Unlike Oct-1, Foxc1 was not known to regulate HSV-1 infection. Foxc1 contains a DNA binding domain (DBD), an N-terminal activation domain (AD-N), a C-terminal activation domain (AD-C) and an inhibitory domain (ID)32,33 (Fig. 5a). Compared to an empty vector (pcDNA), transfected human or mouse Foxc1 greatly increased virus replication in Neuro-2a cells (Fig 5b, c). The human Foxc1 mutant without the DBD no longer promoted viral replication (Fig. 5c). Deletion of either AD attenuated Foxc1’s ability to promote viral replication, but deletion of both (delADboth) resulted in viral yields even lower than those exhibited by pcDNA, suggestive of dominant-negative effects (Fig. 5c). Interestingly, deletion of the ID (delID) resulted in viral yields even higher than the increased yields exhibited by full-length Foxc1 (Fig. 5c). Thus, stimulation of HSV-1 replication by Foxc1 requires DNA binding and is positively regulated via the ADs and negatively regulated via the ID. We then transduced cultured neurons isolated from mouse TG with adeno-associated virus (AAV) expressing Foxc1, Foxc1delADboth, or Foxc1delID before infection with an HSV-1 expressing green fluorescence protein (HSV1GFP). Immunofluorescence analysis confirmed efficient transduction of almost all neurons, and indicated higher GFP expression from HSV1GFP in AAVFoxc1 than AAVFoxc1delAD transduced neurons (Fig. 5d). Relative to AAVFoxc1delAD, transduction of AAVFoxc1 resulted in higher HSV1GFP titers in supernatants at 72 hpi (Fig. 5e). We also observed higher HSV1GFP titers in supernatants over AAVFoxc1delID than AAVFoxc1delAD transduced neurons at 24 and 60 hpi (Fig. 5f).
Fig. 5. Foxc1 promotes HSV-1 replication in neuronal cells and mouse TG.
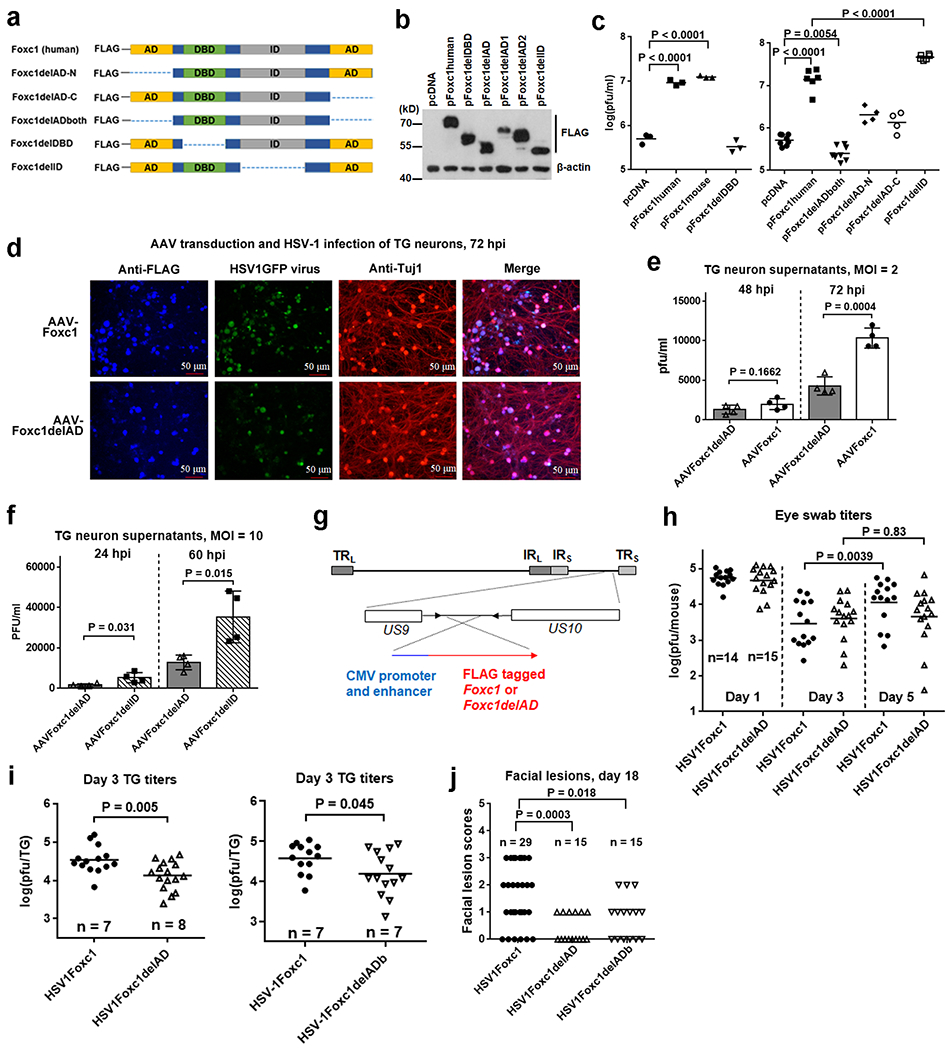
a, Schematics of full-length human Foxc1 and its deletion mutants. The positions of the activation domains (ADs), DNA-binding domain (DBD) and inhibitory domain (ID) are shown. b, Neuro-2a cells were transfected with 200 ng/ml plasmid for 24 h before Western blot analysis. This experiment was repeated once with similar results. c, Neuro-2a cells were transfected with 200 ng/ml plasmid for 24 h, then infected with KOS (MOI = 0.1) for 48 h before viral titer measurements. d, Neurons were isolated from mouse TG, cultured and transduced with the indicated AAV for 5 days before infection with HSV1GFP (MOI = 2). At 72 hpi, they were fixed and stained with anti-FLAG antibody to detect FLAG-tagged Foxc1 and Foxc1delAD proteins (blue) and with anti-Tuj1 (red) antibodies. This experiment was repeated twice with similar results. e, In the experiment described in d, supernatants were collected for viral titer measurements. f, Same as e except that an MOI of 10, different AAVs and time points were used, as indicated. g, Schematic of recombinant viruses showing the location of insertion. h, After corneal inoculation of mice with 4 x 10⁴ pfu/eye, eye swab viral titers were measured. i, Following inoculation as in h, mouse TG collected at 3 dpi were analyzed for viral titers. j, Eighteen days after inoculation with 2 x 10⁵ pfu/eye, the severity of mouse facial lesions was scored: 0, no lesion; 1, slight lesions in small areas; 2, nearly half of the face covered by lesions; 3, most of the face covered by lesions. Data were analyzed by two-tailed, paired (h) or unpaired (i) t tests, or one-way (c, j) or two-way (e, f) ANOVA with Bonferroni’s multiple comparisons tests. For c, e and f, each point represents a biologically independent sample (n = 3 to 8). For h, i and j, each point represents one mouse (h, j) or TG (i). The numbers of mice used are indicated as n numbers. For e and f, data are presented as mean values ± S.D. For c, h and I, horizontal lines represent geometric means.
To further investigate Foxc1 effects in mice, we constructed a recombinant virus expressing Foxc1, designated HSV1Foxc1 (Fig. 5g). For unknown reasons, HSV1Foxc1 showed a one-log defect in ocular replication relative to WT one day after corneal inoculation (Extended Data Fig. 7a). Consequently HSV1Foxc1 also showed significantly lower viral genome levels at 31 dpi (Extended Data Fig. 7b) (Similarly low mortality, < 5%, was observed for both viruses). Despite decreased replication in the eye likely influencing the amounts of virus entering the TG, HSV1Foxc1 titers were similar to WT titers in TG at 5 dpi (Extended Data Fig. 7c) hinting at possible increased replication in neuronal tissues. We then constructed another control virus designated HSV1Foxc1delAD expressing Foxc1delADboth. Expression of Foxc1 and Foxc1delAD proteins from these viruses in TG at 3 dpi was confirmed by immunofluorescence (Extended Data Fig. 7d). Despite similar eye swab titers at 1 and 3 dpi (Fig. 5h), HSV1Foxc1 replicated to significantly higher titers than HSV1Foxc1delAD in TG at 3 dpi (Fig. 5i). Also, from 3 to 5 dpi, the eye-swab titers of HSV1Foxc1 increased significantly while HSV1Foxc1delAD titers remained unchanged (Fig. 5h). To rule out the possibility that the lower replication of HSV1Foxc1delAD was due to unwanted mutations, we independently engineered another Foxc1delADboth expressing virus named HSV1Foxc1delADb, which also showed significantly lower titers in TG at 3 dpi than HSV1Foxc1 (Fig. 5i). At 29 dpi, when latency was fully established, we did not detect a difference in viral genome levels between HSV1Foxc1, HSV1Foxc1delAD and HSV1Foxc1delADb (Extended Data Fig. 7e). However, we observed significantly more severe facial lesions caused by HSV1Foxc1 than either HSV1Foxc1delAD or HSV1Foxc1delADb at 18 dpi (Fig. 5j). Thus, Foxc1 can promote HSV-1 replication in neuronal cells in culture and nervous tissues in vivo, and affect viral pathogenesis.
Foxc1 upregulates HSV-1 gene expression.
To understand how Foxc1 promotes HSV-1 replication, we first analyzed gene expression in Neuro-2a cells. All viral proteins tested were upregulated by Foxc1 with effects observed as early as 4 hpi (Fig. 6a). Even at 2 hpi, all viral transcripts tested were significantly upregulated by Foxc1delID relative to Foxc1deAD (Fig. 6b and Extended Data Fig. 8a). However, attachment to cells and entry of viral genome into the nucleus (Fig. 6c) were not affected, demonstrating that Foxc1 promotes transcription rather than upstream steps. RNAseq analysis comparing pFoxc1human- and pcDNA-transfected Neuro-2a cells showed that at 5 hpi all viral transcripts were upregulated by Foxc1 without any one being particularly more so than others (Extended Data Fig. 8b). IE transcripts were generally less upregulated, however, possibly due to their high baseline levels resulting from activation by the VP16-Oct-1-HCF-1 complex.
Fig. 6. Foxc1 effects on HSV-1 gene expression and heterochromatin in Neuro-2a cells.
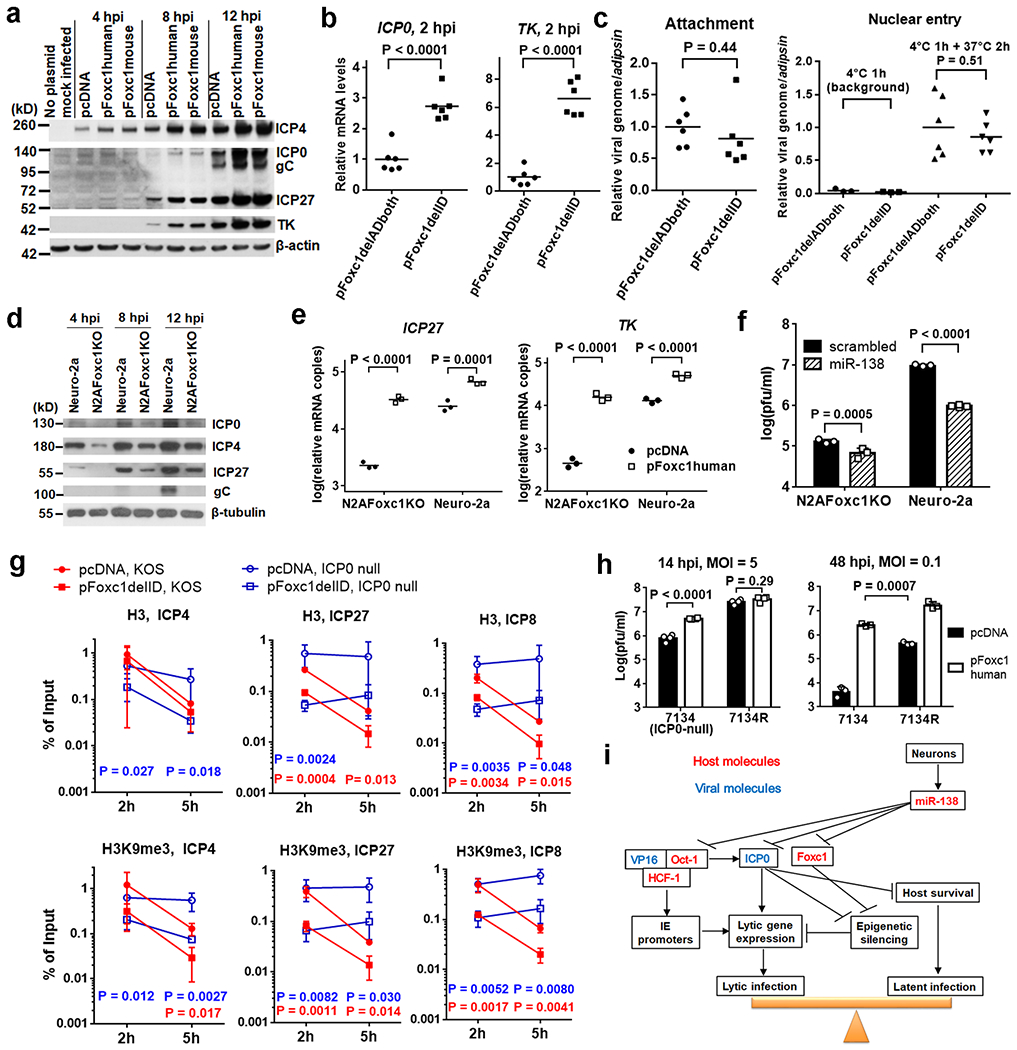
a, Neuro-2a cells were transfected with 200 ng/ml plasmid for 24 h, then infected with KOS (MOI = 5) before Western blot analysis. b, Neuro-2a cells were transfected with 200 ng/ml plasmid for 40 h, then incubated with KOS (MOI = 2) at 4°C for 1 h to allow attachment, followed by incubation at 37°C for 2 h before qRT-PCR analysis of RNA levels. c, For analysis of attachment (left), after transfection and attachment as in b, cells were washed before qPCR analysis of viral genome. For analysis of nuclear entry (right), following incubation at 37°C for 2 h (or immediately following attachment to determine the background), nuclear fractions were isolated and analyzed by qPCR for viral genome. d, Neuro-2a or N2AFoxc1KO cells were infected with KOS (MOI = 5) before Western blot analysis. e, N2AFoxc1KO or Neuro-2a cells were transfected with 400 ng/ml plasmid, then infected with KOS for 5 h (MOI = 1) before qRT-PCR analyses. f, Neuro-2a or N2AFoxc1KO cells were transfected with 20 nM miRNA mimic, and infected with KOS (MOI = 0.5) for 48 h before titer measurements. g, Neuro-2a cells were transfected with 500 ng/ml of plasmid for 40 h and infected with KOS or 7134 virus (MOI = 2) before ChIP-qPCR analysis for histone H3 and H3K9me3 at the indicated promoters. Log transformed data were analyzed by multiple t tests with correction for multiple comparisons using the Holm-Sidek method. When differences between pcDNA and pFoxc1delID are significant, P values are displayed under the points being compared (red for KOS and blue for 7134). h, Neuro-2a cells were transfected with 200 ng/ml plasmid, then infected for 14 h (MOI = 5, left) or 48 h (MOI = 0.1, right) before viral titer analyses. For all panels, x = 6 (b, c) or 3 (e, f, g, h) biologically independent samples. Horizontal lines or centers of error bars represent mean values. Error bars represent S.D. Data were analyzed by two-tailed, unpaired t tests (b, c) or two-way ANOVA with Bonferroni’s multiple comparisons tests (e, f, h). i, Model of regulation of the lytic-latent switch by the neuron-specific miR-138.
Foxc1 is important for miR-138 regulation of HSV-1.
We derived a Foxc1 knockout cell line, N2AFoxc1KO, from Neuro-2a cells using CRISPR/Cas9 technology (Extended Data Fig. 9a). These cells showed substantially reduced viral replication and viral protein and mRNA levels at early times (Fig. 6d,e, Extended Data Fig. 9b,c). Transfection of Foxc1 into N2AFoxc1KO cells increased viral mRNA levels roughly to those observed in Neuro-2a cells transfected with empty vector, indicating that the loss of Foxc1 is responsible for reduced viral replication (Fig. 6e, Extended Data Fig. 9c). Notably, miR-138 repression of viral replication was markedly attenuated in N2AFoxc1KO cells (Fig. 6f). Thus, even though its expression is already low in neuronal cells (Fig. 4f,g), Foxc1 is important for viral replication and gene expression and their repression by miR-138.
Heterochromatin reduction by Foxc1 and ICP0.
The global effects of Foxc1 on viral transcription prompted us to investigate whether Foxc1 modulates viral chromatin status. ChIP-qPCR experiments showed that transfected full-length Foxc1 reduced H3K9me3 enrichment on ICP0, ICP27 and ICP8 promoters in KOS virus infected Neuro-2a cells at 2 hpi (Extended Data Fig. 10). To more sensitively detect the differences, we used the plasmid expressing the Foxc1delID mutant which is more active than full-length Foxc1 (Fig. 5c). Consistent with previous results from fibroblasts11, histone H3 and H3K9me3 association with ICP4, ICP27 and ICP8 promoters dropped from 2 to 5 hpi in KOS but not 7134 (ICP0-null) virus infected Neuro-2a cells. At both times, Foxc1delID markedly reduced H3 and H3K9me3 association with these regions for both viruses (Fig. 6g). Given these results showing heterochromatin reduction by both Foxc1 and ICP0, we wondered whether Foxc1 could compensate for lack of ICP0. Indeed, transfected Foxc1 increased 7134 virus yields despite little effect on the rescued virus, 7134R, following infection of Neuro-2a cells at a high multiplicity of infection (MOI) (Fig. 6h, left). Strikingly, at a low MOI, transfected Foxc1 increased 7134 virus yields by over 500-fold at 48 hpi, such that they were greater than those of 7134R following transfection of pcDNA (Fig. 6h, right). Thus, Foxc1 can replace ICP0 to induce removal of heterochromatin and promote viral replication, and can further boost both processes in collaboration with ICP0.
Discussion
After observing ICP0-independent repression of lytic gene expression by miR-138, we performed a genome-wide search for other targets of miR-138, leading to identification of Oct-1 and Foxc1. Despite possibly missing false-negative candidates, the final lists of targets from the combined approach are highly likely to be valid as they fulfilled both binding (PAR-CLIP) and functional (RNAseq) criteria. Indeed, many of the targets with 3’ UTR sites have been previously validated, including Ccnd334, Fermt35, Foxc136–38, Lypla139, Rara40 and Sox41. Our approach also identified previously unknown targets with CDS sites, which were neglected by target searches focusing on 3’ UTR sites. Therefore, our PAR-CLIP/RNAseq method complements computational prediction to facilitate discovery of important miRNA targets.
Foxc1 is a Forkhead-box (Fox) transcription factor with roles in development and disease32,42 . Our results indicate that Foxc1 broadly alters the epigenetic status of the viral genome. One possibility is that Foxc1 regulates chromatin modulatory proteins that in turn regulate HSV-1 infection. An interesting alternative is that Foxc1 affects histones associated with viral genes. Another Fox protein, Foxa1, is known as a pioneer factor that can open up condensed chromatin by displacing linker histones43. Although the exact mechanism of Foxc1 regulation of HSV-1 infection remains to be elucidated, this study raises the intriguing possibility that some Fox proteins regulate HSV-1 infection by unusual mechanisms.
There have been studies reporting regulation of viral infection by host miRNAs44–50. However we are unaware of any that describe convergent repression of both viral and host targets. As miRNAs typically have a modest impact through each interaction with a transcript, they may require multiple interactions to achieve robust outcomes1. Remarkably, the three targets of miR-138, ICP0, Oct-1 and Foxc1 all play roles in activation of lytic gene expression and modulation of the viral chromatin status. While ICP0 uses its E3 ubiquitin ligase function, Oct-1 and Foxc1 use their DNA binding activities. While ICP0 and Foxc1 appear to act globally, Oct-1 acts specifically at IE promoters8,9,14. Targeting these proteins simultaneously blocks multiple paths leading to lytic replication. Both ICP0 and VP16 are known to be crucial for reactivation from latency25,51,52. VP16 has little DNA binding activity on its own, however53, and has been proposed to act as a switch that can be turned on and off in response to Oct-1 and HCF-1 availability8. For example, HCF-1 is sequestered in the cytoplasm of unstimulated neurons, but re-localizes to the nucleus upon reactivation54,55. Low Oct-1 expression in neurons may favor latency by switching VP16 off. Likewise, low expression of Foxc1 that can promote viral replication should also be conducive to latency. Thus, we propose a model in which miR-138 expressed highly in neurons promotes latency through multiple convergent pathways involving suppression of these viral and host gene activators (Fig 6i).
Mammalian alphaherpesviruses, which form latent infections in neurons of species that diverged millions of years ago, use homologs of VP16 to activate gene expression through interaction with Oct-1 (e.g56). We speculate that these viruses evolved neuronal latency by gaining selective advantage from a broad regulatory network, including miR-138, which represses Oct-1 and other factors such as Foxc1. We assume that this network ordinarily helps maintain neuronal identity and function. HSV-1 would then have further evolved to exploit miR-138 for repression of ICP0. It would make sense for evolution to have selected for mechanisms that collaborate rather than offset each other. It will be interesting to see whether such convergent targeting mechanisms are generally exploited by viruses that have evolved to utilize miRNAs.
Online Methods
Cells.
Vero (African green money kidney cells), 293T (human embryonic kidney cells transformed by adenovirus and expressing the SV40 T antigen) and Neuro-2a cells (mouse brain neuroblastoma cells) were obtained from American Type Culture Collection and maintained as described previously30. Construction of 293T138, 293Tcontrol, N2A138, N2Aanti138 and N2AFoxc1KO cell lines is described below.
TG neurons were isolated and cultured as previously described with slight modifications57. Briefly, 6 weeks-old CD-1 (ICR) male mice (Charles River Laboratories, Beijing) were anesthetized with isoflurane (RWD, Shenzhen) for 1 minute and transcardially perfused with ~10 ml PBS. TG were dissected and digested in Collagenase/Dispase solution (C9891, D4693, Sigma-Aldrich) at 37°C for 1 h. Neurons were purified by gradient separation in an Optiprep gradient (D1556, Sigma-Aldrich) followed by two washes with Neurobasal A medium (10888022, ThermoFisher) + 2% N21 (AR008, R&D systems). The purified neurons were counted and plated on pre-treated 10 mm coverslips pretreated with poly-D-lysine (E607014-0002, Sangon Biotech) and laminin (23017-015, Invitrogen) with 5000 neurons each. After neurons adhered, the coverslips were transferred to a 24 well plate and cultured in Neurobasal A medium + 2% N21 + 50 ng/ml neurturin (R&D systems, cat: 1297-NE-025) + 50 ng/ml neuronal growth factor (R&D systems, cat: 256-GF-100) + 50 ng/ml glial-derived neurotrophic factor (R&D systems, cat: 212-GD-010) + 1 μg/ml mitomycin C (HY-13316, MedChemExpress) for 3-4 days.
Human inducible neurogenin3 iPSCs (iNGN3 iPSCs)58 were seeded in a Matrigel-coated 6-well plate (1 x 10⁶ cells) and induced with StemFlex media + supplement (Thermo Fisher Scientific, cat: A3349401) and 1 μg/mL doxycycline for 4 days. Then, media were replaced with Neurobasal plus (Thermo Fisher Scientific, cat: A3582901) DMEM/F12 (Thermo Fisher Scientific, cat: 11320033, 1:1)+B12 plus (Thermo Fisher Scientific, cat: A3582801) + N2 (Thermo Fisher Scientific, cat: 17502001) + 1xGlutaMAX (Thermo Fisher Scientific, cat: 35050079) + 1xMEM NEAA (Thermo Fisher Scientific, cat: 11140050) and incubated for 5 days with daily media change, replated in Neurobasal plus/DMEM/F12 + B12 plus media containing 4G (4G; BDNF, (PeproTech, 10ng/mL), GDNF (PeproTech, 10ng/mL), β-NGF (PeproTech, 10ng/mL), and NT-3 (PeproTech, 10ng/mL)), and ascorbic acid (0.1mM). To eliminate undifferentiated dividing cells, 5-fluoro-2′-deoxyuridine (FUdR, 20 μM) was added to media and maintained for 7-10 days.
Viruses.
HSV-1 strain KOS wild type and ICP0-null mutant virus 7134 were propagated and assayed as described previously29. WT-BAC28, M13826, and WTLyt13830 viruses were generated previously using BAC technology based on HSV-1 strain KOS. WTLyt138KO virus was constructed in the same way as WTLyt138 except that in the synthesized gBlocks Gene Fragment30, the miR-138 seed coding sequence GCTGGTG was replaced with CGACCAC. WTLyt138R virus was generated on the basis of WTLyt138KO BAC DNA following the two-step red-mediated recombination protocol59 using Restore138fw and Restore138rv primers (Supplementary Table 3). M138Lyt138, M138Lyt138KO, and M138Lyt138R viruses were generated in the same way as WTLyt138, WTLyt138KO, and WTLyt138R, respectively, starting with M138 BAC DNA. To construct HSV1Foxc1 and HSV1Foxc1delAD viruses, a DNA cassette coding Kanamycin-resistance (Kan-r) gene plus I-SceI site was PCR-amplified with primers Kan3-1F and Kan3-1R and inserted into the NheI site of pcDNAFoxc1human or pcDNAFoxc1delADboth plasmids. Foxc1-BACF and Foxc1-BACR primers, flanked by ~40 bp of the region between US9 and US10 was used to amplify Foxc1-Kan-r and Foxc1-ADdd-Kan-r cassettes, each including CMV promoter and poly(A) signal sequences. These cassettes were used according to the two-step red-mediated recombination protocol59 to generate BAC genomic DNA, which was transfected into Vero cells to generate viruses. HSV1GFP was constructed in the same way starting from pcDNAGFP plasmid that we constructed by inserting the EGFP gene between XhoI and HindIII sites of pcDNA. Virus propagation, titration by plaque assays and infections (which included back titrations of inocula) were performed as described previously30.
Plasmids.
pICP0-WT26, pICP0-M13826, and pUL3960 were described previously. To construct pFoxc1human and pFoxc1mouse, total human and mouse RNA was extracted from 293T and Neuro-2a cells, respectively, using Eastep Super Total RNA Extraction Kit (Promega), and reverse transcribed using RevertAid First Strand cDNA Synthesis Kit (ThermoFisher). FLAG-HA-pcDNA3.1- was from Addgene and designated pcDNA here. Foxfw and FoxHrv primers were used to amplify the human Foxc1 CDS, Foxfw and FoxMrv primers were used to amplify the mouse Foxc1 CDS, and each amplified CDS was inserted between EcoRI and BamHI sites of pcDNA. OctHfwa and OctHrvd primers were used to amplify the human Oct-1 CDS, OctMfw and OctMrv primers were used to amplify the mouse Oct-1 CDS, and each amplified CDS was inserted between XbaI and HindIII sites of pcDNA. Oct-1M1 mutations were introduced into human Oct-1 site1 using the overlapping PCR method61. Briefly, using the Oct-1 CDS fragment as a template, fragment ab was obtained using Oct-1Hfwa and OctHrvb primers, and fragment cd was obtained using OctHfwc and OctHrvd primers. The overlapping ab and cd fragments were mixed in a 1:1 molar ratio to serve as templates and OctHfwa and OctHrvd served as primers to amplify the Oct-1 CDS fragment with M1 mutations, which was inserted between the EcoRI and HindIII sites of pOct-1human. To introduce mutations into the human Oct-1 site2, OctfwM2 and OctHrvd primers were used to amplify a fragment containing the M2 mutations, which was inserted between the EcoRI and HindIII sites of pOct-1human. pFoxc1delAD-N, pFoxc1delAD-C, pFoxc1delADboth and pFoxc1delDBD were constructed by inserting the corresponding PCR products between EcoRI and BamHI sites of pcDNA. Using the human Foxc1 CDS as a template, 1AD-del-F-a1 and Rv-FOXC1-BamHId primers were used to amplify the PCR product for pFoxc1delAD-N; Fw-FOXC1-EcoRIa and 2AD-del-R-d primers were used for Foxc1delAD-C; 1AD-del-F-a1 and 2AD-del-R-d primers were used for pFoxc1delADboth. pFoxc1delDBD and Foxc1delID was constructed based on pFoxc1 using the overlapping PCR method. For pFoxc1delDBD, fragment ab was obtained using Foxfw and FoxFkhB primers and fragment cd using FoxFkhC and FoxHrv primers. For pFoxc1delID, fragment ab was obtained using Fw-FOXC1-EcoRIa and ID-del-r-b primers, and fragment cd using ID-del-c-f and Rv-FOXC1-BamHId primers. The plasmids for producing lentiviruses LVmiR138 and LVmiRM138b were constructed by inserting the mouse pre-miR-138-1 (with WT sequence for LVmiR138 and with CGACCAC replacing GCTGGTG of the miR-138 seed region for LVmiRM138b) and flanking sequences (The 146 nt sequences starting from CCATACTTCA and ending with ATCCAGACAC were synthesized by Sangong Biotech.) into pLVTHMmCherry22 between MluI and ClaI sites. The GL3 empty vector and luciferase plasmid with the ICP0 gene promoter of strain KOS were kind gifts of Clinton Jones62. The luciferase plasmids with ICP4 and ICP22 promoters of strain RE were kind gifts of Shun-Hua Chen63. To construct luciferase plasmids with Foxc1 3’ UTR, total human and mouse RNA extracted from 293T and Neuro-2a cells were reverse transcribed (as described above). The Foxc1 3’ UTR fragments were amplified using lucFwa and lucRvd primers and inserted between XhoI and NotI sites of psiCheck-2 (Promega). Then, M1 mutations were introduced into site1 using the overlapping PCR method (see above), with fragment ab obtained using lucFwa and lucRvb1 primers, and fragment cd obtained using lucFwc1 and lucRvd. The M2 mutations were introduced in the same way but using lucRvb2 and lucFwc2 primers instead of lucRvb1 and lucFwc1 primers. The sequences of all primers are listed in Supplementary Table 3.
Transfection.
Lipofectamine 3000 (Invitrogen) was used according to the manufacturer’s protocol. Transfection was performed in 24-well plates with 1 μl of Lipofectamine 3000 reagent per well unless otherwise indicated. Synthetic miRNA mimics were purchased from Qiagen (miScript miRNA mimic). LNAs were from Qiagen (miRCURY LNA miRNA power inhibitors for miR-138-5p and negative control B). siRNAs for mouse Oct-1, Foxc1, Bcl1 and Control1 were from Qiagen. The siRNAs for mouse Rara and Control2 were from Dharmacon. Those for all other mouse genes were custom designed and synthesized by RiboBio. Sequences of control siRNAs and siRNAs against mouse genes are listed in Supplementary Table 2.
Lentivirus production and transduction of iPSC derived neurons.
293T cells were plated in a 6-well plate (5 x 10⁵/well) one day before transfection. The cells were transfected with psPAX2:pVSV-G:pLVmiR138 or LVmiRM138b (4:1:5, total 2 or 4 μg) using polyethyleneimine (PEI, Polysciences, Inc. #23966). For PEI transfection, 2 or 4 μg of DNAs in 200 μL of Opti-MEM (Gibco, #31985) and 6 or 12 μg of PEI in 200 μL of Opti-MEMI were mixed and incubated at room temperature for 20 min. The mixtures were added directly to 293T cells containing 1.5 mL of DMEM (supplemented with 10% (vol/vol) FBS and 2 mM glutamine). The cells were incubated at 37°C for 8-16 h, replaced with 3mL of fresh DMEM supplemented with 30% (vol/vol) FBS and 2 mM glutamine, and incubated at 37°C. The media were harvested at every 12-24 h for 48-60 h, replaced with fresh DMEM containing 30% FBS, and saved on ice. The collected media was filtered using 0.45 μm syringe filter (Pall). Filtered lentivirus containing media was used directly or concentrated. To concentrate lentivirus, PEG 8000 was added to the filtered media (final 10%), incubated on ice for one day, centrifuged, and supernatant was removed without disrupting pellet. The pellet was resuspended in cold PBS or DMEM media (1/10-1/100 of original volume). To transduce cells with lentivirus, lentivirus was added to neurons and spun at 931xg for 0.5-1 hour at 25°C and incubated at 37°C. The next day, media was replaced with fresh medium and incubated for 10-14 days at 37°C.
Western blots.
Western blotting was performed as described previously 28. The following primary antibodies and dilutions were used: ICP0 antibody (Abcam, ab6513), 1:5000; ICP4 antibody (Abcam, ab6514), 1:5000; ICP27 antibody (Virusys, 1113), 1:5000; TK antibody (Santa Cruz, sc-28037), 1:500; gC antibody (Fitzgerald, 10-H25A), 1:1000; β-actin antibody (Sigma, A5441), 1:10,000; Oct-1 antibody (Abcam, ab178869), 1:5000; Foxc1 antibody (Abcam, ab227977), 1:500; β-tubulin antibody (Tianjin Sungene Biotech, KM9003), 1:5000. HRP-conjugated goat anti-mouse, goat anti-rabbit, and rabbit anti-goat antibodies (SouthernBiotech, 1030-05, 4030-05, 6163-05) were used as secondary antibodies with a dilution of 1:2000. Uncropped and unprocessed scans of the blots are provided as Source Data files.
RNAseq.
For analysis of effects of miR-138, Neuro-2a and 293T cells were transfected with 40 nM of miR-138 or scrambled mimic RNAs with three biological replicates, and harvested at 24 h post transfection. Cells were harvested and total RNAs were purified using an RNeasyPlus Mini Kit (Qiagen). mRNAs were isolated using a Takara mRNA Isolation Kit. Libraries were prepared using a PrepX RNA-seq Library Preparation Kit in an Apollo 324 system (IntegenX). Library quality was confirmed using an Agilent 2200 TapeStation D1000 HS ScreenTape. Sequencing was performed using a Nextseq 500 sequencer (Illumina) by paired-end sequencing of 150 cycles. For analysis of effects of Foxc1, Neuro-2a cells were transfected with 100 ng of pcDNA or pFoxc1human per well (in 24-well plates) for 40 h, and infected with KOS (MOI =1) for 5 h before being harvested. RNA purification was the same as above. Library construction and the subsequent sequencing were performed by BGI using the BGIseq500 platform (BGI-Shenzhen). Reads were trimmed to remove adapters, low-quality reads, and reads less than 30 bases long using Trimmomatic-0.33 (http://www.usadellab.org/cms/index.php?page=trimmomatic). The trimmed reads were aligned to the human (assembly hg19) or mouse (assembly mm10) genome using Tophat2 version 2.1.0 (https://ccb.jhu.edu/software/tophat/index.shtml). For alignment to the HSV-1 genome, the KOS sequence was used (GenBank accession number JQ673480.1, with the terminal repeats (TRL and TRS) manually removed. The human and mouse genomic files as well as the corresponding transcript annotation files (in the gtf format) were downloaded from the Harvard Medical School Research Computing server (https://rc.hms.harvard.edu). The transcript annotation files (in the gff format) for HSV-1 transcripts were created manually according to the format required for a gff file. Counts of reads aligned to each transcript were determined by Htseq-count version 0.9.1 (https://htseq.readthedocs.io/). Viral read counts were normalized by total read counts before being used for calculation of ratios. Statistical analysis of differentially expressed host transcripts was performed using DEseq2 version 1.30.0 (https://bioconductor.org/packages/release/bioc/html/DESeq2.html).
Luciferase assays.
Luciferase activities were measured using the Dual Luciferase Reporter Gene Assay Kit (11402ES60, Yeasen Biotech) and a Cytation 3 Cell Imaging Multimode Reader (Biotek) following the manufacturers’ instructions.
Chromatin immunoprecipitation (ChIP).
Neuro-2a cells (4 x 10⁶) in a 100-mm plate were transfected with 60 nM of scrambled control, miR-138 or miR-M138b mimics for 24 h using 45 μl of Lipofectamine 3000, and infected with M138 virus at an MOI of 5. At 6 hpi, the cells were processed for ChIP experiments as described previously 11. Briefly, cell monolayers were fixed in 1% formaldehyde for 15 min at 37°C, quenched with 0.125M glycine, then lysed for 10 min on ice in 1% SDS lysis buffer (1% SDS, 10 mM EDTA, 50 mM Tris, pH 8.1) and sonicated in 15 ml polystyrene tubes at 4°C in a Diagenode Biorupter for about 6 cycles of 5 min each on high setting (30 sec ON, 30 sec OFF) until DNA fragments of approximately 500 bp were obtained. To measure input genome concentration, 10 μl (1%) was retained. Each IP reaction was carried out overnight at 4°C using 15 μg of chromatin and 2.5 μg each of the following antibodies: anti-histone H3 (Abcam ab1791), anti-histone H3K9me3 (Abcam ab8898), anti-histone H3K27me3 (Active Motif 39156), or normal rabbit IgG (Millipore 12-370) in 1 ml of ChIP dilution buffer (150 mM NaCl, 10 mM Na2HPO4, 2 mM EDTA, 1.1% Triton, 0.1% SDS). Immune complexes were captured by rotating with 20 μl of MagnaChIP protein A magnetic beads (Millipore) for 3 h at 4°C, after which the beads were washed 3 times with a cold low-salt buffer (150 mM NaCl, 20 mM Tris·HCl, pH 8.1, 2 mM EDTA, 1% Triton X-100, and 0.1% SDS, 1 mM PMSF) and 3 times with cold LiCl wash buffer (50 mM HEPES pH 7.5, 250 mM lithium chloride, 1 mM EDTA, 1% NP-40, 0.7% sodium deoxycholate, 1 mM PMSF), followed by one wash with cold Tris-EDTA buffer (10 mM Tris-HCl, pH 8, 1 mM EDTA). The cross-linked DNA-protein complexes were eluted by incubation with 100 μl of elution buffer (1% SDS, 0.1 M NaHCO3) at 65°C for 10 min. Protein-DNA crosslinks were reversed from input and immunoprecipitates by incubating in 0.2 M NaCl (final concentration) at 95°C for 30 min, followed by treatment with 1 μl of RNase (1 mg/ml Ambion) for 1 h at 37°C, and then 2 μl of Proteinase K (Roche) at 45°C for 2 h. The DNA was then purified using a QIAquick PCR purification kit (Qiagen) and the relative amounts of specific sequences were measured by qPCR11.
qPCR and qRT-PCR.
To quantify miR-138 levels in cells, total RNA was purified using an RNeasyPlus Mini Kit (Qiagen) following the protocol for retaining small RNAs provided by the manufacturer. Reverse transcription using stem-loop primers and subsequent PCR were carried out using the Taqman MicroRNA Assay Kit, Taqman MicroRNA RT Kit, and Taqman Universal PCR master mix II no UNG (all from Applied Biosystems). miRNA levels were quantified by using standard curves generated from serial dilutions of synthetic miRNAs. To quantify the viral genome and transcripts in mouse TGs, DNA and RNA were isolated using a DNA/RNA Isolation Kit (TIANGEN) or Easy RNA Extraction Kit (DR0401050, Zhejiang Easy-Do Biotech) and reverse transcription and PCR were conducted using a HiScript II Q Select RT SuperMix and ChamQ Universal SYBR qPCR Kit (R233-01 and Q711-02/03, Vazyme). Previously described primers, and DNA and RNA standards26 were used. Viral genome levels were normalized to mouse Adipsin gene levels. Viral transcript levels were normalized to GAPDH transcript levels and then to viral genome levels. For analyses of candidate host targets of miR-138, standard curves were generated using serially diluted RNA from control siRNA transfected cells. The primer sequences for the host transcripts are listed in Supplementary Table 2.
Northern blot analysis.
293T cells (2 x 10⁷) in a 100-mm plate were infected with M138Lyt138 or M138Lyt138KO virus at an MOI of 5. At 8 hpi, RNA of < 200 nucleotides was purified from the cells using an miRNeasy Mini kit (Qiagen). RNA was resolved on Novex 15% Tris-borate-EDTA-urea polyacrylamide gels (ThermoFisher) alongside serially diluted synthetic miR-138 or miR-M138b (IDT). Northern blot hybridization used a previously described non-radioactive method 64 and synthetic miR-138 and miR-M138b LNA probes with digoxigenin labeled at 3’ ends (synthesized by Qiagen). The miR-138 probe has this sequence: CGGCCTG+A+TT+C+A+CA+ACACCAGCT, where +N indicates an LNA modified nucleotide. The miR-M138b probe has this sequence: GCCTGAT+TCAC+AA+GTG+GT+CGT. Hybridization and washing were conducted at 60°C for both these miRNAs.
Mouse procedures.
Male CD-1 (ICR) mice were purchased from Shanghai Laboratory Animals Center. Mouse housing and experimental procedures were approved by Animal Research Committee of Zhejiang University in accordance with national guidelines. Mice were housed at ambient temperature (~23°C) with low humidity in an air-conditioned room with 12 h dark/light cycles. Six-week old mice were anesthetized by intraperitoneal injection of 0.4 ml of a mixture containing 4 mg/ml pentobarbital sodium (Solarbio) and 500 ug/ml xylazine hydrochloride (Sigma, X1251) in sterile saline. 2 x 10⁵ pfu of virus in 3 μl was dropped onto each scarified cornea. For eye swab collection, mice were anesthetized with 3% isoflurane (RWD Life Science) in oxygen with a flow rate of 0.5 ml/min using a V1 Table Top anesthesia machine (Colonial Medical Supply). Both eyes of each mouse were swabbed with cotton-tipped applicators, which were suspended in 1 ml of cell culture media. For TG acquisition, mice were sacrificed by cervical dislocation, and the TG were removed and placed on dry ice before storing at −80°C. TG were homogenized in cell culture media for virus titers. For nucleic acid analysis, TG were homogenized in lysis buffer (see above).
Construction of lentivirus-transduced cell lines.
The pre-miR-138-1 expressing and flanking sequences were amplified from Neuro-2a cells using Trip138fw and Trip138rv primers (Supplementary Table 3) and inserted between the XhoI and EcoRI restriction sites of pTRIPZ 65 (a generous gift from Bryan Cullen). An aliquot (4-μg) of the resulting plasmid or empty vector were transfected together with 7.1 μg of psPAX2 plasmid (Addgene) and 3.9 μg of the pMD2.G plasmid (Addgene) into 293T cells in a 100-mm plate using Lipofectamine 3000 following the manufacturer’s instructions (ThermoFisher). Lentiviruses were harvested from the supernatants at 3 days posttransfection and added to 50% confluent 293T or Neuro-2a cells with 8 μg/ml of hexadimethrine bromide (Sigma). Two days later, the supernatant was removed and replaced with fresh medium containing 1 μg/ml puromycin. Surviving cells were expanded in the presence of 1 μg/ml puromycin. The N2Aanti138 cell line was constructed in the same way except that a fragment antisense to miR-138 was inserted into the pTRIPZ vector. The fragment was made by annealing synthetic oligo DNA TripAnti138fw and TripAnti138rv (Supplementary Table 3). Annealing was achieved by mixing 4 μM of each oligo in Annealing Buffer (30 mM HEPES-KOH, pH7.4, 100 mM potassium acetate and 2 mM magnesium acetate), incubating the mixture at 98°C for 10 min on a heat block, and slowly cooling down to room temperature.
PAR-CLIP.
PAR-CLIP was carried out basically as previously described66 with some modifications. 293T138, 293Tcontrol, N2A138, N2Aanti138 cells were expanded in the presence of 1 μg/ml Dox for 3 days. Twenty 100-mm plates of cells of ~90% confluency were used for each condition. The ribonucleotide 4-thiouridine (Sigma) was added (100 μM). Crosslinking was performed at 18 h after adding 4-thiouridine for uninfected cells. For infection, 18 h after adding 4-thiouridine, 293T138 and 293Tcontrol cells were infected with WT virus for 4 or 8 h (MOI = 1) before crosslinking. For crosslinking, the medium was removed and the cells were irradiated on ice with 0.15 J/cm2 of 365 nm UV light. Then, 4 ml of phosphate-buffered saline (PBS) was added to each plate. The cells for each condition were scraped into the buffer and pooled, and centrifuged at 400 x g at 4°C for 5 min. The supernatant was discarded, and the cell pellet was snap frozen in liquid nitrogen and stored at −80°C.
The frozen pellet was resuspended in 9 ml of NP40 lysis buffer (50 mM HEPES-KOH, pH7.5, 150 mM KCl, 2 mM EDTA-NaOH, 1 mM NaF, 0.5% NP40, 0.5 mM dithiothreitol (DTT), complete EDTA-free protease inhibitory cocktail from Roche), incubated on ice for 10 min, and centrifuged at 13,000 rpm at 4°C for 20 min. The pellet was discarded. RNase T1 (ThermoFisher) was added to the supernatant to a final concentration of 100 u/ml. The tube was incubated for 15 min at 22°C and then placed on ice for >5 min. At the same time antibody conjugated beads were prepared as follows. For each sample, 200 μl of Protein G Dyna Beads (ThermoFisher) were transferred to a 1.5 ml tube, washed twice with 1 ml of PBS on a magnetic particle collector on ice, and resuspended in 200 μl of PBS. Rabbit anti-mouse IgG FC fragment (Jackson Immune Research, 315-005-008) (60 μg) was added as a bridging antibody. The tube was rotated at room temperature for 1 h. The beads were washed twice with 1 ml of PBS and resuspended in 100 μl of PBS plus 50 μg of 2A8 Anti-pan Ago antibody (clone 2A8, Millipore, MABE56). These beads were then added to the cell lysates and incubated on a rotating wheel overnight at 4°C.
The beads were collected on a magnetic particle collector, and the supernatant was discarded. The beads were resuspended in 1 ml of IP wash buffer (50 mM HEPES-KOH, pH7.5, 300 mM KCl, 0.05% NP40, 0.5 mM DTT, complete EDTA-free protease inhibitory cocktail) and transferred to a 1.5 ml tube. The beads were washed 4 times (10 min each) with 1 ml of IP wash buffer on a rotating wheel and resuspended in 200 μl of IP wash buffer. RNaseT1 was added to a final concentration of 40 u/μl. The beads were incubated at 22°C for 15 min, then on ice for 5 min before being washed 4 times (10 min each) with 1 ml of high-salt wash buffer (same as IP wash buffer except that KCl concentration was 500 mM) on a rotating wheel and resuspended in 200 μl of dephosphorylation buffer (50 mM Tris-HCl, pH7.9, 100 mM NaCl, 10 mM MgCl2, 1 mM DTT). 100 u of calf intestinal alkaline phosphatase (NEB) was added and the tube was incubated at 37°C for 30 min. The beads were washed 3 times with 1 ml of phosphatase wash buffer (50 mM Tris-HCl, pH7.5, 20 mM EGTA-NaOH, 0.5% NP40), then twice with 1 ml of PNK buffer without DTT (50 mM Tris-HCl, pH7.5, 50 mM NaCl, 10 mM MgCl2), and resuspended in 200 ul of PNK buffer (50 mM Tris-HCl, pH7.5, 50 mM NaCl, 10 mM MgCl2, 5 mM DTT). γ-[32P]-ATP (Perkin Elmer) (20 μCi) and T4 polynucleotide kinase (NEB) (200 u) was added, and the tube was incubated at 37°C for 20 min. Then, 10 μl of 10 mM ATP was added and the tube was incubated at 37°C for another 10 min. The beads were washed 6 times with 900 ul of PNK buffer without DTT for 10 min each time. Some supernatant after the first wash was saved for labeling the membrane described below. The beads were resuspended in 70 μl of SDS-PAGE loading buffer (10 % glycerol (v/v), 50 mM Tris-HCl, pH 6.8, 2 mM EDTA, 2 % SDS (w/v), 100 mM DTT, 0.1 % bromophenol blue), and incubated at 95°C for 5 min to elute the protein-RNA complex and vortexed. The supernatant was separated from the beads on a magnetic particle collector, transferred to a 1.5 ml tube, and stored at −20°C.
The protein-RNA complex was separated on a Novex Bis-Tris 4-12% precast protein gel (ThermoFisher) in MOPS-SDS running buffer (ThermoFisher) at 200 V for 40 min. The crosslinked complex on the gel was transferred using a wet transfer apparatus onto a 0.45 μm nitrocellulose membrane (ThermoFisher) in NuPAGE transfer buffer (Thermofisher) at 100 V for 1 h. The membrane was labeled at 3 corners by spotting 0.5 μl of the radioactive wash collected above, wrapped in plastic film and exposed to a phosphor screen and visualized by a phosphorimager. The image was printed at its original size. The bands corresponding to the Ago-RNA complex of 100-140 kD (Fig 4B) were cut out using a razor blade and further cut into 6 pieces, and transferred to a 1.5 ml low adhesion tube (USA Scientific). Proteinase K (Roche) (400 μl of 5 mg/ml) in Proteinase K Buffer (50 mM Tris-HCl, pH7.5, 6.25 mM EDTA-NaOH, pH8.0, 75 mM NaCl, 1% SDS) were added to the nitrocellulose pieces and the tube was incubated at 55°C with shaking at 1000 rpm for 1.5 h. RNA was extracted by adding 800 μl of acid phenol/chloroform (pH4.5, Ambion) and shaking vigorously. After centrifugation at 13,000 rpm at 4°C for 10 min, the upper aqueous layer was transferred to another tube. This extraction was repeated once. The RNA was then similarly extracted twice with 400 μl of chloroform. After the last extraction, the upper phase was transferred to a new 1.5 ml low adhesion tube. One tenth volume of 3 M NaAc (pH 5.2), 2.5 μg of glycogen (ThermoFisher), and 3 volumes of 100% ethanol were added and mixed. This mixture was stored at −20°C overnight to precipitate RNA. The sample was centrifuged at 14,000 rpm at 4°C for 30 min and the pellet was washed twice with 1 ml of ice cold 75% ethanol. The final pellet was air-dried and dissolved in 15 μl of water.
The RNA sample was used for library preparation with a TruSeq Small RNA Library Preparation Kit (Illumina) following the manufacturer’s protocol. The optimal cycle number for PCR was determined to be 18 (Extended Data Figure 5b) based on the criterion that it should be within the exponential amplification phase of PCR66. After the final PCR and polyacrylamide gel electrophoresis, bands of 135-180 bp (corresponding to 15-60 base RNA) were cut out. DNA was eluted and purified from the bands following the Illumina protocol, and submitted for Illumina sequencing.
Sequencing was performed using a Nextseq 500 sequencer (Illumina) by single-end sequencing of 50 cycles. Reads were trimmed to discard adapters, low-quality reads and reads less than 21 bases long using fastx_clipper version 0.0.13 (http://hannonlab.cshl.edu/fastx_toolkit/). Reads containing the CACCAGC sequence (binding site of the miR-138 seed region) were retained using the “grep” command. These reads were aligned to the human (hg19 version) or mouse (mm10 version) genome, or HSV-1 strain KOS genome (GenBank accession number JQ673480.1) using Tophat2 version 2.1.0 (https://ccb.jhu.edu/software/tophat/index.shtml). Annotation files of 5’ UTR, CDS, and 3’ UTR for human and mouse transcripts were downloaded from the UCSC genome browser in bed format (genome.ucsc.edu). The bed files were converted to gff files by bedtools version 2.27.1 (https://bedtools.readthedocs.io). Read counts for 5’ UTR, CDS, and 3’ UTR of each transcript were determined by Htseq-count version 0.9.1 (https://htseq.readthedocs.io/).
Immunofluorescence assays.
For analysis of Neuro-2a cells and primary TG neurons, cells were fixed in 4% paraformaldehyde (PFA) for 10 min and washed with PBS for 5 min. Cells were permeabilized in 0.1% Triton X-100 in PBS for 10 min and washed with PBS 3 times for 5 min each. Cells were blocked with 1% bovine serum albumin (BSA) in PBS for 1 h at room temperature, and then incubated with primary antibody at 4°C overnight and washed 3 times for 10 min each. The cells were incubated with secondary antibody for 1 h and then with 2 ug/ml DAPI for 10 min before being washed 4 times with PBS for 10 min each. The coverslips were mounted onto microscope slides with anti-fading reagent Fluoromount-G (SouthernBiotech, 0100-01). Images were acquired on a Nikon Eclipse Ti-S inverted microscope with a 100x magnification using the Oplenic software (version X64). Images were analyzed using ImageJ (version 1.52n).
For analysis of mouse TG, uninfected six-week-old male CD-1 mice or mice infected for 3 days were anesthetized with isoflurane, and cardiac perfusion was immediately performed with 30 ml of PBS followed by 30 ml of 4% PFA for fixation. After the mice were fixed on ice for 1 h, TG were dissected and fixed in 4% PFA overnight followed by dehydration in 30% sucrose for at least 24 h. TG were embedded and 10 μm sections were prepared on a CryoStar NX50 Cryostat (ThermoFisher) and plated onto glass microscope slides. TG sections were first immersed in 0.2% Triton X-100 in PBS for 10 min. After 3 washes in PBS for 10 min each, they were blocked in 1% BSA in PBS for 1 h at room temperature and incubated with primary antibody at 4°C overnight. After 3 washes in PBS for 10 min each, they were incubated with secondary antibody for 1 h. DAPI staining, washing, mounting and image acquisition were the same as above except that a 40x magnification was used. The following antibodies and dilutions were used: rabbit anti-Foxc1 (ab227977, Abcam), 1:100; rabbit anti-Oct-1 (ab178869, Abcam), 1:400; mouse anti-Tuj1 antibody (ab78078, Abcam), 1:2000; mouse anti-FLAG antibody (F1804, Sigma), 1:1000; goat anti-mouse IgG Alexa Fluor 488 (Abcam, ab150117), 1:500; and goat anti-rabbit IgG Alexa Fluor 555 (Cell Signaling Technology, 4413s), 1:1000; goat anti-mouse IgG Alexa Fluor 568 (ThermoFisher, A11004), 1:1000; donkey anti-rabbit IgG Alexa Fluor 405 (Abcam, ab175651), 1:1000.
AAV-transduction and HSV-1 infection of primary TG neurons.
The coding sequence of human Foxc1 or its Foxc1delAD mutant was inserted into plasmid AAV-CAG-GFP (Addgene #37825) between AgeI and HindIII restriction enzymes digestion sites. After confirmation of their expression and effects on HSV-1 replication in Neuro-2a cells (data not shown), both plasmids were sent to the company Vigenebio for AAV packaging. Three days after isolation and culture, TG neurons from each well was transduced with AAV containing 7 x 10¹⁰ genome copies. Five days later, the neurons were infected with HSV1GFP at an MOI of 2 or 10, as indicated. 40 μl of supernatant were withdrawn from each well at the time points indicated for virus titration. At 72 hpi. neurons were fixed and analyzed by immunofluorescence assays.
Attachment and nuclear entry assays.
Neuro-2a cells in 6-well plates were transfected with 500 ng/well of pFoxc1delADboth or pFoxc1delID per well using Lipofectamine 3000 (Invitrogen) for 40 h before infection. For infection, the cells were incubated at 4°C for 30 min before addition of virus (MOI = 2) on ice. The cells were incubated at 4°C for 1 h with gentle rocking every 15 min to allow attachment of virus to cells. For analysis of attachment, medium containing virus was removed, and the cells were washed on ice three times with cold PBS before being harvested for viral genome analysis by qPCR (see above). To measure the amounts of virus that entered the nucleus, after the 1 h incubation at 4°C, medium containing virus was removed and replaced with pre-warmed fresh media before the cells were incubated at 37°C for 2 h. The cells (following the 37°C incubation or, as a control, right after attachment at 4°C) were washed once with cold PBS and scraped into 1 ml of cold PBS containing 0.5 mg/ml of proteinase K (Transgen Biotech) and incubated at 4°C for 2 h. Then the cells were washed three times with 1 ml of cold PBS each by centrifugation at 3500 rpm for 3 min followed by replacing the supernatant and resuspension. After the last wash, the cells were centrifuged, and resuspended and then incubated on ice in 1 ml of an ice-cold hypotonic buffer (10 mM HEPES, pH 7.9, 1.5 mM MgCl2, 10 mM KCl, 0.5 mM DTT). The cells were transferred into a 1 ml Dounce homogenizer and subjected to 15 strokes of homogenization using a tight pestle. The cells were transferred to another tube and centrifuged at 5000 rpm and 4°C for 5 min. The supernatant was discarded and the pellet that contains the nuclear fraction was harvested for qPCR analysis of viral genome levels (see above).
Construction of the N2AFoxc1KO cell line by CRISPR/Cas9 technology.
The N2AFoxc1KO cell line was generated using a method described previously 67 and the target sequence, CTGCGGCGTATAAGGCCCGTAGG, corresponding to nt188-210 of the mouse Foxc1 coding region (Fig 7A). Synthetic oligos were designed as described 67 and cloned into the PX459 vector that expresses Cas9 (Addgene). Neuro-2a cells (1.0 × 10⁵) in a 24-well plate were transfected with 200 ng of the resulting plasmid. At 24 h, the supernatant was replaced with fresh media, and the cells were transfected again. At 24 h after the second transfection, the media was replaced with fresh media containing 1 μg/ml puromycin. At 48 h, the cells were washed with PBS and trypsinized. One portion of the cells was used for a T7E1 assay67, which showed successful editing at the desired location (data not shown). The other portion was diluted and seeded in 96-well plates with a density of 0.5 cell/well in the presence of 0.5 μg/ml puromycin. Wells with single cells were labeled after 12 h of complete adherence. When cells were confluent, they were trypsinized and transferred to a 24-well plate for expansion. When the cells were confluent again, a portion was used for further expansion in media with 0.5 μg/ml puromycin. The rest of the cells was used for genomic DNA extraction using the Tissue & Cell Genomic DNA Purification Kit (GeneMark), followed by PCR using primers GAAGTTGATCCGAACGTTCCTC and GTCGAGCGTCCAGTAGCTGC, and then sequencing using these primers. Of the 20 single cell colonies, only one colony gave clean sequencing data, with a deletion of 19 nt (Fig 7A). The expanded cell line was designated N2AFoxc1KO.
Statistical analyses.
Analysis of differentially expressed genes in the RNAseq data was performed using DEseq2 version 1.30.0 (https://bioconductor.org/packages/release/bioc/html/DESeq2.html). Other statistical analyses were performed using GraphPad Prism version 7.00 for Windows, GraphPad Software, La Jolla California USA (www.graphpad.com). All measurements were taken from distinct samples. The tests used are indicated in figure legends.
Extended Data
Extended Data Fig. 1. Additional data about effects of miR-138 on HSV-1 replication.
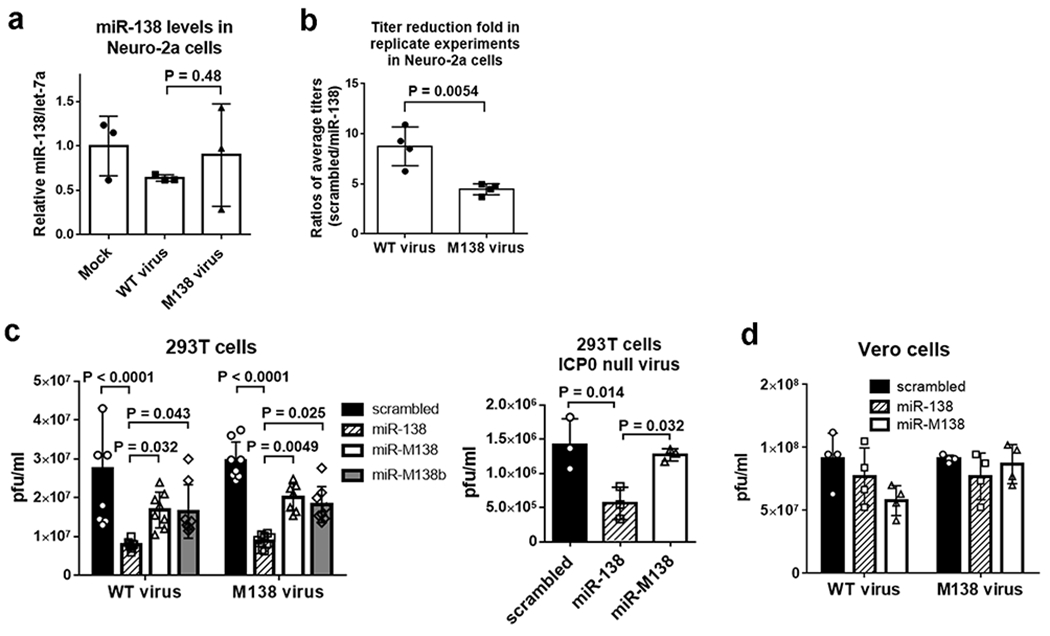
a, Neuro-2a cells were mock-infected or infected with the indicated virus (MOI = 5) for 16 h before qRT-PCR analysis of miR-138 and let-7a levels. b, In 4 independent experiments performed as in Fig. 1b, the ratios of the average titers from scrambled transfected cells over those from miR-138 transfected cells were calculated separately for WT and M138 viruses and plotted. c, 293T cells were transfected with 40 nM miRNA mimic for 16 h, and then infected with WT or M138 virus (left graph), or 7134 (ICP0-null) virus (right graph) for 48 h (MOI = 0.1) before viral titer measurements. d, Same as c, except that Vero cells were infected (MOI = 0.01) and no significant difference was detected between miR-138 and either of the two controls. For b, n = 4 independent experiments. For c, data are combined from 4 independent replicate experiments, each with 4 biologically independent samples per condition (The data from each experiment were first normalized to the value from the LVmiRM138b-WT virus group before being combined), so n = 16 biologically independent samples per condition. For other panels, n = 3 (a, c right), 4 (d) or 8 (c left) biologically independent samples per condition. For all panels, data are presented as mean values ± S.D. and were analyzed by unpaired, two tailed t tests (a, b), two-way (c left, d) or one-way (c right) ANOVA with Bonferroni’s multiple comparisons tests.
Extended Data Fig. 2. Global effects of miR-138 on viral gene expression.
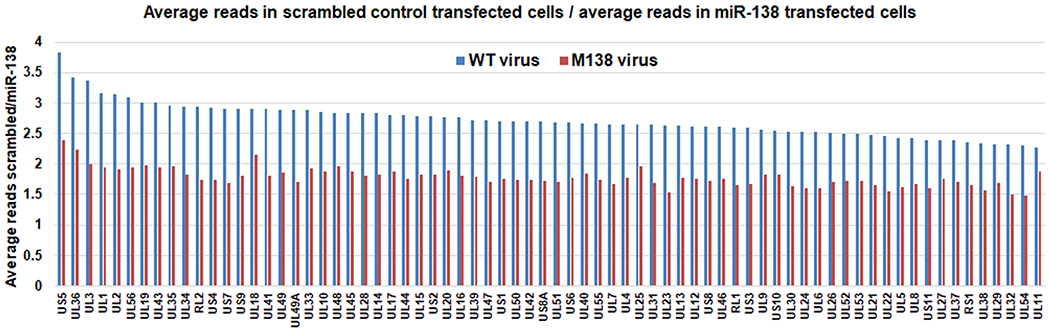
Same experiment as Fig. 1f, but effects on individual viral transcripts are plotted. Blue and red bars represent data for WT and M138 virus, respectively. n = 3 biologically independent samples per condition. Each bar represents the read count mean value for the indicated transcript from scrambled mimic transfected cells (after being normalized to total reads of the sample) divided by that from miR-138 mimic transfected cells.
Extended Data Fig. 3. Expression of miR-138, US11 and US12 from recombinant viruses.
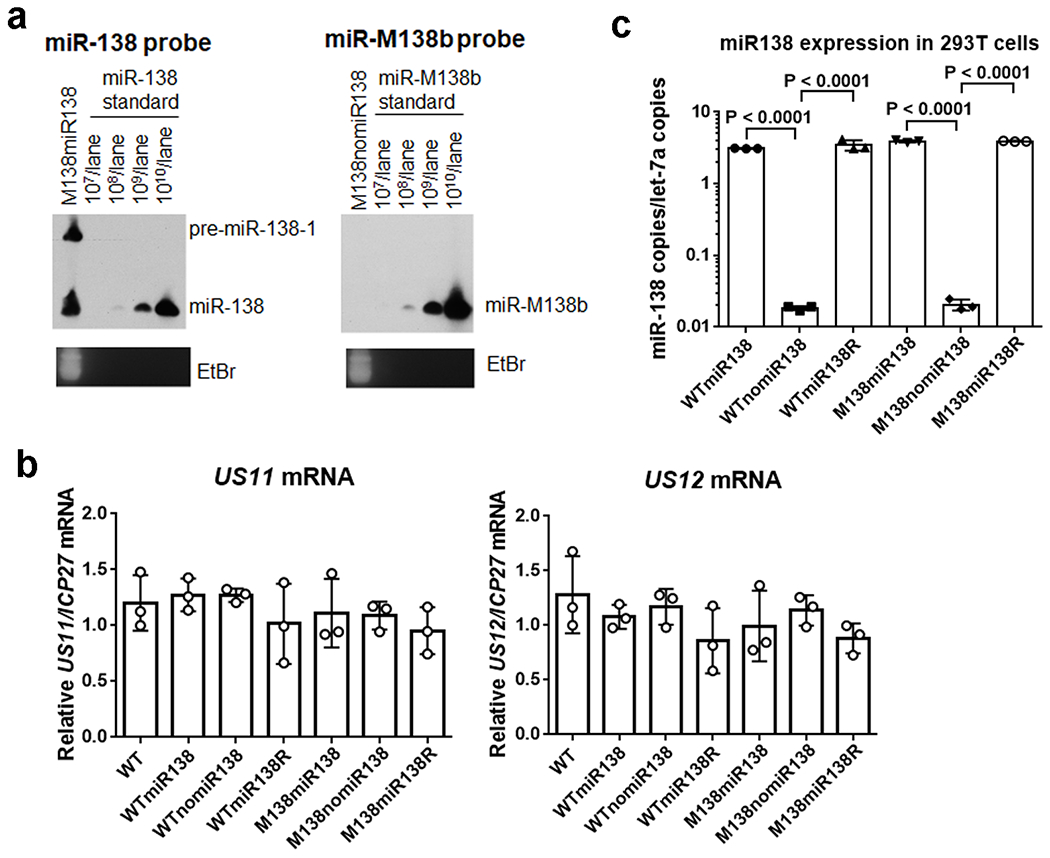
a, 293T cells were infected with M138miR138 or M138nomiR138 virus (MOI = 5). At 8 hpi, the cells were harvested for RNA purification and Northern blot hybridization. RNA from M138miR138 infected cells was run alongside a dilution series of synthetic miR-138 in the gel and hybridized with a miR-138 probe (left panel). RNA from M138nomiR138 infected cells was run alongside a dilution series of synthetic miR-M138b in the gel and hybridized with a miR-M138b probe (right panel). The integrity of RNA from both samples was verified by ethidium bromide staining, which is shown below the Northern blot images for a set of bands ~80 bases. This experiment was performed once. b, Vero cells were infected with the viruses indicated at the bottom at an MOI of 5 and harvested at 8 hpi for qRT-PCR analysis of US11 and US12 mRNA levels normalized to ICP27 mRNA levels. c, miR-138 expression from 293T cells infected by the indicated viruses (MOI = 5, 8 hpi) as measured by qRT-PCR. For b and c, n = 3 biologically independent samples and data are presented as mean values ± S.D. Untransformed (b) or log-transformed (c) data were analyzed by one-way ANOVA with Bonferroni’s multiple comparisons tests.
Extended Data Fig. 4. Additional in vivo data about miR-138 expressing and control recombinant viruses.
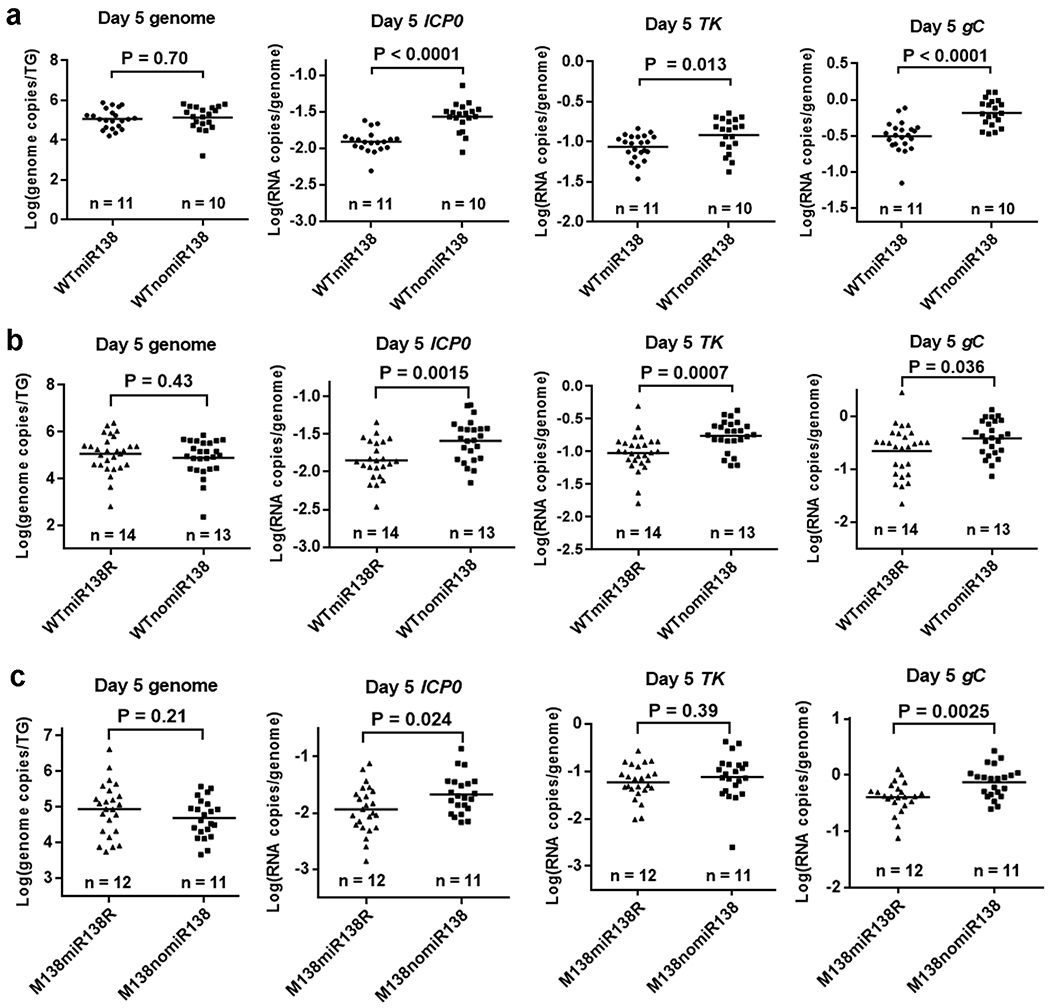
a, Viral DNA and RNA levels in TG infected with WTmiR138 and WTnomiR138 at 5 dpi. The DNA or RNA molecules measured are labeled at the top of each graph. Viruses are indicated at the bottom. Each point represents a value from one TG, and the horizontal lines represent the geometric means. The displayed n numbers represent the numbers of mice used per condition. Data were analyzed by two-tailed, unpaired t tests. b, Same as a, but WTmiR138R and WTnomiR138 are compared. c, Same as a, but M138miR138R and M138nomiR138 are compared.
Extended Data Fig. 5. PAR-CLIP experiments identified viral and host targets of miR-138.
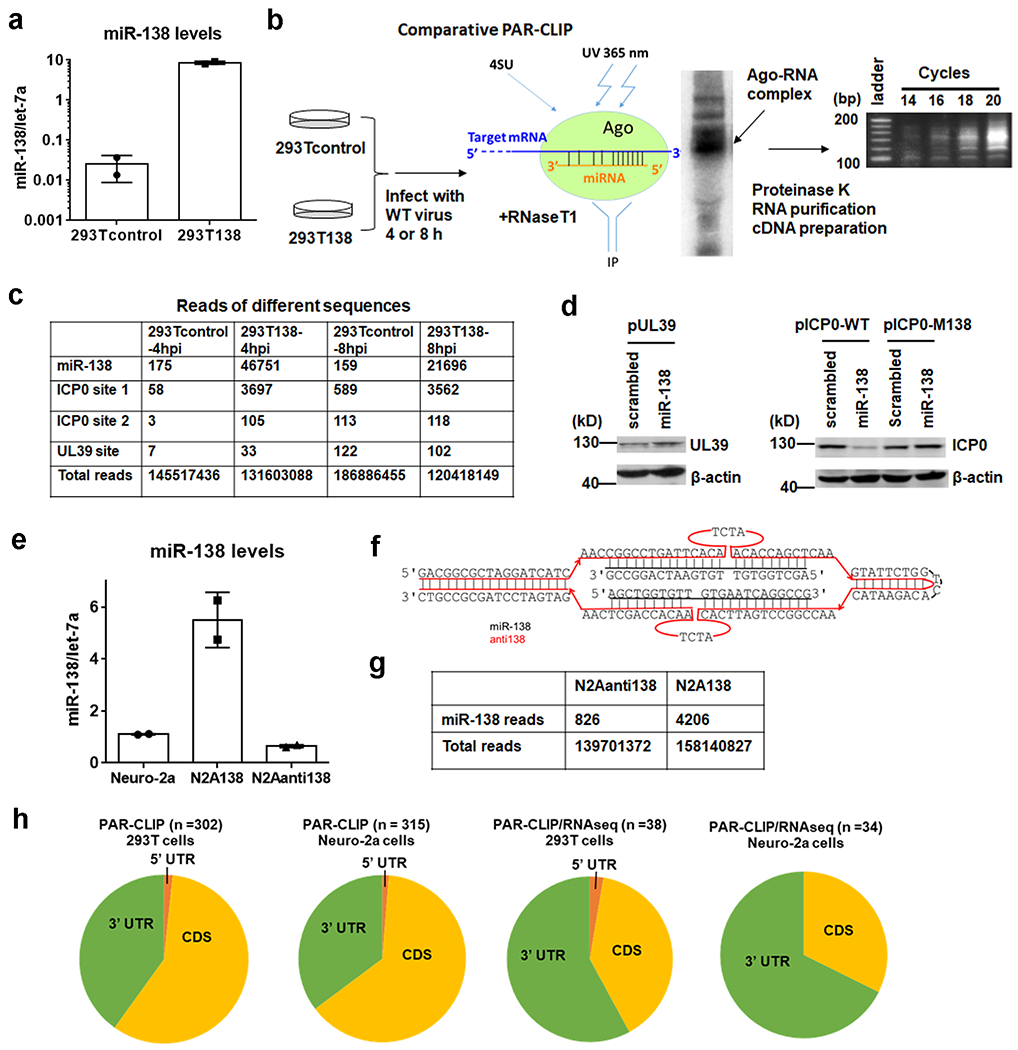
a, miR-138 expression in 293Tcontrol and 293T138 cells. b, PAR-CLIP procedure for detecting viral targets of miR-138 with, from left to right, a schematic showing the samples, a cartoon showing the crosslinking procedure, a representative autoradiograph of an SDS polyacrylamide gel showing a band corresponding to the Ago-RNA complex, the subsequent steps, and an agarose gel showing PCR amplification of the cDNA library. The experiment was performed once. c, Read counts of the indicated sequences from the indicated samples. d, 293T cells were co-transfected with 20 nM miRNA mimic and 100 ng/ml plasmid for 48 h before Western blot analysis of FLAG-tagged UL39 using an anti-FLAG antibody and analysis of ICP0 using an ICP0 antibody. This experiment was repeated once with similar results. e, miR-138 levelsin Neuro-2a, N2A138 and N2Aanti138 cells. f, Diagram showing the “anti138” sequence expressed in N2Aanti138 cells. The sequence has a “tough decoy” secondary structure. Red and black horizontal lines represent anti138 and miR-138, respectively. Curved lines above and below the main structure represent bulges (extra nucleotides not bound to miR-138) designed to prevent cleavage. g, miR-138 and total read counts in the N2A138 and N2Aanti138 cells in a PAR-CLIP experiment. h, Fraction of 5’ UTR, CDS or 3’ UTR sites in total sites identified by the single PAR-CLIP approach (panels 1 and 2) or the combined PAR-CLIP/RNAseq approach (panels 3 and 4) in 293T (panels 1 and 3) and Neuro-2a cells (panels 2 and 4). Relative to the single PAR-CLIP approach, the combined approach identified significantly higher fractions of targets with 3’ UTR sites (P = 0.034 and 0.0006 for 293T and Neuro-2a cells, respectively by Fisher’s exact tests). For a and e, n = 3 biologically independent samples and data are presented as mean values ± S.D.
Extended Data Fig. 6. Low expression of Oct-1 and Foxc1 in mouse TG.
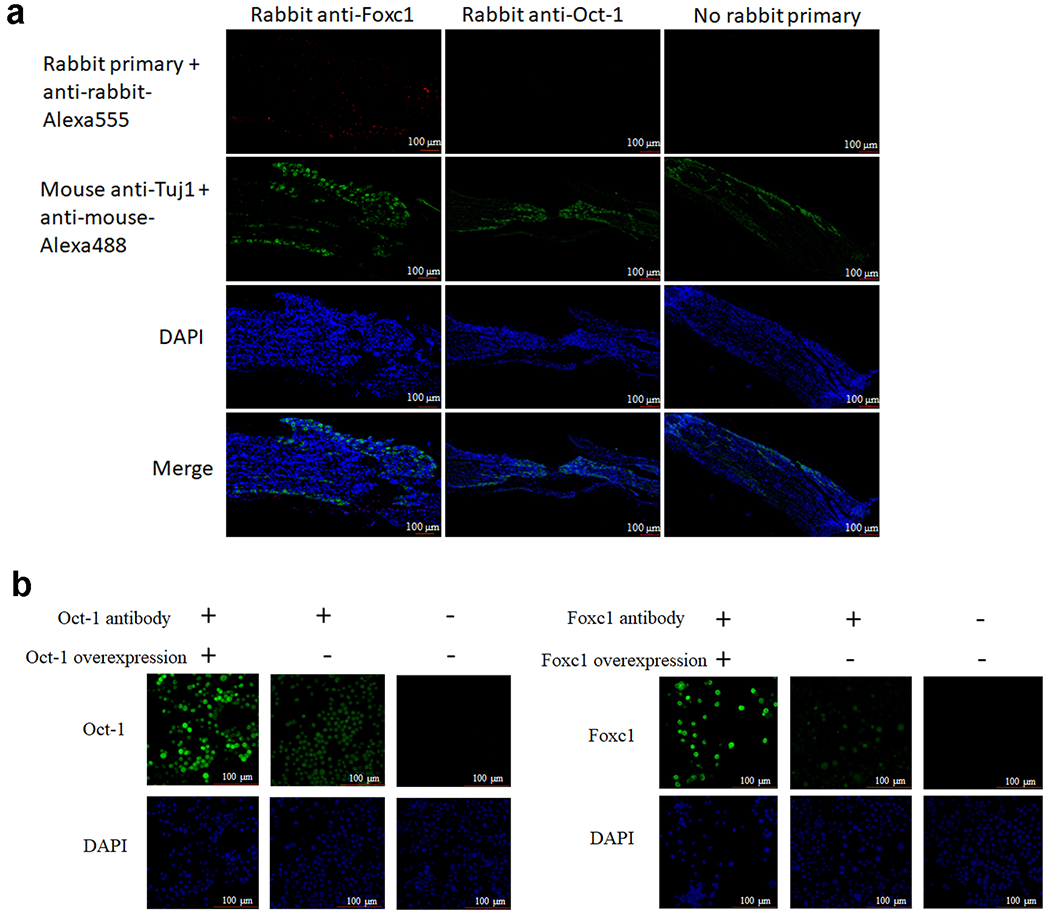
a, Fixed TG cryo-sections were stained using an anti-Foxc1 or anti-Oct-1 rabbit primary antibody (red) or without a rabbit primary antibody (control), stained with a mouse anti-Tuj1 antibody (green), and stained with DAPI (blue). Similar results were obtained for Oct-1 using a different Oct-1 antibody (data not shown). This experiment was repeated twice with similar results. b, Neuro-2a cells were mock-transfected or transfected with 200 ng/ml Oct-1 or Foxc1 expressing plasmid for 48 h. The cells were then fixed and stained with an anti-Oct-1 or anti-Foxc1 antibody (green) or without a primary antibody, and stained with DAPI (blue). This experiment was repeated once with similar results.
Extended Data Fig. 7. Additional results with HSV1Foxc1 and HSV1Foxc1delAD viruses.
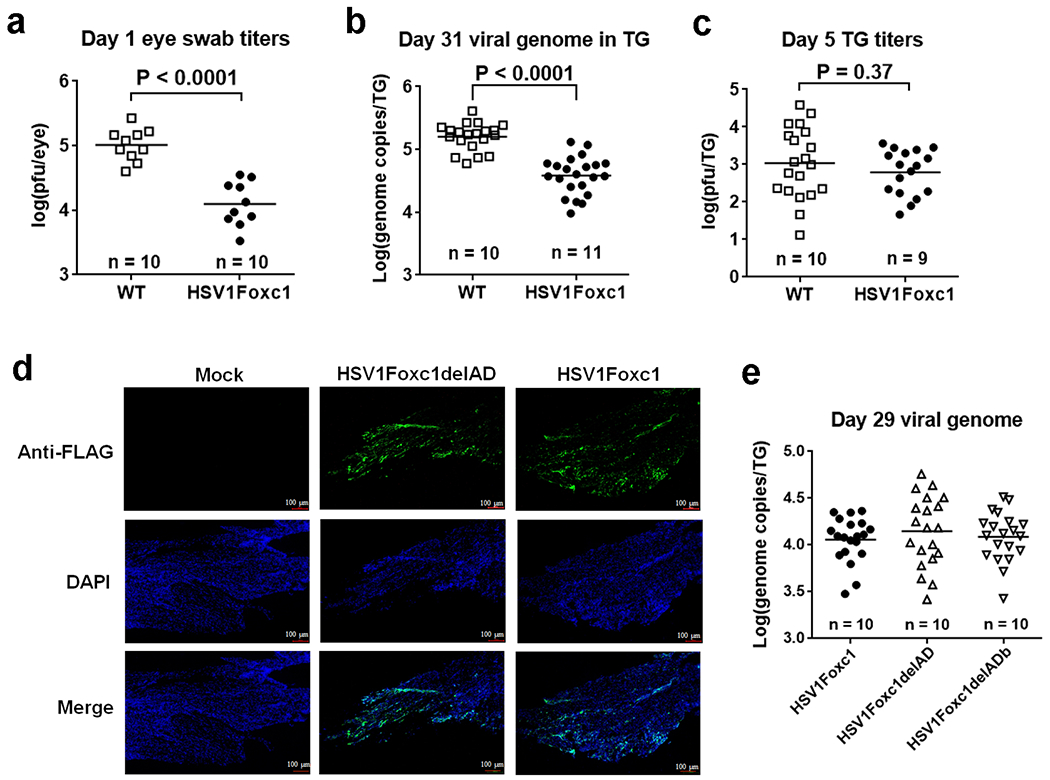
a, Mice were infected on the cornea with 2 x 10⁵ pfu/eye of the indicated viruses. Viral titers in eye swabs collected at 1 dpi were determined. b, Following infection as in a, TG were harvested at 31 dpi and analyzed for viral genome levels normalized to mouse adipsin gene levels by qPCR. c, Following infection as in a, TG were harvested at 5 dpi and viral titers in TG were determined. d, Following mock infection (left) or infection of mice at the cornea with 2 x 10⁵ pfu/eye of HSV1Foxc1delAD (middle) or HSV1Foxc1 (right), fixed TG cryo-sections were stained by DAPI (blue) and an anti-FLAG antibody (green) that can detect FLAG-tagged Foxc1 and Foxc1delAD proteins. This experiment was performed once. e, After corneal inoculation with 2 x 10⁵ pfu/eye of the indicated viruses, mouse TG were harvested at 29 dpi and analyzed for viral genome levels normalized to mouse adipsin gene levels by qPCR. No significant difference was detected in e. For all panels, the n numbers represent the numbers of mice used per condition. The horizontal lines represent geometrical means. Data were analyzed by two-tailed, unpaired t tests (a, b, c) or one-way ANOVA with Bonferroni’s multiple comparisons tests (e) with the P values indicated.
Extended Data Fig. 8. Global effects of Foxc1 on viral gene expression.
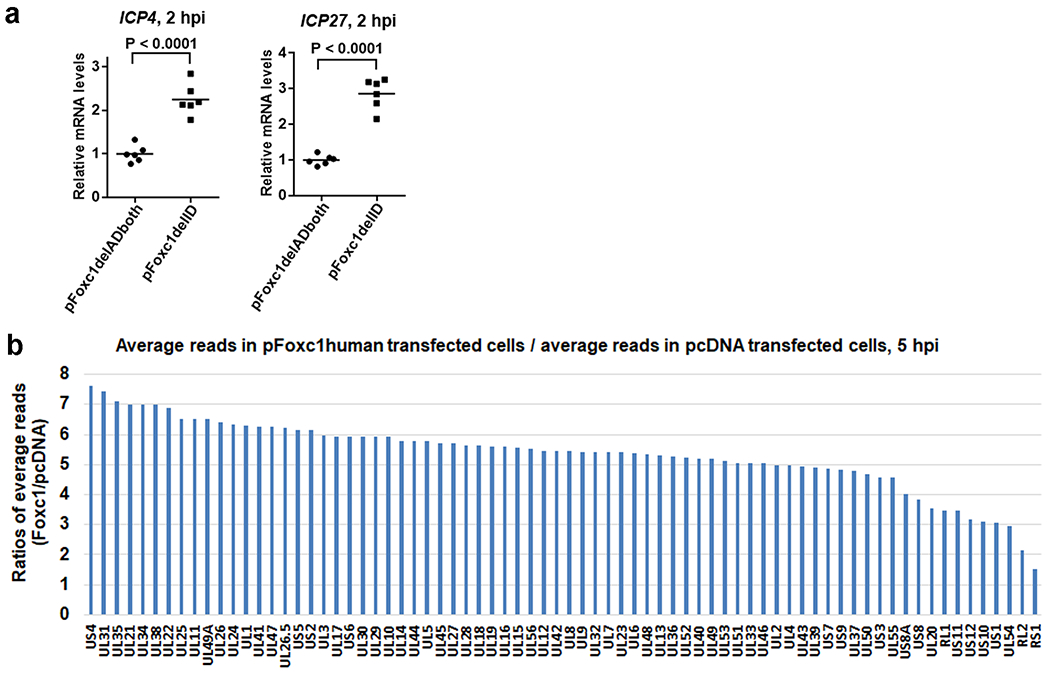
a, Additional data for Fig. 6b. Neuro-2a cells were transfected with 200 ng/ml plasmid for 40 h. KOS was then added (MOI = 2). The cells were incubated at 4°C for 1 h to allow attachment, washed by PBS and incubated at 37°C for 2 h before qRT-PCR analysis for the transcript indicated at the top normalized to host GAPDH levels. n = 6 biologically independent samples. The horizontal lines represent mean values. Data were analyzed by two-tailed, unpaired t tests. b, Neuro-2a cells were transfected with 200 ng/ml pcDNA or pFoxc1human for 40 h and infected with KOS for 5 h at an MOI of 1 before RNAseq analysis. n = 3 biologically independent samples. Each bar represents the mean read count for the indicated transcript from pFoxc1human transfected cells (after being normalized by total reads from that sample) divided by that from pcDNA transfected cells.
Extended Data Fig. 9. Foxc1 is important for HSV-1 replication and gene expression.
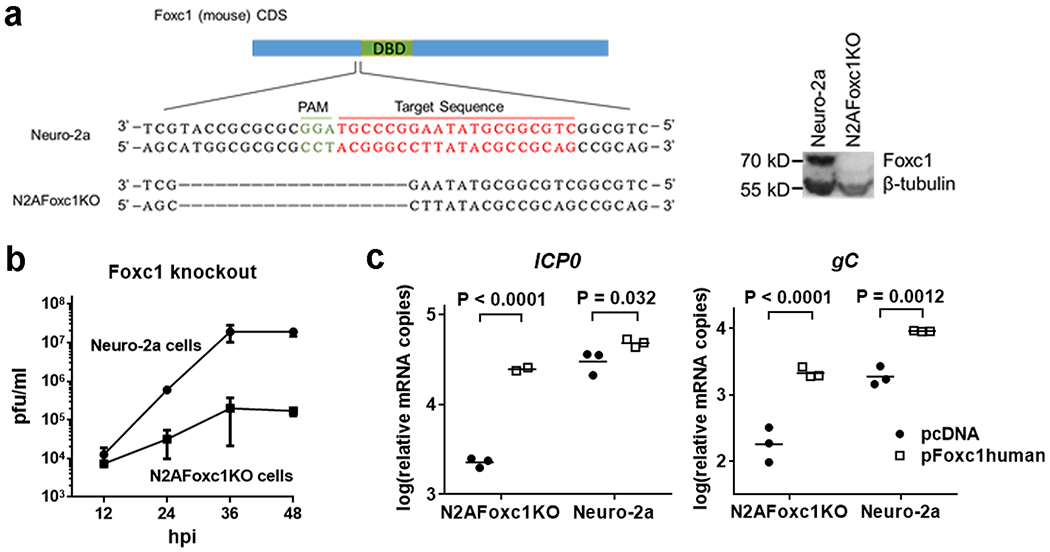
a, Left, Foxc1 CDS is depicted as a blue box with the DBD in green. Expanded below is the region of deletion in N2AFoxc1KO cells, showing sequences in WT and KO cell lines. The PAM sequence required for guide RNA target recognition is shown in green and the target sequence in red. Right, expression of Foxc1 relative to β-tubulin (loading control) in Neuro-2a and N2AFoxc1KO cells was analyzed by Western blots. This experiment was repeated twice with similar results. b, Neuro-2a and N2AFoxc1KO cells were infected with KOS (MOI = 0.5) for the indicated times. Mean viral titers ± S.D. are shown. c, Additional data for Fig. 6e. N2AFoxc1KO or Neuro-2a cells were transfected with 400 ng/ml pcDNA or pFoxc1human. 40 h later, the cells were infected with KOS for 5 h at an MOI of 1 before qRT-PCR analyses of the transcript indicated at the top. Horizontal lines represent geometrical means. Data were analyzed by two-way ANOVA with Bonferroni’s multiple comparisons tests. For b and c, n = 3 biological independent samples per condition.
Extended Data Fig. 10. Foxc1 reduced heterochromatin associated with viral genes.
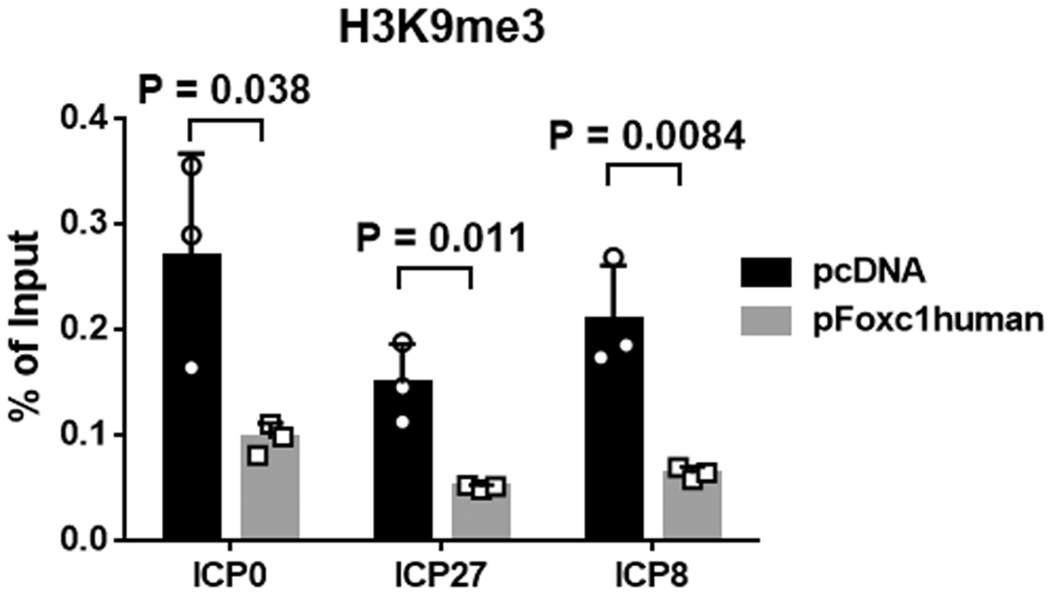
Neuro-2a cells were transfected with 500 ng/ml pcDNA or pFoxc1human, as indicated, for 40 h and infected with KOS for 2 h (MOI = 2) before ChIP-qPCR analysis for association of H3K9me3 with the genes indicated at the bottom. n = 3 biologically independent samples. Mean values ± S.D. are shown. Data were analyzed by two-way ANOVA with Bonferroni’s multiple comparisons tests.
Supplementary Material
Acknowledgments
We thank Bryan Cullen, Clinton Jones and Shun-Hua Chen for generous provision of plasmids, Kristina Holton in Harvard Medical School Research Computing for help with sequencing data analysis, and the Core Facility of Zhejiang University School of Medicine and the Biopolymers Next-Gen Sequencing Core Facility at Harvard Medical School for expertise and instrument availability. This work was supported by the National Key R & D program of China [2017YFC1200204 to D.P.]; the National Natural Science Foundation of China [81671993 to D.P.]; Natural Science Foundation of Zhejiang Province, China [LR18H190001 to D.P.]; the National Institutes of Health [P01 AI098681 to D.M.C. and D.M.K.]; an NSERC Postgraduate Fellowship and a Peter and Carolyn Lynch Foundation Fellowship [to A.H.M.N.]; the National Human Genome Research Institute [RM1 HG008525 to G.M.C.]; and the Blavatnik Biomedical Accelerator at Harvard University [to G.M.C.].
Footnotes
Conflict of Interest
A.H.M.N. and G.M.C. are inventors on patents filed by the Presidents and Fellows of Harvard College. Full disclosure of G.M.C. is available on http://arep.med.harvard.edu/gmc/tech.html. A.H.M.N. and G.M.C. are co-founders and have equity in GC Therapeutics, Inc. Other authors declare that they have no conflict of interest.
Data Availability
Raw high-throughput sequencing data for RNAseq (Figs. 1g, 3; Extended Data Figs. 2, 8b) and PAR-CLIP (Fig. 3 and Extended Data Fig. 5) experiments have been deposited to the Gene Expression Omnibus (https://www.ncbi.nlm.nih.gov/geo) and assigned the identifier GSE127504. HSV-1 strain KOS genome sequence and annotation were obtained from GenBank with accession number JQ673480.1. Human (hg19 version) and mouse (mm10 version) genome sequences and annotations were downloaded from the Harvard Medical School Research Computing server (https://rc.hms.harvard.edu). Original uncropped Western blot images and numerical data with statistical analysis for all figures are provided as source data.
References
- 1.Bartel DP Metazoan microRNAs. Cell 173, 20–51 (2018). [DOI] [PMC free article] [PubMed] [Google Scholar]
- 2.Ebert MS & Sharp PA Roles for microRNAs in conferring robustness to biological processes. Cell 149, 515–524 (2012). [DOI] [PMC free article] [PubMed] [Google Scholar]
- 3.Guo YE & Steitz JA Virus meets host microRNA: the destroyer, the booster, the hijacker. Mol Cell Biol 34, 3780–3787 (2014). [DOI] [PMC free article] [PubMed] [Google Scholar]
- 4.Bruscella P et al. Viruses and miRNAs: More Friends than Foes. Front Microbiol 8, 824 (2017). [DOI] [PMC free article] [PubMed] [Google Scholar]
- 5.Girardi E, Lopez P & Pfeffer S On the Importance of Host MicroRNAs During Viral Infection. Front Genet 9, 439 (2018). [DOI] [PMC free article] [PubMed] [Google Scholar]
- 6.Skalsky RL & Cullen BR Viruses, microRNAs, and host interactions. Annu Rev Microbiol 64, 123–141 (2010). [DOI] [PMC free article] [PubMed] [Google Scholar]
- 7.Roizman B, Knipe DM & Whitley RJ in Fields Virology Sixth Edition (eds Knipe DM et al. ) 1823–1897 (Lippincott Williams & Wilkins, 2013). [Google Scholar]
- 8.Wysocka J & Herr W The herpes simplex virus VP16-induced complex: the makings of a regulatory switch. Trends Biochem Sci 28, 294–304 (2003). [DOI] [PubMed] [Google Scholar]
- 9.Nogueira ML, Wang VE, Tantin D, Sharp PA & Kristie TM Herpes simplex virus infections are arrested in Oct-1-deficient cells. Proc Natl Acad Sci U S A 101, 1473–1478 (2004). [DOI] [PMC free article] [PubMed] [Google Scholar]
- 10.Cai W & Schaffer PA Herpes simplex virus type 1 ICP0 regulates expression of immediate-early, early, and late genes in productively infected cells. J Virol 66, 2904–2915 (1992). [DOI] [PMC free article] [PubMed] [Google Scholar]
- 11.Lee JS, Raja P & Knipe DM Herpesviral ICP0 Protein Promotes Two Waves of Heterochromatin Removal on an Early Viral Promoter during Lytic Infection. MBio 7, e02007–02015 (2016). [DOI] [PMC free article] [PubMed] [Google Scholar]
- 12.Oh J & Fraser NW Temporal association of the herpes simplex virus genome with histone proteins during a lytic infection. J Virol 82, 3530–3537 (2008). [DOI] [PMC free article] [PubMed] [Google Scholar]
- 13.Cliffe AR & Knipe DM Herpes simplex virus ICP0 promotes both histone removal and acetylation on viral DNA during lytic infection. J Virol 82, 12030–12038 (2008). [DOI] [PMC free article] [PubMed] [Google Scholar]
- 14.Herrera FJ & Triezenberg SJ VP16-dependent association of chromatin-modifying coactivators and underrepresentation of histones at immediate-early gene promoters during herpes simplex virus infection. J Virol 78, 9689–9696 (2004). [DOI] [PMC free article] [PubMed] [Google Scholar]
- 15.Kwiatkowski DL, Thompson HW & Bloom DC The polycomb group protein Bmi1 binds to the herpes simplex virus 1 latent genome and maintains repressive histone marks during latency. J Virol 83, 8173–8181 (2009). [DOI] [PMC free article] [PubMed] [Google Scholar]
- 16.Cliffe AR, Coen DM & Knipe DM Kinetics of facultative heterochromatin and polycomb group protein association with the herpes simplex viral genome during establishment of latent infection. MBio 4, e00590–00512 (2013). [DOI] [PMC free article] [PubMed] [Google Scholar]
- 17.Raja P et al. A herpesviral lytic protein regulates the structure of latent viral chromatin. MBio 7, e00633 (2016). [DOI] [PMC free article] [PubMed] [Google Scholar]
- 18.Cliffe AR, Garber DA & Knipe DM Transcription of the herpes simplex virus latency-associated transcript promotes the formation of facultative heterochromatin on lytic promoters. J Virol 83, 8182–8190 (2009). [DOI] [PMC free article] [PubMed] [Google Scholar]
- 19.Wang QY et al. Herpesviral latency-associated transcript gene promotes assembly of heterochromatin on viral lytic-gene promoters in latent infection. Proc Natl Acad Sci U S A 102, 16055–16059 (2005). [DOI] [PMC free article] [PubMed] [Google Scholar]
- 20.Umbach JL et al. MicroRNAs expressed by herpes simplex virus 1 during latent infection regulate viral mRNAs. Nature 454, 780–783 (2008). [DOI] [PMC free article] [PubMed] [Google Scholar]
- 21.Jurak I et al. Numerous conserved and divergent microRNAs expressed by herpes simplex viruses 1 and 2. J Virol 84, 4659–4672 (2010). [DOI] [PMC free article] [PubMed] [Google Scholar]
- 22.Kim JY, Mandarino A, Chao MV, Mohr I & Wilson AC Transient reversal of episome silencing precedes VP16-dependent transcription during reactivation of latent HSV-1 in neurons. PLoS Pathog 8, e1002540 (2012). [DOI] [PMC free article] [PubMed] [Google Scholar]
- 23.Linderman JA et al. Immune Escape via a Transient Gene Expression Program Enables Productive Replication of a Latent Pathogen. Cell Rep 18, 1312–1323 (2017). [DOI] [PMC free article] [PubMed] [Google Scholar]
- 24.Du T, Zhou G & Roizman B HSV-1 gene expression from reactivated ganglia is disordered and concurrent with suppression of latency-associated transcript and miRNAs. Proc Natl Acad Sci U S A 108, 18820–18824 (2011). [DOI] [PMC free article] [PubMed] [Google Scholar]
- 25.Thompson RL, Preston CM & Sawtell NM De novo synthesis of VP16 coordinates the exit from HSV latency in vivo. PLoS Pathog 5, e1000352 (2009). [DOI] [PMC free article] [PubMed] [Google Scholar]
- 26.Pan D et al. A neuron-specific host microRNA targets herpes simplex virus-1 ICP0 expression and promotes latency. Cell Host Microbe 15, 446–456 (2014). [DOI] [PMC free article] [PubMed] [Google Scholar]
- 27.Bogerd HP et al. Replication of many human viruses is refractory to inhibition by endogenous cellular microRNAs. J Virol 88, 8065–8076 (2014). [DOI] [PMC free article] [PubMed] [Google Scholar]
- 28.Pan D & Coen DM Quantification and analysis of thymidine kinase expression from acyclovir-resistant G-string insertion and deletion mutants in herpes simplex virus-infected cells. J Virol 86, 4518–4526 (2012). [DOI] [PMC free article] [PubMed] [Google Scholar]
- 29.Cai WZ & Schaffer PA Herpes simplex virus type 1 ICP0 plays a critical role in the de novo synthesis of infectious virus following transfection of viral DNA. J Virol 63, 4579–4589 (1989). [DOI] [PMC free article] [PubMed] [Google Scholar]
- 30.Pan D et al. Herpes simplex virus 1 lytic infection blocks microRNA (miRNA) biogenesis at the stage of nuclear export of pre-miRNAs. MBio 10, e02856–02818 (2019). [DOI] [PMC free article] [PubMed] [Google Scholar]
- 31.Haraguchi T, Ozaki Y & Iba H Vectors expressing efficient RNA decoys achieve the long-term suppression of specific microRNA activity in mammalian cells. Nucleic Acids Res 37, e43 (2009). [DOI] [PMC free article] [PubMed] [Google Scholar]
- 32.Gilding LN & Somervaille TCP The Diverse Consequences of FOXC1 Deregulation in Cancer. Cancers (Basel) 11 (2019). [DOI] [PMC free article] [PubMed] [Google Scholar]
- 33.Berry FB, Saleem RA & Walter MA FOXC1 transcriptional regulation is mediated by N- and C-terminal activation domains and contains a phosphorylated transcriptional inhibitory domain. J Biol Chem 277, 10292–10297 (2002). [DOI] [PubMed] [Google Scholar]
- 34.Wang W, Zhao LJ, Tan YX, Ren H & Qi ZT MiR-138 induces cell cycle arrest by targeting cyclin D3 in hepatocellular carcinoma. Carcinogenesis 33, 1113–1120 (2012). [DOI] [PMC free article] [PubMed] [Google Scholar]
- 35.Sossey-Alaoui K & Plow EF miR-138-Mediated Regulation of KINDLIN-2 Expression Modulates Sensitivity to Chemotherapeutics. Mol Cancer Res 14, 228–238 (2016). [DOI] [PMC free article] [PubMed] [Google Scholar]
- 36.Huang H et al. MIR-138-5P inhibits the progression of prostate cancer by targeting FOXC1. Mol Genet Genomic Med 8, e1193 (2020). [DOI] [PMC free article] [PubMed] [Google Scholar]
- 37.Yu C et al. MicroRNA-138-5p regulates pancreatic cancer cell growth through targeting FOXC1. Cell Oncol (Dordr) 38, 173–181 (2015). [DOI] [PMC free article] [PubMed] [Google Scholar]
- 38.Bai X et al. Inhibition of lung cancer growth and metastasis by DHA and its metabolite, RvD1, through miR-138-5p/FOXC1 pathway. J Exp Clin Cancer Res 38, 479 (2019). [DOI] [PMC free article] [PubMed] [Google Scholar]
- 39.Siegel G et al. A functional screen implicates microRNA-138-dependent regulation of the depalmitoylation enzyme APT1 in dendritic spine morphogenesis. Nat Cell Biol 11, 705–716 (2009). [DOI] [PMC free article] [PubMed] [Google Scholar]
- 40.Wang X et al. MicroRNA-138 promotes tau phosphorylation by targeting retinoic acid receptor alpha. FEBS Lett 589, 726–729 (2015). [DOI] [PubMed] [Google Scholar]
- 41.Yeh YM, Chuang CM, Chao KC & Wang LH MicroRNA-138 suppresses ovarian cancer cell invasion and metastasis by targeting SOX4 and HIF-1alpha. Int J Cancer 133, 867–878 (2013). [DOI] [PubMed] [Google Scholar]
- 42.Acharya M, Huang L, Fleisch VC, Allison WT & Walter MA A complex regulatory network of transcription factors critical for ocular development and disease. Hum Mol Genet 20, 1610–1624 (2011). [DOI] [PubMed] [Google Scholar]
- 43.Iwafuchi-Doi M et al. The Pioneer Transcription Factor FoxA Maintains an Accessible Nucleosome Configuration at Enhancers for Tissue-Specific Gene Activation. Mol Cell 62, 79–91 (2016). [DOI] [PMC free article] [PubMed] [Google Scholar]
- 44.O’Connor CM, Vanicek J & Murphy EA Host microRNA regulation of human cytomegalovirus immediate early protein translation promotes viral latency. J Virol 88, 5524–5532 (2014). [DOI] [PMC free article] [PubMed] [Google Scholar]
- 45.Trobaugh DW et al. RNA viruses can hijack vertebrate microRNAs to suppress innate immunity. Nature 506, 245–248 (2014). [DOI] [PMC free article] [PubMed] [Google Scholar]
- 46.Ruelas DS et al. MicroRNA-155 Reinforces HIV Latency. J Biol Chem 290, 13736–13748 (2015). [DOI] [PMC free article] [PubMed] [Google Scholar]
- 47.Jopling CL, Yi M, Lancaster AM, Lemon SM & Sarnow P Modulation of hepatitis C virus RNA abundance by a liver-specific MicroRNA. Science 309, 1577–1581 (2005). [DOI] [PubMed] [Google Scholar]
- 48.Mulik S et al. Role of miR-132 in angiogenesis after ocular infection with herpes simplex virus. Am J Pathol 181, 525–534 (2012). [DOI] [PMC free article] [PubMed] [Google Scholar]
- 49.Bhela S et al. Critical role of microRNA-155 in herpes simplex encephalitis. J Immunol 192, 2734–2743 (2014). [DOI] [PMC free article] [PubMed] [Google Scholar]
- 50.Ingle H et al. The microRNA miR-485 targets host and influenza virus transcripts to regulate antiviral immunity and restrict viral replication. Sci Signal 8, ra126 (2015). [DOI] [PubMed] [Google Scholar]
- 51.Sawtell NM & Thompson RL De Novo Herpes Simplex Virus VP16 Expression Gates a Dynamic Programmatic Transition and Sets the Latent/Lytic Balance during Acute Infection in Trigeminal Ganglia. PLoS Pathog 12, e1005877 (2016). [DOI] [PMC free article] [PubMed] [Google Scholar]
- 52.Tal-Singer R et al. The transcriptional activation domain of VP16 is required for efficient infection and establishment of latency by HSV-1 in the murine peripheral and central nervous systems. Virology 259, 20–33 (1999). [DOI] [PubMed] [Google Scholar]
- 53.Stern S, Tanaka M & Herr W The Oct-1 homoeodomain directs formation of a multiprotein-DNA complex with the HSV transactivator VP16. Nature 341, 624–630 (1989). [DOI] [PubMed] [Google Scholar]
- 54.Whitlow Z & Kristie TM Recruitment of the transcriptional coactivator HCF-1 to viral immediate-early promoters during initiation of reactivation from latency of herpes simplex virus type 1. J Virol 83, 9591–9595 (2009). [DOI] [PMC free article] [PubMed] [Google Scholar]
- 55.Kolb G & Kristie TM Association of the cellular coactivator HCF-1 with the Golgi apparatus in sensory neurons. J Virol 82, 9555–9563 (2008). [DOI] [PMC free article] [PubMed] [Google Scholar]
- 56.Elliott G & O’Hare P Equine herpesvirus 1 gene 12, the functional homologue of herpes simplex virus VP16, transactivates via octamer sequences in the equine herpesvirus IE gene promoter. Virology 213, 258–262 (1995). [DOI] [PubMed] [Google Scholar]
- 57.Katzenell S, Cabrera JR, North BJ & Leib DA Isolation, Purification, and Culture of Primary Murine Sensory Neurons. Methods Mol Biol 1656, 229–251 (2017). [DOI] [PMC free article] [PubMed] [Google Scholar]
- 58.Alex H. M. Ng, P.K., Jesus Eduardo Rojo Arias,Wang Kai, Swiersy Anka, Shipman Seth L., Appleton Evan, Kiaee Kiavash, Pasquini Giovanni, Kohman Richie E., Vernet Andyna, Dysart Matthew, Leeper Kathleen, Huang Jeremy Y., Graveline Amanda, Taipale Jussi, Hill David E., Saylor Wren, Vidal Marc, Melero-Martin Juan M., Busskamp Volker, Church George M.. A comprehensive library of human transcription factors for cell fate engineering. Nat Biotechnol (2020). [DOI] [PMC free article] [PubMed] [Google Scholar]
- 59.Tischer BK, von Einem J, Kaufer B & Osterrieder N Two-step red-mediated recombination for versatile high-efficiency markerless DNA manipulation in Escherichia coli. Biotechniques 40, 191–197 (2006). [DOI] [PubMed] [Google Scholar]
- 60.Sen J, Liu X, Roller R & Knipe DM Herpes simplex virus US3 tegument protein inhibits Toll-like receptor 2 signaling at or before TRAF6 ubiquitination. Virology 439, 65–73 (2013). [DOI] [PMC free article] [PubMed] [Google Scholar]
- 61.Heckman KL & Pease LR Gene splicing and mutagenesis by PCR-driven overlap extension. Nat Protoc 2, 924–932 (2007). [DOI] [PubMed] [Google Scholar]
- 62.Sinani D, Cordes E, Workman A, Thunuguntia P & Jones C Stress-induced cellular transcription factors expressed in trigeminal ganglionic neurons stimulate the herpes simplex virus 1 ICP0 promoter. J Virol 87, 13042–13047 (2013). [DOI] [PMC free article] [PubMed] [Google Scholar]
- 63.Chen SH et al. Suppression of transcription factor early growth response 1 reduces herpes simplex virus lethality in mice. J Clin Invest 118, 3470–3477 (2008). [DOI] [PMC free article] [PubMed] [Google Scholar]
- 64.Pan D, Pesola JM, Li G, McCarron S & Coen DM Mutations inactivating herpes simplex virus 1 microRNA miR-H2 do not detectably increase ICP0 gene expression in infected cultured cells or mouse trigeminal ganglia. J Virol 91 (2017). [DOI] [PMC free article] [PubMed] [Google Scholar]
- 65.Gottwein E & Cullen BR A human herpesvirus microRNA inhibits p21 expression and attenuates p21-mediated cell cycle arrest. J Virol 84, 5229–5237 (2010). [DOI] [PMC free article] [PubMed] [Google Scholar]
- 66.Danan C, Manickavel S & Hafner M PAR-CLIP: A Method for Transcriptome-Wide Identification of RNA Binding Protein Interaction Sites. Methods Mol Biol 1358, 153–173 (2016). [DOI] [PMC free article] [PubMed] [Google Scholar]
- 67.Ran FA et al. Genome engineering using the CRISPR-Cas9 system. Nat Protoc 8, 2281–2308 (2013). [DOI] [PMC free article] [PubMed] [Google Scholar]
Associated Data
This section collects any data citations, data availability statements, or supplementary materials included in this article.
Supplementary Materials
Data Availability Statement
Raw high-throughput sequencing data for RNAseq (Figs. 1g, 3; Extended Data Figs. 2, 8b) and PAR-CLIP (Fig. 3 and Extended Data Fig. 5) experiments have been deposited to the Gene Expression Omnibus (https://www.ncbi.nlm.nih.gov/geo) and assigned the identifier GSE127504. HSV-1 strain KOS genome sequence and annotation were obtained from GenBank with accession number JQ673480.1. Human (hg19 version) and mouse (mm10 version) genome sequences and annotations were downloaded from the Harvard Medical School Research Computing server (https://rc.hms.harvard.edu). Original uncropped Western blot images and numerical data with statistical analysis for all figures are provided as source data.