Abstract
Recent publications show that classic hepatoblastoma (HBL) is the result of failure of hepatic stem cells to differentiate into hepatocytes; while hepatocellular carcinoma (HCC) is caused by the de-differentiation of hepatocytes into Cancer Stem Cells (CSCs). However, the mechanisms of aggressive HBL and mechanisms that cause de-differentiation of hepatocytes into CSCs are unknown. We found that, similar to HCC but opposite to classic HBL, aggressive HBL is the result of de CSCs. In both cases of liver cancer, the de-phosphorylation of tumor suppressor protein, C/EBPα, at Ser193 (Ser190 in human protein) or mutation of Ser193 to Ala results in a modified protein with oncogenic activities. We have investigated liver cancer in a mouse model C/EBPα-S193A, in a large cohort of human HBL samples and in Pten/p53 double knockout mice and found that these cancers are characterized by elevation of C/EBPα that is dephosphorylated at Ser190/193. We found that de-ph-C/EBPα creates pre-neoplastic foci with CSC that give rise to HCC and aggressive HBL. C/EBPα-dependent de-differentiation of hepatocytes into CSCs includes increased proliferation of hepatocytes followed by generation of multi-nucleated hepatocytes and subsequent appearance of hepatocytes with DLK1-positive intra-nuclear inclusions. We further isolated C/EBPα-dependent multi-nucleated hepatocytes and found that they possess characteristics of tumor initiating cells, including elevation of stem cell markers. C/EBPα-dependent CSCs are observed in patients with aggressive hepatoblastoma and in patients with a predisposition for liver cancer.
Conclusion:
The earliest steps of adult HCC and aggressive pediatric liver cancer have identical features that include the conversion of the tumor suppressor C/EBPα into an oncogenic isoform which further creates pre-neoplastic foci where hepatocytes de-differentiate into cancer cells, giving rise to liver cancer.
Keywords: Liver cancer, hepatocytes, stem cells, C/EBPα
Introduction
The origin of liver cancer is under intensive investigations; however, little is known about tumor originating cell types and mechanisms which initiate liver cancer. Early studies of hepatocellular carcinoma (HCC) suggested that progenitor cells give rise to liver cancer. Expansion of progenitor cells was found in mice with alterations of the Hippo pathway1 and with liver specific deletion of NF2.2 In addition, He et al have identified progenitor cells that form collagenase-resistant aggregates at very early stages of liver cancer3 suggesting that these progenitor cells give rise to liver cancer. However, recent studies demonstrated that HCC is quite heterogeneous suggesting several different cell origins for the development of liver cancer.4 Due to their capacity of proliferate, and their remarkable plasticity to de-differentiate into other cell types, hepatocytes have great potentials to initiate liver cancer.5 In fact, a recent paper showed that hepatocytes are the main cells of origin of the hepatotoxin-induced liver cancer.6 The loss of p53 also resulted in de-differentiation of hepatocytes into progenitor-like cells.7 In addition, adult hepatocytes might trans-differentiate into biliary–like cells that produce liver cancer.8 The development of liver cancer involves alterations of gene expression within multiple pathways.9–11 The quiescent liver does not proliferate5 and is protected from liver cancer by more than 20 tumor suppressor proteins (TSPs).12 However, many reports revealed that TSPs are reduced in cancer by transcriptional repression13 or by degradation through the Ubiquitin Proteasome System.11–12 Interestingly, recent reports show that TSPs are elevated in some cancers. For example, C/EBPα is elevated in some patients with HCC.14,16 The activity of C/EBPα is regulated by phosphorylation at Ser193 (Ser190 in human protein).11,16,17 Phosphorylation of C/EBPα at Ser193 enhances its tumor suppressor activities.18,19 However, ph-Ser193 C/EBPα is eliminated by oncogene Gankyrin (Gank) during the development of liver cancer.19–21 We recently generated C/EBPα-S193A mice and found that S193A livers lost mechanisms to stop liver proliferation.22, 23 Pediatric liver cancer is far less investigated than HCC. Several reports described transcriptome profiling in large cohorts of HBL patients24–27. These studies revealed the significant role of c-myc and Wnt-β-catenin signaling and micro-RNAs in development of HBL;24,25,26 however HBL is a genetically simple tumor with 2.9 mutations per tumor mainly in β-catenin and NFE2L2 genes.27 We also found that the FXR-Gank-tumor suppressor axis plays an essential role in the development of HBL.21
In this manuscript, we examined activities of a de-phosphorylated form of tumor suppressor protein, C/EBPα, which is elevated in aggressive, chemotherapy resistant, HBL. The de-phosphorylation of mouse and human C/EBPα at Ser193/Ser190 converts this tumor suppressor into a protein with oncogenic activities. The oncogenic form of C/EBPα creates pre-neoplastic foci and initiates transformation of hepatocytes into stem-like cells within these foci. These mechanisms of liver cancer work in aggressive HBL and in HCC.
Materials and Methods
Animal models:
Experiments with animals were approved by the Institutional Animal Care and Use Committee (IACUC) at Cincinnati Children’s Hospital (protocol IACUC2014–0042). Wild-type and C/EBPα-S193A mice were bred in-house, with free access to food and water on a 12-hour dark/light cycle. Male mice were injected intraperitoneally with N-nitrosodiethylamine (DEN) at a concentration of 50μg/g body weight at 4 weeks of age at the time of weaning. The livers were harvested at 25, 28, and 30 weeks post-DEN injection to analyze tumor formation. C/EBPα-S193A generation and characterization are described in our previous publication.21
HBL and HCC samples:
Hepatoblastoma samples and liver tissue from an individual with telomere shortening secondary to Dyskeratosis Congenita were acquired through the CCHMC Pathology Biorepository. Among 51 HBL samples, we have obtained 6 samples from patients with aggressive HBL that are characterized by a very fast growth, by chemo-resistance and by poor post-operative prognosis. These hepatoblastoma samples have been described in detail in our previous publication.21
Antibodies:
Antibodies to Ki67 (MA5–99520), α-SMA (RB-9010-P), CyclinD1 (RM-9104-S1) were from Thermo Scientific. CK19 (troma-III) antibody was deposited to the DSHB by Kemler, R. (DSHB Hybridoma Product TROMA-III). Cleaved caspase 3 (Asp 175) antibody came from Cell Signaling (9661S). Antibodies HNF4α (C-19) (SC-6556), Gankyrin (H-231) (SC-8991), AFP (SC-8399), β-catenin (SC-7963) were from Santa Cruz Biotechnology Inc. DLK1 (ab21682) and H3K9 Me antibodies were from Abcam. Glutamine Synthetase (610517) antibody was purchased from BD Biosciences. Antibodies to human ph-S190-C/EBPα were generated in our lab and were used in our previous papers28. Antibodies to Ser193-ph C/EBPα were purchased from Thermo Scientific (PA5–37342). Alcian Blue and PAS Staining solutions were from Newcomer Supply. Apoptag kit was from Millipore for Tunel Staining.
Western blotting:
Protein extracts were isolated from mouse and human livers as previously described.18–20 Protein extracts (50 to 100 μg) were loaded on to 4 to 20% gradient gels (Bio-Rad) and transferred to nitrocellulose membranes (Bio-Rad). Membranes were probed with corresponding antibodies. The results of Western blotting analysis are presented as ratios of proteins to loading controls.
Immunostaining:
Liver sections were fixed overnight in 4% PFA, embedded in paraffin and sectioned (6 micron sections). 24 hours prior to tissue harvest mice were injected IP with 66.5mg/kg Bromodeoxyuridine (BrdU) for histological examination. BrdU staining was performed using a BrdU up-take assay kit (Invitrogen). Sirius red staining was performed using Picrosirius Red Stain Kit from Polysciences, Inc.
HPLC-based examination of protein-protein complexes.
Nuclear extracts from background and tumor sections of HBL samples or from WT and S193A mice were fractionated by SEC using SEC400 column (BioRad) as described in our previous papers.18–21 Optical density (280nM) was monitored for each SEC run and compared for tumor and background sections. Location of C/EBPα and Rb in SEC fractions was determined by Western blotting with specific Abs. For detection of protein-protein complexes, Rb was immunoprecipitated from SEC fractions and the IPs were probed with Abs to C/EBPα.
QRT-PCR:
Total RNA was isolated from mouse and human livers using RNEasy Plus mini kit (Qiagen) according to the manufacturer’s instructions. cDNA was synthesized with 2ug of total RNA using High-Capacity cDNA Reverse Transcription Kit (ThermoFisher). Gene expression analysis was performed using the TaqMan Universal PCR Master Mix (Applied Biosystems) in a total volume of 10μl containing 5μl Master Mix, 1.5μL water, 3μl cDNA template and 0.5μl of the gene-specific TaqMan Assay probe mixture. TaqMan probe mixtures were purchased from Applied Biosystems.
Liver Perfusion and Hepatocyte Isolation:
The livers of S193A and wild-type, age-matched control mice were perfused as described in Shin et al 29 to obtain a single cell suspension for cell culture and flow cytometry.
Flow Cytometry:
Flow cytometry was utilized on S193A mice that formed tumors spontaneously in addition to wild-type, age-matched control mice to sort large hepatocytes based on size and DNA content. Antibodies used for this procedure were 7-AAD (A1310), which serves as a cell viability marker, and Hoescht stain (62249), a nuclear marker that sorts by DNA content. Both antibodies were purchased from Thermo Scientific.
Statistical Analysis:
All values are presented as means ± SD. Differences between animal groups and background and tumor sections of HBL were determined using a Student t-test. A *p<0.05 was considered statistically significant.
RESULTS
Aggressive HBL is characterized by elevation of C/EBPα de-phosphorylated at Ser190.
We have analyzed C/EBPα in 51 patients with HBL and identified 6 patients with aggressive HBL that have dramatically elevated de-ph-S190-C/EBPα. The characterization of these HBL and mechanisms that activate transcription of C/EBPα are described elsewhere (Valanejad & Timchenko, unpublished). Here, we examined biological consequences of the elevation of de-phosphorylated C/EBPα. Figure 1A shows a Western blot of livers of 17 HBL patients. Protein levels of C/EBPα are reduced in all samples with classic, chemotherapy sensitive, HBL, but four patients with aggressive HBL showed significant elevation of C/EBPα. Re-probe of the same filter with antibodies to ph-S190-C/EBPα revealed that the elevated C/EBPα is de-phosphorylated at Ser190 (Fig 1A–B). C/EBPα displays its activity by making complexes with other proteins,17–19 therefore, we examined C/EBPα complexes using Size Exclusion Chromatography (SEC). Optical density profiles showed that aggressive HBL contains increased amounts of protein-protein complexes in the area of high MW complexes (Fig 1C). We found that C/EBPα-Rb complexes are abundant in areas of high MW complexes in HBL samples; while background regions do not have these complexes (Fig 1D). Examination of SEC fractions with antibodies specific to ph-S190-C/EBPα showed no signals suggesting that C/EBPα-Rb complexes are formed by de-ph-S190 isoform of C/EBPα. These results demonstrate that aggressive HBL is characterized by an elevation of de-ph-S190-C/EBPα and by accumulation of C/EBPα-Rb complexes that are formed by de-phS190 C/EBPα.
Figure1. Patients with aggressive hepatoblastoma have elevated levels of de-ph-190-C/EBPα protein.
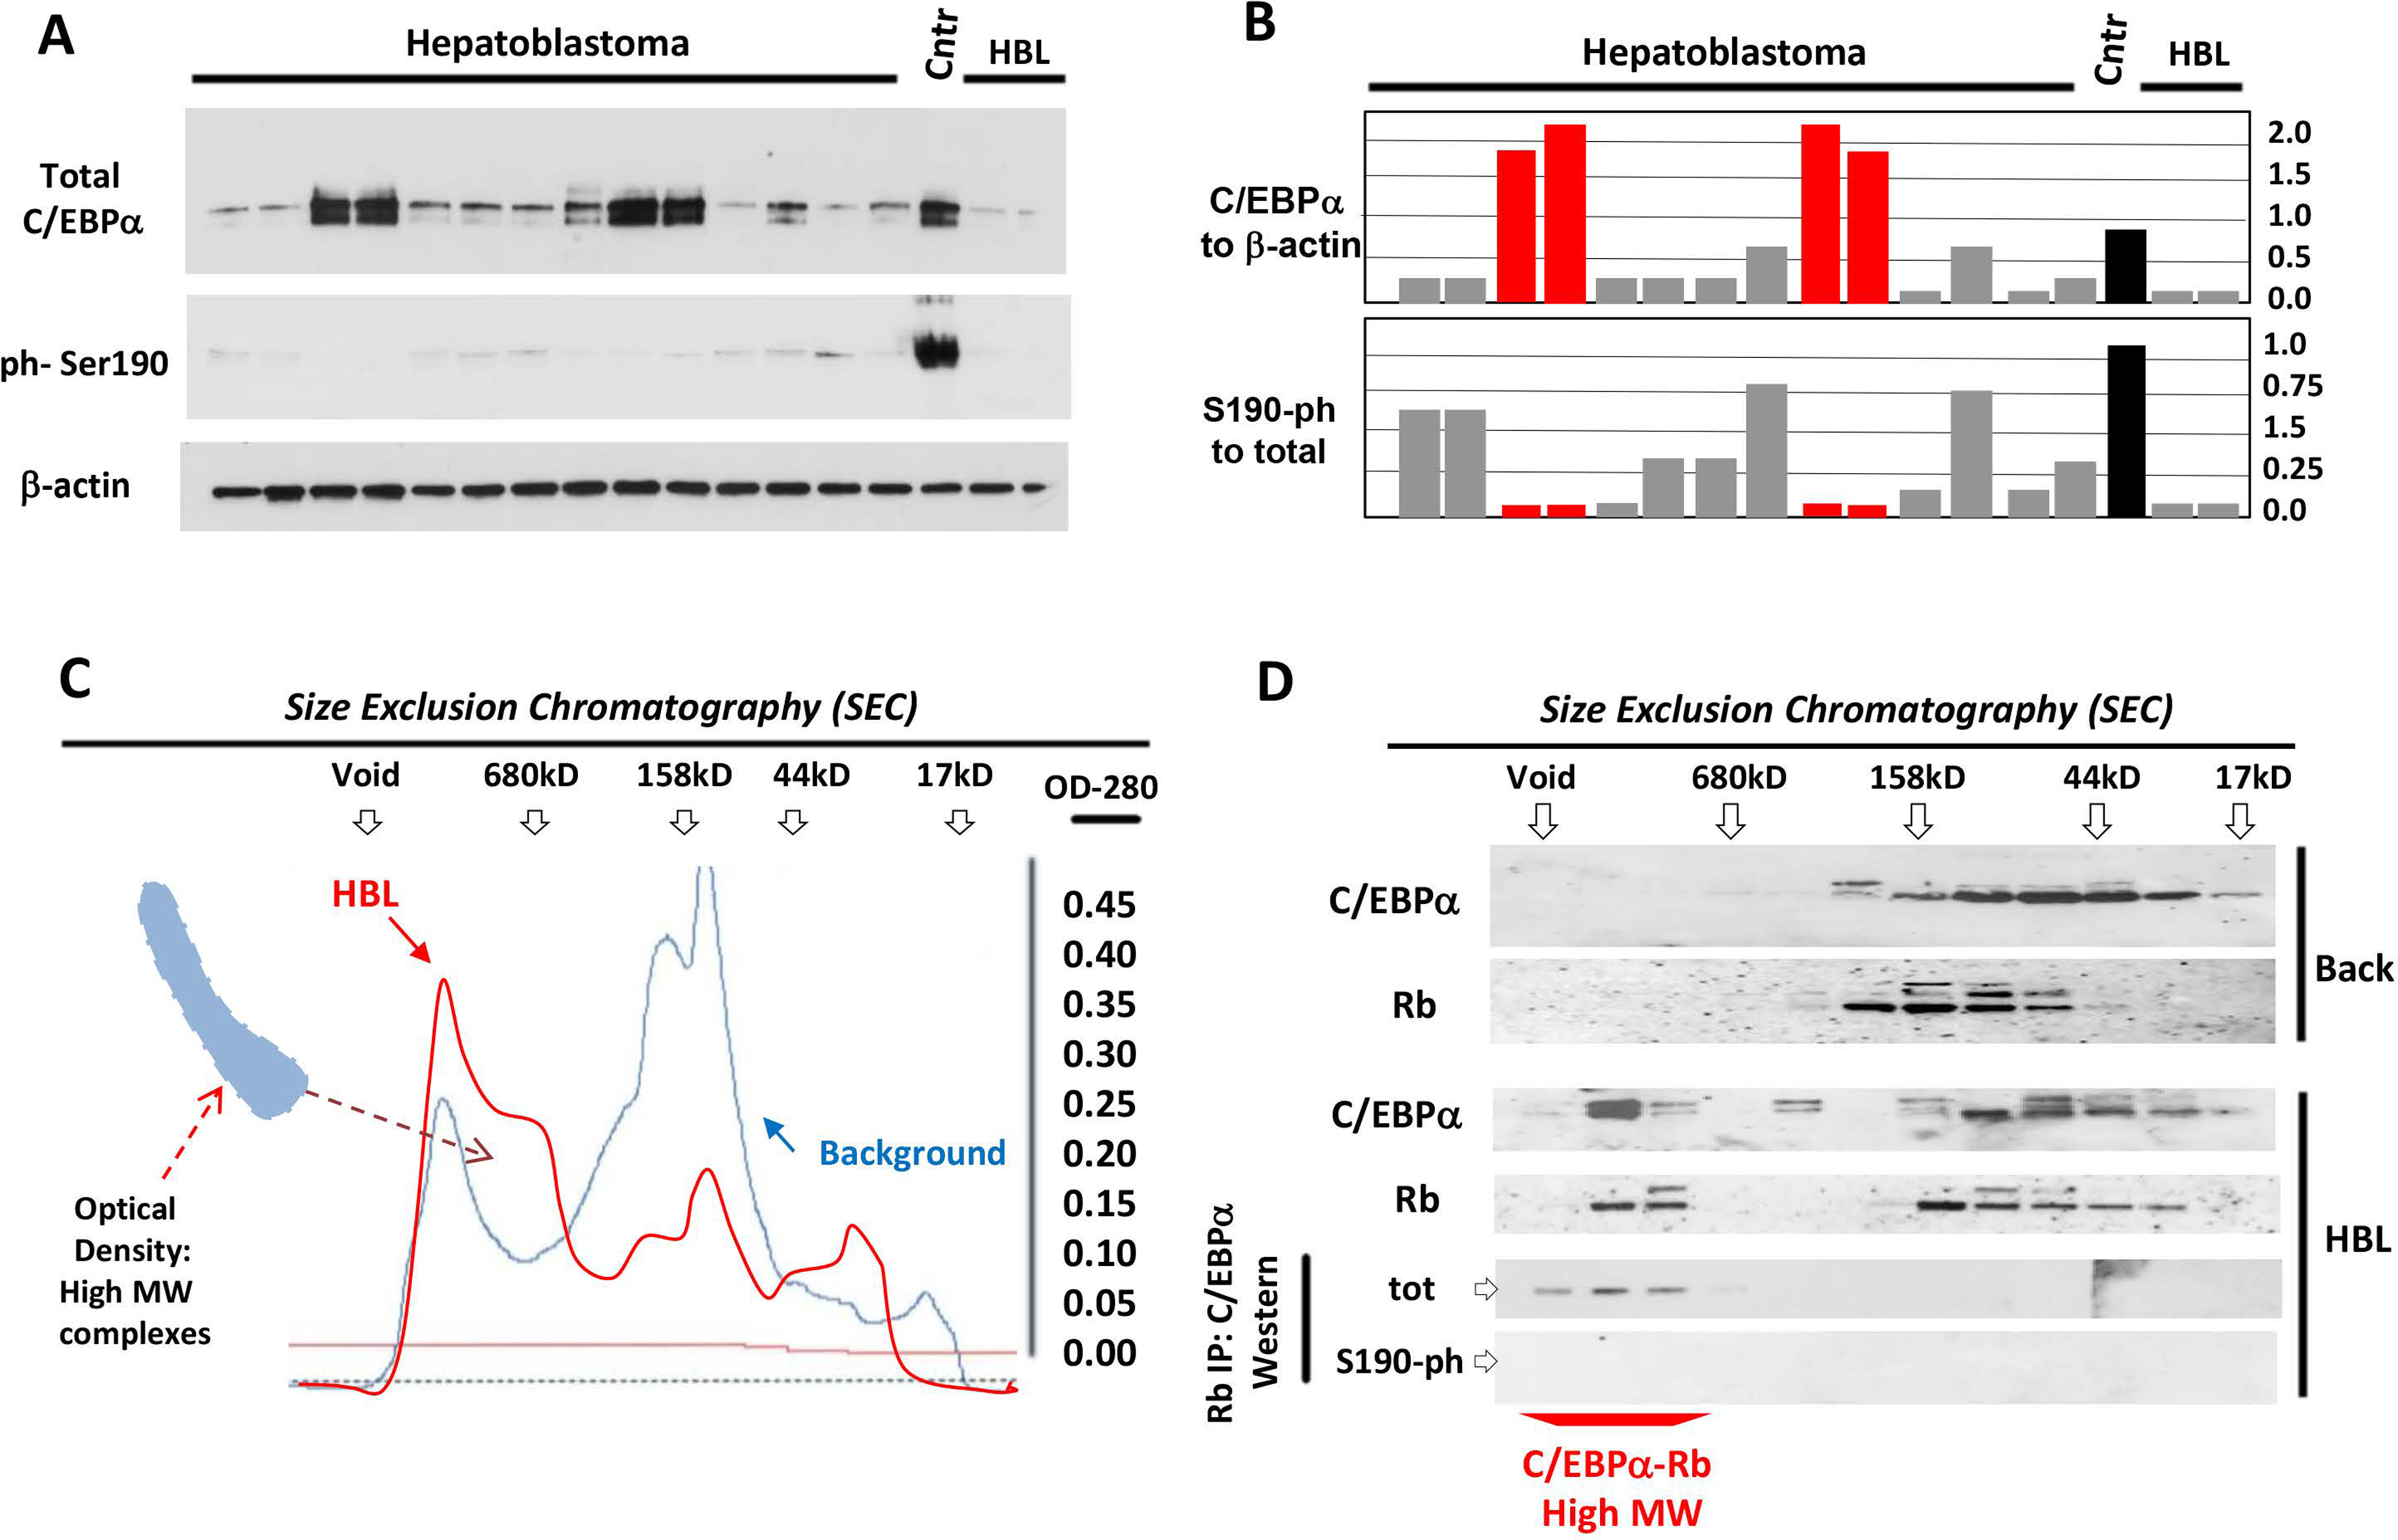
(A) Nuclear extracts from HBL livers were analyzed by Western blotting with antibodies to total C/EBPα and to ph-Ser190 C/EBPα. The membrane was re-probed with Abs to β-actin. Cntr; control normal liver. (B) Levels of total and Ph-S190 C/EBPα were calculated as ratios to β-actin. Red bars show HBL samples with aggressive liver cancer. (C) Nuclear extracts from background area and from aggressive HBL were separated by SEC. Optical density profiles are shown. Positions of markers of SEC are shown on the top. The area of increased density in high MW region of SEC is shown. (D) Protein extracts from SEC fractions were analyzed by Western blotting with Abs to C/EBPα and Rb. The bottom image shows IP of Rb from SEC fractions and Western blotting with Abs to total C/EBPα and to ph-S190 C/EBPα.
DEN-treated C/EBPα-S193A mice develop hepatic carcinogenesis more rapidly than WT mice.
Our previous studies have shown that C/EBPα is dephosphorylated at S190 in some HCC samples.17 These results, and those shown in figure 1, suggested that de-ph-S190-C/EBPα may play a critical role in the development of aggressive HBL and HCC. To examine the role of de-ph-C/EBPα in liver cancer, we utilized C/EBPα-S193A mice that mimic de-phosphorylation of C/EBPα.22 We began by examining the development of cancer under DEN-mediated carcinogenesis so early stages of liver cancer can be determined more precisely. To avoid strain-specific differences in the development of liver cancer, we used WT and S193A homozygous male littermates. Five mice of each genotype were treated with DEN as shown in Fig 2A. Animals were sacrificed at 25, 28 and 30 weeks and livers were grossly and histologically examined.
Figure 2. DEN-mediated liver cancer in C/EBPα-S193A mice has a molecular signature of aggressive HBL.
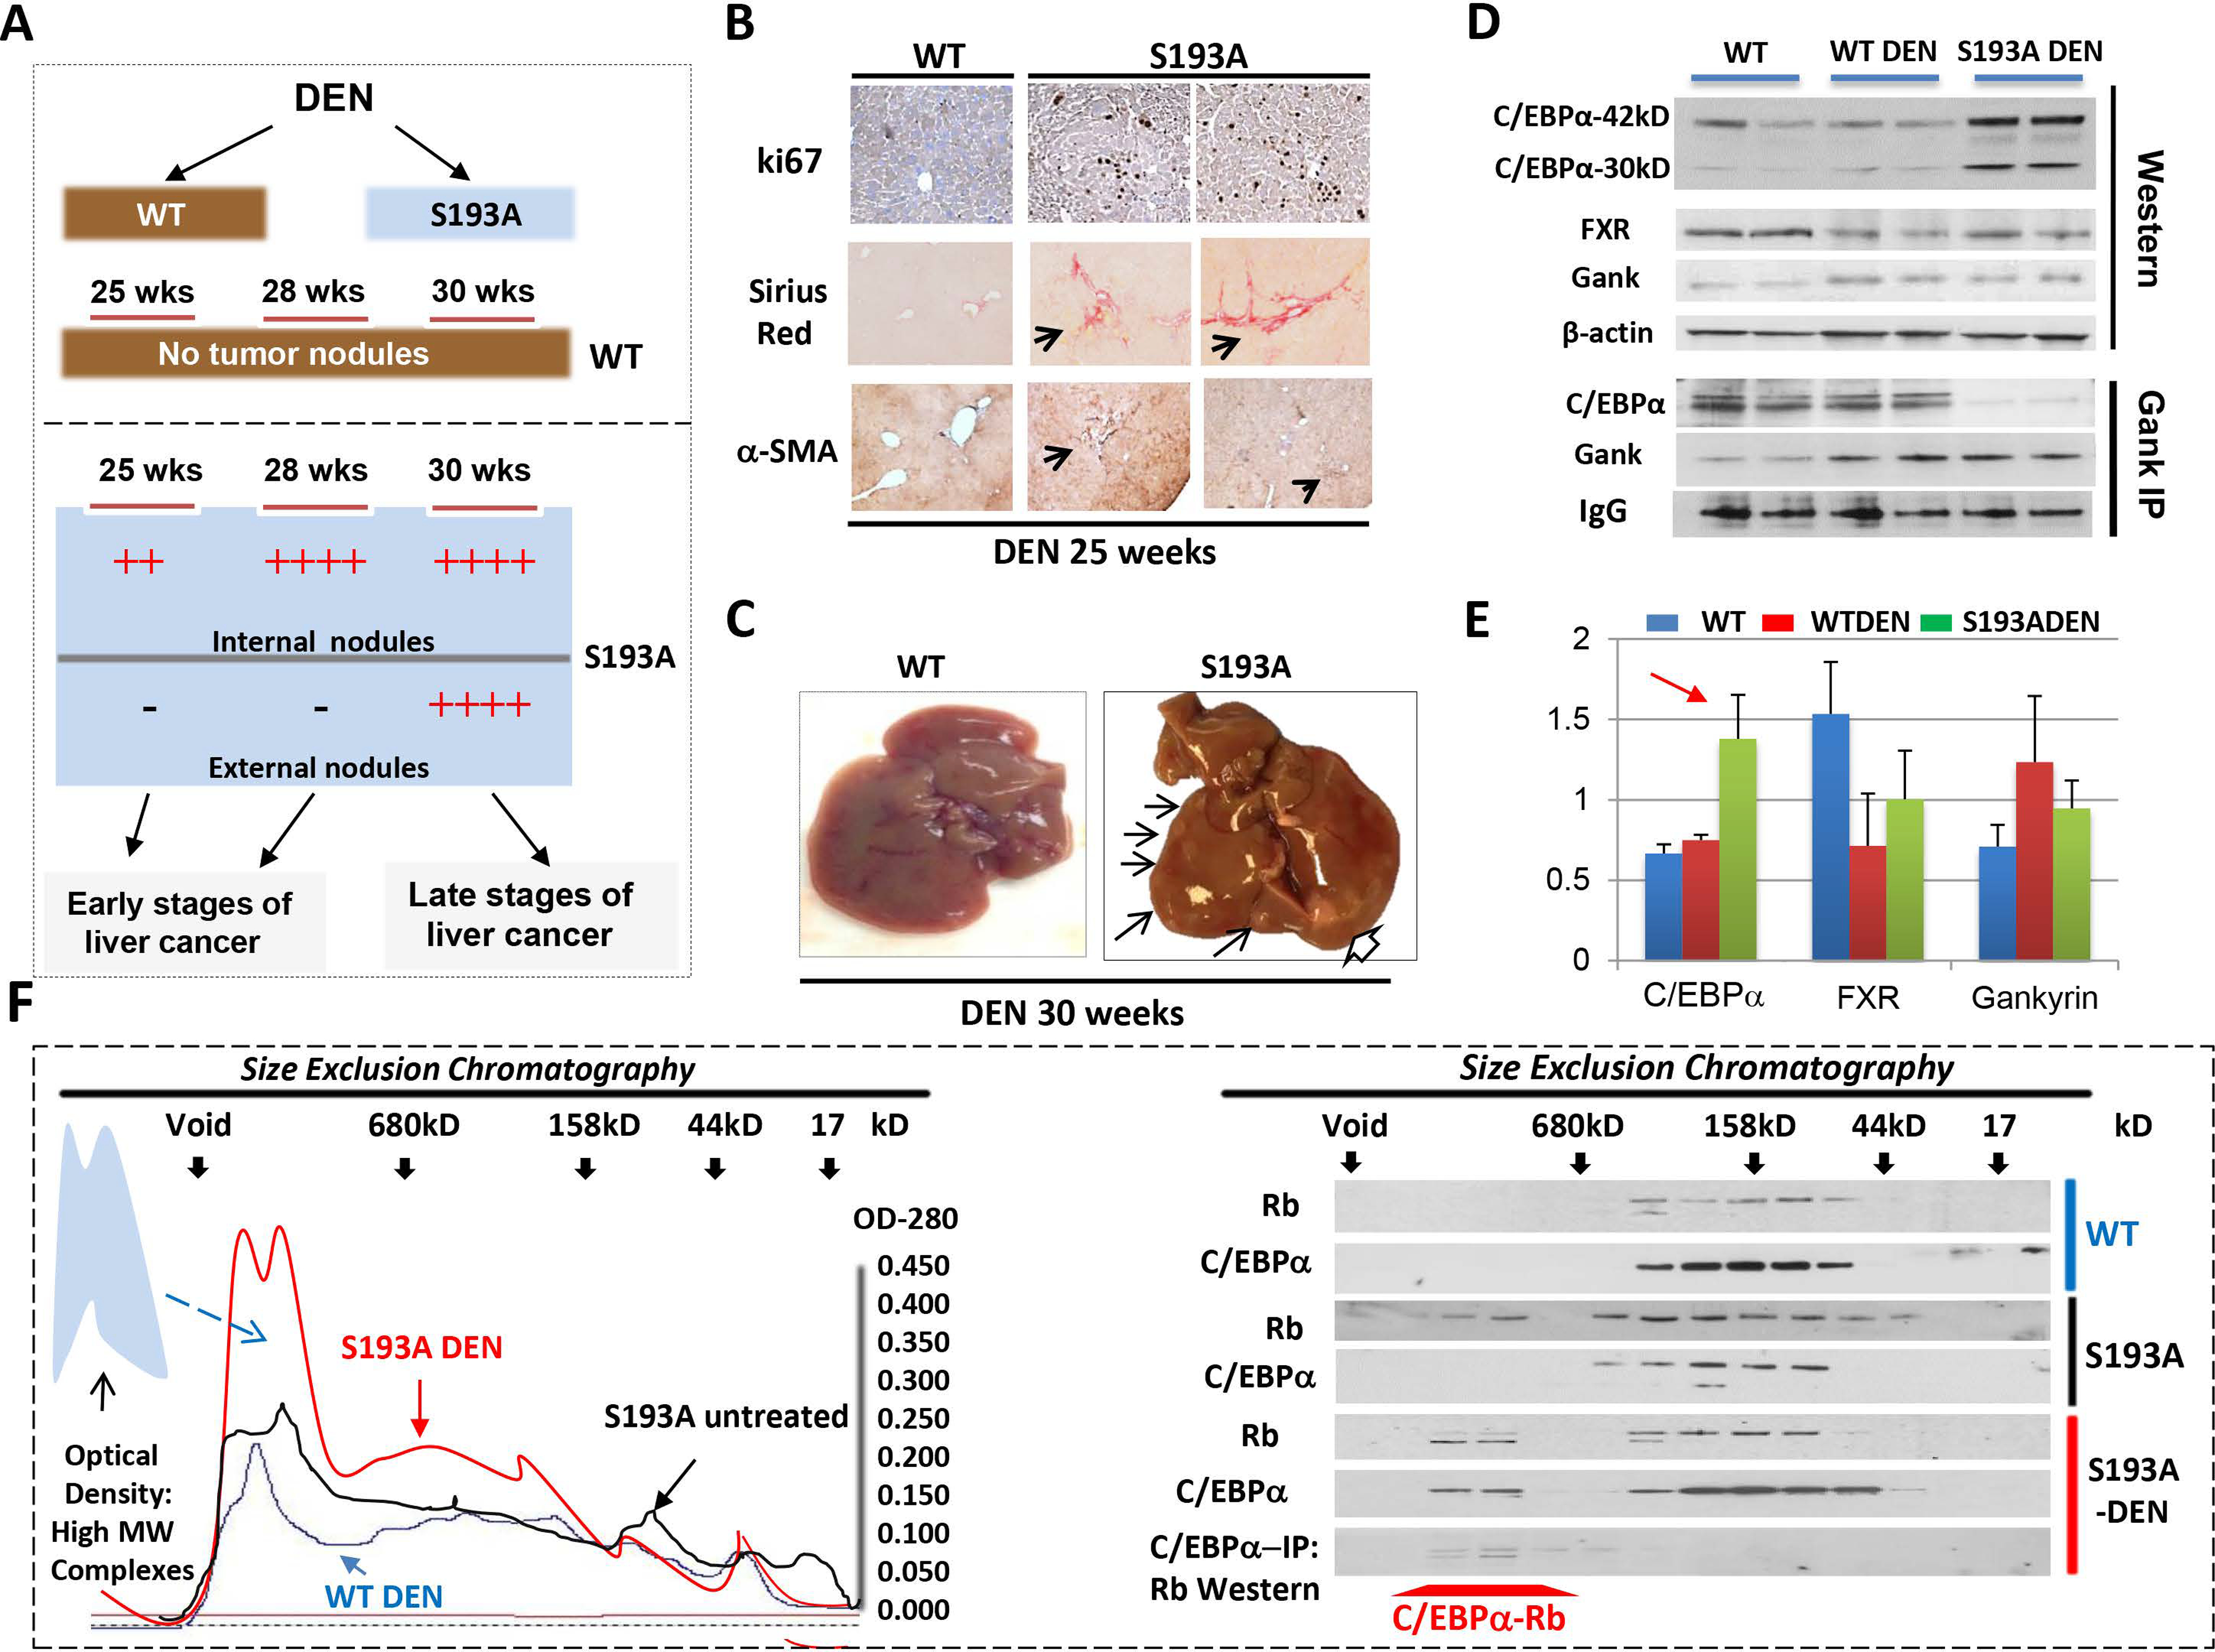
(A) A diagram shows results of the treatments of WT and C/EBPα-S193A mice with DEN. (B) WT and S193A livers of 25-wks DEN-treated mice were stained with ki67, Sirius Red and α-SMA. (C) Typical picture of external nodules in S193A mice treated with DEN for 30 weeks. Large nodule is shown by open arrow. (D) Nuclear extracts from livers of WT, WT DEN-treated and S193A DEN-treated mice were examined by Western blotting with Abs shown on the left. Gank-IP: Gank was immunoprecipitated from nuclear extracts of mice shown on the top. The IP were probed with antibodies to C/EBPα and Gank. IgG; heavy chains of IgGs. (E) Levels of proteins on “D” are calculated as ratios to β-actin. Red arrow shows the elevation of C/EBPα-S193A after DEN treatments. (F) Left: Optical Density analyses of nuclear extracts after SEC. The region of elevation of OD in the high MW sections of SEC is shown by arrow. Right: Proteins from fractions of SEC were analyzed by Western blotting with Abs to C/EBPα and Rb. The bottom panel shows results of C/EBPα-IP and Western with Rb for DEN-treated S193A mice.
No changes were observed in cellular morphology in WT mice at any examined time points. However, S193A mice showed the progressive initiation of liver cancer starting from 25 weeks. At 25 weeks post-DEN injection, S193A livers had microscopic pre-neoplastic foci; at 28 weeks the neoplastic foci were larger in size and by 30 weeks tumors were grossly and morphologically identified as neoplastic hepatocellular carcinoma (Fig 2 A–C). The microscopic foci were defined as regions that show cancer specific liver morphology. Interestingly, we also observed peri-sinusoidal fibrosis inside the grossly visible tumor nodules at 28 weeks post DEN injection (Fig 2B). Ultimately, examination of the dysplastic foci revealed that S193A livers develop early hepatocellular carcinoma.
Liver cancer of DEN-treated S193A mice shows a signature of aggressive HBL.
We next examined molecular alterations in the livers of DEN-treated S193A mice at 28 weeks post-DEN injections. In WT mice, C/EBPα phosphorylated at S193 is degraded by Gank which is activated by the reduction of farnesoid X receptor, FXR.19–21 Therefore, we examined FXR-Gank pathway in DEN-treated WT and S193A mice. Figure 2 D–E shows that FXR is reduced and Gank is elevated in WT and S193A DEN-treated mice. Surprisingly, levels of C/EBPα protein are elevated in S193A DEN-treated mice despite the reduction of C/EBPα mRNA (Supplemental Figure 1). Since Gank triggers degradation of C/EBPα,19 we performed Co-IP studies and found no interaction of the S193A mutant with Gank; while WT C/EBPα does interact with Gank (Fig 2D). We conclude that the S193A mutant is elevated in DEN-treated S193A mice because it is protected from Gank-mediated degradation.
Since C/EBPα-Rb complexes are abundant in aggressive HBL, we examined these complexes in DEN-treated S193A mice. Similar to aggressive HBL, we detected an elevation in optical density in the fractions of SEC which contain high MW protein-protein complexes (Fig 2F). Examination of C/EBPα and Rb revealed that a portion of each of these proteins are located in this high MW region of SEC and that C/EBPα-Rb complexes are located here (Fig 2F, right image). A similar analysis of un-treated S193A mice showed that OD profile is almost identical to one in WT mice. Western blotting did not detect C/EBPα in high MW fractions of SEC of untreated S193A mice (Fig 2F). This result shows that C/EBPα-Rb complexes are not detectable in S193A mice prior to DEN treatments. It is likely that these complexes are formed in response to DEN treatments and perhaps are involved in chromatin remodeling at the stages of formation of tumor foci (see below). Thus, these studies demonstrated that, similar to aggressive HBL, liver cancer in DEN-treated S193A mice is characterized by an elevation of the mutant C/EBPα which forms complexes with Rb. Importantly, these results confirmed that DEN-S193A model is an appropriate tool for the studies of mechanisms of aggressive HBL.
Microscopic pre-neoplastic foci of S193A mice are highly proliferative and express markers of liver cancer.
We next analyzed microscopic tumor nodules in livers of S193A mice that are formed at 25 and 28 weeks after DEN treatments. H&E staining showed non-encapsulated large cells surrounding the central veins with some pleomorphism compared to hepatocytes in background regions (Fig 3A–B). Immunoexpression of ki67 and cyclin D1 positive hepatocytes revealed that the microscopic dysplastic foci are highly proliferative (Fig 3A–C). Dysplastic foci of S193A mice are characterized by an increase of CK19 and AFP-positive cells. Thus, we conclude that dysplastic regions of livers of DEN-treated S193A mice contain high number of proliferating hepatocytes that express markers of hepatocarcinogenesis.
Figure 3. Characterization of internal tumor nodules of S193A mice treated with DEN for 28 weeks.
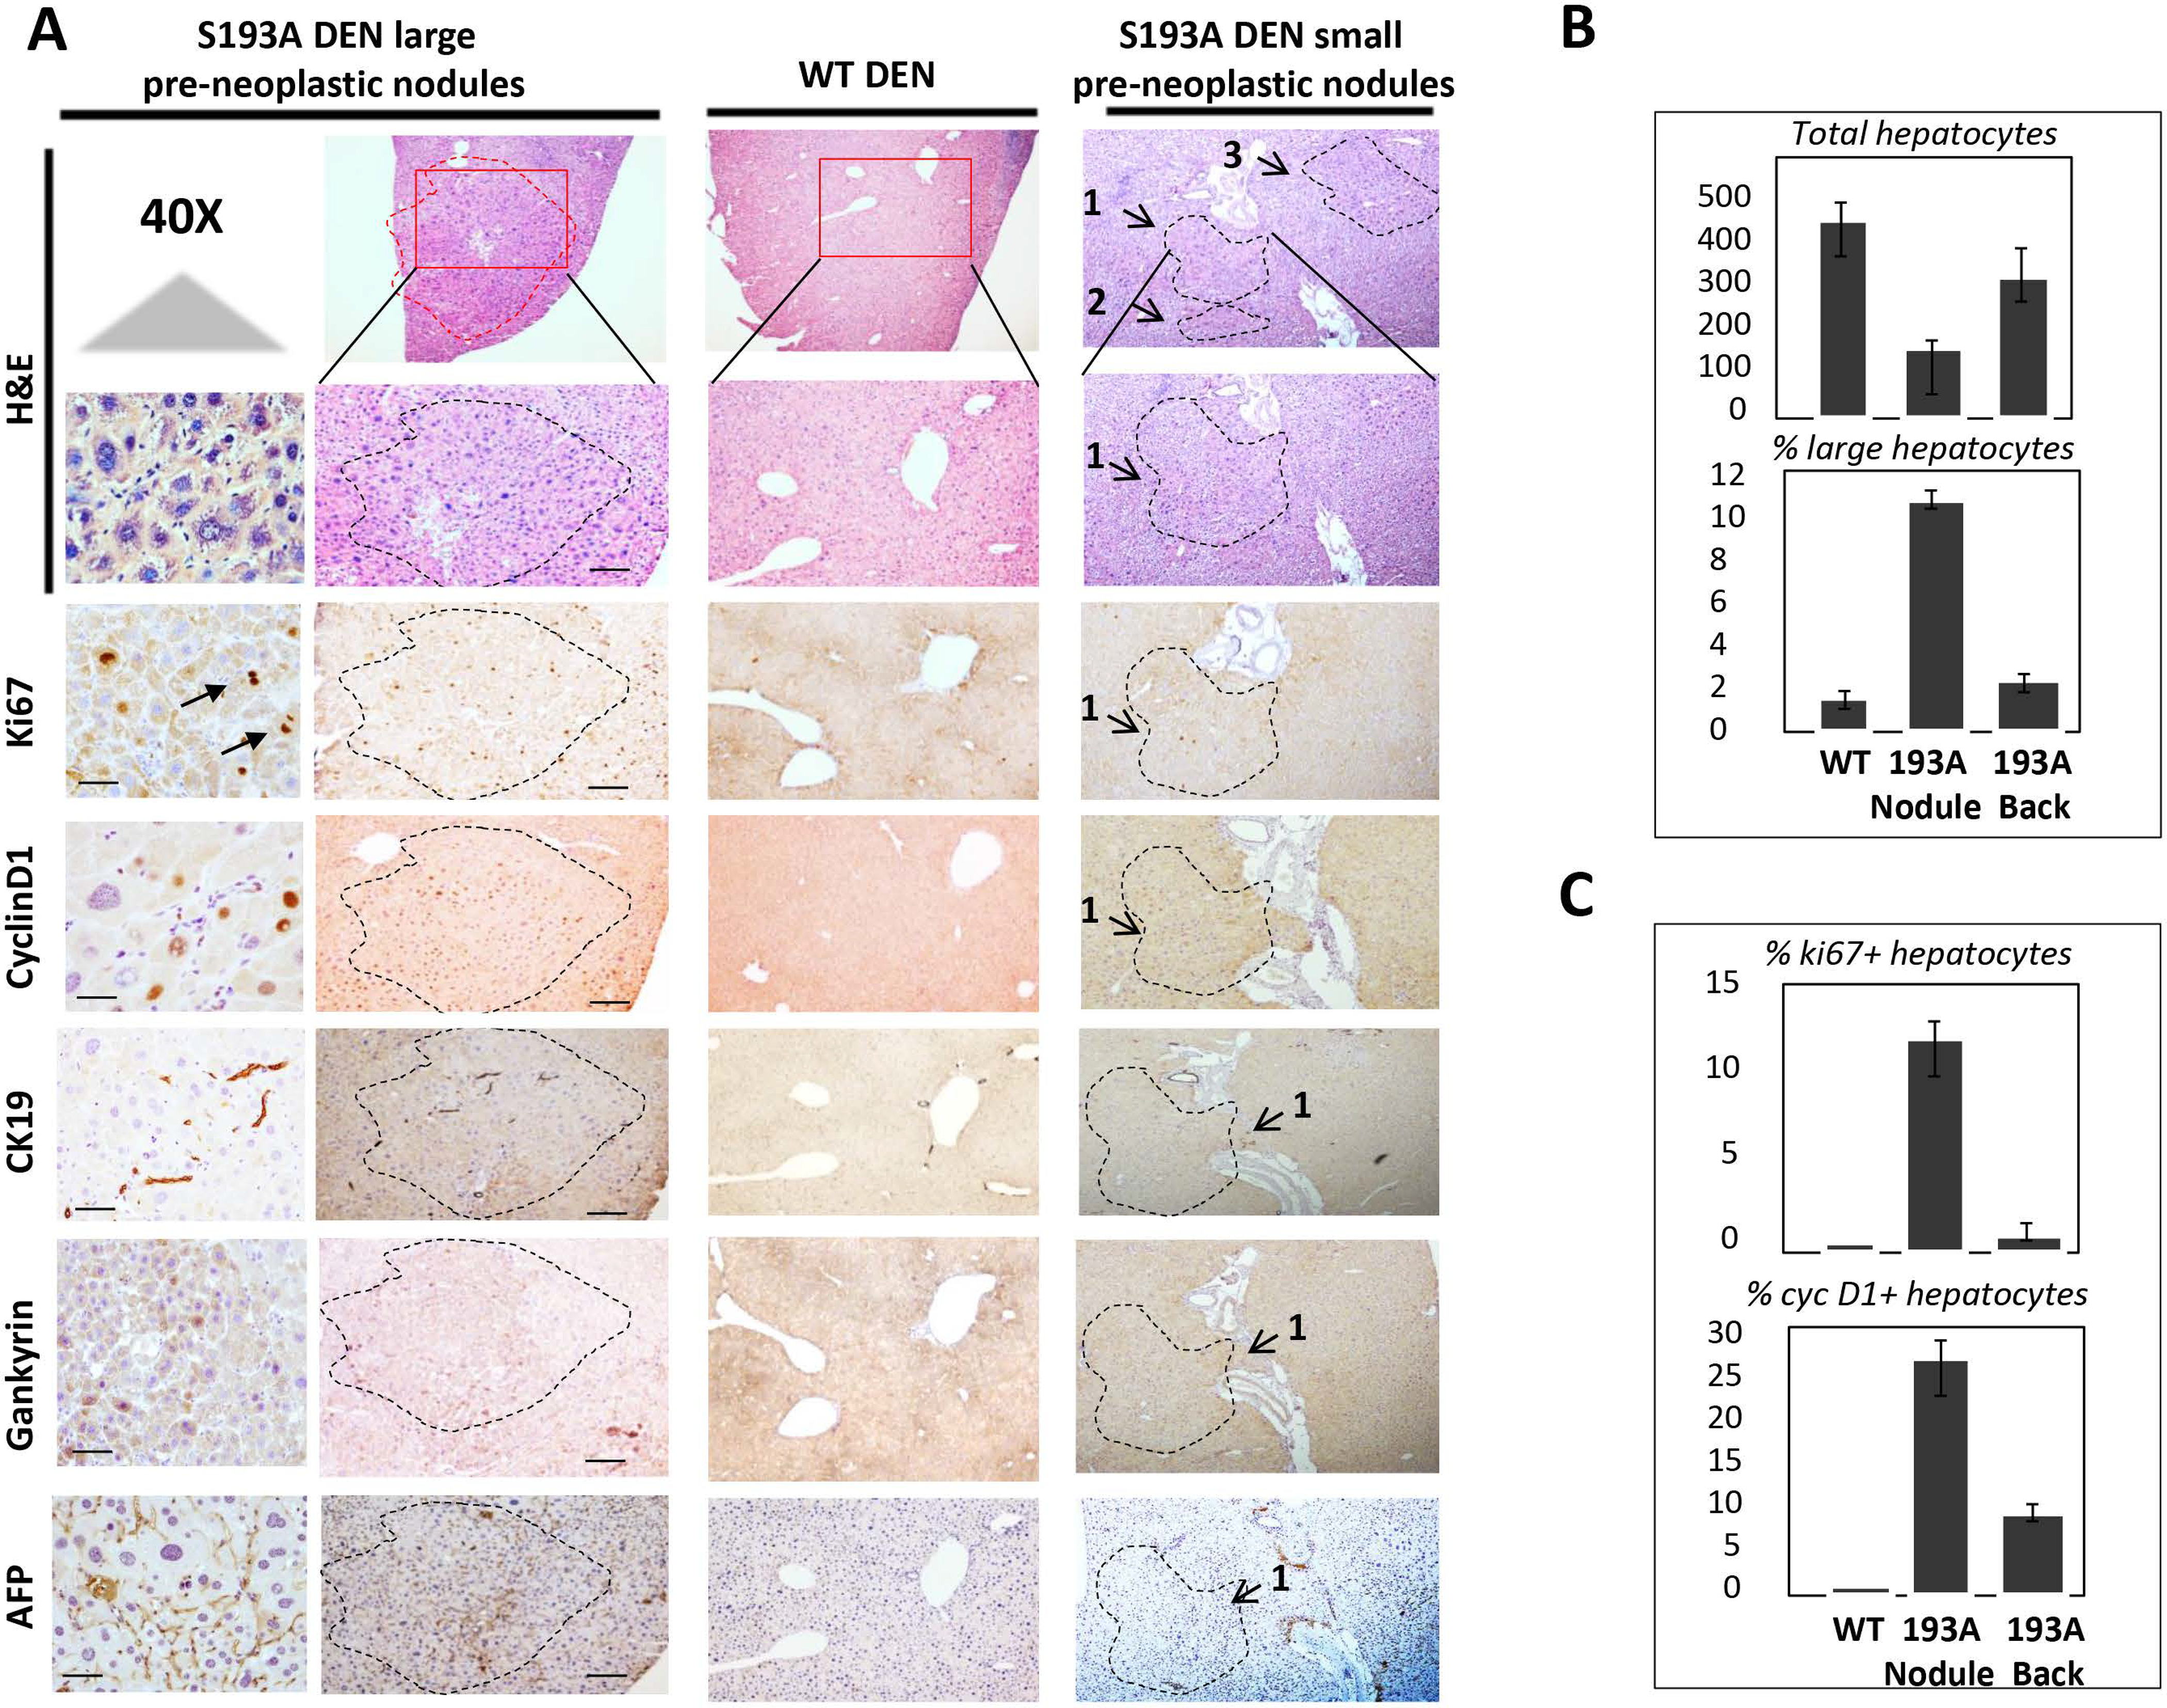
(A) Livers were stained with H&E and with antibodies for markers of liver cancer AFP, Gank and CK19 and liver proliferation ki67 and cyclin D1. Typical pictures of large and small internal tumor nodules are shown. 40X shows staining with 40X magnification. Scale bars are 50μm. (B) Bar graphs show calculation of % of total hepatocytes and large hepatocytes in livers of DEN-treated WT mice and in background and tumor nodules of DEN-treated S193A mice. (C) Bar Graphs show calculations of % of ki67 positive ad cyclin D1 positive hepatocytes in DEN treated WT mice and in background and nodules of S193A DEN-treated hepatocytes.
Initiation of liver cancer in DEN-treated S193A mice is characterized by appearance of atypical hepatocytes.
We next examined hepatocytes within the microscopic dysplastic foci of S193A-DEN treated mice by staining with Abs to HNF4α (Fig 4A). Dysplastic foci revealed a significant reduction in the number of hepatocytes and appearance of hepatocytes with atypical morphology. Morphological examination under high magnification revealed that tumor nodules of S193A mice contain 5 types of hepatocytes: (1) Normal-size hepatocytes or type 1 hepatocytes; (2) Hepatocytes larger than normal or type 2 hepatocytes; (3) Multi-nucleated hepatocytes (type 3) with three or more nuclei per cell; (4) Type 4 hepatocytes with massive nuclei which do not have typical morphology; and (5) Type 5 hepatocytes containing a nucleus with atypical morphology and intra-nuclear inclusions. TUNEL and cleaved caspase 3 staining did not detect positive signals within tumor foci showing that these hepatocytes are not dying cells (Fig 4B). We further call these morphologically distinct hepatocytes as potential tumor initiating hepatocytes (PTIHs).
Figure 4. Identification of morphologically distinct hepatocytes inside microscopic pre-neoplastic foci of S193A-DEN treated mice.
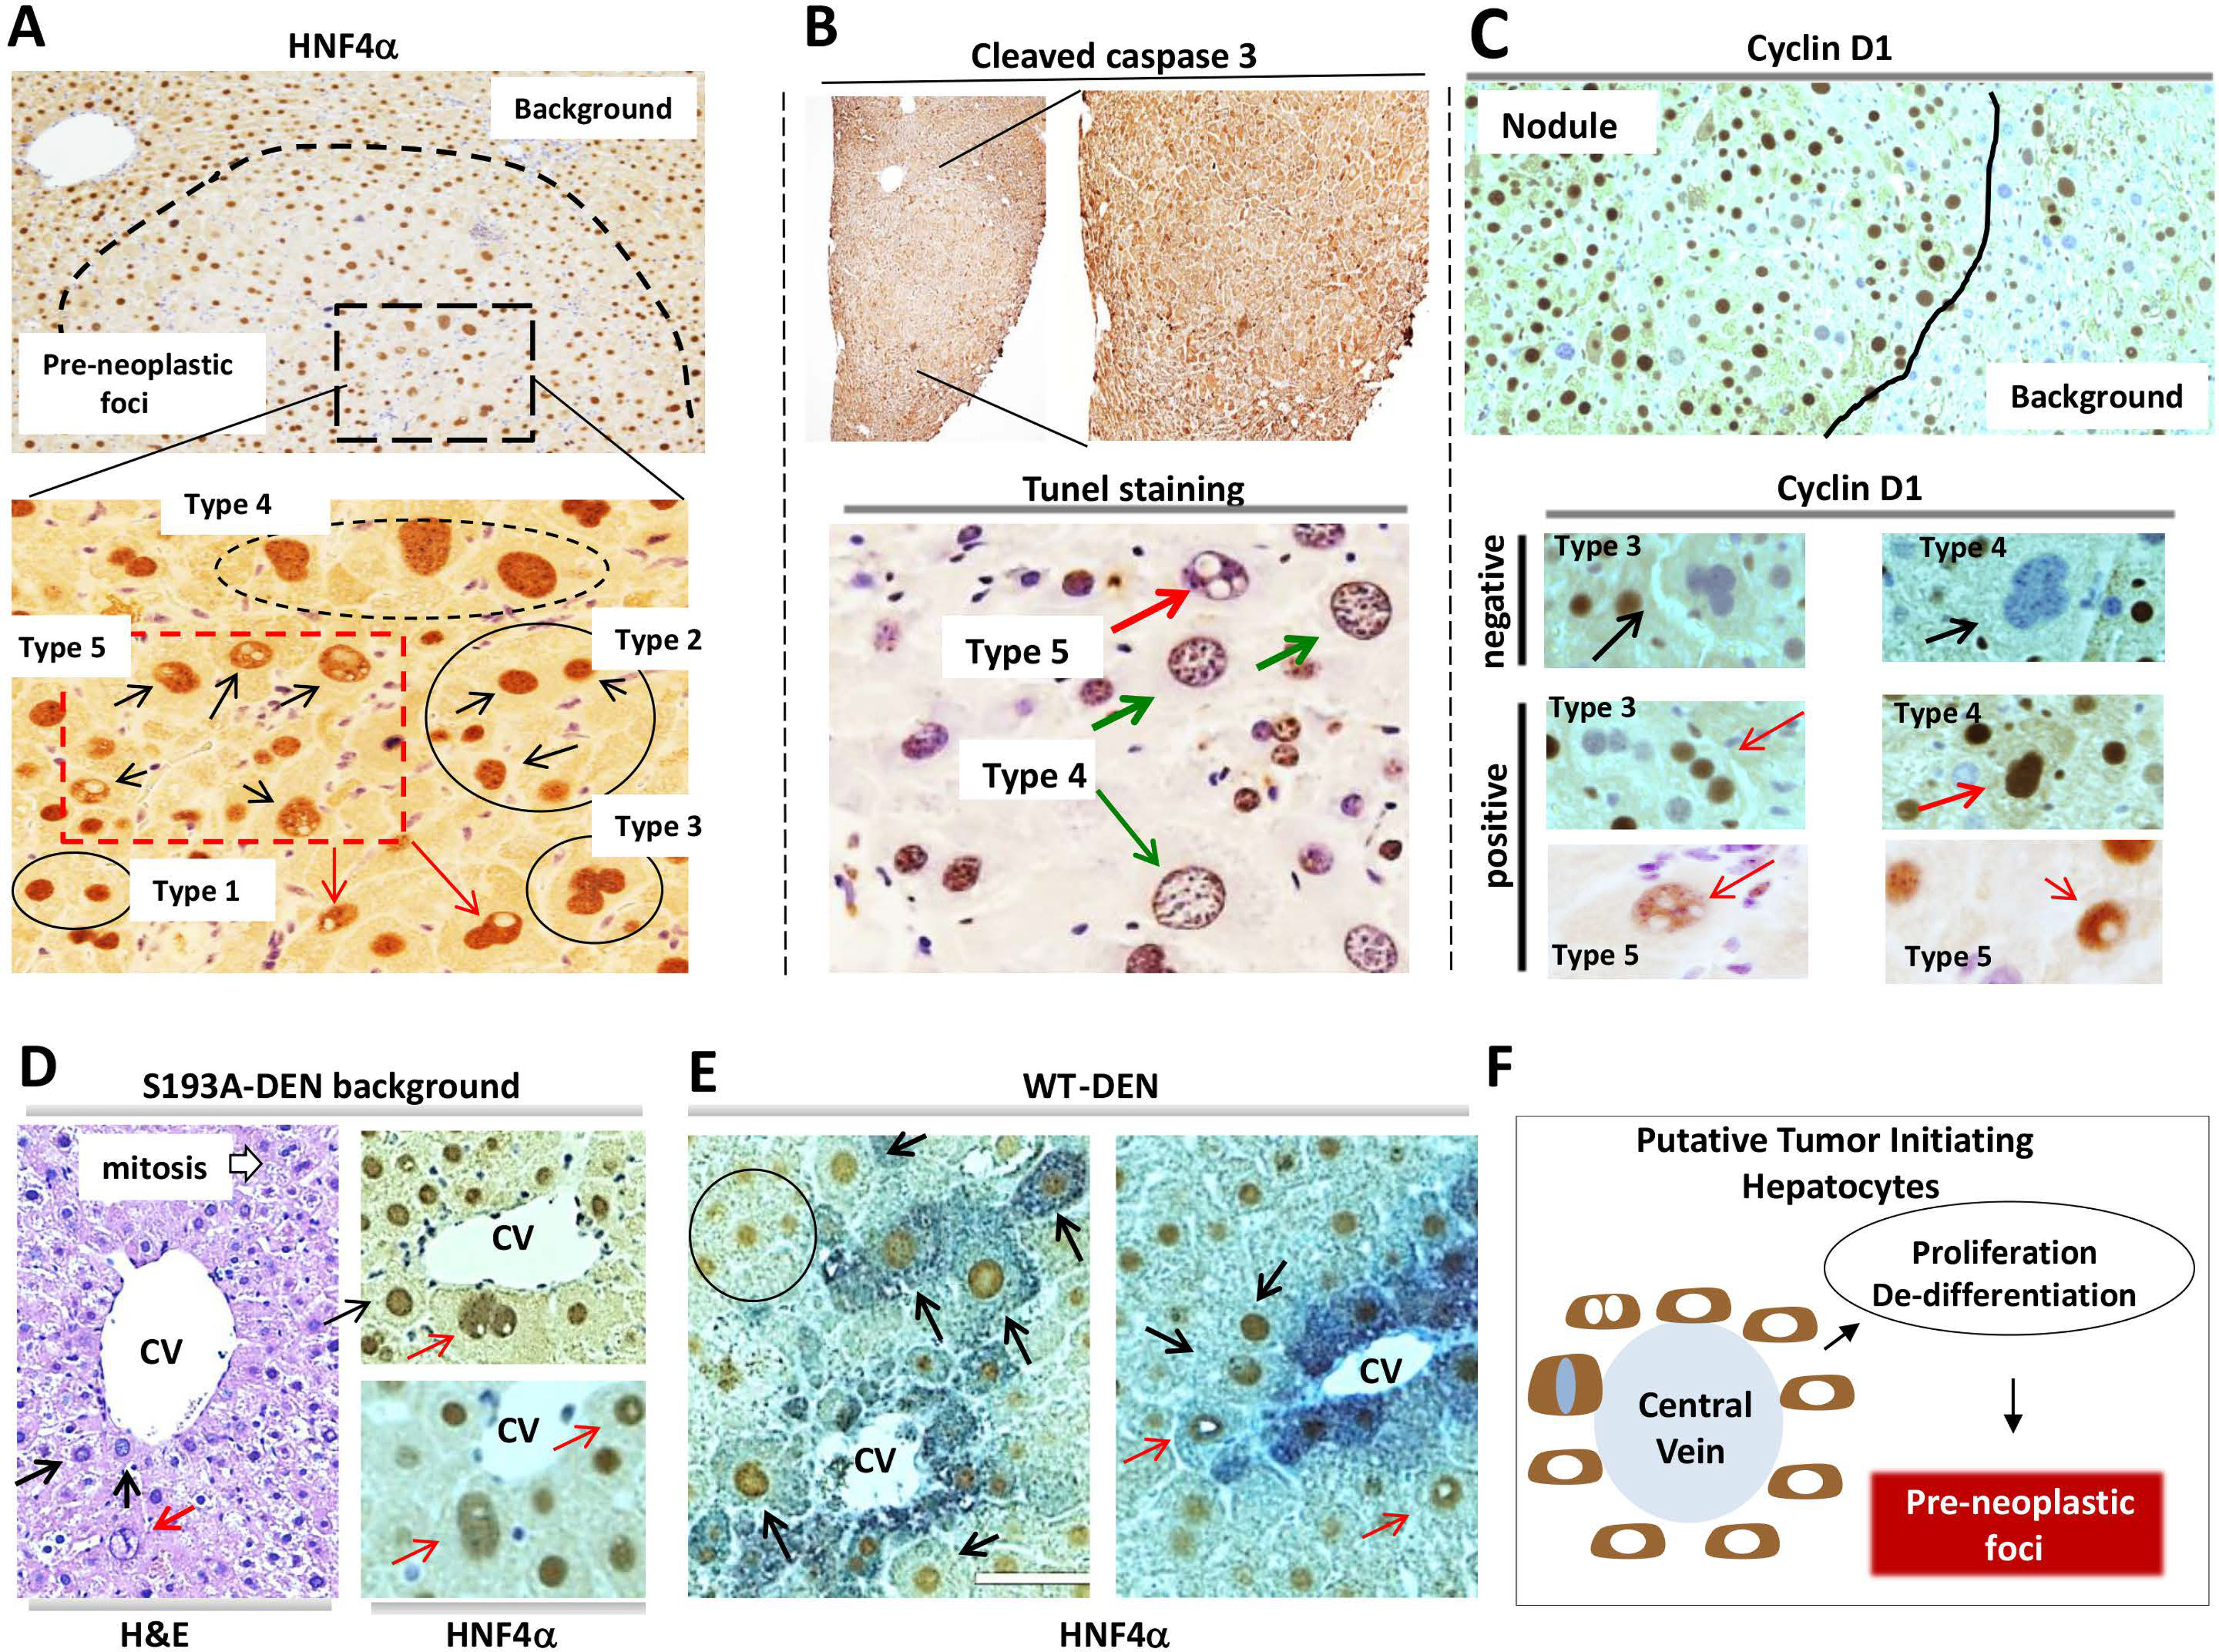
(A) Staining of the large tumor nodule in DEN-treated S193A mice with hepatocyte-specific marker HNF4α. Adjacent (background) and pre-neoplastic foci areas are shown. Bottom image shows the area of the microscopic pre-neoplastic tumor nodule under higher magnification. (B) Livers were stained with Abs to cleaved caspase 3 and by TUNEL staining. (C) Livers were stained with cyclin D1. Bottom image shows images under high magnification. (D) Livers were stained with H&E and with HNF4α. Red arrows show type 5 hepatocytes; black arrows show type 4 hepatocytes. (E) Regions of DEN-treated WT mice which contain types 4 and 5 hepatocytes. Red arrows show type 5 hepatocytes; black arrows show type 4 hepatocytes. (F) A diagram summarizing our findings and hypothesis.
We next examined if the PTIHs are proliferative by staining with cyclin D1. We found that cyclin D1-positive PTIHs are located mainly within dysplastic foci of S193A mice (Fig 4C). Around 50% of type 3, 4 and 5 hepatocytes within tumor nodules express high levels of cyclin D1 (Supplemental Figure 2). Interestingly, cyclinD1 is not detected within intra-nuclear inclusions of type 5 hepatocytes. To determine if these PTIHs might exist before formation of dysplastic foci, we examined background of S193A and WT DEN livers after 28 weeks post-DEN injection. The H&E and HNF4α staining indicated that hepatocytes type 4 and 5 are rare in background regions of DEN-treated S193A mice and that they are located around the central vein (Fig 4D). In the case of WT-DEN treated mice (5 mice), we found only two regions with type 4 and 5 hepatocytes located around the central vein (Fig 4E). We suggest that hepatocytes type 4 and 5 in background regions of DEN-treated S193A mice and in livers of DEN treated WT mice mark the areas where carcinogenic dysplastic foci will be further developed. We conclude that the very early stage of DEN-mediated liver cancer includes the initiation of the transformation of hepatocytes leading to the formation of pre-neoplastic foci (Fig 4F).
C/EBPα-S193A mice develop spontaneous liver cancer with background sections that contain PTIHs.
We next examined tumor formation in S193A mice with increasing age. In 17-month-old S193A mice, we observed increased rates of proliferation in all S193A mice (18 animals) and development of liver cancer in 25% of S193A mice (Fig 5A). None of the examined WT mice (15 mice) develop liver cancer at this age. Supplemental Figure 3 shows elevation of BrdU positive hepatocytes and cyclin D1 in 17-month-old WT and S193A mice that did not have liver cancer. Immunostaining revealed that tumor nodule sections are negative for HNF4α, while the background sections are positive (Fig 5B). The majority of hepatocytes with HNF4α-negative intra-nuclear inclusions (type 5) are located alongside the tumor nodules; while type 4 hepatocytes are located at a relatively long distance from tumor nodules. This location of PTIHs suggests that type 5 hepatocytes are likely to occur at the last step of hepatocyte conversion to cancer cells. Figure 5C summarizes the studies of hepatocytes in tumor sections of S193A mice.
Figure 5. C/EBPα-S193A mice develop spontaneous liver cancer, background of which is characterized by abundant type 4 and 5 hepatocytes.
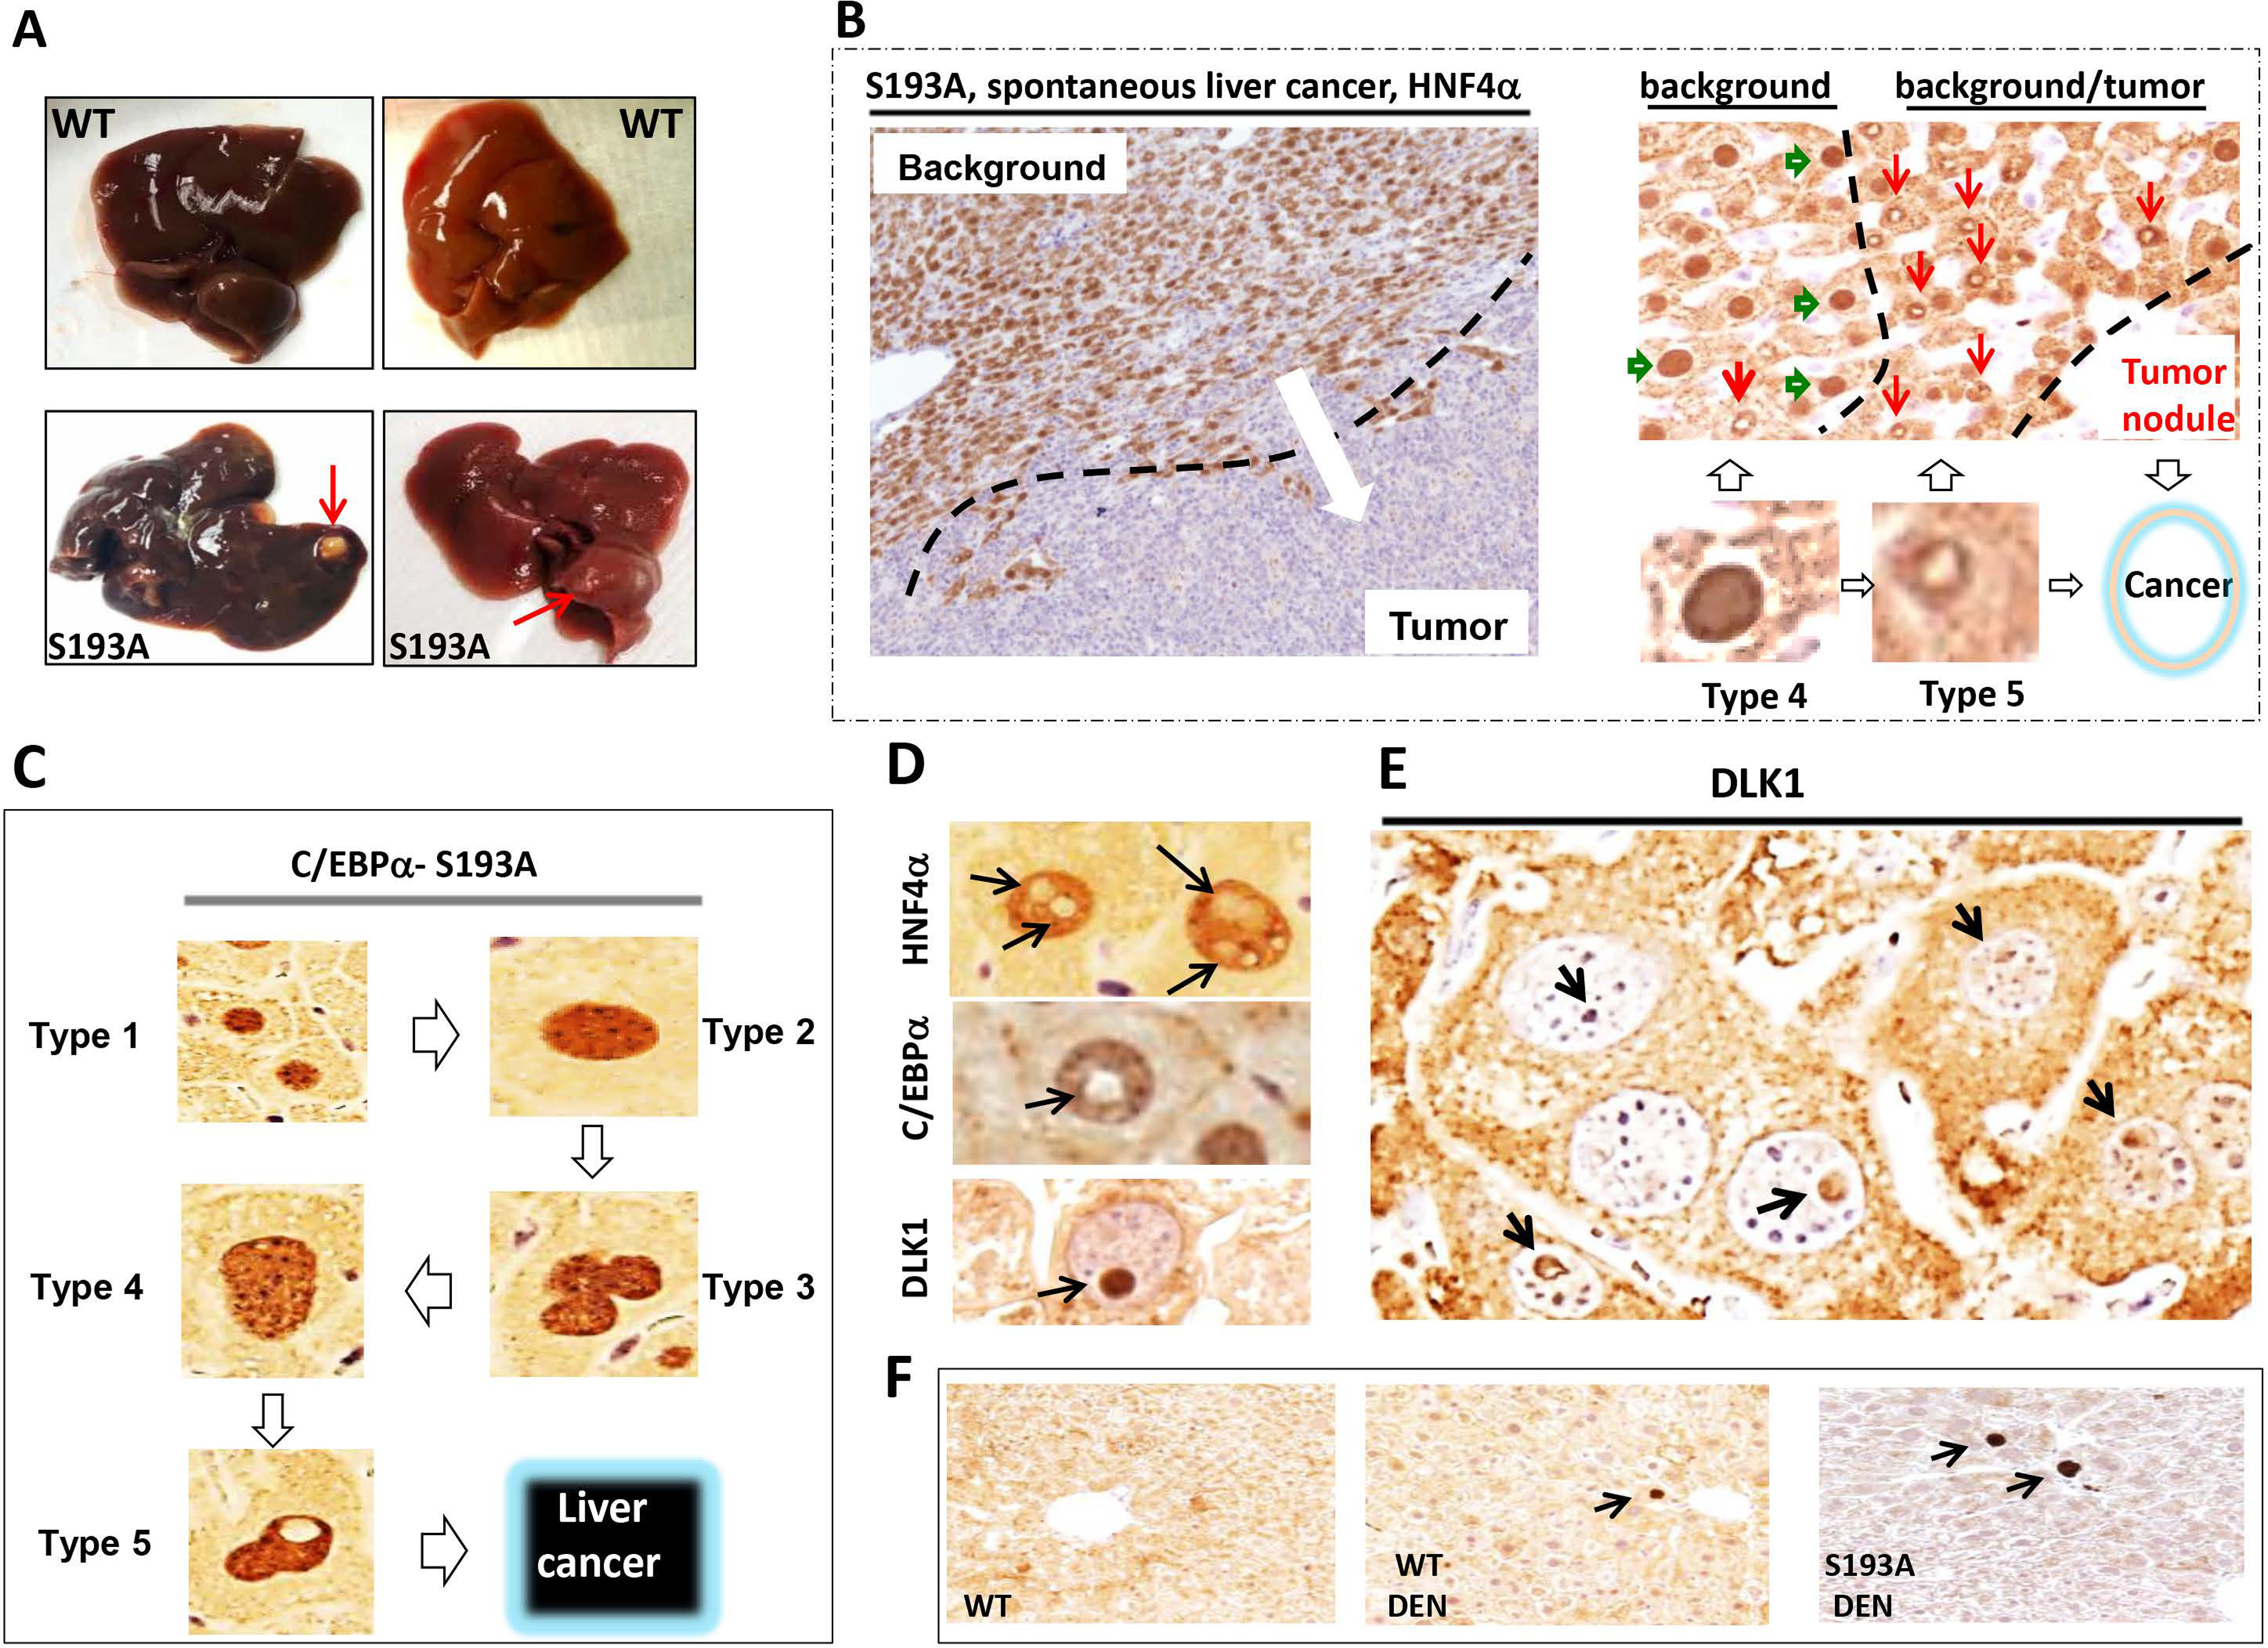
(A) Typical picture of liver cancer in 17 month-old S193A mice. Red arrows show large external tumor nodules. (B) Typical picture of HNF4α staining of the liver tumor in S193A mice. Background section is positive for HNF4α; tumor section is negative. Right image shows HNF4α staining of a border region between tumor section and background of livers of S193A mice. Hepatocytes type 4 (green arrows) are observed far from the tumor section, while hepatocytes type 5 (red arrows) are in very close proximity to the area with cancer. (C) A summary of studies of hepatocytes within tumor nodules of DEN-treated S193A mice and within tumor nodules of spontaneous liver cancer in S193A mice. (D) Staining of S193A hepatocytes of DEN-treated mice (28 wks) with markers of hepatocytes HNF4α and C/EBPα and with Stem Cell Marker DLK1. (E) A bigger field of the liver with hepatocytes that have DLK1-positive intra-nuclear inclusions. (F) Background sections of DEN-treated S193A mice were stained with Abs to DLK1.
Intra-nuclear inclusions of type 5 hepatocytes are negative for C/EBPα and HNF4α, but are positive for stem cell marker DLK1.
We next examined proteins that might be expressed within intra-nuclear inclusions of type 5 hepatocytes and found that the nuclei of type 5 hepatocytes are positive for HNF4α and C/EBPα but negative for stem cell marker DLK1. However, intra-nuclear inclusions are negative for HNF4α and C/EBPα, but are positive for DLK1 (Fig 5D–E). Background (non-tumor) regions of DEN-treated S193A mice also contain DLK1 positive hepatocytes; however, the number of these cells was very low (Fig 5F and Supplemental Figure 4). Co-staining hepatocyte type 5 cells with antibodies to HNF4α and DLK1 confirmed that intra-nuclear inclusions are DLK1 positive and do not express HNF4α (Fig 6A). There are three kinds of DLK1-positive inclusions: one is partially positive for DLK1, second on the border and third within entire inclusions (Fig 6B). The process of cell transformation requires energy, therefore we stained the hepatocytes with PAS and found that 65% of type 5 hepatocytes contain glycogen inside intra-nuclear inclusions (Fig 6C). Co-staining of the hepatocytes with the marker of heterochromatin histone H3 K9-trimethyl and Bis-Benzimide (DNA) revealed that type 4 and 5 hepatocytes contain enriched heterochromatin structures (Fig 6D) suggesting that C/EBPα-S193A-dependent alterations of chromatin structure are involved in de-differentiation of hepatocytes.
Figure 6. Characterization of tumor initiating hepatocytes type 5.
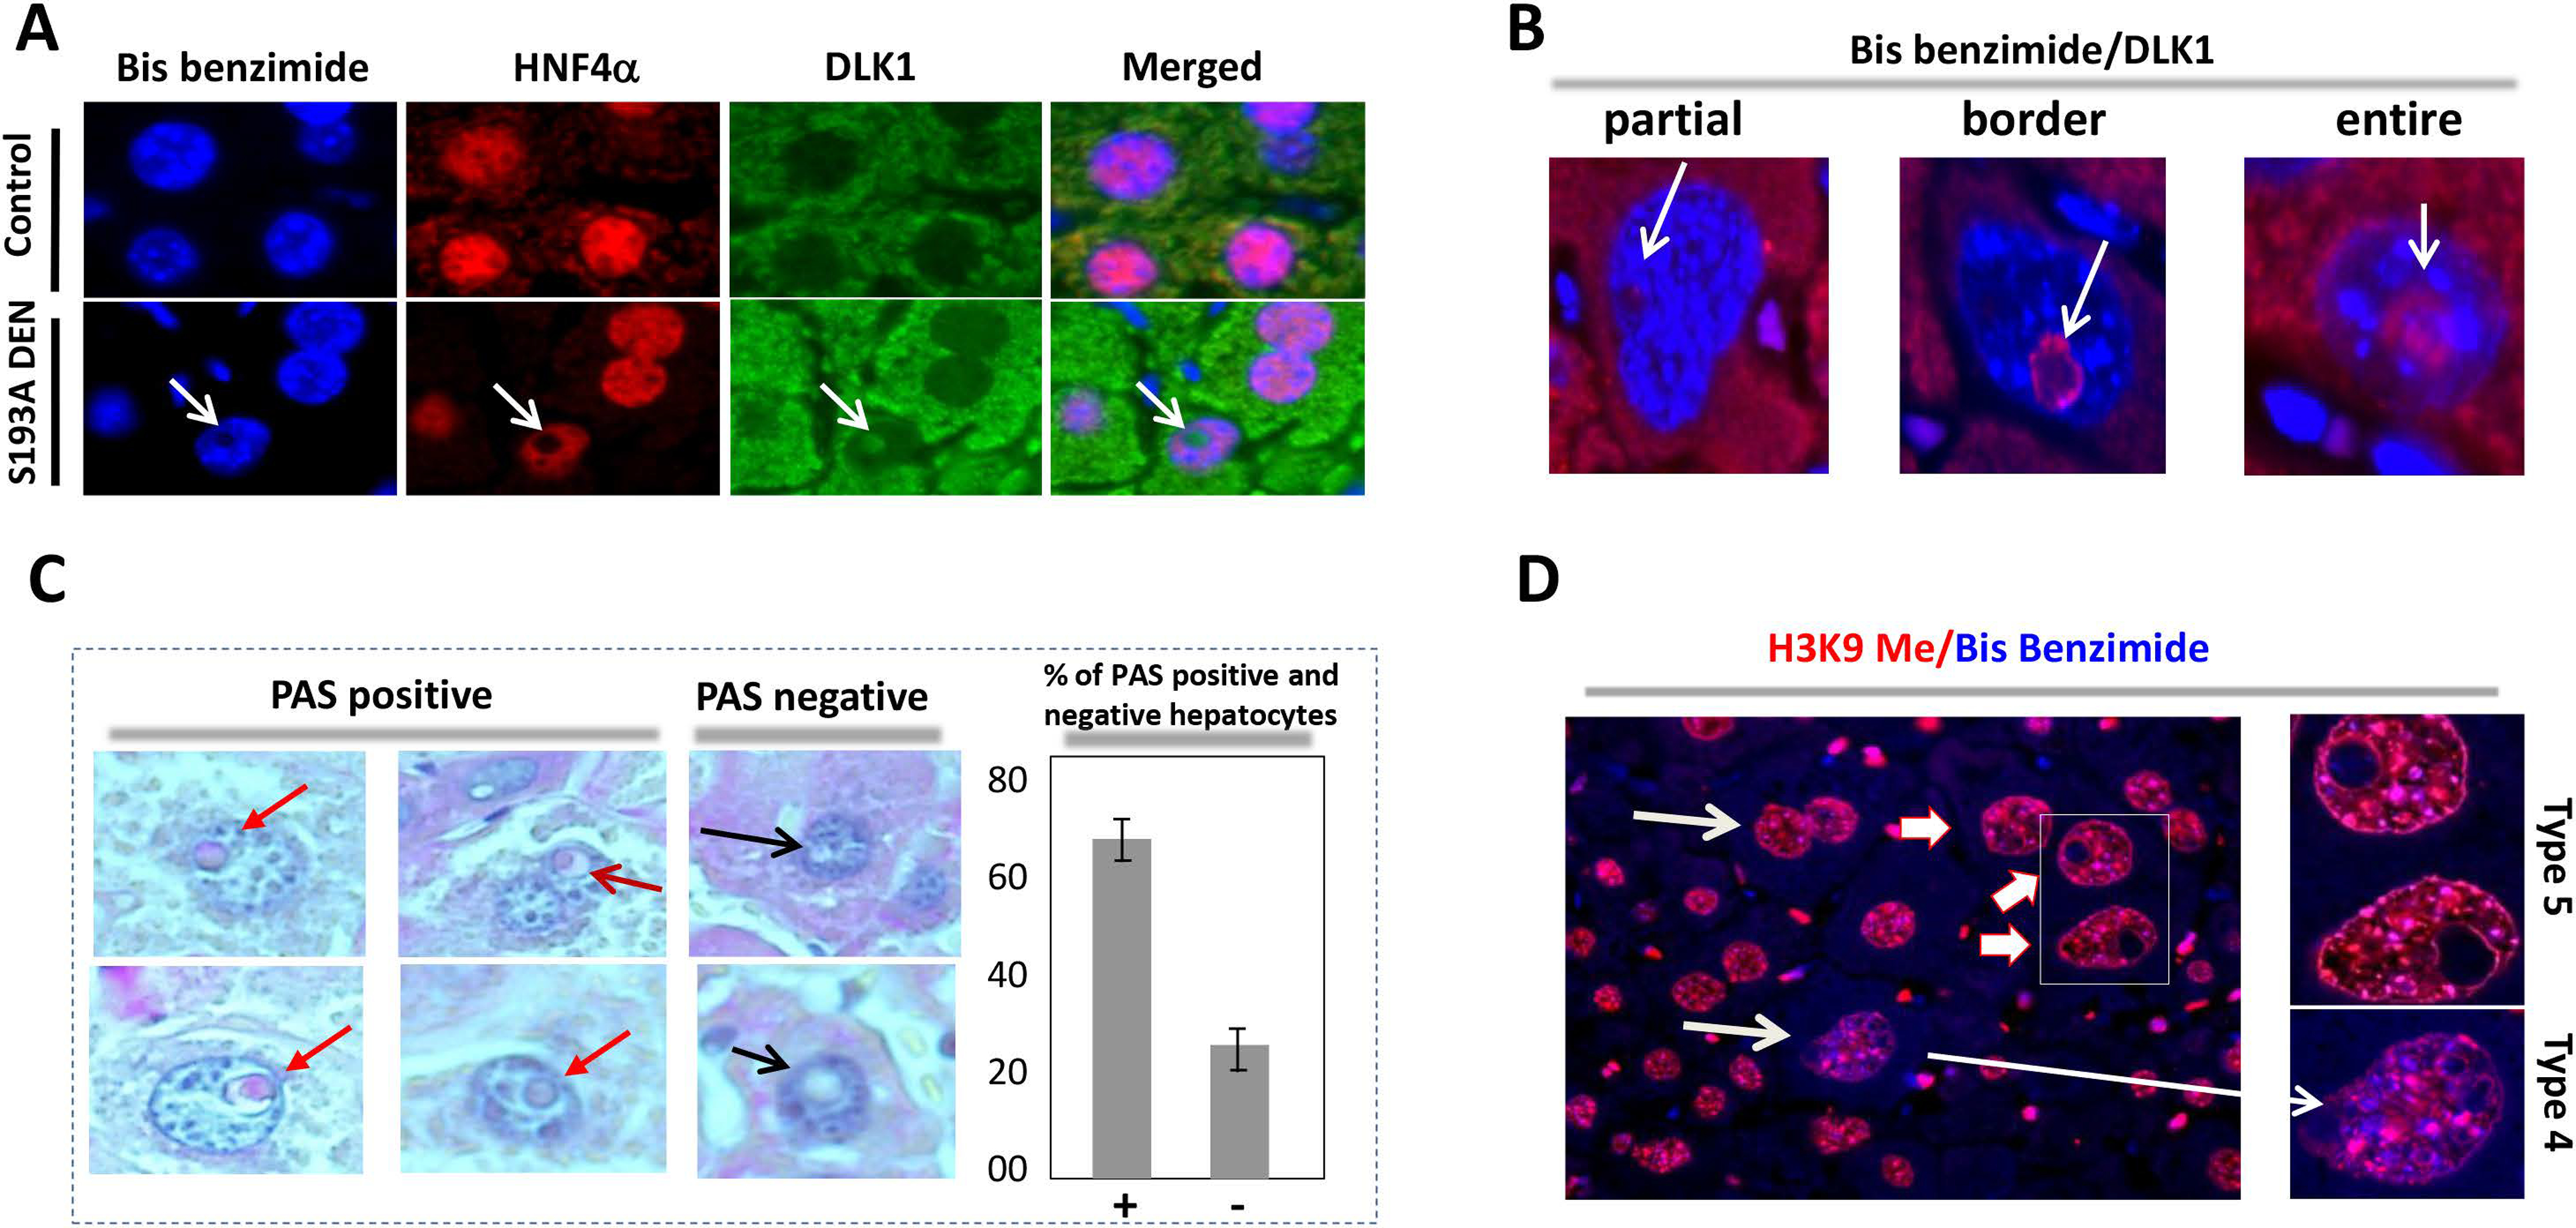
(A) Co-immunostaining of intra-nuclear inclusions of S193A mice with Abs to HNF4α and DLK1. (B) Type 5 hepatocytes contain DLK1 expression in entire inclusions and in a part of inclusions. (C) Around 60% of intra-nuclear inclusions are positive to glycogen staining. (D) Immunostaining with marker of heterochromatin H3K9-trimethylated and Bis Benzimide.
Isolation and characterization of PTIHs.
DLK1 is observed inside intra-nuclear inclusions of PTIHs and is not acceptable for interactions with Abs in intact cells for flow cytometry analysis. Therefore, we used a second characteristic of PTIHs which is a multinucleated phenotype (Fig 7A). We next visualized multi-nucleated PTIHs by staining with β-catenin, which is located in membranes and precisely outlines the cells. DEN treated WT livers contained roughly 0.2% of such hepatocytes; a majority of which contained 3 nuclei. However, the fraction of 3+ nuclei hepatocytes in control saline treated S193A livers is 3-folds higher and reaches 0.7%. In the tumor nodules of S193A DEN-treated livers, the fraction of 3+ nuclei hepatocytes represents up to 1.2–1.4% (Fig 7 B–C). The majority of multi-nucleated S193A hepatocytes display a shape of the cells which is consistent with fusion of hepatocytes.
Figure 7. C/EBPα-S193A mutant causes formation of multi-nucleated tumor initiating hepatocytes which are characterized by reduced expression of hepatocyte markers and by increased expression of stem cell markers.
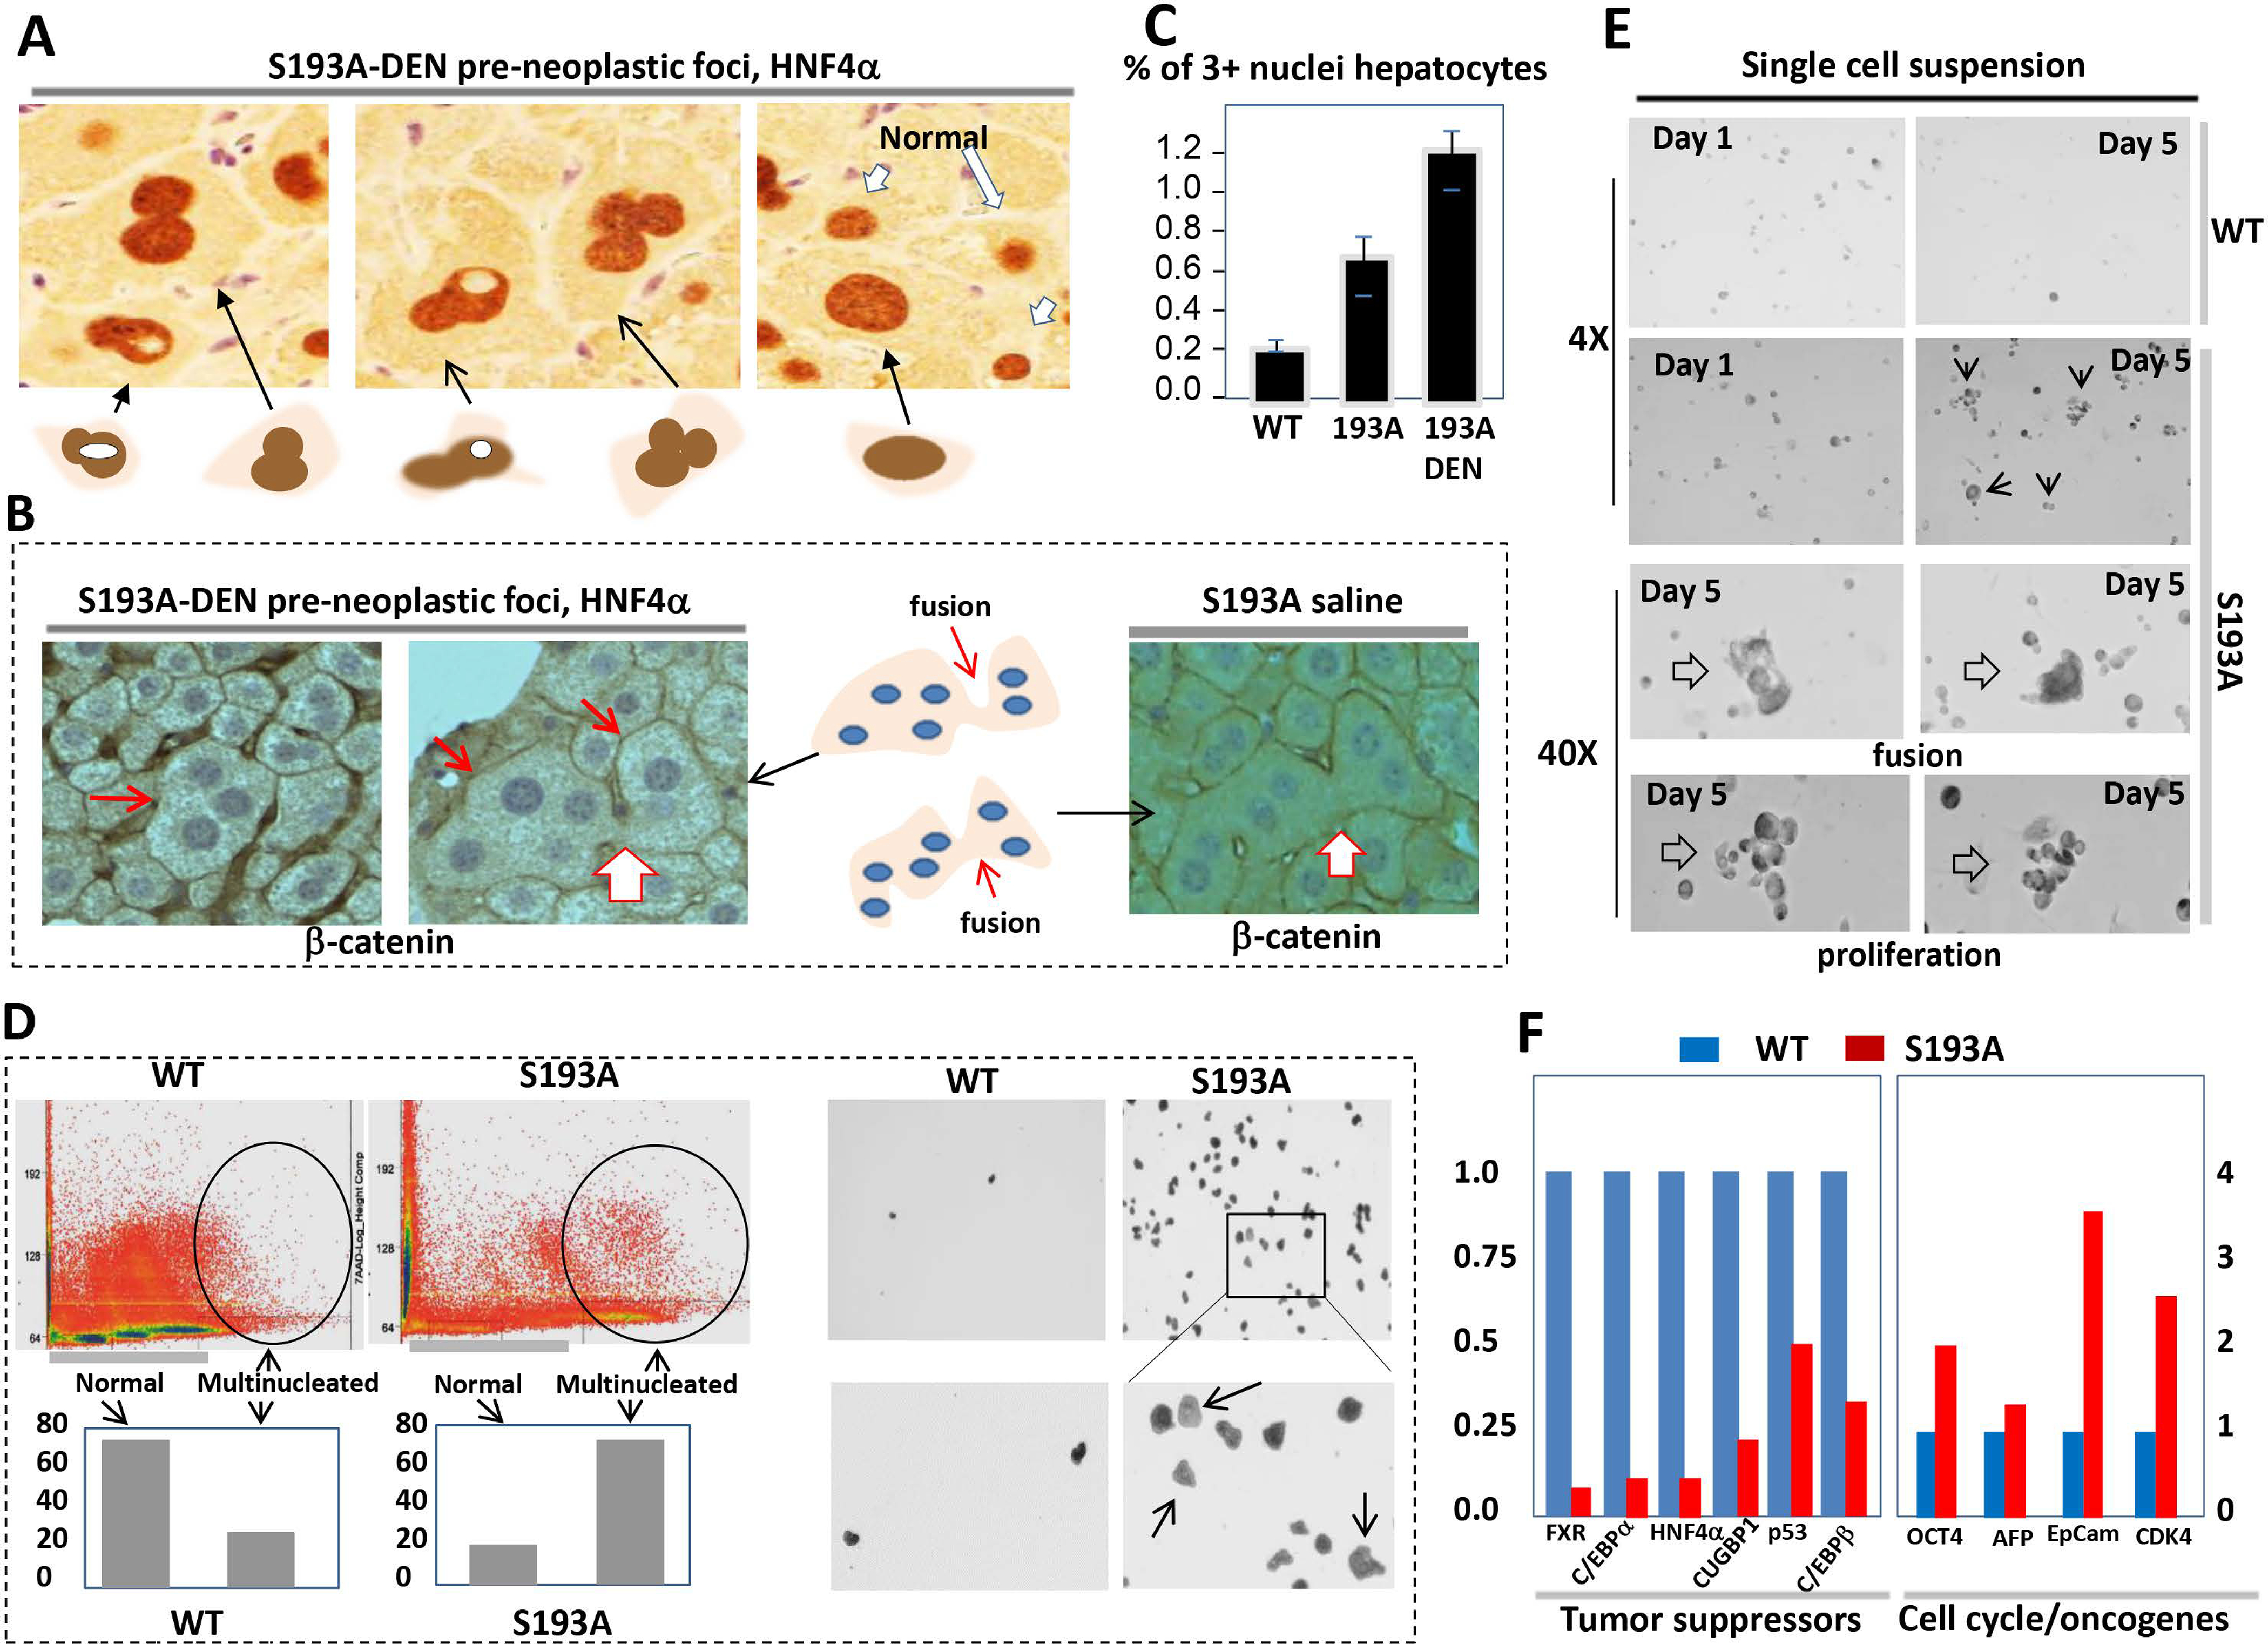
(A) Examples of multi-nucleated hepatocytes observed in dysplastic foci of DEN-treated S193A mice. HNF4α staining is shown. (B) β-catenin staining of foci of DEN-treated S193A mice 9 (left) and control saline treated mice (right). Gigantic, fused, multinucleated hepatocytes are shown by red arrows. (C) % of multi-nucleated hepatocytes (3+ nuclei) was calculated in livers of WT-DEN treated mice, S193A saline treated mice and S193A DEN-treated S193A mice. (D) Fractionation and isolation of multi-nucleated hepatocytes by Flow Cytometry from spontaneously developed tumor in S193A mice. Upper part shows distribution of hepatocytes according to the DNA content. The regions of hepatocytes with 3+ nuclei are circled. Bar graphs show that S193A livers contain dramatically elevated multi-nucleated hepatocytes. Right image: The images of multi-nucleated hepatocytes plated after Flow Cytometry. (E) Single cell suspension of tumor nodules of S193A mice was plated in culture and grown for 4 days. Bottom images show individual cells which are results of cell fusion and images of colonies of small cells that are result of the proliferation. (F) Examination of expression of tumor suppressor genes and stem cell markers in single cell suspension of WT and S193A mice using QRT-PCR approach.
We next purified multi-nucleated hepatocytes from liver of S193A mice with spontaneous cancer using Flow Cytometry. Hepatocytes were sorted on the basis of cell size and DNA content. The portion of multi-nucleated hepatocytes in S193A livers is dramatically higher than in livers of WT mice (Fig 7D). The purified hepatocytes were then plated and examined for proliferative capabilities. In these experiments, we plated an identical number of cells with a density of 20–30%. Hepatocytes of WT livers did not proliferate, although were adhered to the plates. On the contrary, sorted hepatocytes from tumors of S193A mice proliferated and had around 60–70% density at day 5 after plating (Fig 7D, right image). Unfortunately, further maintenance of these hepatocytes was not possible since cells started to die 5 days after plating.
Given the limited number of sorted large hepatocytes, we performed additional experiments with single cell suspensions of total cells. While single cell suspension from WT mice did not show expansion of cells and proliferation; the cells from tumors of S193A mice showed increased rate of proliferation by forming multi-cell colonies. We found that a portion of cells from S193A tumors also formed multi-nucleated cells which are consistent with cell fusion (Fig 7E). We also found that cells from S193A tumors have a dramatic reduction of mRNAs of tumor suppressors C/EBPα, p53, HNF4α and CUGBP1; while markers of stem cells EpCam, cdk4, Oct 4 and AFP are increased (Fig 7F).
PTIHs are abundant in aggressive pediatric liver cancer, in liver cancer of Pten/p53 DKO mice and in a patient with high risk for development of cancer.
De-ph-C/EBPα is elevated in patients with aggressive HBL (Fig 1). Therefore, we asked if these patients might have C/EBPα-dependent PTIHs. Ki67 staining showed that all samples have a high rate of liver proliferation in both background and tumor nodule sections. HNF4α staining demonstrated that tumor regions of aggressive HBL contain areas which are negative and positive for HNF4α (Fig 8A and Supplemental Figure 5). HNF4α-positive hepatocytes within background regions contain type 4 and type 5 PTIHs. Our data with S193A mice show that the appearance of hepatocytes with DLK1-positive intra-nuclear inclusions is a very early event of development of liver cancer. Therefore, we next asked if the hepatocytes with intra-nuclear inclusions in HBL patients with severe cancer might still express DLK1 inside inclusions. Staining with DLK1 antibodies showed that the majority of hepatocytes with intra-nuclear inclusions lost expression of DLK1; however, a small portion of type 5 hepatocytes are still positive for DLK1. Fig 8A (bottom panel) shows typical images of positive and negative hepatocytes in HBL samples at severe liver cancer. It is important to note that all available HBL samples are from the patients who underwent chemo-therapy. It is possible that the low number of hepatocytes with DLK1-positive inclusions might be the result of these treatments.
Figure 8. Tumor initiating hepatocytes are abundant in patients with aggressive HBL, in liver tumor sections of Pten/p53 DKO mice and in a patient with high risk for development of liver cancer.
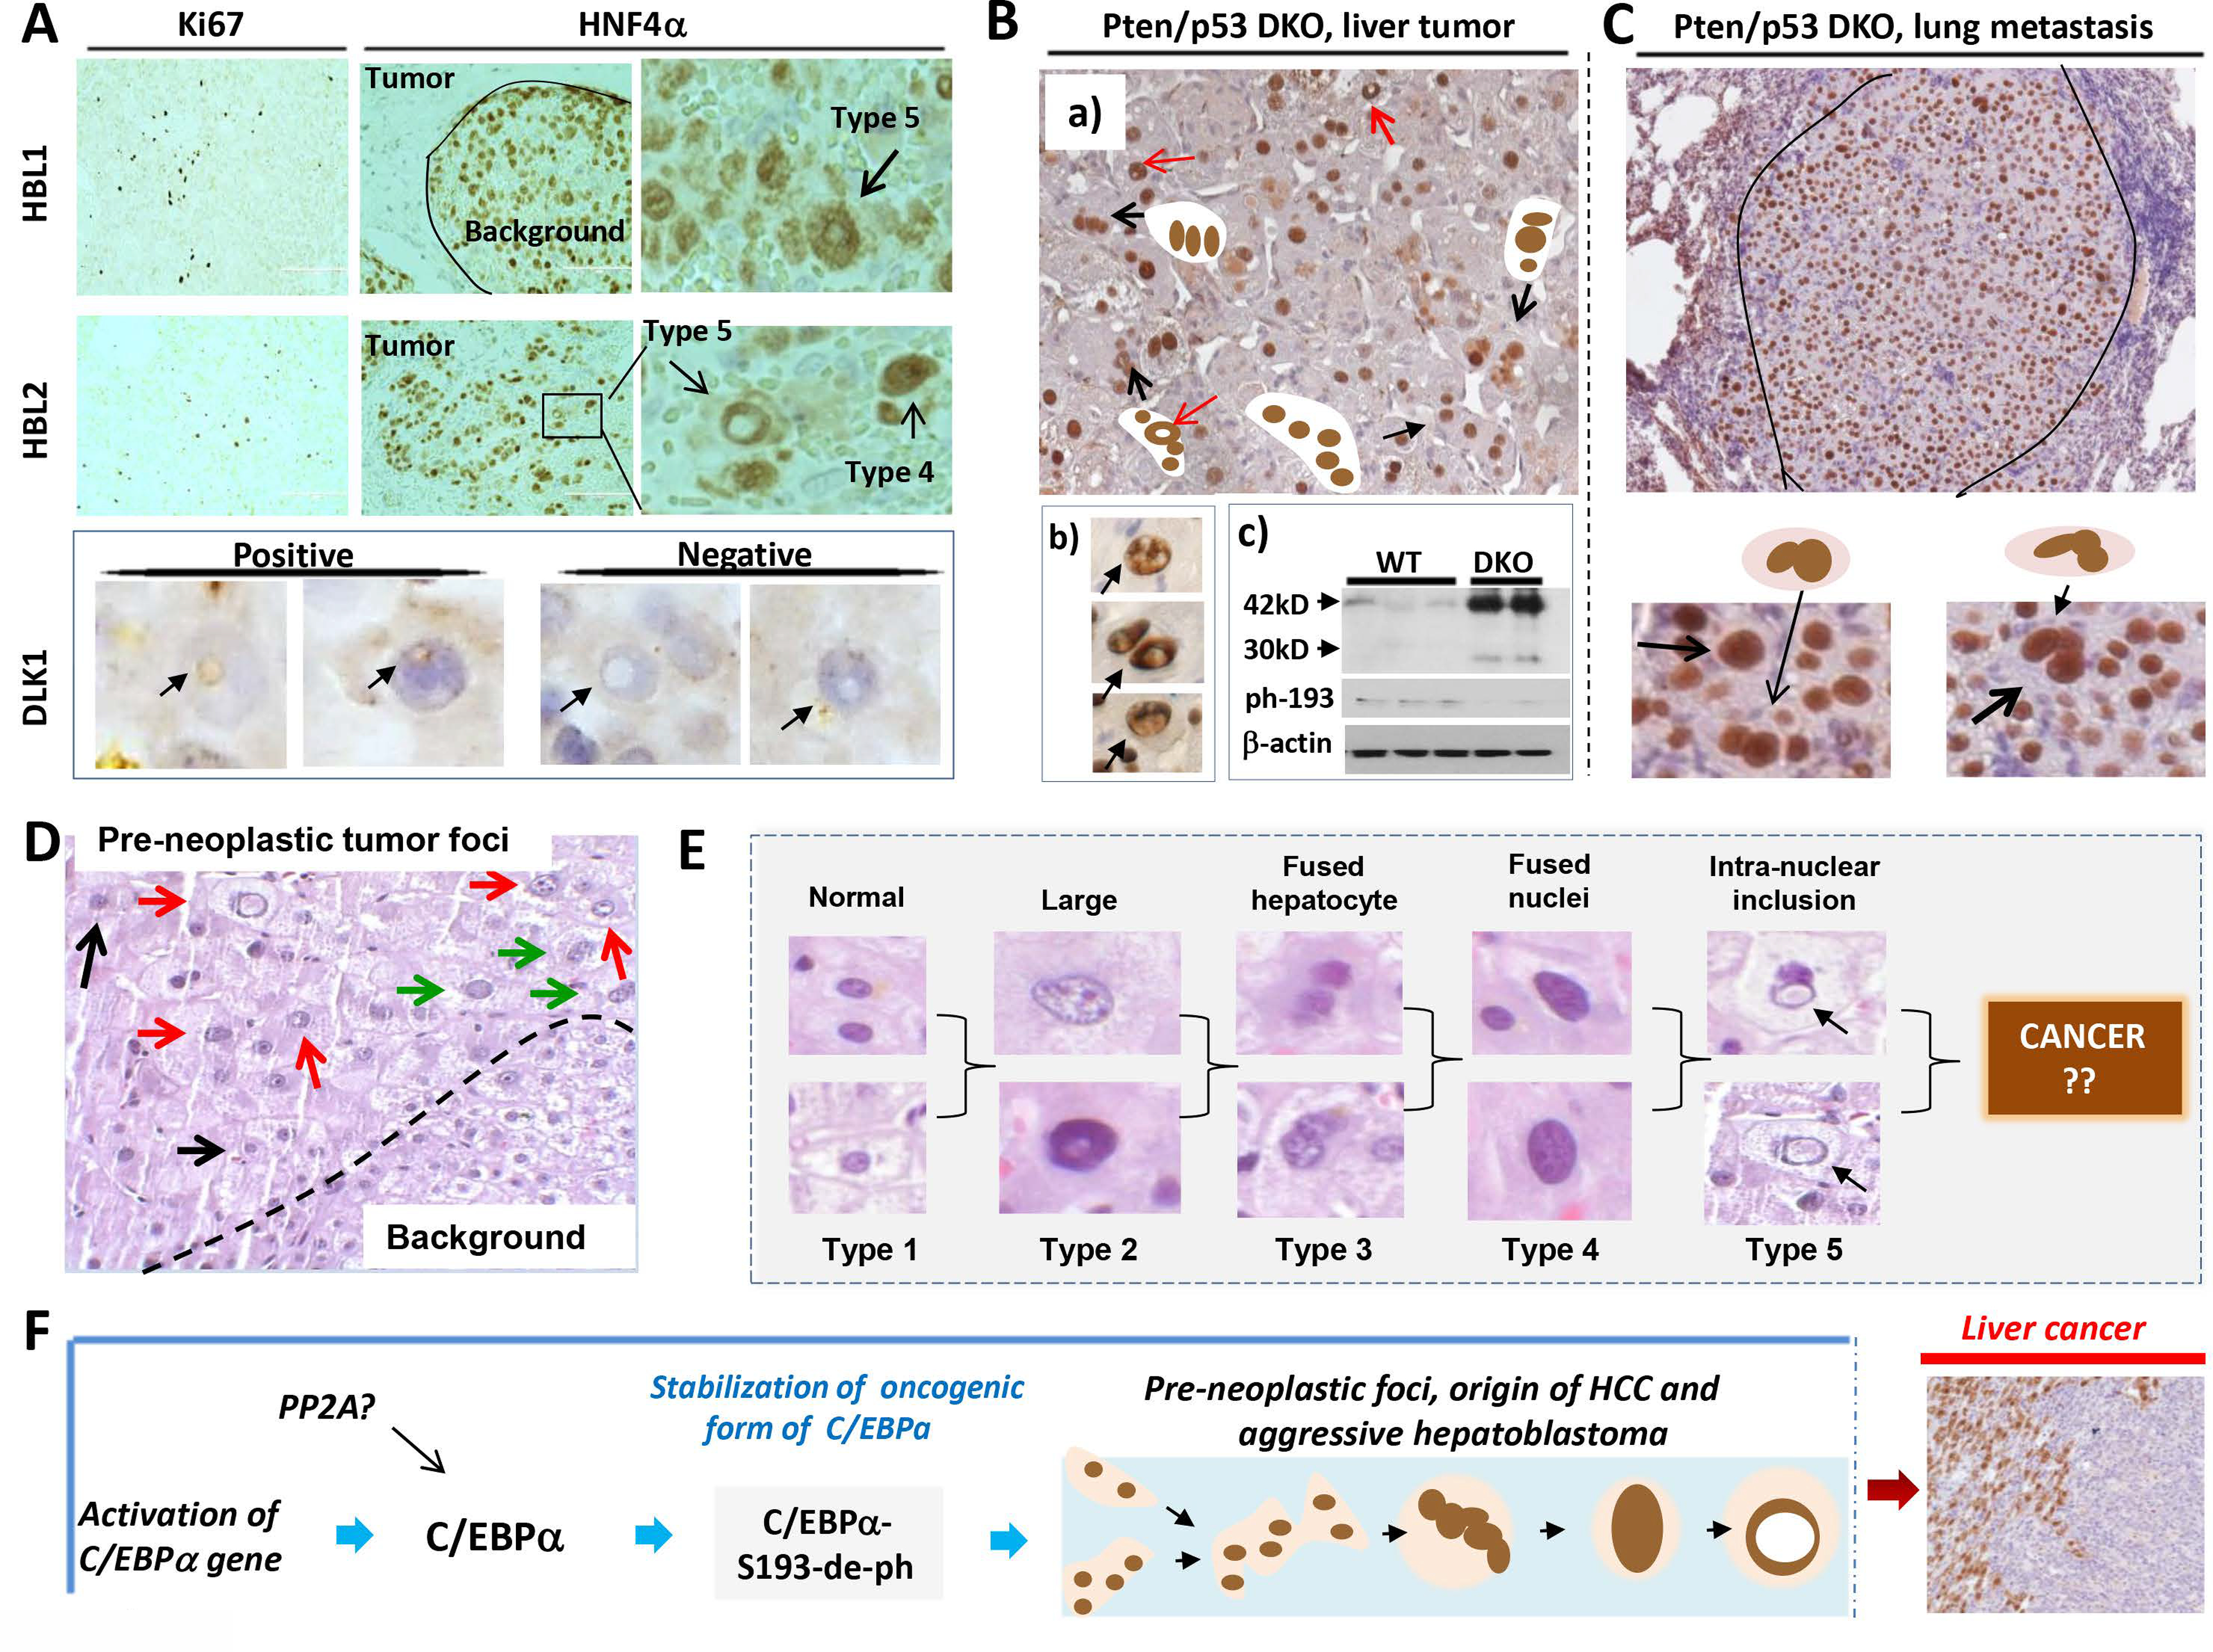
(A) ki67 and HNF4α staining of livers from patients with aggressive hepatoblastoma. Types 4 and 5 hepatocytes are shown by arrows on the enlarged images (right). Bottom panel shows staining with stem cell marker DLK1. Positive and negative type 5 hepatocytes are shown. (B) a): Typical picture of HNF4α staining of tumor nodules of Pten/p53 DKO mice. Multi-nucleated and type 5 hepatocytes are shown. Section b) shows enlarged images of PTIHs in the tumor nodules of Pten/p53 DKO mice. Section c) shows Western blotting with antibodies to total C/EBPα and to ph-S193-C/EBPα. (C) HNF4α staining of a lung metastasis in Pten/p53 DKO mice. Bottom shows enlarged images of PTIHs in the lung metastasis. (D) H&E staining of the liver of a patient who has high risk for development of liver cancer. Pre-neoplastic tumor foci and background areas are shown. This section of pre-neoplastic foci contains type 2 (black arrows), type 4 (green arrows) and type 5 (red arrows) hepatocytes. (E) Summary for all types of hepatocytes observed in pre-neoplastic foci of a patient with high risk of liver cancer. (F) The main hypothesis for the origin of aggressive HBL and HCC (see text).
We next investigated hepatocytes in double knockout Pten/p53 mice that develop liver cancer rapidly. Approximately 6% of mice have metastases, primarily in lung30. In liver tumor sections of Pten/p53 DKO mice, we have observed the accumulation of HNF4α-positive multi-nucleated hepatocytes (types 3–5) and abundant hepatocytes with intra-nuclear HNF4α-negative inclusions (Fig 8B, “a” and “b”). To determine C/EBPα levels and phosphorylation status of C/EBPα, we performed Western blotting examination of nuclear proteins from WT and Pten/p53 tumors. These studies demonstrated that, similar to DEN-treated S193A mice, levels of C/EBPα are elevated, but C/EBPα is not phosphorylated at Ser193 in liver tumors of Pten/p53 mice (Fig 8B, “c”). We found that multi-nucleated hepatocytes are also abundant in tumor sections of lung metastases (Fig 8C). In addition to this mouse model, we detected PTIHs in WT mice that spontaneously develop liver cancer with age (Supplemental Figure 6).
We next asked if we can detect the PTIHs in patients with high risk for liver cancer prior to having symptoms of liver cancer. Investigations of the biopsies of a young individual, who has telomere shortening secondary to Dyskeratosis Congenita, showed dysplastic foci that look like early tumor nodules (Fig 8D). Within these foci, we detected cells with intra-nuclear inclusions similar to those observed in the very early tumor nodules of DEN-treated C/EBPα-S193A mice. Figure 8E summarizes the morphology of hepatocytes in the dysplastic foci of this patient. Taken together, examination of patients with aggressive HBL, liver cancer in Pten/p53 DKO mice, spontaneous liver cancer in WT mice and a patient with high risk liver cancer showed that PTIHs are abundant in these cancers and in high risk liver cancer patient.
Discussion
Although the initial studies suggested a critical role of progenitor cells in the development of liver cancer, recent findings questioned their role in liver cancer1–3,31 In this paper, we performed a systemic analysis of several mouse models of liver cancer, a large cohort of pediatric liver cancer, and a patient who has a high risk for the development of liver cancer. Figure 8F summarizes our major findings within C/EBPα-dependent early pre-neoplastic foci. The main result is that these regions are the origin of HCC and aggressive HBL, where de-differentiation of hepatocytes into PTIHs takes place. The first event is the activation of C/EBPα transcription leading to elevation of C/EBPα protein. The next step includes the de-ph of C/EBPα at Ser193 (Ser190 in human protein) which converts C/EBPα into a protein with oncogenic activities. The de-ph-S193/S190-C/EBPα further causes a cascade of transformations of hepatocytes into PTIHs.
The majority of our molecular cause-effect data for this hypothesis were obtained in genetically modified animal models. Although these studies are critical and important, the question remains as to how de-ph-S190-C/EBPα is activated in naturally occurring HCC and HBL and if this activation causes de-differentiation of hepatocytes in human settings. This is a very challenging question since all human liver cases are diagnosed at severe stages and there are only indirect and correlative approaches to examine this issue. In this regard, we have detected de-ph-S190-C/EBPα isoform and a signature of C/EBPα-dependent molecular events in background (not tumor) regions of the livers in several patients with HBL. These alterations are similar to those observed in S193A-DEN treated mice. Thus, we conclude that the pre-neoplastic foci with PTIHs are the origin of aggressive HBL and HCC.
Supplementary Material
Acknowledgements:
We thank Amber D’Souza, Alex Bondoc and Katie Glaser for the discussion of the results.
Financial support: This work is supported by NIH grants R01DK102597 and R01CA159942 (NT), and by Internal Development Funds from CCHMC (NT and SS).
List of abbreviations:
- C/EBPα
CCAAT/Enhancer Binding Protein α
- HBL
hepatoblastoma
- HCC
hepatocellular carcinoma
- CSC
Cancer Stem Cells
- SEC
Size Exclusion Chromatography
- FXR
farnesoid X receptor
- Gank
Gankyrin
- DEN
diethylnitrosamine
- DLK1
delta-like 1 homolog
- TIHs
tumor initiating hepatocytes
References
- 1.Fitamant J, Kottakis F, Benhamouche S, Tian HS, Chuvin N, Parachoniak CA. et al. YAP inhibition restores hepatocyte differentiation in advanced HCC, leading to tumor regression. Cell Rep 2015; 161:1553–1565. [DOI] [PMC free article] [PubMed] [Google Scholar]
- 2.Benhamoucheh S Curto M, Saotome I, Gladden AB, Liu CH, Giovannini M. et al. Nf2/Merlin controls progenitor homeostasis and tumorigenesis in the liver. Gen Dev 2010; 24: 1718–1730. [DOI] [PMC free article] [PubMed] [Google Scholar]
- 3.He G, Dhar D, Nakagawa H, Font-Burgada J, Ogata H, Jiang Y. et al. Identification of liver cancer progenitors whose malignant progression depends on autocrine IL-6 signaling. Cell 2013; 155: 384–396. [DOI] [PMC free article] [PubMed] [Google Scholar]
- 4.Sia D, Villanueva A, Friedman SL, Llovet JM. Liver Cancer Cell of Origin, Molecular Class, and Effects on Patient Prognosis. Gastroenterology 2017; 152:745–761. [DOI] [PubMed] [Google Scholar]
- 5.Michalopoulos GK. Hepatostat: Liver regeneration and normal liver tissue maintenance. Hepatology 2017; 65:1384–1392. [DOI] [PubMed] [Google Scholar]
- 6.Shin S, Wangensteen KJ, Teta-Bissett M, Wang YJ, Mosleh-Shirazi E, Buza EL. et al. Genetic lineage tracing analysis of the cell of origin of hepatotoxin-induced liver tumors in mice. Hepatology 2016; 64: 1163–1177. [DOI] [PMC free article] [PubMed] [Google Scholar]
- 7.Tschaharganeh DF, Xue W, Calvisi DF, Evert M, Michurina TV, Dow LE. et al. p53-dependent Nestin regulation links tumor suppression to cellular plasticity in liver cancer. Cell 2016; 158: 579–592. [DOI] [PMC free article] [PubMed] [Google Scholar]
- 8.Chen Y, Wong PP, Sjeklocha L, Steer CJ, Sahin MB. Mature hepatocytes exhibit unexpected plasticity by direct dedifferentiation into liver progenitor cells in culture. Hepatology 2012; 55: 563–574. [DOI] [PMC free article] [PubMed] [Google Scholar]
- 9.Oishi N, Yamashita T, Kaneko S. Molecular Biology of Liver Cancer Stem Cells. Liver Cancer 2014; 3: 71–84. [DOI] [PMC free article] [PubMed] [Google Scholar]
- 10.Carter AJR, and Nguyen CN. A comparison of cancer burden and research spending reveals discrepancies in the distribution of research funding. BMC Public Health 2012; 12: 26–38. [DOI] [PMC free article] [PubMed] [Google Scholar]
- 11.Timchenko NA, and Lewis K. Elimination of Tumor Suppressor Proteins during Liver Carcinogenesis. Cancer Studies and Molecular Medicine 2015; 1: 27–38. [Google Scholar]
- 12.Martin J, Dufour JF. Tumor suppressor and hepatocellular carcinoma. World J Gastroenterology 2008; 14: 1720–1733. [DOI] [PMC free article] [PubMed] [Google Scholar]
- 13.Aguirre E, Renner O, Narlik-Grassow M, Blanco-Aparicio C. Genetic Modeling of PIM Proteins in Cancer: Proviral Tagging and Cooperation with Oncogenes, Tumor Suppressor Genes, and Carcinogens. Front Oncol 2014; 15: 4:109. [DOI] [PMC free article] [PubMed] [Google Scholar]
- 14.Tomizawa M, Horie H, Yamamoto H, Matsunaga T, Sasaki F, Hashizume K. et al. Reciprocal expression of CCAAT/enhancer binding proteins alpha and beta in hepatoblastomas and its prognostic significance. Oncol Rep 2007; 17: 341–344. [PubMed] [Google Scholar]
- 15.Lu GD, Ang YH, Zhou J, Tamilarasi J, Yan B, Lim YC. et al. CCAAT/enhancer binding protein α predicts poorer prognosis and prevents energy starvation-induced cell death in hepatocellular carcinoma. Hepatology 2015; 61: 965–978. [DOI] [PMC free article] [PubMed] [Google Scholar]
- 16.Timchenko NA. Aging and liver regeneration. Trends Endocrinol Metab 2009; 20: 171–176. [DOI] [PubMed] [Google Scholar]
- 17.Wang G-L, Iakova P, Wilde M, Awad S, and Timchenko NA. Liver tumors escape negative control of proliferation via PI3K/Akt-mediated block of C/EBPα growth inhibitory activity. Gen & Dev 2004: 18: 912–925. [DOI] [PMC free article] [PubMed] [Google Scholar]
- 18.Wang G-L, Shi X, Salisbury E, Sun Y, Albrecht JH, Smith RG. et al. Cyclin D3 maintains growth-inhibitory activity of C/EBPα by stabilizing C/EBPα-cdk2 and C/EBPα-Brm complexes. Mol Cell Biol 2006; 26: 2570–2582. [DOI] [PMC free article] [PubMed] [Google Scholar]
- 19.Wang G-L, Shi X, Haefliger S, Jin J, Major A, Iakova P. et al. Elimination of C/EBPα through the ubiquitin-proteasome system promotes the development of liver cancer in mice J. Clin Invest 2010; 120: 2549–2562. [DOI] [PMC free article] [PubMed] [Google Scholar]
- 20.Jiang Y, Iakova P, Jin J, Sullivan S, Sharin V, Hong I-H. et al. FXR inhibits gankyrin in mouse livers and prevents development of liver cancer. Hepatology 2013; 57: 1098–1106. [DOI] [PMC free article] [PubMed] [Google Scholar]
- 21.Valanejad L, Lewis K, Wright M, Jiang Y, D’Souza A, Karns R. et al. FXR-Gankyrin axis is involved in development of pediatric liver cancer. Carcinogenesis 2017; May 23. doi: 10.1093/carcin/bgx050. [Epub ahead of print] [DOI] [PMC free article] [PubMed] [Google Scholar]
- 22.Jin J, Hong IH, Lewis K, Iakova P, Breaux M, Jiang Y. et al. Cooperation of C/EBP family proteins and chromatin remodeling proteins is essential for termination of liver regeneration in mice. Hepatology 2015; 61: 315–325. [DOI] [PMC free article] [PubMed] [Google Scholar]
- 23.Michalopoulos GK. Terminating hepatocyte proliferation during liver regeneration: The roles of two members of the same family (C/EBP α and β) with opposing actions. Hepatology July 26. doi: 10.1002/hep.27329 (2015). [DOI] [PubMed] [Google Scholar]
- 24.Luo JH, Ren B, Keryanov S, Tseng GC, Rao UN, Monga SP. et al. Transcriptomic and genomic analysis of human hepatocellular carcinomas and hepatoblastomas. Hepatology 2006; 44: 1012–1024. [DOI] [PMC free article] [PubMed] [Google Scholar]
- 25.Cairo S, Armengol C, De Reyniès A, Wei Y, Thomas E, Renard CA. et al. Hepatic stem-like phenotype and interplay of Wnt/beta-catenin and Myc signaling in aggressive childhood liver cancer. Cancer Cell 2008; 14: 471–484. [DOI] [PubMed] [Google Scholar]
- 26.Cairo S, Wang Y, de Reyniès A, Duroure K, Dahan J, Redon MJ, et al. Stem cell-like micro-RNA signature driven by Myc in aggressive liver cancer. Proc Natl Acad Sci USA 2010; 107: 20471–20476. [DOI] [PMC free article] [PubMed] [Google Scholar]
- 27.Eichenmüller M, Trippel F, Kreuder M, Beck A, Schwarzmayr T, Häberle B. et al. The genomic landscape of hepatoblastoma and their progenies with HCC-like features. J Hepatol 2014; 61: 1312–1320. [DOI] [PubMed] [Google Scholar]
- 28.Jin J, Iakova P, Breaux M, Sullivan E, Jawanmardi N, Chen D. et al. Increased expression of enzymes of triglyceride synthesis plays is essential for the development of hepatic steatosis. Cell Reports 2013: 3:831–843. [DOI] [PMC free article] [PubMed] [Google Scholar]
- 29.Shin S, Walton G, Aoki R, Brondell K, Schug J, Fox A. et al. Foxl1-Cre-marked adult hepatic progenitors have clonogenic and bilineage differentiation potential. Gen & Dev 2011; 25: 1185–1192. [DOI] [PMC free article] [PubMed] [Google Scholar]
- 30.Zhu L, Finkelstein D, Gao C, Shi L, Wang Y, López-Terrada D. et al. Multi-organ Mapping of Cancer Risk. Cell 2018; 166: 1132–1146 (2016). e7. doi 10.1016/j.cell.2016.07.045. [DOI] [PMC free article] [PubMed] [Google Scholar]
- 31.Shin S, Upadhyay N, Greenbaum LE, Kaestner KH. Ablation of Foxl1-Cre-labeled hepatic progenitor cells and their descendants impairs recovery of mice from liver injury. Gastroenterology 2015; 148: 192–202.e3. [DOI] [PMC free article] [PubMed] [Google Scholar]
Associated Data
This section collects any data citations, data availability statements, or supplementary materials included in this article.


