Abstract
The purpose of this work is to study the dynamics of the accommodative response as a function of the subject's refractive error, as a first step in determining whether an anomalous accommodative function could affect emmetropization or trigger myopia progression. A secondary goal was to establish potential relationships between the speed of accommodation and other parameters in the accommodation process. Parameters related to the speed and amplitude of accommodation, convergence, miosis, and change in high-order aberrations were measured during the accommodative process for 2.8 D demand in 18 young healthy subjects (mean age 25.0 ± 4.7 years) with a range of refractive errors between 0 and -7.5 D (spherical equivalent). Measurements were performed in real time (25 Hz) with an open-view binocular Hartmann-Shack (HS) sensor using a GPU-based processing unit. Correlation coefficients were calculated between refractive error and each computed variable. Additionally, the speed of accommodation was correlated with all the other parameters in the study. Correlation coefficients with refractive error had non-zero values for several parameters of the accommodative response but p-values were higher than 0.05 except in two cases: with pupil miosis speed (R = –0.49, p = 0.041) and with lag of accommodation (R = –0.57, p = 0.014). Additionally, correlation values with p-value < 0.05 were found between accommodation speed and convergence duration (R = 0.57, p = 0.014), convergence speed (R = 0.48, p = 0.044), and pupil miosis amplitude (R = 0.47, p = 0.049). We did not find strong evidence of a link between myopia and altered dynamics of the accommodation process. Only miosis speed was found to be correlated to refractive error with p < 0.05, being slower for myopes. On the other hand, increased lag of accommodation tends to be associated to larger refractive errors. Additionally, our data suggests that the faster the accommodation, the faster and longer the convergence and the larger the pupil miosis.
1. Introduction
Myopia is a refractive error in which light from distant objects is focused in front of the retina when accommodation is relaxed. People with spherical refractive errors ≤ -0.50 diopters (D) and ≤ -6 D are considered myopes and high myopes, respectively [1]. This refractive error is due to axial elongation of the eyeball and flattening of the crystalline lens in myopes, while corneal power seems to remain the same [2]. Recently, there has been an increasing interest in the study of myopia since it became a global epidemic [3]. For instance, in some East Asian communities, 96.5% of the young population is myopic [4]. In addition, myopia and specifically high myopia can lead to Myopic Macular Degeneration (MMD), retinal detachment and less frequently to glaucoma, and cataracts [5]. There are several theories regarding the cause and prevalence of myopia [6]. Genetics is a strong factor; however, a recent study of twins suggests that refractive error is mostly affected by a shared environment rather than heritability [7]. Other risk factors of myopia are near work [8], insufficient outdoor activities in children [9], and low luminance conditions [10].
Accommodation is the ability of the crystalline lens to alter its focus to maintain a sharp image on the retina [11]. The link between myopia and accommodation has been intensively investigated and still this is uncertain [12–14]. The accommodative lag, or insufficient amount of accommodation, causes hyperopic defocus on the retina, which, if sustained over long periods, might prompt axial elongation in the eye and therefore stimulate the onset of myopia during childhood [15,16]. Some studies show that there is a relationship between the lag of accommodation and myopia [17]. On the other hand, some studies do not find any relationship between myopia and the accommodative lag [12,18,19]. A recent study shows that the accommodation error does not lead to future eye growth in chickens and therefore, myopia [20]. In addition, myopes need higher spatial frequencies to provoke their accommodation [21]. Hence, substantial challenges faced by researchers are to ascertain how accommodation affects myopia and whether lag of accommodation can be either a cause or an effect of myopia. The other parameters that may affect myopia during accommodation are vergence, pupil size, and high order aberrations (HOA) [22]. Nevertheless, many studies have measured the accommodation response in a static state without monitoring dynamic changes in the far-near response. Therefore, since accommodation, vergence, and pupil size are closely related to one another, it would be more informative to measure their dynamics simultaneously in natural viewing conditions.
In this study, we measured accommodation, pupil size, vergence, and HOAs in real time. We computed an assortment of variables related to the far-near response and performed correlation analysis with refractive error. The aim of this analysis is to establish whether an abnormal accommodative function can be related to myopia, and to determine which parameters, if any, can be considered a risk factor for myopia.
2. Methods
2.1. Open-view sensor instrument
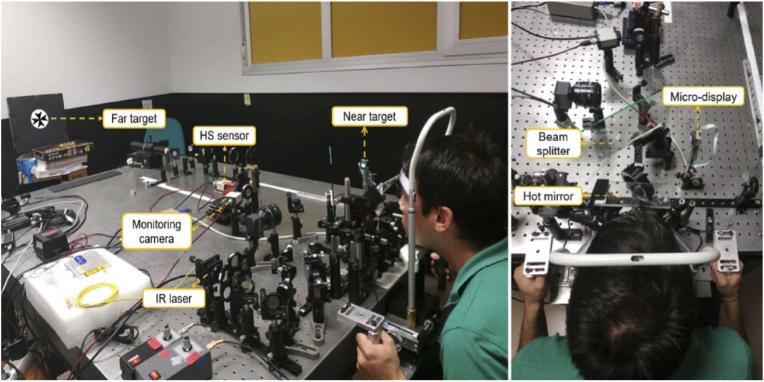
Pictures of the used open-view system are shown in Fig. 1. The concept and basic arrangement of the sensor used in this study have been previously reported [23], although it has been improved both optically and computationally. Briefly, in the illumination arm, we use an infrared (IR) laser source with peak emission at 1055 nm (Broadband ASE source 1μm band, Multiwave Photonics, Portugal). Since the laser source is invisible, the subject is unaware of its presence while fixating on near and far targets. The laser beam is expanded and split into two equal-size, equal-intensity beams reflected from an 8/92 pellicle beam splitter and directed toward twin periscopes and then a large hot mirror. The periscopes increase the distance between the two illumination beams to account for the interpupillary distance while keeping them parallel to each other. The hot mirror is tilted 45° horizontally and provides the subject a large open field of view. The intensity of the illumination beams is at least one order of magnitude below the safety limits [24]. After reflection in the retinas, the IR light is redirected to the lower level by the hot mirror, compacted by the twin-periscope arrangement that removes most of the interpupillary distance and demagnified by a 0.3-magnification telescope onto a single Hartmann-Shack (HS) sensor. This arrangement produces two circular distributions of spots close to each other but not overlapping and allows simultaneous measurement of both eyes’ aberrations avoiding hardware duplication. The system includes a CCD camera that operates at 25 Hz (Hamamatsu C7500-51, Hamamatsu K. K., Japan) and a 192-µm-pitch, 3.17-mm-focal-length microlens array (APO-Q-P192-F3.17, OKO Tech, The Netherlands), shorter than in previous versions of the open-view HS, thus increasing the dynamic range for myopic subjects measurement. The lenslet array is conjugated with the pupil plane.
Fig. 1.
Left: Binocular open-view sensor, which includes IR laser (1050 nm), monitoring camera, and Hartmann-Shack sensor, all of them set at a lower level with respect to the subject's line of sight and reached through a twin periscope system and a wide IR hot mirror. The setup includes near and far targets combined using a beam splitter. Right: the view of the system. The hot mirror redirects the 1050-nm measurement beams from and to the lower level, making the system open-view. The subjects can readily shift their accommodation between far and near stimuli in natural viewing conditions.
The apparatus also includes a pupil monitoring arm to ensure that the subject's pupils are adequately positioned. IR LEDs (900-nm) are used for illumination of the anterior part of the eyes. The reflected 900-nm light follows the same path as the measurement 1050-nm light before being directed by a cold mirror with a cutoff frequency of 950 nm towards a second CCD camera (Hamamatsu C7500-51, Hamamatsu K. K., Japan) focused to a plane conjugated to the HS sensor. When the subject's pupils are seen in focus, proper conjugation with the HS measurement plane is assured.
The near target was an OLED micro-display (SVGA+ 0.6”; eMagin, USA) located 36 cm (2.8 D) from the subject. The distant target was an LCD monitor (SXGA; Dell UltraSharp 1704FPT 17” Flat Panel) located 2.8 m (0.36 D) away. Spatial resolution was 210 c/deg and 91 c/deg for near and far targets, respectively. Both stimuli, shared the same field of view (1.3°), were calibrated to have nearly the same luminance (14.3 and 15.4 Cd/m2, respectively), and were combined using a 50/50 beam splitter vertically tilted to put them both in line with the subject's nose.
2.2. Control software
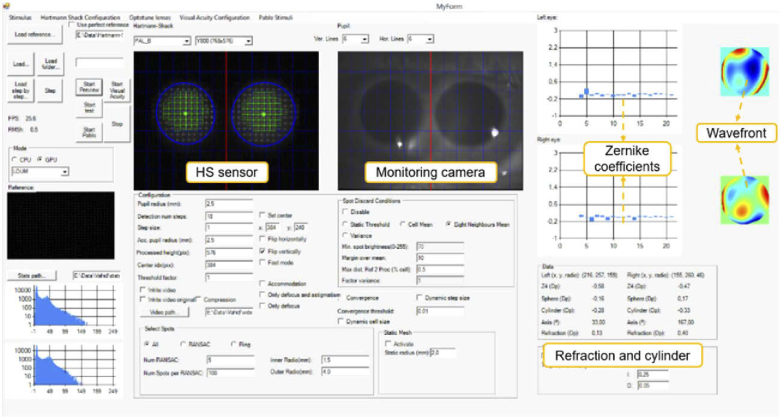
A customized software package with an embedded eye tracker was developed for the open-view system. Figure 2 shows a screenshot of the Graphical User Interface (GUI). The wavefront sensing procedure includes pupil tracking (blue circles in Fig. 2), HS centroid searching (green squares in Fig. 2), and wavefront modal reconstruction. Stimuli type, presentation time, and luminance can be customized. The GUI shows both the HS sensor and pupil images, which facilitates the subject's alignment. GPU computation allows high speed, real time [25] calculation of both eyes’ Zernike coefficients and objective refraction, and wavefront maps shown in real time (25 Hz, limited by the camera frame rate).
Fig. 2.
Screenshot of GUI. Objective sphero-cylindrical refraction (bottom right), and Zernike coefficient values and wavefront maps (top right) are displayed in real time. The pupil monitoring window (top center-right) assists the operator in positioning the subject in the correct measurement plane. The operator can modify the measurement pupil radius and other HS processing parameters (bottom center). Visualization of the unprocessed HS image (top center-left) and histograms (bottom left) helps avoiding corneal reflections.
2.3. Subjects
Eighteen young subjects (eight males, ten females; mean age 25.0 ± 4.7 years) participated in this study, with refractive error (SE) ranging from 0 D to –7.5 D (mean value -2.3 D) and less than -2 D of astigmatism. Subjective visual acuity (VA) was determined with an adaptive optics visual simulator (VAO, Voptica SL, Murcia, Spain) [26]. Every subject had a best-corrected VA 20/20 or better in each eye. None of the subjects had ocular pathologies or surgery. If a subject had fixation problems or binocular vision dysfunction, they would have been excluded from the experiment. Before performing the measurements, subjects were informed about the aims, procedures, and possible risks of the experiment. We obtained the written consent of the subjects before performing the experiment. The study follows the Declaration of Helsinki and adheres to the ethical principles of the University of Murcia.
2.4. Experimental procedure
Subjects were instructed about the experimental procedure before performing the task. During the measurements, subjects were corrected with their spectacles or contact lenses (two subjects). The chinrest was mounted on a three-axis stage. Axial positioning was achieved by focusing both pupil images on the pupil monitoring system, ensuring conjugation with the HS measurement plane. Subsequently, lateral movements in horizontal and vertical directions were produced to fit both pupils inside the HS sensor area while avoiding corneal reflexes. Far and near stimuli were black Maltese crosses on white background (Fig. 3).
Fig. 3.
A simplified schematic of the open-view system. Each subject underwent three cycles of far-near accommodation in one set of measurements. We repeated each measurement at least three times to ensure a noise-free measurement. Far and near targets are located at 2.8 D and 0.36 D, respectively. The Maltese cross with a white background is used as the stimulus.
The accommodation response was represented in spherical equivalent (SE) in diopters and calculated by the following formula:
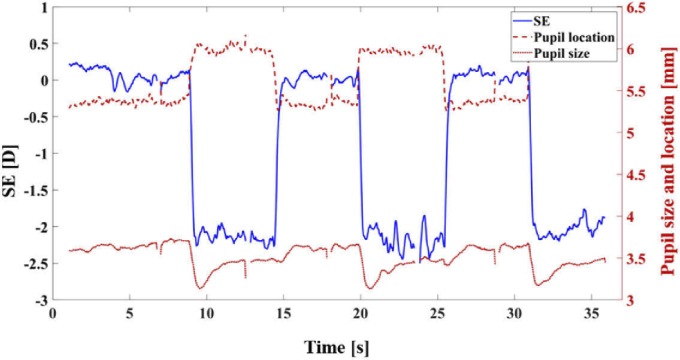
Where is the defocus Zernike coefficient, and r is the measurement pupil radius (1.5 mm in this experiment). High-order aberrations were measured over a 2.25-mm-radius pupil. Each experiment consisted of 3 separate runs of 6 stimuli presentations alternating between far and near. Each presentation was 6 seconds long, totaling 36 seconds for each run. This produced a total of 9 accommodation events and 6 de-accommodation events for each subject. To avoid involuntary blinking too close to the stimulus swapping, the subjects were asked to blink about halfway during each presentation. As an example, Fig. 4 shows the results for spherical equivalent (left y-axis), pupil position, and pupil size (right y-axis) in one experimental run.
Fig. 4.
Example of a set of measurements for the left eye of an emmetropic subject. Spherical equivalent in diopters [D] is shown on the left axis (blue line). Pupil size (radius) and pupil location [mm] are illustrated on the right axis (red line). It is lucid that all of these three parameters are changed at almost the same time when the subjects start to accommodate or to de-accommodate.
2.5. Data analysis
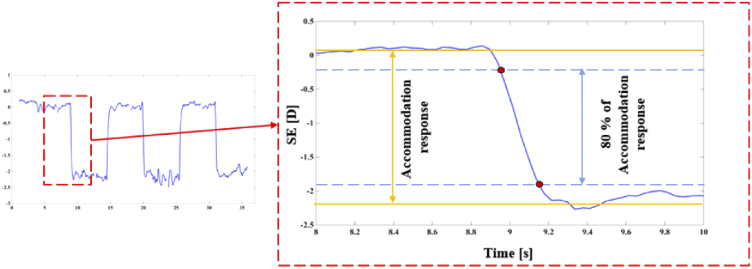
The custom-made software package for HS processing includes a blink-removal algorithm. The conventional methods to calculate the average speed of far-near response dynamics consist of fitting an exponential function [8], applying FFT [27], or fitting a Boltzmann sigmoid function [28]. Instead of these options, we used a threshold method previously proposed [29] and illustrated in Fig. 5. In this method, mean values of far and near steady states (in this case, across at least 2 seconds out of the 6 seconds in each presentation) were computed. The central 80% of accommodation response was taken to determine the starting and ending points for calculating the speed of accommodation. The reason for this choice is the fact that accommodative curves can vary between subjects or even among repetitions, and the mentioned fitting methods behave poorly in some cases. Similar threshold-based procedures were used on the pupil size and convergence dynamics to calculate the speed of these processes. It is important to note that we quantified convergence by the change in inter-pupillary distance and, therefore, the units for this variable are millimeters. Purkinje image tracking would allow convergence angle measurement [30] but it could introduce additional noise in our intended correlation analysis. Changes in spherical aberration and HOA-RMS were found to be on the order of magnitude of the variability through the steady states and did not support the same kind of processing. Alternatively, we computed the mean values of these parameters for far and near steady states and the difference between them (far minus near). Additionally, from the SE curve, we computed the accommodation response as the difference between far and near steady states, the lag of accommodation as the difference between response and demand (i.e., the difference in actual vergence between far and near targets), and the reaction time as the lapse between the stimulus swapping (not shown in Fig. 5) and10%-of-response time (upper-left red dot in Fig. 5).
Fig. 5.
Threshold method: Solid blue curve represents SE during one accommodation event; yellow lines represent steady accommodation states calculated as the average across at least 2 seconds; dashed lines represent the 80% central section of the accommodation response (i.e., the difference between steady states). The studied parameters are calculated in the interval between the red dots included.
3. Results
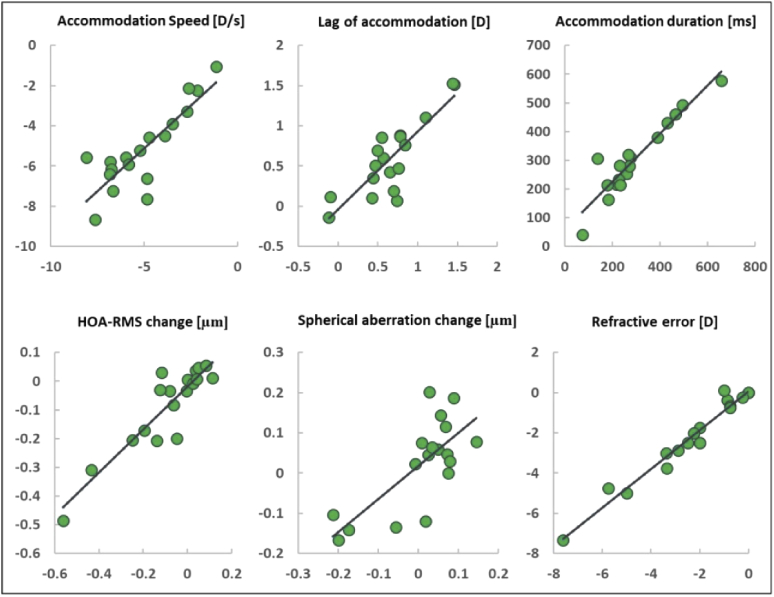
The binocular open-view sensor simultaneously measures refraction, HOA, and pupil size in both eyes. Since anisometropia could affect accommodation, it was an exclusion criterion. The bottom-right panel in Fig. 6 shows a high correlation between left (y-axis) and right (x-axis) eye refractive error (SE) for our subjects (R2 = 0.96 p=2.5E-12). Additionally, we compared accommodation speed, lag and duration, HOA-RMS change, and spherical aberration change between eyes (see Fig. 6). Although not to the same degree as the refractive error, all these parameters were correlated between eyes regardless of the subjects’ refractive error. This fact supports our averaging between eyes to assign a single value to each subject.
Fig. 6.
Right (x-axis) vs left (y-axis) eye parameters for all subjects. Both eyes are correlated with one another in accommodation speed, lag of accommodation, accommodation duration, HOA-RMS change (far minus near), spherical aberration change (far minus near), and refractive error (SE), with R2 values of 0.71, 0.71, 0.88, 0.82, 0.54, and 0.96, respectively.
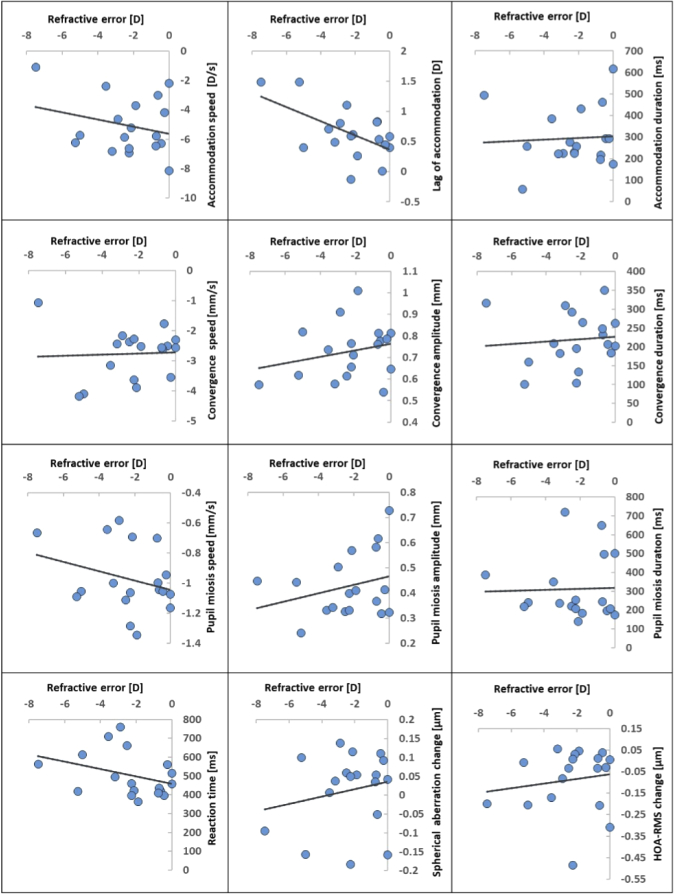
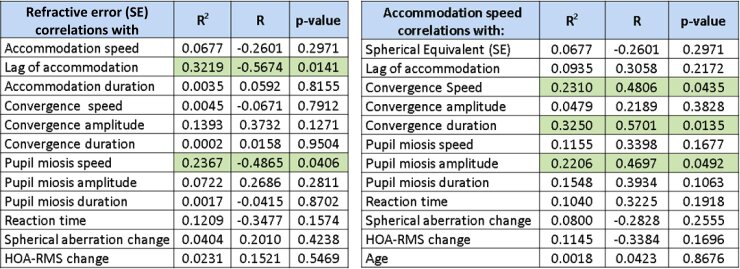
To analyze how myopia can affect accommodation, convergence, and pupil size dynamics, we have plotted the graphs for far-near response versus refractive error for each subject in Fig. 7. In those plots, refractive error (SE) is depicted on the x-axis and the corresponding far-near response dynamic value on the y-axis. In Table 1, the coefficient of determination (R2), correlation coefficient (R), and p-value are displayed for each pair of variables analyzed. We observed p-value < 0.05 trends for the lag of accommodation (p = 0.014) and pupil miosis speed (p = 0.041). Other non-zero correlation coefficients, e.g., of refractive error with convergence amplitude and reaction time, had associated p-values higher than this threshold.
Fig. 7.
Far-near response parameters against the subject's refraction.
Table 1. Correlations between refractive error (left) and accommodation speed (right) with other far-near response parameters. Correlation values with p < 0.05 are highlighted in green.
|
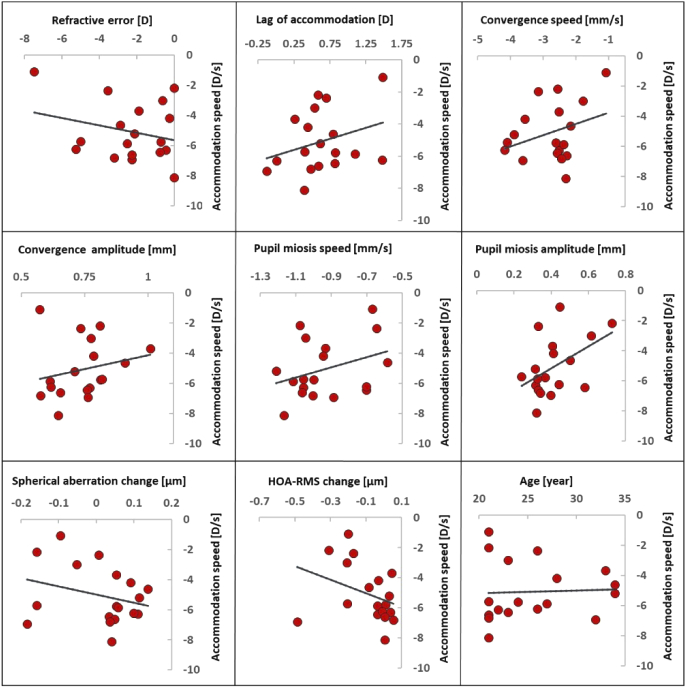
We were also interested in studying potential factors affecting accommodation speed. In Fig. 8, the accommodation speed is plotted for every subject versus all other far-near response parameters computed in this study. Among the represented pairings, three correlation values with p < 0.05 were found: for pupil miosis amplitude (R2 = 0.22, p=0.049), convergence speed (R2 = 0.23, p=0.044), and convergence duration (R2 = 0.33 p=0.014).
Fig. 8.
Accommodation speed against other parameters of far-near response. In all plots, the y-axis represents accommodation speed in [D/s].
We have summarized all the results of the correlation analysis in Table 1. The left panel shows the correlation of refractive error with a range of parameters evaluated in this study: accommodation speed, lag of accommodation, accommodation duration, convergence speed, convergence amplitude, convergence duration, pupil miosis speed, pupil miosis amplitude, pupil miosis duration, reaction time, spherical aberration change, and HOA-RMS change. We provide both the coefficient of determination and the correlation coefficient, together with the corresponding p-value for each analysis. These values are thought to indicate the effect of refractive error on various aspects of the far-near response, although it could be the other way around. The right panel shows the analysis for accommodation speed and its potential relationship with other far-near response parameters. In both left and right tables, relationships with p-value < 0.05 are highlighted in green.
4. Discussion
Since myopia is multifactorial, we wanted to investigate the relationship of all far-near response parameters with refractive error. To the best of our knowledge, there is no study in the literature analyzing all the potential connections between all of the far-near response-related variables and myopia nor their possible effect on accommodation speed in realistic, binocular viewing conditions. One of the major strengths of studying the dynamics of accommodation with an HS sensor is that it is more accurate than autorefractors or eccentric infrared photorefractors [31]. Another strength of our study is measuring accommodation in binocular vision with real fixation targets, i.e., in natural viewing conditions. Furthermore, in the present study, all subjects were young, with low astigmatism. We did not categorize subjects as myopes or emmetropes to analyze differences between groups but chose to correlate each parameter with the subject's refractive error instead. We think this is a better approach, especially in the boundary of the definition of myopia.
4.1. Accommodation and myopia
Our results suggest that the lag of accommodation increases with myopia (R2 = 0.32, p = 0.01). There was just one subject with a slight lead of 0.12 D. Mean accommodation lag (± standard deviation) across subjects was 0.64 D ± 0.42 D, ranging from 0 to 1.48 D. If we divide our sample into 3 groups of increasing myopia, the mean lag was 0.49 D ± 0.27 D for subjects with less than 2 D of myopia, 0.59 D ± 0.45 D for those between 2 D and 3 D, and 0.91 D ± 0.53 D for subjects with more than 3 D of myopia.
Some studies in the literature do not agree on this result or its interpretation. The International Myopia Institute (IMI) myopia control report argues that lag of accommodation might be a consequence of the measurement technique failing to take into account negative spherical aberration [15], which is not the case in our study. Other studies have found no difference in lag between myopes and emmetropes [32] or even the opposite relationship: a decrease of lag with myopia [33]. However, our results are consistent with the bulk of the literature on the topic [14,19,28,34–36].
We also measured accommodation dynamics parameters, namely, accommodation duration and accommodation speed. The former was virtually uncorrelated to refractive error. This fact, combined with the increased lag in myopes, can be taken to suggest that myopic subjects would have slower accommodation. However, if this relationship does exist, it is not strong enough to become apparent in our limited population sample, as the correlation value we obtained was small.
We did not find further evidence in the literature of this potential correlation. Schaeffel et al. [35] studied accommodation dynamics for different refractive errors using a photorefractor with a limited sampling rate of 5.3 Hz and, they did not report a dependency between accommodation speed and refractive error, finding a high inter-subject variability between subjects of the same age. Wagner et al. [32] did not report a correlation between far-to-near accommodation speed and myopia, either. Accommodation speed and its potential relationship with other measured variables will be analyzed in detail in a later section.
4.2. Pupil miosis and myopia
Schaeffel et al. 1993 [35] found the amplitude of the pupillary response was smaller in myopes than emmetropes. Our data cannot confirm this relationship, since the p-value for this correlation was 0.28. By contrast, the correlation between miosis speed and refractive error had a p-value of 0.04: Myopic subjects apparently tend to have slower miosis (R2 = 0.24). Schaeffel et al. did not comment on miosis speed, nor has this relationship been previously reported in the literature, to the best of our knowledge. Finally, we computed the miosis duration and found it to be virtually uncorrelated to refractive error.
4.3. Convergence and myopia
There is a recent study on vergence driven accommodation in stereoscopic content [36] which reported slower vergence responses in myopes. On the contrary, we did not find correlations between refractive error and convergence parameters (speed, duration, and amplitude).
4.4. Spherical aberration, and HOAs vs. myopia
Although it seems established that eyes affected by high myopia are more aberrated [37], there is still conflicting evidence in the literature about the relationship between high order aberrations and refractive error in emmetropes and mild myopes [28,38–40]. In our case, we could not find a link between myopia and HOA-RMS change (R2 = 0.02, p = 0.42) nor spherical aberration change (R2 = 0.04, p = 0.55).
4.5. Accommodation speed correlations
Dynamics of accommodation and its link to refractive error and age have been studied for more than fifty years. Accommodation response has been found to increase linearly with accommodative amplitude in humans [41] and monkeys [42]. This would support the comparison of accommodation rates from studies using different accommodation demand settings, but the fact is that a wide range of values have been reported. Campbell et al. [43] and Hung et al. [44] calculated a maximum speed of 10 D/s for a 2D demand. In contrast, Howland et al. [45] found a speed of 4.6 D/s for accommodation in infants, using a limited sampling rate of 2 Hz. Yamada & Ukai [46] reported values as high as 25 D/s for disaccommodation, although it has been suggested that accommodation and disaccommodation have a different dependence on the amplitude of the process, with the latter being faster than the former [35,46].
We found a mean accommodation speed of – 5 ± 1.9 D/s (with values ranging from -1.1 D/s to -8.4 D/s), for a far-near accommodation response of 2.5 D. When comparing with previous studies, it is important to bear in mind that we are reporting an average speed instead of instantaneous speed. The motivation for our threshold method is to avoid noise-induced spikes in computed velocity, but, as a counterpart, it tends to produce lower velocity values, as the accommodation process is not uniform. Correlation analysis (Fig. 8 and Table 1, right panel) with other variables measured in our study produces p-values < 0.05 for only three potential relationships: With convergence speed, convergence duration, and pupil miosis amplitude.
The interaction between accommodation and convergence has been widely studied and is known to be a complex affair with multiple feedback channels. It is, therefore, not surprising that we did find a low p-value correlation between accommodation speed and convergence speed (R2 = 0.23, p = 0.04), although, to the best of our knowledge, this has not been previously reported. Furthermore, the correlation is stronger between accommodation speed and convergence duration (R2 = 0.33, p = 0.01), which may reflect the differences in the dynamics of these two processes [29]. On the contrary, accommodation speed does not appear to be related to convergence amplitude.
Pupil miosis is a known and widely studied part of the accommodative response. There is not enough evidence in our results to conclude that accommodation speed and miosis speed are correlated but we did find a p < 0.05 correlation between accommodation speed and miosis amplitude (R2 = 0.22, p = 0.049). In other words, faster accommodation tends to be associated with more pronounced pupil constriction.
The role of high-order aberrations on accommodation is not clear. Wilson et al. [47] suggested that high-order aberrations may provide an accommodative cue. Chin et al. [48] found evidence of aberrations affecting disaccommodation only, not accommodation. Gambra et al. [49] concluded that the correction of high-order aberrations improves rather than compromise accommodation. Fernández and Artal [50] found that by correcting the aberrations in real time, accommodation response time increases and conversely, the peak velocity of accommodation decreases.
Regarding high order aberrations, we did not find correlations between speed of accommodation and HOA-RMS, neither with the initial amount nor with the change from far to near. The same lack of connection was found when the analysis was restricted to spherical aberration.
Finally, our correlation analysis found that accommodation speed is apparently unaffected by age in young subjects.
4.6. Multiple comparisons and statistical significance
When performing multiple statistical tests from a single dataset, the probability of having at least one type I error (i.e., erroneously assigning statistical significance to a false conclusion) increases with the number of tests. To account for this fact, a variety of methods have been proposed to adjust the statistical significance labeling process in order to reduce the risk of false discoveries [51]. Bonferroni's correction is one of the simplest and most widely used methods for dealing with the multiple testing problem. It is also the most conservative. It consists of dividing the overall significance level (whose typical value is α = 0.05 in many fields) by the number of tests, N. Alternatively, the significance level can be left unchanged while the p-values are multiplied by N. In our case, applying Bonferroni correction would mean using a per-comparison significance level of 0.05/24 = 0.0021 and no correlation coefficient in Table 1 would have a p-value below that level. Accordingly, although the requirement to apply Bonferroni's or other multiple testing correction is not universal and it is even subject to debate [51], we have avoided the term “statistically significance”, providing all the p-values instead.
On the other hand, all methods aiming to reduce the probability of a type I error increase the risk of type II errors (i.e., not detecting a true correlation). By definition, the significance level, α, is the probability of a type I error, given that the null hypothesis is true [52]. In our context, this is the probability of “discovering” a correlation when comparing two variables which are in fact uncorrelated. When performing multiple testing, if all of the null hypothesis are true, the probability of having K type I errors when performing N tests would follow the binomial distribution (in our case, if there are no correlations, each comparison is an independent process with α probability of producing a type I error). In particular, the probability of wrongly “discovering” 5 nonexistent correlations when performing 24 comparisons would be 0.00501. Therefore, it is unlikely that all 5 combinations highlighted in Table 1 are spurious, and rejecting the lot of them on the grounds of multiple testing correction has a high probability of incurring type II errors.
5. Conclusion
We studied accommodation dynamics in a group of young, emmetropic, and mild myopic subjects using a binocular open-view sensor and performed a correlation analysis between different parameters and refractive error. Our results do not support a strong relationship between myopia and accommodation, as most correlation coefficients were small with sizeable p-values. Only lag of accommodation and pupil miosis speed were related to refractive error: Myopes apparently tend to lag more markedly and have slower pupil constriction. Additional correlation analysis on the speed of accommodation suggested that slow accommodation may be related to slow convergence and more pronounced pupil miosis.
Funding
Horizon 2020 Framework Programme10.13039/100010661 (675137); Fundación Séneca10.13039/100007801 (19897/GERM/15); Agencia Estatal de Investigación10.13039/501100011033 (PID2019-105684RB-I00/AEI/10.13039/501100011033).
Disclosures
The authors declare that there are no conflicts of interest related to this article.
References
- 1.Flitcroft D. I., He M., Jonas J. B., Jong M., Naidoo K., Ohno-Matsui K., Rahi J., Resnikoff S., Vitale S., Yannuzzi L., “IMI - defining and classifying myopia: a proposed set of standards for clinical and epidemiologic studies,” Invest. Ophthalmol. Vis. Sci. 60(3), M20–M30 (2019). 10.1167/iovs.18-25957 [DOI] [PMC free article] [PubMed] [Google Scholar]
- 2.Muralidharan G., Martínez-Enríquez E., Birkenfeld J., Velasco-Ocana M., Pérez-Merino P., Marcos S., “Morphological changes of human crystalline lens in myopia,” Biomed. Opt. Express 10(12), 6084–6095 (2019). 10.1364/BOE.10.006084 [DOI] [PMC free article] [PubMed] [Google Scholar]
- 3.Dolgin E., “The myopia boom,” Nature 519(7543), 276–278 (2015). 10.1038/519276a [DOI] [PubMed] [Google Scholar]
- 4.Jung S.-K., Lee J. H., Kakizaki H., Jee D., “Prevalence of myopia and its association with body stature and educational level in 19-year-old male conscripts in seoul, South Korea,” Invest. Ophthalmol. Visual Sci. 53(9), 5579–5583 (2012). 10.1167/iovs.12-10106 [DOI] [PubMed] [Google Scholar]
- 5.Haarman A. E. G., Enthoven C. A., Willem Tideman J. L., Tedja M. S., Verhoeven V. J. M., Klaver C. C. W., “The complications of myopia: A review and meta-analysis,” Investig. Ophthalmol. Vis. Sci. 61, (2020). [DOI] [PMC free article] [PubMed]
- 6.Pan C.-W., Ramamurthy D., Saw S.-M., “Worldwide prevalence and risk factors for myopia,” Ophthalmic Physiol. Opt. 32(1), 3–16 (2012). 10.1111/j.1475-1313.2011.00884.x [DOI] [PubMed] [Google Scholar]
- 7.Pusti D., Benito A., Madrid-Valero J. J., Ordoñana J. R., Artal P., “Inheritance of refractive error in millennials,” Sci. Rep. 10(1), 8173 (2020). 10.1038/s41598-020-65130-w [DOI] [PMC free article] [PubMed] [Google Scholar]
- 8.Jiang B.-C., White J. M., “Effect of accommodative adaptation on static and dynamic accommodation in emmetropia and late-onset myopia,” Optom. Vis. Sci. 76(5), 295–302 (1999). 10.1097/00006324-199905000-00017 [DOI] [PubMed] [Google Scholar]
- 9.Saw S.-M., “A synopsis of the prevalence rates and environmental risk factors for myopia,” Aust. J. Optom. 86(5), 289–294 (2003). 10.1111/j.1444-0938.2003.tb03124.x [DOI] [PubMed] [Google Scholar]
- 10.Norton T. T., Siegwart J. T., “Light levels, refractive development, and myopia – a speculative review,” Exp. Eye Res. 114, 48–57 (2013). 10.1016/j.exer.2013.05.004 [DOI] [PMC free article] [PubMed] [Google Scholar]
- 11.Goss D., Ocular Accommodation, Convergence and Disparity Fixation: A Manual of Clinical Analysis (Butterworth-Heinemann, 1995). [Google Scholar]
- 12.Mutti D. O., Mitchell G. L., Hayes J. R., Jones L. A., Moeschberger M. L., Cotter S. A., Kleinstein R. N., Manny R. E., Twelker J. D., Zadnik K., Hullett S., Sims J., Weeks R., Williams S., Calvin L., Shipp M. D., Friedman N. E., Qualley P., Wickum S. M., Kim A., Mathis B., Batres M., Henry S., Wensveen J. M., Crossnoe C. J., Tom S. L., McLeod J. A., Quiralte J. C., Yu J. A., Chu R. J., Barnhardt C. N., Chang J., Huang K., Bridgeford R., Chu C., Kwon S., Lee G., Lee J., Lee R., Maeda R., Emerson R., Leonhardt T., Messer D., Flores D., Bhakta R., Malone J. M., Sheng H., Omlor H., Rahmani M., Brickman J., Wang A., Arner P., Taylor S., Nguyen M. T., Walker T. W., Barrett L., Sinnott L., Wessel P., Swartzendruber J. N., Everett D. F., “Accommodative lag before and after the onset of myopia,” Invest. Ophthalmol. Visual Sci. 47(3), 837–846 (2006). 10.1167/iovs.05-0888 [DOI] [PubMed] [Google Scholar]
- 13.Labhishetty V., Bobier W. R., “Are high lags of accommodation in myopic children due to motor deficits?” Vision Res. 130, 9–21 (2017). 10.1016/j.visres.2016.11.001 [DOI] [PubMed] [Google Scholar]
- 14.Gwiazda J. E., Hyman L., Norton T. T., Hussein M. E. M., Marsh-Tootle W., Manny R., Wang Y., Everett D., “Accommodation and related risk factors associated with myopia progression and their interaction with treatment in COMET children,” Invest. Ophthalmol. Visual Sci. 45(7), 2143–2151 (2004). 10.1167/iovs.03-1306 [DOI] [PubMed] [Google Scholar]
- 15.Wolffsohn J. S., Flitcroft D. I., Gifford K. L., Jong M., Jones L., Klaver C. C. W., Logan N. S., Naidoo K., Resnikoff S., Sankaridurg P., Smith E. L., III, Troilo D., Wildsoet C. F., “IMI – myopia control reports overview and introduction,” Invest. Ophthalmol. Visual Sci. 60(3), M1–M19 (2019). 10.1167/iovs.18-25980 [DOI] [PMC free article] [PubMed] [Google Scholar]
- 16.Sanz Diez P., Yang L.-H., Lu M.-X., Wahl S., Ohlendorf A., “Growth curves of myopia-related parameters to clinically monitor the refractive development in Chinese schoolchildren,” Graefe’s Arch. Clin. Exp. Ophthalmol. 257(5), 1045–1053 (2019). 10.1007/s00417-019-04290-6 [DOI] [PubMed] [Google Scholar]
- 17.Maddock R. J., Millodot M., Leat S., Johnson C. A., “Accommodation responses and refractive error,” Invest. Ophthalmol. Visual Sci. 20, 387–391 (1981). [PubMed] [Google Scholar]
- 18.Weizhong L., Zhikuan Y., Wen L., Xiang C., Jian G., “A longitudinal study on the relationship between myopia development and near accommodation lag in myopic children,” Ophthalmic Physiol. Opt. 28(1), 57–61 (2008). 10.1111/j.1475-1313.2007.00536.x [DOI] [PubMed] [Google Scholar]
- 19.Hughes R. P. J., Vincent S. J., Read S. A., Collins M. J., “Higher order aberrations, refractive error development and myopia control: a review,” Aust. J. Optom. 103(1), 68–85 (2020). 10.1111/cxo.12960 [DOI] [PubMed] [Google Scholar]
- 20.Aleman A., Schaeffel F., “Lag of accommodation does not predict changes in eye growth in chickens,” Vision Res. 149, 77–85 (2018). 10.1016/j.visres.2018.06.007 [DOI] [PubMed] [Google Scholar]
- 21.Sanz Diez P., Ohlendorf A., Schaeffel F., Wahl S., “Effect of spatial filtering on accommodation,” Vision Res. 164, 62–68 (2019). 10.1016/j.visres.2019.07.005 [DOI] [PubMed] [Google Scholar]
- 22.Hazel C. A., Cox M. J., Strang N. C., “Wavefront aberration and its relationship to the accommodative stimulus-response function in myopic subjects,” Optom. Vis. Sci. 80(2), 151–158 (2003). 10.1097/00006324-200302000-00011 [DOI] [PubMed] [Google Scholar]
- 23.Chirre E., Prieto P. M., Artal P., “Binocular open-view instrument to measure aberrations and pupillary dynamics,” Opt. Lett. 39(16), 4773–4775 (2014). 10.1364/OL.39.004773 [DOI] [PubMed] [Google Scholar]
- 24.. “ANSI Z136.1, American National Standard for Safe Use of Lasers,” (2007).
- 25.Mompeán J., Aragón J. L., Prieto P. M., Artal P., “GPU-based processing of Hartmann–Shack images for accurate and high-speed ocular wavefront sensing,” Futur. Gener. Comput. Syst. 91, 177–190 (2019). 10.1016/j.future.2018.09.010 [DOI] [Google Scholar]
- 26.Hervella L., Villegas E. A., Prieto P. M., Artal P., “Assessment of subjective refraction with a clinical adaptive optics visual simulator,” J. Cataract Refractive Surg. 45(1), 87–93 (2019). 10.1016/j.jcrs.2018.08.022 [DOI] [PMC free article] [PubMed] [Google Scholar]
- 27.Suryakumar R., Meyers J. P., Irving E. L., Bobier W. R., “Vergence accommodation and monocular closed loop blur accommodation have similar dynamic characteristics,” Vision Res. 47(3), 327–337 (2007). 10.1016/j.visres.2006.10.006 [DOI] [PubMed] [Google Scholar]
- 28.Charman W. N., “Aberrations and myopia,” Ophthalmic Physiol. Opt. 25(4), 285–301 (2005). 10.1111/j.1475-1313.2005.00297.x [DOI] [PubMed] [Google Scholar]
- 29.Chirre E., Prieto P., Artal P., “Dynamics of the near response under natural viewing conditions with an open-view sensor,” Biomed. Opt. Express 6(10), 4200–4211 (2015). 10.1364/BOE.6.004200 [DOI] [PMC free article] [PubMed] [Google Scholar]
- 30.Kobayashi M., Nakazawa N., Yamaguchi T., Otaki T., Hirohara Y., Mihashi T., “Binocular open-view Shack-Hartmann wavefront sensor with consecutive measurements of near triad and spherical aberration,” Appl. Opt. 47(25), 4619–4626 (2008). 10.1364/AO.47.004619 [DOI] [PubMed] [Google Scholar]
- 31.Lundström L., Gustafsson J., Svensson I., Unsbo P., “Assessment of objective and subjective eccentric refraction,” Optom. Vis. Sci. 82(4), 298–306 (2005). 10.1097/01.OPX.0000159366.61943.62 [DOI] [PubMed] [Google Scholar]
- 32.Wagner S., Zrenner E., Strasser T., “Emmetropes and myopes differ little in their accommodation dynamics but strongly in their ciliary muscle morphology,” Vision Res. 163, 42–51 (2019). 10.1016/j.visres.2019.08.002 [DOI] [PubMed] [Google Scholar]
- 33.Rosenfield M., Desai R., Portello J. K., “Do progressing myopes show reduced accommodative responses?” Optom. Vis. Sci. 79(4), 268–273 (2002). 10.1097/00006324-200204000-00014 [DOI] [PubMed] [Google Scholar]
- 34.Nakatsuka C., Hasebe S., Nonaka F., Ohtsuki H., “Accommodative lag under habitual seeing conditions: comparison between adult myopes and emmetropes,” Jpn. J. Ophthalmol. 47(3), 291–298 (2003). 10.1016/S0021-5155(03)00013-3 [DOI] [PubMed] [Google Scholar]
- 35.Schaeffel F., Wilhelm H., Zrenner E., “Inter-individual variability in the dynamics of natural accommodation in humans: relation to age and refractive errors,” J. Physiol. 461(1), 301–320 (1993). 10.1113/jphysiol.1993.sp019515 [DOI] [PMC free article] [PubMed] [Google Scholar]
- 36.Maiello G., Kerber K. L., Thorn F., Bex P. J., Vera-Diaz F. A., “Vergence driven accommodation with simulated disparity in myopia and emmetropia,” Exp. Eye Res. 166, 96–105 (2018). 10.1016/j.exer.2017.10.004 [DOI] [PMC free article] [PubMed] [Google Scholar]
- 37.Collins M. J., Wildsoet C. F., Atchison D. A., “Monochromatic aberrations and myopia,” Vision Res. 35(9), 1157–1163 (1995). 10.1016/0042-6989(94)00236-F [DOI] [PubMed] [Google Scholar]
- 38.He J. C., Sun P., Held R., Thorn F., Sun X., Gwiazda J. E., “Wavefront aberrations in eyes of emmetropic and moderately myopic school children and young adults,” Vision Res. 42(8), 1063–1070 (2002). 10.1016/S0042-6989(02)00035-4 [DOI] [PubMed] [Google Scholar]
- 39.Cheng X., Bradley A., Hong X., Thibos L. N., “Relationship between refractive error and monochromatic aberrations of the eye,” Optom. Vis. Sci. 80(1), 43–49 (2003). 10.1097/00006324-200301000-00007 [DOI] [PubMed] [Google Scholar]
- 40.Hartwig A., Atchison D. A., “Analysis of higher-order aberrations in a large clinical population,” Invest. Ophthalmol. Visual Sci. 53(12), 7862–7870 (2012). 10.1167/iovs.12-10610 [DOI] [PubMed] [Google Scholar]
- 41.Ciuffreda K. J., Kruger P. B., “Dynamics of human voluntary accommodation,” Am. J. Optom. Physiol. Opt. 65(5), 365–370 (1988). 10.1097/00006324-198805000-00010 [DOI] [PubMed] [Google Scholar]
- 42.Vilupuru A. S., Glasser A., “Dynamic accommodation in rhesus monkeys,” Vision Res. 42(1), 125–141 (2002). 10.1016/S0042-6989(01)00260-7 [DOI] [PubMed] [Google Scholar]
- 43.Campbell F. W., Westheimer G., “Dynamics of accommodation responses of the human eye,” J. Physiol. 151(2), 285–295 (1960). 10.1113/jphysiol.1960.sp006438 [DOI] [PMC free article] [PubMed] [Google Scholar]
- 44.Hung G. K., Ciuffreda K. J., “Dual-mode behaviour in the human accommodation system,” Ophthalmic Physiol. Opt. 8(3), 327–332 (1988). 10.1111/j.1475-1313.1988.tb01062.x [DOI] [PubMed] [Google Scholar]
- 45.Howland H. C., Dobson V., Sayles N., “Accommodation in infants as measured by photorefraction,” Vision Res. 27(12), 2141–2152 (1987). 10.1016/0042-6989(87)90128-3 [DOI] [PubMed] [Google Scholar]
- 46.Yamada T., Ukai K., “Amount of defocus is not used as an error signal in the control system of accommodation dynamics,” Ophthalmic Physiol. Opt. 17(1), 55–60 (1997). 10.1111/j.1475-1313.1997.tb00524.x [DOI] [PubMed] [Google Scholar]
- 47.Wilson B. J., Decker K. E., Roorda A., “Monochromatic aberrations provide an odd-error cue to focus direction,” J. Opt. Soc. Am. A 19(5), 833–839 (2002). 10.1364/JOSAA.19.000833 [DOI] [PubMed] [Google Scholar]
- 48.Chin S. S., Hampson K. M., Mallen E. A. H., “Effect of correction of ocular aberration dynamics on the accommodation response to a sinusoidally moving stimulus,” Opt. Lett. 34(21), 3274–3276 (2009). 10.1364/OL.34.003274 [DOI] [PubMed] [Google Scholar]
- 49.Gambra E., Sawides L., Dorronsoro C., Marcos S., “Accommodative lag and fluctuations when optical aberrations are manipulated,” J. Vis. 9(6), 4 (2009). 10.1167/9.6.4 [DOI] [PubMed] [Google Scholar]
- 50.Fernández E. J., Artal P., “Study on the effects of monochromatic aberrations in the accommodation response by using adaptive optics,” J. Opt. Soc. Am. A 22(9), 1732–1738 (2005). 10.1364/JOSAA.22.001732 [DOI] [PubMed] [Google Scholar]
- 51.Armstrong R. A., “When to use the Bonferroni correction,” Ophthalmic Physiol. Opt. 34(5), 502–508 (2014). 10.1111/opo.12131 [DOI] [PubMed] [Google Scholar]
- 52.McKillup S., Statistics Explained: An Introductory Guide for Life Scientists, 1st Ed. (Cambridge University Press, 2006). [Google Scholar]


