Abstract
G-protein-coupled receptors (GPCRs) have central roles in intercellular communication1,2. Structural studies have revealed how GPCRs can activate G proteins. However, whether this mechanism is conserved among all classes of GPCR remains unknown. Here we report the structure of the class-C heterodimeric GABAB receptor, which is activated by the inhibitory transmitter GABA, in its active form complexed with Gi1 protein. We found that a single G protein interacts with the GB2 subunit of the GABAB receptor at a site that mainly involves intracellular loop 2 on the side of the transmembrane domain. This is in contrast to the G protein binding in a central cavity, as has been observed with other classes of GPCR. This binding mode results from the active form of the transmembrane domain of this GABAB receptor being different from that of other GPCRs, as it shows no outside movement of transmembrane helix 6. Our work also provides details of the inter- and intra-subunit changes that link agonist binding to G-protein activation in this heterodimeric complex.
Subject terms: Membrane structure and assembly, G protein-coupled receptors, Cryoelectron microscopy
Cryo-electron microscopy structure of heterodimeric GABAB receptor in complex with Gi1 protein reveals that the mode of G-protein binding in this class-C G-protein-coupled receptor differs from that of other classes.
Main
GPCRs are essential elements that are involved in cell–cell communication and represent major targets for therapeutic drugs1. Recent structural studies have provided important information on how GPCRs can act as nucleotide-exchange factors that allow the release of GDP from the inactive G protein, and then the activation of these proteins upon GTP binding2. Several previous structures of activated GPCR–G protein complexes have revealed a similar mode of action for each3–6. Despite differences in the interaction mode of G proteins for various class-A, -B and -F GPCRs, in all previously characterized interactions the C-terminal extremity of the Gα subunit engages with a cavity on the intracellular side of the receptor that results from the opening of this domain owing to the movement of transmembrane helix (TM) 6 relative to TM35,7.
Compared to other classes of GPCRs that can be activated in a monomeric form, class-C GPCRs are mandatory dimers8 that are composed of two identical or similar subunits9–11. These dimers may activate only one G protein at a time10,11, but the molecular basis of this asymmetric mode of action remains unknown. Among the class-C GPCRs that are activated by the neurotransmitter GABA, the GABAB receptor (hereafter referred to as GABAB) is an attractive drug target for the treatment of brain diseases12. GABAB is composed of two distinct subunits: GB1 (to which agonists bind) and GB2 (which is responsible for G-protein activation)9,13,14. Each subunit is composed of an extracellular Venus flytrap (VFT) domain and a transmembrane domain (TMD)10,15. The structure of this receptor has recently been solved in a number of states, including apo, antagonist-bound, agonist-bound, and agonist- and positive allosteric modulator (PAM)-bound11,16–18. Although these studies have helped to identify the conformational changes in subunits that are associated with ligand binding, it remains unclear at the atomic level how this heterodimeric GPCR activates G proteins.
Here we report the cryo-electron microscopy (cryo-EM) structure of the agonist- and PAM-bound form of the GABAB in complex with the G protein Gi1 at 3.5 Å resolution. Our results reveal a mode of G-protein coupling that differs from those that have previously been reported for GPCRs of other classes; our structures reveal that small movements of TM3 and TM5 lead to changes in the intracellular loops (ICLs) that offer a binding site for the G protein on the side of the GB2 subunit of GABAB. These data also help to refine models that describe how agonist binding in the VFT domain of GB1 leads to the activation of the TMD of GB2, and how small molecules can act as PAMs.
Overall architecture of GABAB–Gi complex
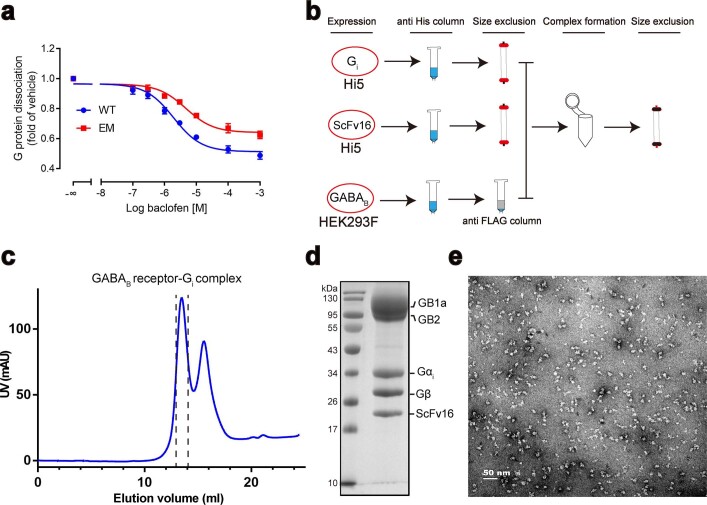
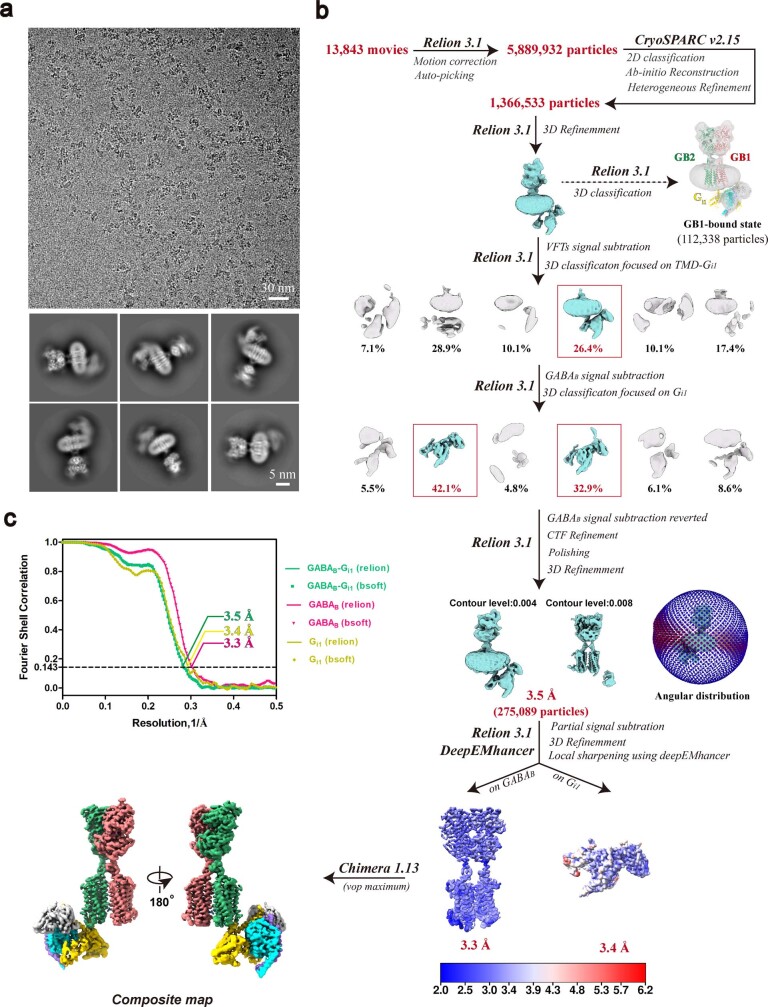
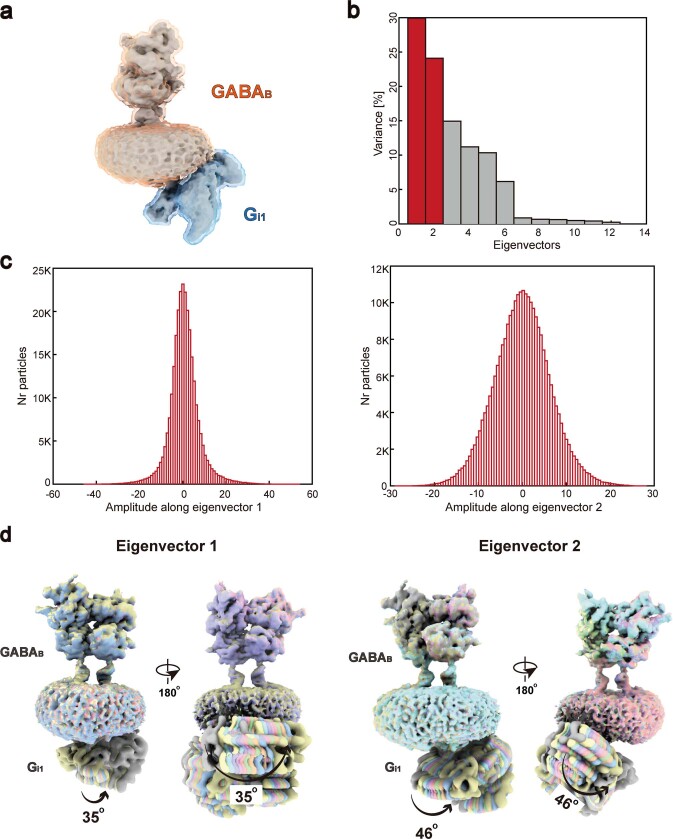
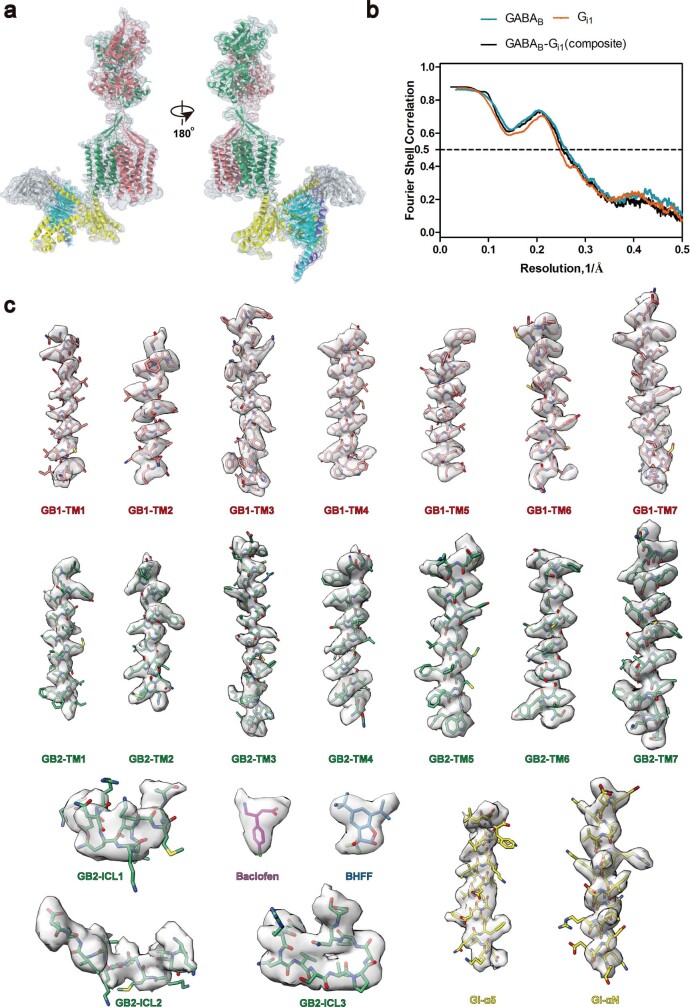
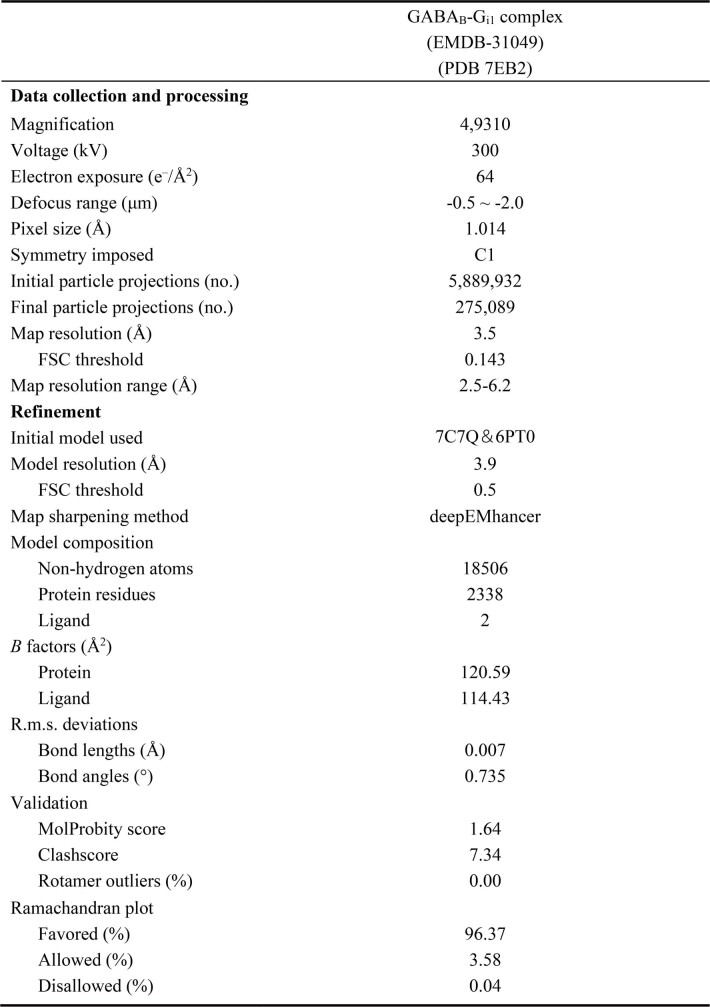
Using a modified version of a previously established protocol11 (Extended Data Fig. 1), we assembled the GABAB–Gil complex by incubating purified GABAB with Gi1 in the presence of the agonist baclofen and the PAM R,S-5,7-di-tert-butyl-3-hydroxy-3-trifluoromethyl-3H-benzofuran-2-one (BHFF)19 (Fig. 1a, b). Our cryo-EM analysis indicated that the binding of Gil to GABAB was flexible, and the consensus refinement map exhibited poor density in the G protein (Extended Data Fig. 2). The flexible conformations of Gi1 bound to GABAB in a similar pocket, but were rotated within an angle of up to 46° (Extended Data Fig. 3, Supplementary Videos 1, 2). To obtain detailed structural information, we subjected the individual structures of Gil and GABAB to local reconstruction, and produced improved Gil and the GABAB maps at a resolution of 3.4 Å and 3.3 Å, respectively (Extended Data Figs. 2, 4). These maps were combined on the basis of the consensus refinement map, and provided a rational structural framework for analyses of G-protein coupling (Fig. 1a, b, Extended Data Table 1).
Extended Data Fig. 1. Purification of the GABAB–Gi1 complex.
a Pharmacology of wild-type GABAB and the purification construct (EM) in a baclofen-mediated NanoBiT-G-protein dissociation assay. Data are mean ± s.e.m. from four independent experiments, performed in technical triplicate. b, Flow chart of the purification steps for the GABAB–Gi1 complex. GABAB was expressed in HEK293F cells. Heterotrimeric Gi1 and scFv16 were expressed in Hi5 cells. c–e, Size-exclusion chromatography profile (c), SDS–PAGE gel (d) and the negative-staining electron microscopy analysis (e) of the purified GABAB–Gi1 complex.
Fig. 1. Cryo-EM structure of GABAB–Gi complex.
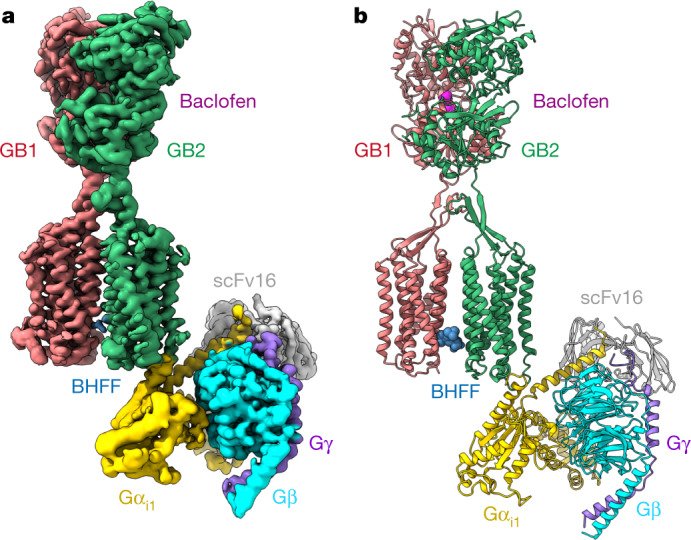
a, b, Cryo-EM map (a) and model (b) of the baclofen- and BHFF-bound GABAB–Gi1 complex.
Extended Data Fig. 2. Cryo-EM data processing of the GABAB–Gi complex.
a, Representative cryo-EM micrograph (from 13,483 movies) and 2D class averages (from 16 classes) of the GABAB–Gi1 complex. b, Flow chart of cryo-EM data processing. c, Gold-standard Fourier shell correlation curves of the globally refined GABAB–Gi1 complex and the locally refined GABAB and Gi1.
Extended Data Fig. 3. Flexibility analysis of GABAB–Gi1 coupling.
a, Multibody refinement and principal component analysis of the relative orientations of GABAB and Gi1. The GABAB–Gi1 consensus map and the body masks of GABAB and Gi1 are shown. b, Contribution of individual eigenvectors to the total variance in rotation and translation between GABAB and Gi1. The first and second eigenvectors explain more than 50% of the variance observed and are highlighted in red. c, Histograms of the amplitudes along the first and second eigenvectors. d, Motion represented by the first and second eigenvectors.
Extended Data Fig. 4. Analysis of the quality of the cryo-EM map.
a, Global fitting of the GABAB–Gil structure into the composite cryo-EM density map. b, Fourier shell correlation curves of the model versus the map. c, Cryo-EM densities and the fitted atomic models are shown. GB1 in red; GB2 in green; Gαi1 in yellow; baclofen in magenta; BHFF in blue.
Extended Data Table 1.
Cryo-EM data collection, model refinement and validation statistics
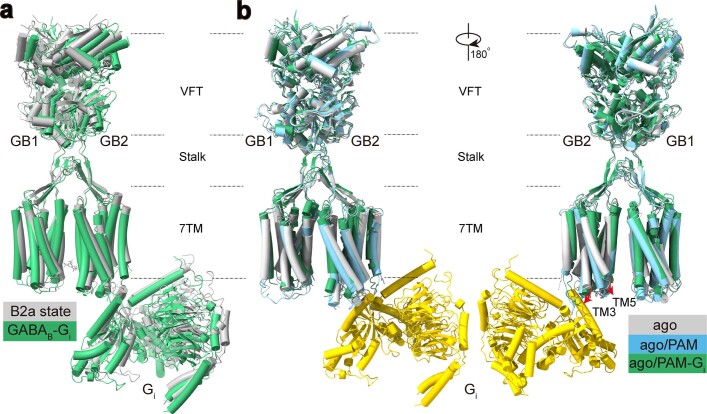
Our determined structure of the GABAB–Gil complex assumes an overall architecture that is similar to the previously reported low-resolution GABAB–Gil structure in the B2a state11 (Extended Data Fig. 5a). The agonist- and PAM–Gil-bound GABAB exhibited a conformation similar to that of the agonist- and PAM-bound GABAB (Protein Data Bank code (PDB) 6UO8) with a root mean squared deviation of 2.3 Å, in which the TMDs adopted a TM6–TM6 interface and the TMD of subunit GB2 showed an outward shift at the intracellular ends of TM3 and TM5. We did not observe conformation changes of TM3 and TM5 in the agonist-bound states (PDB 6UO9) (Extended Data Fig. 5b). Our structure shows that Gil binds to a shallow cavity that is formed by the ICLs of GB2, which provides a structural basis for understanding the distinct mode of Gil coupling to GABAB.
Extended Data Fig. 5. Structural comparisons of the determined GABAB–Gi complex with the previously reported low-resolution B2a state GABAB–Gi complex, the agonist-bound, and the agonist- and PAM-bound GABAB.
a, Structural comparison between the low-resolution GABAB–Gi complex in B2a state (grey) and this study determined GABAB-Gi structure (green). b, Structural comparisons of the Gi-bound GABAB (ago/PAM–Gi) (green) with the agonist-bound (ago) (PDB 6UO9) (grey) and agonist- and PAM-bound GABAB (ago/PAM) (PDB 6UO8) (blue).
Asymmetric activation of GABAB
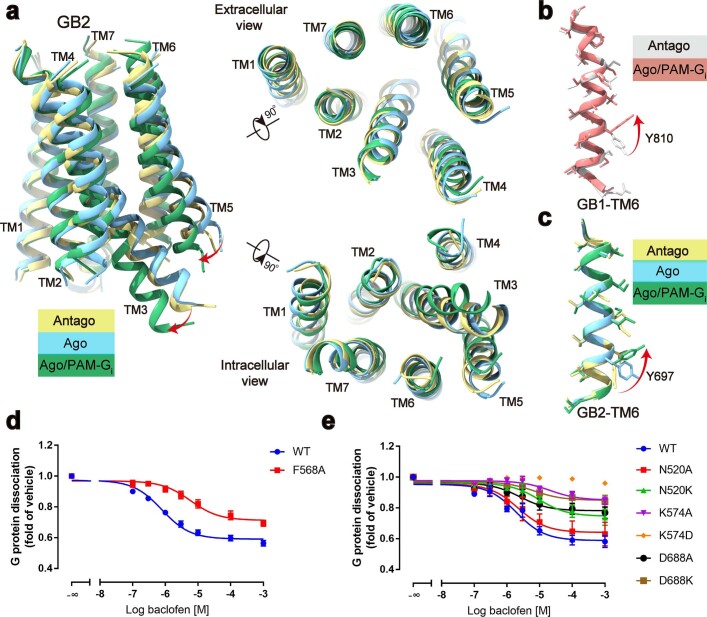
In the GABAB–Gi1 complex, there is no obvious opening of a central cavity on the intracellular side of the TMDs of either GB1 or GB2 (Fig. 2a, Extended Data Fig. 6a). Using the TMD of GB1 in agonist-bound GABAB (PDB 6UO9) as a reference, the TMDs of GB1 remained unchanged but the TMDs of GB2 did not overlap well (a root mean squared deviation of 4.8 Å) (Fig. 2a). However, we observed only local environmental differences between two forms when the GB2 TMD alone was aligned (Extended Data Fig. 6a). The GB2 TMD underwent an anticlockwise rotation relative to GB1 upon binding to a PAM and/or G protein (Fig. 2a). Therefore, interactions with the PAM and G protein may induce further structural rearrangements to agonist-bound GABAB. GB1 Y8106.44 (superscript numbers refer to the GPCRdb numbering scheme) and GB2 Y6976.44 had rotamer changes and formed a hydrogen bond with GB2 N6896.45 and GB1 N8116.45, respectively (Extended Data Fig. 6b, c). The resulting TM6–TM6 interaction was critical for G-protein coupling but did not lead to a conformational change of TM6 relative to the rest of the GB2 TMD.
Fig. 2. Asymmetric activation of GABAB.
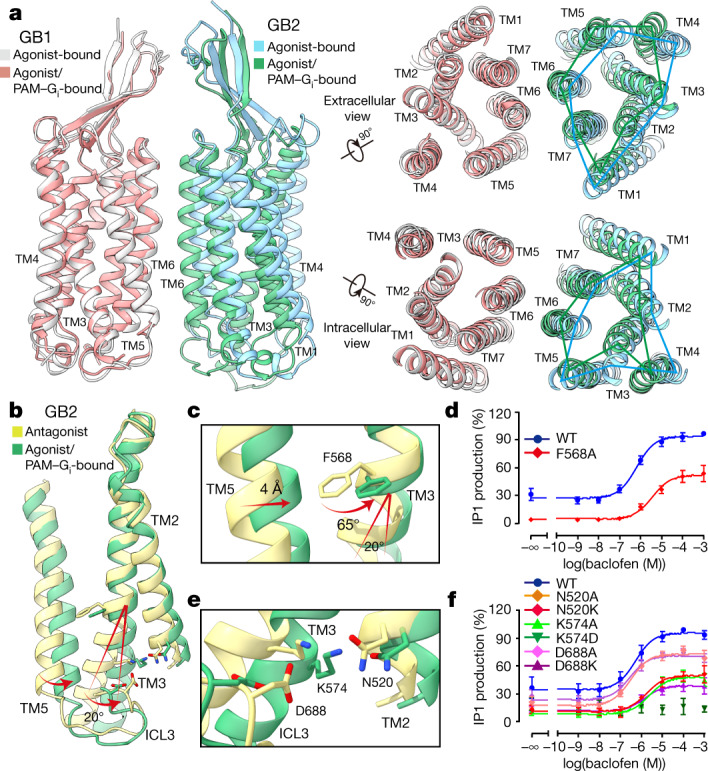
a, Side, extracellular, and intracellular views of the superposed structures of the agonist-bound (PDB 6UO9) and the agonist- and PAM-Gi-bound (agonist/PAM-bound) GABAB, aligned by the TMD of GB1. b, Conformational changes of the TMD of GB2 between antagonist-bound (PDB 7C7S) and agonist- and PAM–Gi-bound structure. c, Magnified views of the critical residue F568, the bulky side chain of which undergoes a substantial rotation upon activation and causes the TM3 shifting. d, Baclofen-induced IP1 accumulation of wild-type (WT) and F568A-mutant GABAB using the chimeric Gα protein Gαqi9. Data are mean ± s.e.m. from six independent experiments, performed in technical triplicate. e, Magnified views of the ‘ionic lock’ located in the cytoplasmic TMD of GB2. f, Baclofen-induced IP1 accumulation of wild-type GABAB and several forms of GABAB with substitutions in the ionic lock region using Gαqi9. Data are mean ± s.e.m. from at least three independent experiments, performed in technical triplicate.
Extended Data Fig. 6. Intra-subunit conformational changes of the TMD of GB2 upon activation.
a, Overlay of the structures of the TMD of GB2 in antagonist-bound (antago) (PDB 7C7S) (yellow), agonist-bound (ago) (PDB 6UO9) (sky blue), and agonist- and PAM–Gi-bound (ago/PAM-Gi) (green) states. b, c, Overlay of the different states of the TM6 of GB1 (antago, grey; ago/PAM–Gi, red) (b) and the TM6 of GB2 (antago, yellow; ago, blue; ago/PAM–Gi, green) (c). d, e, NanoBiT G-protein dissociation assay of GABAB with alterations of the residues that are involved in activation. Data are mean ± s.e.m. from at least three independent experiments, performed in technical triplicate.
Intra-subunit conformational changes within the TMDs were located in the intracellular half of TM3 and the entire TM5 of GB2 (Fig. 2b). TM5 moved 4 Å towards TM3, and F5683.44 rotated away from TM5 by about 65° to avoid potential spatial clashes (which is likely to be a critical origin for the 20°- rotation of the cytoplasmic end of TM3) (Fig. 2c). Mutation of F5683.44 to alanine largely impaired GABAB-induced Gi coupling (Fig. 2d, Extended Data Fig. 6d), which suggests that the bulky side chain of F5683.44 is essential for GB2 activation. The intracellular tip of TM3 was farther away from TM5, and was further stabilized by three critical charged residues that may help to accommodate G protein (Fig. 2b, e). This is consistent with a previous study20 that identified residues of TM3 (K5723.50 and R5753.53) and TM6 (D6886.35) of GB2, all of which are conserved among class-C GPCRs. Similar to class-A GPCRs (in which a D/ERY motif constitutes an ionic lock that stabilizes the inactive state)21, K5743.50 and D6886.35of GB2 form an ionic lock in the inactive state and become weaker owing to inward movement of TM3 upon receptor activation. K5743.50 turned to N5202.39 of GB2 to form an additional ionic interaction (Fig. 2e). Substitution of these residues with alanine or oppositely charged amino acids impaired or abolished agonist-induced receptor activity (Fig. 2f, Extended Data Fig. 6e). The intra-subunit conformational changes of GB2 TMD led to asymmetric activation of GABAB through binding and activation of a single G protein.
Specificity of GABAB–Gi coupling
In the GB2 subunit, the three ICLs and the intracellular tip of TM3 form a shallow pocket for the G protein (Fig. 3a, Extended Data Fig. 7a). The ICL2 of GB2 establishes extensive interactions with the α5 helix and the two linker regions (β2–β3 and αN–β1) in Gαi1 (Fig. 3b). There are potential salt bridges between lysine residues in this ICL2 (K586, K589 and K590) and acidic residues in αN (E28) and the linker region in β2–β3 (D193) in Gαi1. ICL1 and ICL3 were away from the G protein and participated only in the recognition of the C-terminal ‘hook-like’ region of Gαi (Fig. 3c).
Fig. 3. GABAB–Gi coupling and G-protein selectivity.
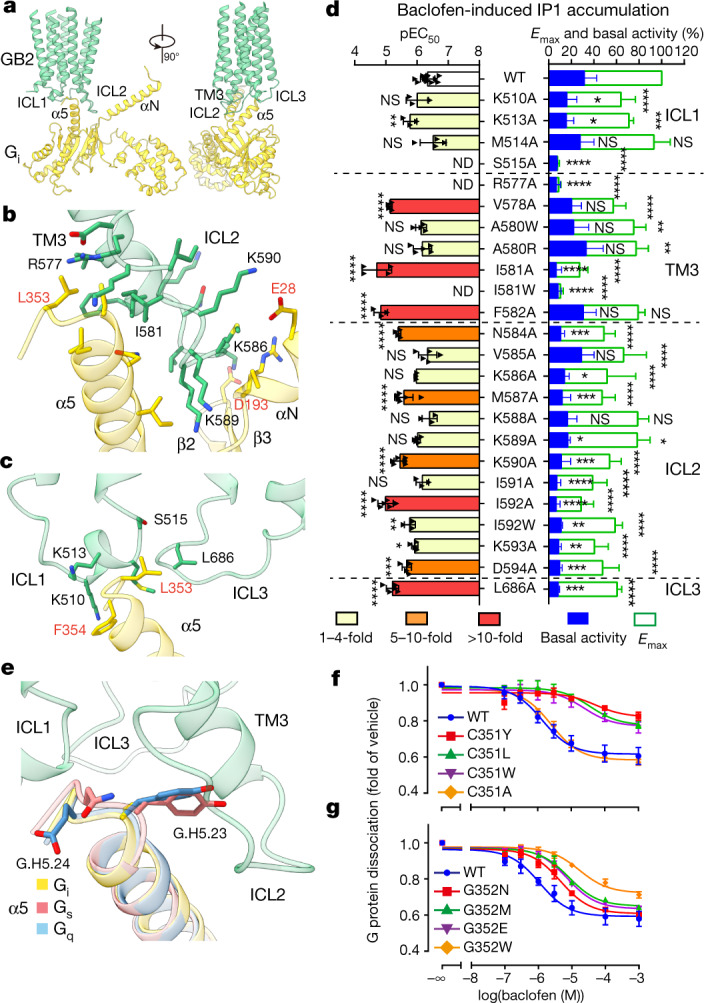
a, The Gi1 binding pocket in GABAB, which is mainly formed by three intracellular loops of GB2. GB2, green; Gαi1, yellow. b, c, Detailed interactions of the ICL2 and TM3 of GB2 with Gαi (b), and of ICL1 and ICL3 with Gαi (c). d, Baclofen-induced IP1 accumulation using Gαqi9. Bars represent differences in calculated Emax and basal activity or potency (pEC50) for each mutant as a percentage of the maximum in wild type. Data are mean ± s.e.m. from at least three independent experiments, performed in technical triplicate and analysed using one-way analysis of variance with Dunnett’s multiple comparison test to determine significance (compared with wild type). ND, not determined; NS, not significant. e, The CG.H5.23 and GG.H5.24 residues in the C-terminal α5 helix of Gαi are involved in the selective coupling between GABAB and Gi protein. The α5-helix structures of Gs (PDB 5VAI), Gq (PDB 6WHA) and the GABAB-bound Gi were aligned. f, g, Effect of CG.H5.23 (f) and GG.H5.24 (g) mutations in Gαi on GABAB–Gi coupling using NanoBiT G-protein dissociation assay. Data are mean ± s.e.m. from at least three independent experiments.
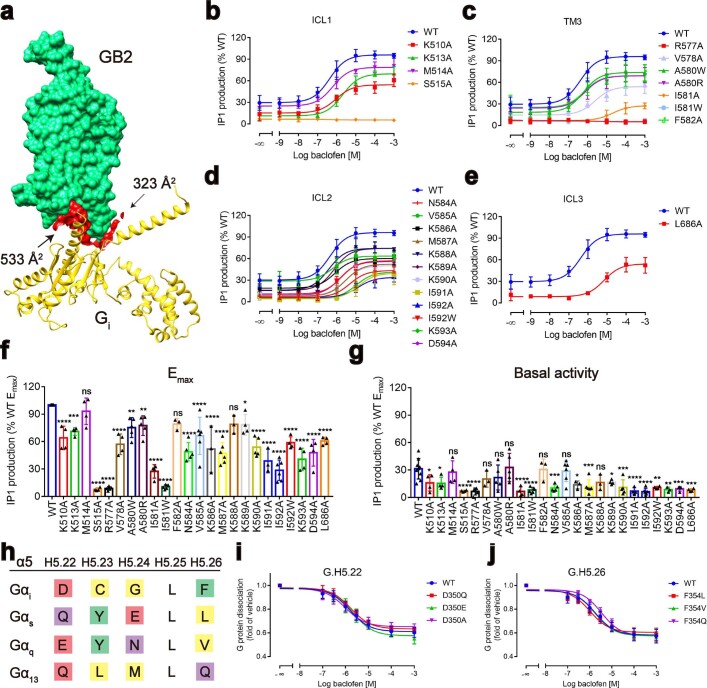
Extended Data Fig. 7. Gi activation and signalling assays.
a, Interface of GABAB and Gi1 protein. GB2, green; Gi1, yellow. The interaction interface between GB2 and Gi1 is in red. b–e, Agonist-induced IP1 accumulation assay of the wild-type and the Gi1-binding-pocket mutant GABAB. f, g, Emax and basal activity for each mutant relative to wild type, detected by IP1 accumulation assay and presented as dot plots. Data are mean ± s.e.m. from at least three independent experiments, performed in technical triplicate and analysed using one-way ANOVA with Dunnett’s multiple comparison test to determine significance (compared with wild type). h, Sequence alignment of the final five residues in the α5 helix among different Gα proteins. i, j, NanoBiT G-protein dissociation assay of the D350G.H5.22 (i) and F354G.H5.26 (j) mutant Gil. Data points in b–g, i, j are mean ± s.e.m. from at least three independent experiments, performed in technical triplicate.
Given the flexibility of Gi1 engagement to the receptor, we subjected residues of GABAB within 6 Å of the GABAB–Gi1 interface to mutagenesis and functional analyses (Fig. 3d, Extended Data Fig. 7b–g, Supplementary Table 1). Substitutions of residues with alanine in the intracellular tip of TM3 and entire ICL2 of GB2 led to a substantial 20–75% reduction in maximal responses (Emax) (Fig. 3d). Most mutants in the ICL2 showed decreased basal activity compared with wild type. Among them, M587A, K590A and I592A decreased the agonist potency (half-maximal effective concentration (EC50)) by 6–22 fold, which highlights the essential role of ICL2 in GB2–Gi1 coupling (consistent with previous studies22). Substitutions in ICL1 (S515A) or TM3 (R577A and I581W) abolished GABAB-induced production of inositol monophosphate (IP1). Substitutions in TM3 (V578A, I581A, F582A and N584A) and in ICL3 (L686A) decreased the agonist potency by 9–32 fold, which indicates that ICL1, ICL3 and TM3 are involved in the recognition of Gi1.
GABAB predominantly couples to Gi/o subtypes of G protein23. The C-terminal 5–9 residues of the α5 helix of G protein have previously been found to be the key determinants for G-protein-coupling specificity24,25. The α5 helix of Gαi1 contributed 62% (533 Å2) of the interaction surface with GABAB (Extended Data Fig. 7a). Sequence alignment of Gαs, Gαq, Gα13 and Gαi showed four nonidentical amino acids among the final five C-terminal residues (G.H5.22–G.H5.26)26 (Fig. 3e, Extended Data Fig. 7h). We mutated these four residues in Gαi1 to the corresponding residues of Gαs, Gαq and Gα13. Substitution mutations of C351G.H5.23 (superscript codes refer to common Gα numbering system) or G352G.H5.24—but not L353G.H5.22 or F354G.H5.25—impaired GABAB-induced G-protein signalling, which suggests an essential role for C351G.H5.23 and a partial involvement of G352G.H5.24 in the specificity of Gi coupling (Fig. 3f, g, Extended Data Fig. 7i, j), consistent with previous data25. The overall structure was similar in the backbone of the α5 helix to that in different G proteins, but Gαs and Gαq possess a tyrosine instead of cysteine in Gαi G.H5.23, which may lead to potential steric hindrance with the ICL2 of GB2 (Fig. 3e). When replacing C351G.H5.23 or G352G.H5.24 with a bulky tryptophan to create clashes with ICL2, we observed decreased GABAB-induced Gi signalling, whereas the substitution of C351G.H5.23 with alanine led to no obvious signalling loss (Fig. 3f, g). The specificity of recognition of the α5 helix of Gi1 by GABAB confirmed the importance of ICL2 in the selective activation of Gi.
Distinct Gi binding model of GABAB
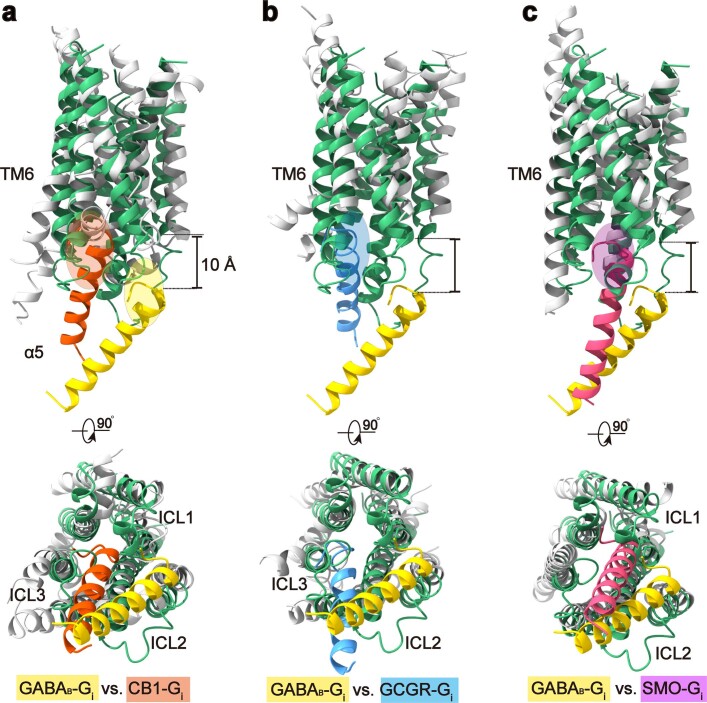
Gil binding to GABAB forms a smaller interface (856 Å2) than in the class-A cannabinoid receptor 1 (1,155 Å2), class-B glucagon receptor (905 Å2), or class-F smoothened receptor (1,060 Å2) (Extended Data Fig. 8). The α5 helices coupled to class-A, -B and -F GPCRs through nearly the same intracellular cavity that reached the same depth into the TMDs of the receptor, whereas the α5 of Gi coupled to GABAB inserts around 10 Å less deeply (Fig. 4a, Extended Data Fig. 8). Consequently, the C-terminal end of the α5 of Gαi did not penetrate into a central cavity (which we term pocketR), but rather into a cavity located at the periphery (Fig. 4b, c). The extended ICL2 inserted into a G-protein pocket (which we term pocketG) that comprised the α5 helix, the linker region in β2–β3 and the linker region of αN–β1 (Fig. 4c). The GABAB-bound Gi1 adopted open conformations, showing a notable separation of Ras and helical domains and the displacement of the α5 helix away from GDP-binding sites (Fig. 4d). Compared with other Gil structures in the GPCR–Gi complexes, GABAB-activated G protein retained all of the expected conformational features of an activated G protein, except for a 25° upward rotation along the αN domain that was due to the distinct interactions with ICL2 of GABAB (Fig. 4e). Collectively, these results suggest that the GABAB adopts a distinct mode of G-protein coupling compared to class-A, -B and -F GPCRs.
Extended Data Fig. 8. Comparison of the Gi binding pocket among class-A, -B, -C and -F GPCRs.
a–c, Parallel comparisons of the Gi binding pocket between the GABAB and class-A CB1 (a), class-B GCGR (b) and class-F SMO (c) receptors. Four structures were aligned by the class-A TMD as a reference, as in Fig. 2. A comparison of the indicated two receptors is shown. Colours for α5 are: GABAB-bound, yellow; CB1-bound (PDB 6N4B), orange–red; GCGR-bound (PDB 6LML), sky blue; and SMO-bound (PDB 6OT0), magenta.
Fig. 4. Distinct Gi binding model of GABAB.
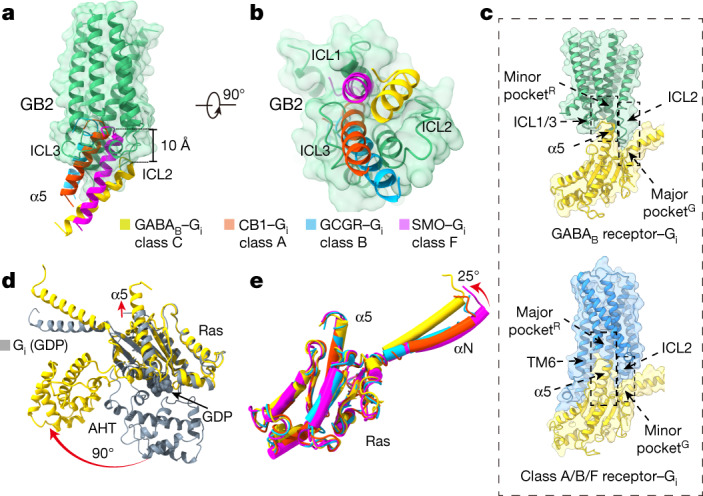
a, b, Orientations of the α5 helix in Gi protein when coupling to GABAB, cannabinoid receptor 1 (CB1) (class A), glucagon receptor (GCGR) (class B) and smoothened (SMO) (class F). Structures were aligned by the TMDs; only the TMD of GB2 is shown, for clarity. GABAB-bound, yellow; CB1-bound α5, PDB 6N4B; GCGR-bound α5, PDB 6LML; SMO-bound α5, PDB 6OT0. c, Schematics of the two types of pocket that are involved in G-protein recognition. GABAB, green; monomeric GPCR, blue; Gi, yellow. d, Superposition of GABAB-bound Gil with the GDP-bound Gil. GDP-bound Gil, PDB 1GP2. e, Structural comparison of the GABAB-bound Gil with CB1-, GCGR- and SMO-bound Gil. G proteins are coloured as in a, b.
Discussion
Our cryo-EM structure of the GABAB–Gi complex stabilized with an agonist and a PAM reveals an asymmetric activation process in which a single G protein interacts with GB2. It also reveals a distinct mode of G-protein activation, as the Gα C-terminal end interacts with a shallow groove that involves TM3 and the ICLs of GB2 (Extended Data Fig. 9) rather than with a central pocket that results from TM6 movement (as observed with other GPCRs)5,7. Consistent with the PAM-binding site being located at the TM6 interface between the subunits, no outward movement of TM6 is observed in the GABAB–Gi complex. Despite this different mode of activation, the activated G protein retained all of the expected conformational changes (as observed with the other classes of GPCR)5,27,28. This binding mode explains the Gi selectivity of the GABAB, and is supported by numerous mutations within the ICLs and the G protein22,25,29. The similar determinants that are involved in G-protein recognition, the conservation of ICL230,31 and the similar mode of activation of these dimeric receptors suggest that there may be a similar coupling mechanism in the other class-C GPCRs.
Extended Data Fig. 9. Proposed model of GABAB activation.
a–d, Schematic of the essential steps for GABAB activation. e, Comparison of the relative bending of GB2 subunit in the agonist- and PAM–Gi-bound (ago/PAM-Gi) (green), the agonist-bound (ago) (PDB 6UO9) (blue), and antagonist-bound (antago) (PDB 7C7S) (yellow) when aligned on the GB2 VFT. f, The transmembrane domain rearrangement of GABAB during activation. The antagonist-bound (antago) (PDB 7C7S) (yellow), agonist-bound (ago) (PDB 6UO9) (blue), and the agonist- and PAM–Gi-bound (ago/PAM–Gi) (green) structures of the TMD of GABAB were aligned by the TMB of GB1. g, PAM binding in agonist- and PAM–Gi-bound GABAB (ago/PAM–Gi).
The agonist- and PAM–Gi-bound GABAB structure was almost identical to that observed with the agonist and PAM without Gi (Extended Data Fig. 5b), which indicates that the G protein has no additional effect on the conformation of the receptor. This also suggests that the PAM has an effect similar to that of the G protein on the conformation of GB2. Although an agonist-bound GABAB–Gi complex will be informative in clarifying this issue, we have not been able to obtain such a complex that is stable enough for cryo-EM analysis.
Our observations demonstrate how agonist binding in the VFT domain of GB1 can allosterically control activation of the TMD of GB2. Our results show that a closed VFT domain of GB1 leads to a new positioning of the VFT domain of GB2 that is associated with the bending of this subunit and the movement of the TMDs one relative to the other, which leads to a change from TM5 to TM6 as the dimer interface (Extended Data Fig. 9a, b). This probably corresponds to the first activation step, as previously reported in mGlus32,33. The addition of a PAM (with or without the G protein) leads to a second movement of the two TMDs with a closer apposition of GB2 on GB1 that creates the PAM-binding site and leads to a change in the bending of the GB2 subunit (Extended Data Fig. 9e–g). This bending is associated with a slight change in the conformation of ICL2 and a movement of TM3 relative to TM5 in GB2 only, which opens the shallow cavity in which the C-terminal end of the G protein binds (Fig. 2b). This model highlights the intra-GB2-subunit conformational changes that result from the closing of the VFT domain of GB1 and the contact between the TM6s as being the essential route for the allosteric interaction between the agonist-binding site and the G-protein-activating site.
Taken together, our observations provide structural information for the asymmetric activation of a dimeric GABAB, which may also apply to other class-C receptors. Our results also reveal that—despite a different binding mode compared to other GPCRs—activated GABAB leads to an almost identical conformational change in the Gα protein that allows the receptor to act as a guanine nucleotide-exchange factor.
Methods
No statistical methods were used to predetermine sample size. The experiments were not randomized, and investigators were not blinded to allocation during experiments and outcome assessment.
Constructs
To facilitate expression and purification, human GABAB with the haemagglutinin (HA) signal peptide—including GB1a (UniProt: Q9UBS5) and GB2 (UniProt: O75899)—were cloned into the pEG BacMam vector34. An 8× histidine tag and 3C protease cleavage site were inserted at the C terminus of the GB1a (residues 15–919) subunit, and a Flag epitope tag (DYKDDDD) and a 2× GSG linker were added to the N terminus of the GB2 (residues 42–819) subunit. GABAB and Gil mutants were generated using site-directed mutagenesis. All the constructs were confirmed by sequencing.
Expression and purification of scFv16
scFv16 was expressed and purified as previously described35. In brief, the 6×histidine-tagged scFv16 was expressed in secreted form in Trichoplusia ni Hi5 insect cells for 48 h using the Bac-to-Bac system. The expressed scFv16 was purified using a Ni-NTA resin. The C-terminal 6×His tag of the Ni-NTA eluent was cleaved by 3C protease and further purified by gel filtration chromatography using a Superdex 200 column. Finally, the purified scFv16 was concentrated and stored at −80 °C until further use.
Expression and purification of heterotrimeric Gi1
Heterotrimeric Gi1 was expressed and purified as previously described35. In brief, the dominant-negative Gαi1 (S47N, G203A, E245A and A326S) and human β1γ2 subunits (β1–8×His tag) were co-expressed in Hi5 insect cells for 48 h using the Bac-to-Bac system. The cells were collected and lysed with a buffer containing 10 mM HEPES (pH 7.5), 100 μM MgCl2 and 10 μM GDP. The cell membrane was collected by centrifugation and heterotrimeric Gi1 was extracted in a buffer containing 1% sodium cholate. The supernatant was purified by Ni-NTA column and the detergent was exchanged with n-dodecyl-β-d-maltoside (Anatrace) on a column. Afterward, Gi1 was mixed with a 1.2 molar excess of scFv16 and further purified by Superdex 200 column. Finally, the Gi1–scFv16 complex was concentrated and flash-frozen in liquid nitrogen until further use.
Formation of the GABAB–Gi1–scFv16 complex
The GB1 and GB2 plasmids mixed with PEI 25 K at a 3:0.5:0.5 ratio of PEI to GB1 and GB2 plasmid (w/w) were added to HEK293F cells when the density reached about 2.8 million per ml. Seventeen hours after infection, sodium butyrate was added at a final concentration of 10 mM and the cells were grown for another 3 days at 30 °C before being collected11. The collected cells were solubilized for 3 h at 4 °C in a buffer containing 0.5% (w/v) lauryl maltose neopentyl glycol (Anatrace) and 0.1% (w/v) cholesteryl hemisuccinate (Anatrace). After centrifugation at 30,000g for 30 min, the GABAB was purified by Ni-NTA column and M1 anti-Flag affinity resin. The GABAB was further concentrated and mixed with a 1.3 molar excess of Gi1–scFv16 complex in the presence of 100 μM baclofen and 50 μM BHFF. The sample was incubated at 25 °C for 1 h, followed by the addition of 0.2 U ml−1 apyrase for an additional 1.5-h incubation at 24 °C36. Finally, the sample was purified using a Superose 6 Increase column (GE Healthcare) to acquire a homogeneous GABAB receptor–Gi1 complex. The entire purification procedure was accomplished in 12 h, followed by immediate verification to acquire a stable and fresh sample for structural determination.
Cryo-EM grid preparation and data collection
To prepare cryo-EM grids, 3.0 μl of the purified baclofen- and BHFF-activated GABAB–Gi1 complex at 1.8 mg ml−1 was applied onto the glow-discharged holey carbon grids (Quantifoil, R1.2/1.3, 300 mesh). The grids were blotted for 3.0 s with a blot force of 3 at 4 °C, 100% humidity, and then plunge-frozen in liquid ethane using Vitrobot Mark IV (Thermo Fischer Scientific). Cryo-EM data collection was performed on a Titan Krios at 300 kV accelerating voltage in the Center of Cryo-Electron Microscopy (Zhejiang University). Micrographs were recorded using a Gatan K2 Summit Detector in counting mode with a pixel size of 1.014 Å using SerialEM software37. Image stacks were obtained at a dose rate of about 8.0 electrons per Å2 per second with a defocus ranging from −1.0 to −2.5 μm. The total exposure time was 8 s, and 40 frames were recorded per micrograph. A total of 13,843 movies were collected for the GABAB–Gi1 complex.
Cryo-EM data processing
Image stacks for the GABAB–Gi1 complex were subjected to beam-induced motion correction using MotionCor238. Contrast transfer function parameters for non-dose-weighted micrographs were determined by Gctf39. Cryo-EM data processing was performed using Relion 3.140 and CryoSPARC 2.1541. Template-based particle selection yielded 5,889,932 particle projections using Relion. The projections were imported to CryoSPARC for 2D classification to discard poorly defined particles. The selected particle projections were further subjected to ab initio reconstruction and heterogeneous refinement in CryoSPARC. The well-defined subsets accounting for 1,366,533 particles were re-extracted for further processing in Relion. Three-dimensional classification showed that Gi1 predominantly bound to GB2, however, a small subset (112,338 particles) was also found to interact with GB1. To sort out conformational uniform particles for 3D reconstruction, these projections were subjected to 3D classification with a mask on the TMD–Gil, producing one good subset that accounted for 362,826 particles. Further 3D classifications focusing the alignment on the Gil produced two good subsets, which accounted for 275,089 particles that were subsequently subjected to 3D refinement, contrast transfer function refinement and Bayesian polishing. The overall refinement of GABAB–Gi1 generated a map with an indicated global resolution of 3.5 Å at a Fourier shell correlation of 0.143. To further improve the map quality of the complex (especially for Gi1), local 3D reconstruction focusing on the GABAB receptor and Gi1 was performed using the partial signal subtracted particles in Relion. The local refinement maps for the GABAB and Gi1 showed a global resolution of 3.3 Å and 3.4 Å, respectively, which were combined on the basis of the global refinement map using ‘vop maximum’ command in UCSF Chimera42. This composite map of the GABAB–Gi1 complex was used for subsequent model building and analysis. Global and local resolution was determined using the Bsoft 2.0.7 package43 with half maps as input maps.
Model building and refinement
The model of the active GABAB (PDB 7C7Q)11 was used to generate the initial template of the GABAB. The atomic coordinates of Gil and scFv16 from the structure of the human cannabinoid receptor 2–Gi1 complex (PDB 6PT0)36 were used to generate the initial template of the Gi1–scFv16 complex. Models of GABAB and Gil–scFv16 were docked into the electron microscopy density map using UCSF Chimera42. Agonist and PAM coordinates and geometry restraints were generated using a phenix.elbow44. The docked model was subjected to flexible fitting using Rosetta45 and was further rebuilt in Coot45 and real-space-refined in Rosetta45 and Phenix44. The final refinement statistics were validated using the module ‘comprehensive validation (cryo-EM)’ in Phenix. The goodness-of-fit of the model to the map was determined using a global model-versus-map Fourier shell correlation. The refinement statistics are provided in Supplementary Information and Extended Data Table 1. Structural figures were created using UCSF Chimera42 and the UCSF Chimera X package46.
Enzyme-linked immunosorbent assay
The cell-surface expression of the receptor subunits was detected using an enzyme-linked immunosorbent assay (ELISA). In brief, HEK293T cells were plated in each well of a 6-well plate at a concentration of 0.3 million per ml (2 ml per well). Plasmid transfection was performed with a mixture of 200 ng Gαi1–lgbit, 500 ng Gγ–smbit, 500 ng Gβ, 200 ng GABAB wild type (HA–GB1 and Flag–GB2) or mutants using Lipofectamine 2000 (Thermo Fisher Scientific) in 200 μl of Opti-MEM (Thermo Fisher Scientific). The Flag- and HA-tagged subunits were cotransfected into HEK293T cells and plated in a 96-well plate with a white transparent bottom. HEK293T cells were fixed with 4% paraformaldehyde and blocked with 10% fetal bovine serum (FBS). Bound antibodies coupled to horseradish peroxidase were detected by luminescence using SuperSignal ELISA Femto Maximum Sensitivity substrate (ThermoFisher Scientific), and luminescence was measured using a luminescence microplate reader (Tecan).
IP1 accumulation assay
IP1 accumulation was measured using the IP-One HTRF kit (PerkinElmer, CisBio Bioassays). Transfected HEK293 cells were seeded in a 96-well plate, and 24 h after transfection, cells were treated with baclofen diluted in stimulation buffer in a Cisbio kit for 30 min at 37 °C. Then, cryptate-labelled anti-IP1 monoclonal antibody and d2-labelled IP1 in lysis buffer were added to the wells. After 1 h of incubation at room temperature, the plates were read in PHERAstar FS with excitation at 337 nm and emission at 620 and 665 nm. The accumulation of IP1 was calculated according to a standard dose–response curve.
NanoBiT-G-protein dissociation assay
G-protein activation was detected using a Nanobit-G protein dissociation assay47. The transfection system was the same as that used in the ELISA. After 1 day of transfection, cells in the 6-well plate were digested and resuspended in complete medium DMEM (5% FBS, 1% antibiotic) and plated in 96-well flat-bottomed white microplates. After 24 h, the cells were washed twice with D-PBS and incubated in 40 μl of 5 μM coelenterazine H (Promega) solution diluted with 0.01% BSA- and 5 mM HEPES (pH 7.4)-containing HBSS (assay buffer) for 2 h at room temperature. Baseline luminescence was measured using a luminescent microplate reader (Tecan). The test compound (5×, diluted in the assay buffer) was added to the cells (10 μl) and incubated for 3–5 min at room temperature before the second measurement. The ligand-induced signal ratio was normalized to the baseline luminescence, and fold-change signals over vehicle treatment were used to show the G-protein dissociation response.
Statistical analysis
Statistical analyses were performed on at least three individual datasets and analysed using GraphPad Prism software. Bars represent differences in the calculated agonist potency (pEC50), maximum agonist response (Emax) and basal activity for each mutant relative to the wild-type receptor. Data are mean ± s.e.m. from at least three independent experiments, performed in triplicates. ND, not determined. *P < 0.05, **P < 0.01, ***P < 0.001, ****P < 0.0001 (one-way analysis of variance (ANOVA) followed by Dunnett’s test, compared with the response of the wild type). For dose–response experiments, data were normalized and analysed using nonlinear curve fitting for the log (agonist) versus response (three parameters) curves.
Reporting summary
Further information on research design is available in the Nature Research Reporting Summary linked to this paper.
Online content
Any methods, additional references, Nature Research reporting summaries, source data, extended data, supplementary information, acknowledgements, peer review information; details of author contributions and competing interests; and statements of data and code availability are available at 10.1038/s41586-021-03507-1.
Supplementary information
This file contains Supplementary Fig. 1 (the uncropped gels) and Supplementary Table 1.
The relative motion of GABAB and Gi1 represented by the first eigenvector from the principal component analysis.
The relative motion of GABAB and Gi1 represented by the second eigenvector from the principal component analysis.
Source data
Acknowledgements
The cryo-EM data were collected at the Cryo-Electron Microscopy Center of Zhejiang University with the technical support from S. Chang. Protein purification were performed at the Protein Facilities (Zhejiang University School of Medicine) with the support of C. Ma. This project was supported by Ministry of Science and Technology (2019YFA050880 to Y.Z., 2018YFA0507003 to J.L.), the National Natural Science Foundation of China Grant (81922071 to Y.Z. and 81720108031, 81872945, 31721002 to J.L.), Zhejiang Province Natural Science Fund for Excellent Young Scholars (LR19H31000 to YZ.); the Fondation pour la Recherche Médicale (DEQ20170336747, to J.-P.P.) and the Agence Nationale pour la Recherche (ANR 18-CE11-0004-01 to J.-P.P.). J.-P.P. and P.R. were supported by the Centre National de la Recherche Scientifique (CNRS, PICS no. 07030; PRC no. 1403), the Institut National de la Santé et de la Recherche Médicale (INSERM) and the Program Hubert Curien (PHC) Cai Yuanpei from the Ministère Français des Affaires Etrangères.
Extended data figures and tables
Author contributions
Y.Z. and J.L. conceived and supervised the whole project; C.S. designed the constructs, and expressed and purified the GABAB–Gi1 complex; C.M. prepared the cryo-EM grids, collected the cryo-EM data, and performed cryo-EM map calculation and model building; C.S., C.M. and C.X. designed the constructs for functional assays; C.S., C.X. and N.J. generated the constructs of mutants; C.X. and X.W. performed the IP1 functional experiments; N.J. performed the NanoBiT cellular functional assays with assistance of H.Z. and Q.S.; D.-D.S. evaluated the sample by negative-stain electron microscopy; C.S., C.M., C.X. and N.J. prepared the figures; C.S., C.M. and C.X. participated in manuscript writing; P.R. and J.-P.P. participated in the interpretation of the data and the preparation of the manuscript; T.H. and Z.C. helped to improve the manuscript; J.-P.P., Y.Z. and J.L. wrote the manuscript with inputs from all the authors.
Data availability
The cryo-EM density map and corresponding atomic coordinate of the GABAB–Gi1 complex have been deposited in the Electron Microscopy Data Bank and PDB under the accession codes EMD-31049 and 7EB2, respectively. All data analysed in this study are included in this Article and its Supplementary Information. Any other relevant data are available from the corresponding authors upon reasonable request. Source data are provided with this paper.
Competing interests
The authors declare no competing interests.
Footnotes
Peer review information Nature thanks Martin Lohse and the other, anonymous, reviewer(s) for their contribution to the peer review of this work.
Publisher’s note Springer Nature remains neutral with regard to jurisdictional claims in published maps and institutional affiliations.
These authors contributed equally: Cangsong Shen, Chunyou Mao, Chanjuan Xu, Nan Jin
Contributor Information
Jean-Philippe Pin, Email: jean-philippe.pin@igf.cnrs.fr.
Yan Zhang, Email: zhang_yan@zju.edu.cn.
Jianfeng Liu, Email: jfliu@mail.hust.edu.cn.
Extended data
is available for this paper at 10.1038/s41586-021-03507-1.
Supplementary information
The online version contains supplementary material available at 10.1038/s41586-021-03507-1.
References
- 1.Hauser AS, Attwood MM, Rask-Andersen M, Schiöth HB, Gloriam DE. Trends in GPCR drug discovery: new agents, targets and indications. Nat. Rev. Drug Discov. 2017;16:829–842. doi: 10.1038/nrd.2017.178. [DOI] [PMC free article] [PubMed] [Google Scholar]
- 2.Gilman AG. G proteins: transducers of receptor-generated signals. Annu. Rev. Biochem. 1987;56:615–649. doi: 10.1146/annurev.bi.56.070187.003151. [DOI] [PubMed] [Google Scholar]
- 3.Rasmussen SG, et al. Crystal structure of the β2 adrenergic receptor–Gs protein complex. Nature. 2011;477:549–555. doi: 10.1038/nature10361. [DOI] [PMC free article] [PubMed] [Google Scholar]
- 4.Kang Y, et al. Cryo-EM structure of human rhodopsin bound to an inhibitory G protein. Nature. 2018;558:553–558. doi: 10.1038/s41586-018-0215-y. [DOI] [PMC free article] [PubMed] [Google Scholar]
- 5.Qi X, et al. Cryo-EM structure of oxysterol-bound human Smoothened coupled to a heterotrimeric Gi. Nature. 2019;571:279–283. doi: 10.1038/s41586-019-1286-0. [DOI] [PMC free article] [PubMed] [Google Scholar]
- 6.Velazhahan V, et al. Structure of the class D GPCR Ste2 dimer coupled to two G proteins. Nature. 2021;589:148–153. doi: 10.1038/s41586-020-2994-1. [DOI] [PMC free article] [PubMed] [Google Scholar]
- 7.Hilger D, et al. Structural insights into differences in G protein activation by family A and family B GPCRs. Science. 2020;369:eaba3373. doi: 10.1126/science.aba3373. [DOI] [PMC free article] [PubMed] [Google Scholar]
- 8.Kniazeff J, Prézeau L, Rondard P, Pin JP, Goudet C. Dimers and beyond: the functional puzzles of class C GPCRs. Pharmacol. Ther. 2011;130:9–25. doi: 10.1016/j.pharmthera.2011.01.006. [DOI] [PubMed] [Google Scholar]
- 9.Kaupmann K, et al. GABAB-receptor subtypes assemble into functional heteromeric complexes. Nature. 1998;396:683–687. doi: 10.1038/25360. [DOI] [PubMed] [Google Scholar]
- 10.Pin JP, Bettler B. Organization and functions of mGlu and GABAB receptor complexes. Nature. 2016;540:60–68. doi: 10.1038/nature20566. [DOI] [PubMed] [Google Scholar]
- 11.Mao C, et al. Cryo-EM structures of inactive and active GABAB receptor. Cell Res. 2020;30:564–573. doi: 10.1038/s41422-020-0350-5. [DOI] [PMC free article] [PubMed] [Google Scholar]
- 12.Bettler B, Kaupmann K, Mosbacher J, Gassmann M. Molecular structure and physiological functions of GABAB receptors. Physiol. Rev. 2004;84:835–867. doi: 10.1152/physrev.00036.2003. [DOI] [PubMed] [Google Scholar]
- 13.Jones KA, et al. GABAB receptors function as a heteromeric assembly of the subunits GABABR1 and GABABR2. Nature. 1998;396:674–679. doi: 10.1038/25348. [DOI] [PubMed] [Google Scholar]
- 14.White JH, et al. Heterodimerization is required for the formation of a functional GABAB receptor. Nature. 1998;396:679–682. doi: 10.1038/25354. [DOI] [PubMed] [Google Scholar]
- 15.Chun L, Zhang WH, Liu JF. Structure and ligand recognition of class C GPCRs. Acta Pharmacol. Sin. 2012;33:312–323. doi: 10.1038/aps.2011.186. [DOI] [PMC free article] [PubMed] [Google Scholar]
- 16.Park J, et al. Structure of human GABAB receptor in an inactive state. Nature. 2020;584:304–309. doi: 10.1038/s41586-020-2452-0. [DOI] [PMC free article] [PubMed] [Google Scholar]
- 17.Papasergi-Scott MM, et al. Structures of metabotropic GABAB receptor. Nature. 2020;584:310–314. doi: 10.1038/s41586-020-2469-4. [DOI] [PMC free article] [PubMed] [Google Scholar]
- 18.Shaye H, et al. Structural basis of the activation of a metabotropic GABA receptor. Nature. 2020;584:298–303. doi: 10.1038/s41586-020-2408-4. [DOI] [PMC free article] [PubMed] [Google Scholar]
- 19.Koek W, Cheng K, Rice KC. Discriminative stimulus effects of the GABAB receptor-positive modulator rac–BHFF: comparison with GABAB receptor agonists and drugs of abuse. J. Pharmacol. Exp. Ther. 2013;344:553–560. doi: 10.1124/jpet.112.202226. [DOI] [PMC free article] [PubMed] [Google Scholar]
- 20.Binet V, et al. Common structural requirements for heptahelical domain function in class A and class C G protein-coupled receptors. J. Biol. Chem. 2007;282:12154–12163. doi: 10.1074/jbc.M611071200. [DOI] [PMC free article] [PubMed] [Google Scholar]
- 21.Gether U. Uncovering molecular mechanisms involved in activation of G protein-coupled receptors. Endocr. Rev. 2000;21:90–113. doi: 10.1210/edrv.21.1.0390. [DOI] [PubMed] [Google Scholar]
- 22.Havlickova M, et al. The intracellular loops of the GB2 subunit are crucial for G-protein coupling of the heteromeric γ-aminobutyrate B receptor. Mol. Pharmacol. 2002;62:343–350. doi: 10.1124/mol.62.2.343. [DOI] [PubMed] [Google Scholar]
- 23.Tu H, et al. GABAB receptor activation protects neurons from apoptosis via IGF-1 receptor transactivation. J. Neurosci. 2010;30:749–759. doi: 10.1523/JNEUROSCI.2343-09.2010. [DOI] [PMC free article] [PubMed] [Google Scholar]
- 24.Conklin BR, Farfel Z, Lustig KD, Julius D, Bourne HR. Substitution of three amino acids switches receptor specificity of Gqα to that of Giα. Nature. 1993;363:274–276. doi: 10.1038/363274a0. [DOI] [PubMed] [Google Scholar]
- 25.Franek M, et al. The heteromeric GABA-B receptor recognizes G-protein α subunit C-termini. Neuropharmacology. 1999;38:1657–1666. doi: 10.1016/s0028-3908(99)00135-5. [DOI] [PubMed] [Google Scholar]
- 26.Vroling B, et al. GPCRDB: information system for G protein-coupled receptors. Nucleic Acids Res. 2011;39:D309–D319. doi: 10.1093/nar/gkq1009. [DOI] [PMC free article] [PubMed] [Google Scholar]
- 27.Krishna Kumar K, et al. Structure of a signaling cannabinoid receptor 1–G protein complex. Cell. 2019;176:448–458.e12. doi: 10.1016/j.cell.2018.11.040. [DOI] [PMC free article] [PubMed] [Google Scholar]
- 28.Qiao A, et al. Structural basis of Gs and Gi recognition by the human glucagon receptor. Science. 2020;367:1346–1352. doi: 10.1126/science.aaz5346. [DOI] [PubMed] [Google Scholar]
- 29.Duthey B, et al. A single subunit (GB2) is required for G-protein activation by the heterodimeric GABAB receptor. J. Biol. Chem. 2002;277:3236–3241. doi: 10.1074/jbc.M108900200. [DOI] [PMC free article] [PubMed] [Google Scholar]
- 30.Havlickova M, et al. The second intracellular loop of metabotropic glutamate receptors recognizes C termini of G-protein α-subunits. J. Biol. Chem. 2003;278:35063–35070. doi: 10.1074/jbc.M306555200. [DOI] [PubMed] [Google Scholar]
- 31.Gomeza J, et al. The second intracellular loop of metabotropic glutamate receptor 1 cooperates with the other intracellular domains to control coupling to G-proteins. J. Biol. Chem. 1996;271:2199–2205. doi: 10.1074/jbc.271.4.2199. [DOI] [PubMed] [Google Scholar]
- 32.Hlavackova V, et al. Sequential inter- and intrasubunit rearrangements during activation of dimeric metabotropic glutamate receptor 1. Sci. Signal. 2012;5:ra59. doi: 10.1126/scisignal.2002720. [DOI] [PubMed] [Google Scholar]
- 33.Grushevskyi EO, et al. Stepwise activation of a class C GPCR begins with millisecond dimer rearrangement. Proc. Natl Acad. Sci. USA. 2019;116:10150–10155. doi: 10.1073/pnas.1900261116. [DOI] [PMC free article] [PubMed] [Google Scholar]
- 34.Goehring A, et al. Screening and large-scale expression of membrane proteins in mammalian cells for structural studies. Nat. Protocols. 2014;9:2574–2585. doi: 10.1038/nprot.2014.173. [DOI] [PMC free article] [PubMed] [Google Scholar]
- 35.Koehl A, et al. Structure of the µ-opioid receptor–Gi protein complex. Nature. 2018;558:547–552. doi: 10.1038/s41586-018-0219-7. [DOI] [PMC free article] [PubMed] [Google Scholar]
- 36.Xing C, et al. Cryo-EM structure of the human cannabinoid receptor CB2–Gi signaling complex. Cell. 2020;180:645–654.e13. doi: 10.1016/j.cell.2020.01.007. [DOI] [PMC free article] [PubMed] [Google Scholar]
- 37.Schorb M, Haberbosch I, Hagen WJH, Schwab Y, Mastronarde DN. Software tools for automated transmission electron microscopy. Nat. Methods. 2019;16:471–477. doi: 10.1038/s41592-019-0396-9. [DOI] [PMC free article] [PubMed] [Google Scholar]
- 38.Zheng SQ, et al. MotionCor2: anisotropic correction of beam-induced motion for improved cryo-electron microscopy. Nat. Methods. 2017;14:331–332. doi: 10.1038/nmeth.4193. [DOI] [PMC free article] [PubMed] [Google Scholar]
- 39.Zhang K. Gctf: real-time CTF determination and correction. J. Struct. Biol. 2016;193:1–12. doi: 10.1016/j.jsb.2015.11.003. [DOI] [PMC free article] [PubMed] [Google Scholar]
- 40.Scheres SH. Processing of structurally heterogeneous cryo-EM data in RELION. Methods Enzymol. 2016;579:125–157. doi: 10.1016/bs.mie.2016.04.012. [DOI] [PubMed] [Google Scholar]
- 41.Punjani A, Rubinstein JL, Fleet DJ, Brubaker M. A. cryoSPARC: algorithms for rapid unsupervised cryo-EM structure determination. Nat. Methods. 2017;14:290–296. doi: 10.1038/nmeth.4169. [DOI] [PubMed] [Google Scholar]
- 42.Pettersen EF, et al. UCSF Chimera—a visualization system for exploratory research and analysis. J. Comput. Chem. 2004;25:1605–1612. doi: 10.1002/jcc.20084. [DOI] [PubMed] [Google Scholar]
- 43.Heymann JB. Single particle reconstruction and validation using Bsoft for the map challenge. J. Struct. Biol. 2018;204:90–95. doi: 10.1016/j.jsb.2018.07.003. [DOI] [PMC free article] [PubMed] [Google Scholar]
- 44.Adams PD, et al. PHENIX: a comprehensive Python-based system for macromolecular structure solution. Acta Crystallogr. D. 2010;66:213–221. doi: 10.1107/S0907444909052925. [DOI] [PMC free article] [PubMed] [Google Scholar]
- 45.Emsley P, Cowtan K. Coot: model-building tools for molecular graphics. Acta Crystallogr. D. 2004;60:2126–2132. doi: 10.1107/S0907444904019158. [DOI] [PubMed] [Google Scholar]
- 46.Goddard TD, et al. UCSF ChimeraX: meeting modern challenges in visualization and analysis. Prot. Sci. 2018;27:14–25. doi: 10.1002/pro.3235. [DOI] [PMC free article] [PubMed] [Google Scholar]
- 47.Kato HE, et al. Conformational transitions of a neurotensin receptor 1–Gi1 complex. Nature. 2019;572:80–85. doi: 10.1038/s41586-019-1337-6. [DOI] [PMC free article] [PubMed] [Google Scholar]
Associated Data
This section collects any data citations, data availability statements, or supplementary materials included in this article.
Supplementary Materials
This file contains Supplementary Fig. 1 (the uncropped gels) and Supplementary Table 1.
The relative motion of GABAB and Gi1 represented by the first eigenvector from the principal component analysis.
The relative motion of GABAB and Gi1 represented by the second eigenvector from the principal component analysis.
Data Availability Statement
The cryo-EM density map and corresponding atomic coordinate of the GABAB–Gi1 complex have been deposited in the Electron Microscopy Data Bank and PDB under the accession codes EMD-31049 and 7EB2, respectively. All data analysed in this study are included in this Article and its Supplementary Information. Any other relevant data are available from the corresponding authors upon reasonable request. Source data are provided with this paper.


