

Abstract
Severe acute respiratory syndrome coronavirus 2 (SARS‐CoV‐2) has resulted in an unprecedented need for diagnostic testing that is critical in controlling the spread of COVID‐19. We propose a portable infrared spectrometer with purpose‐built transflection accessory for rapid point‐of‐care detection of COVID‐19 markers in saliva. Initially, purified virion particles were characterized with Raman spectroscopy, synchrotron infrared (IR) and AFM‐IR. A data set comprising 171 transflection infrared spectra from 29 subjects testing positive for SARS‐CoV‐2 by RT‐qPCR and 28 testing negative, was modeled using Monte Carlo Double Cross Validation with 50 randomized test and model sets. The testing sensitivity was 93 % (27/29) with a specificity of 82 % (23/28) that included positive samples on the limit of detection for RT‐qPCR. Herein, we demonstrate a proof‐of‐concept high throughput infrared COVID‐19 test that is rapid, inexpensive, portable and utilizes sample self‐collection thus minimizing the risk to healthcare workers and ideally suited to mass screening.
Keywords: COVID-19 diagnostic, Fourier transform infrared (FTIR) spectroscopy, Raman spectroscopy, saliva, SARS-CoV-2
Using a modified infrared reflection accessory designed for high throughput saliva analysis we show proof of concept of a COVID‐19 point‐of‐care screening device.

Introduction
Coronavirus disease 2019 (COVID‐19) is a highly transmissible respiratory disease caused by the novel severe acute respiratory syndrome coronavirus 2 (SARS‐CoV‐2). This virus has infected over 160 million people resulting in greater than 3 million deaths surpassing malaria infections as the world's most devastating infectious disease. [1] The high mortality rate and tremendous socio‐economic cost of the virus has necessitated mass testing to detect infected individuals who can then be isolated to reduce transmission. The gold standard for detection of SARS‐CoV‐2 is Reverse Transcription quantitative Polymerase Chain Reaction (RT‐qPCR) assay using material collected from nasopharyngeal swabs. [2] Whilst the assay has been effective in reducing transmission rates, the turnaround time for the result can be several days. The assay itself takes ≈4 hours, requiring relatively expensive instrumentation and consumables including PCR primers, enzymes and other reagents, which can be difficult to implement in under‐resourced health care systems. Collection of swab samples for RT‐qPCR requires skilled health workers and close face to face contact with subjects; hence necessitating personal protective equipment (PPE), which is expensive and may be in short supply. [3] Nasal swab collection is uncomfortable, sometimes even causing bleeding and is likely to be unacceptable by some workers, where regular surveillance sampling is required. [4] While saliva testing with RT‐qPCR is being explored, [5] this does not overcome the limitations associated with expense and time. Considering these many drawbacks, the implementation of new diagnostic approaches that can be performed rapidly, affordably, and with minimal risk to patient and health care workers, is highly desirable.
Infrared spectroscopy is a routine analytical technique mainly used to identify molecular functional groups in various materials. Infrared light interacting with the intrinsic vibrational modes of molecules generates a spectrum that represents a unique chemical fingerprint of the sample. The development of portable Attenuated Total Reflection Fourier Transform Infrared (ATR‐FTIR) spectrometers has seen a plethora of applications in the field of biomedical diagnostics. [6] More recently, the technology has been applied to diagnose Plasmodium sp. in blood [7] and viruses including hepatitis B and hepatitis C in serum. [8] The technique relies on detecting both the molecular phenotype of the pathogen and the host immune response. Advanced machine learning techniques can then be applied to predict diagnostic outcomes based on the chemical differences between infected and uninfected samples.
Recently, Barauna et al. [9] applied ATR‐FTIR to analyze saliva collected from COVID‐19 diagnosed subjects using pharyngeal swabs. In their measurements the swab was placed onto an ATR spectrometer and the spectrum recorded of both the saliva and swab. Interestingly their spectra of purified virus did not show the characteristic amide modes of proteins that are expected given the dominant S‐proteins that characterize SARS‐CoV‐2 virions, nor did they show the characteristic RNA bands that would also be expected from a large RNA virus. [10]
ATR spectroscopy has a number of disadvantages when it comes to high throughput screening. First, the sample has to be dried onto the internal reflection element (IRE) prior to the measurement to maximize the absorbance. Secondly, the residue must be cleaned off the IRE, which increases the potential of transmission through aerosols and via surfaces, posing a danger to the operator. More recently, ATR disposable silicon substrates have been developed and deployed to detect brain cancer in serum samples. [11] These substrates negate the drying and cleaning steps but are prohibitively expensive for routine COVID‐19 testing at present. In pursuit of a cheaper approach to high throughput screening, we propose utilizing infrared reflective slides and a modified reflection accessory to obtain high quality spectra of saliva. Hitherto, most infrared diagnostics have focused on blood components and only few studies have investigated less invasively collected samples such as saliva. [12] Saliva is emerging as an attractive medium for point‐of‐care diagnosis of COVID‐19 in the current pandemic. The SARS‐CoV‐2 has a preferential tropism to human airway epithelial cells that express the cellular receptor angiotensin‐converting enzyme 2 (ACE2). [13] ACE2 was found to be higher in salivary glands compared to the lungs, indicating salivary glands could be a potential target for SARS‐CoV‐2. [14] Wylie et al. [15] reported that SARS‐CoV‐2 RNA copies were higher in saliva (5.58 mean log copies per milliliter) compared to nasopharyngeal swabs (4.93 mean log copies per milliliter) from 70 COVID‐19 positive subjects. Besides SARS‐CoV‐2 virions, saliva is known to have many other COVID‐19 biomarkers, including ACE2, adenosine deaminase, immunoglobulin G, immunoglobulin M, RNA and secretory immunoglobulin A. [16] The number of potential biomarkers and complexity of the spectra requires a machine modelling approach, which has already been employed to data mine blood clinical parameters for COVID‐19 detection [17] and detecting SARS‐CoV‐2 in nasal swabs using matrix‐assisted laser desorption/ionization‐mass spectrometry (MALDI‐MS). [18] From a practical perspective, saliva can be self‐collected by dribbling into a sterile container reducing time and cost associated with the specimen collection and minimizing nosocomial transmission of the disease.[ 13b , 19 ] The infrared technique is eminently suited to the analysis of saliva samples because it requires no additional reagents or consumables, is very rapid (less than 5 minutes to record spectra from three replicate samples and do the computation), the sample dries to a homogenous deposit and the data can be directly transferred to a machine learning model for diagnosis.
Results and Discussion
A comprehensive schematic diagram of the COVID‐19 diagnostic approach is presented in Figure 1 (A–G). In developing a new infrared based test, the first aim was to record a high‐quality spectrum of the purified virus SARS‐CoV‐2 and assign the important marker bands. The SARS‐CoV‐2 virions were purified from the supernatant of infected Vero cells deactivated by fixation with 4 % formalin. [20] Aliquots from the purified stock solution were deposited and dried onto a BaF2 window.
Figure 1.

Schematic diagram of an infrared saliva‐based test for COVID‐19. A–E) A) Subject presents with COVID‐19 symptoms. B) The subject dribbles into a container containing Viral Transport Medium (VTM). C) The saliva, which contains a range of COVID‐19 biomarkers including ACE2, adenosine deaminase, immunoglobulin G, immunoglobulin M, RNA and secretory immunoglobulin A is deposited onto an infrared transflection substrate and dried (10 mins). D) The spectra were acquired in triplicate (5 minutes) using a PerkinElmer Spectrum Two spectrometer with a modified PerkinElmer® reflective accessory optimized for transflection slides (insert). E) The spectra, which represent a chemical snapshot of the entire saliva chemistry, including COVID‐19 markers. F) A Monte Carlo double cross validation model is used to predict COVID‐19 based on spectral markers. G) The results are presented as PLS‐DA prediction plots and Receiver Operating Curves.
The presence of virions was confirmed by means of Transmission Electron Microscopy (TEM). TEM images clearly show spherical particles approximately 120 nm in diameter with multiple spikes forming the solar crown structure, characteristic of coronaviruses (Figure 2 A, B). [21] This is consistent with previously reported TEM images of SARS‐CoV. [22] Atomic Force Microscopy (AFM) confirmed the presence of spherical particles of approximately 120 nm in diameter, notably aggregated together in large clusters (Figure 2 C, D). Synchrotron‐FTIR spectra were collected from the individual clusters and the mean and second derivative spectrum calculated (Figure 2 E).
Figure 2.

AFM, TEM, synchrotron FTIR and Raman characterization of SARS‐CoV‐2 virus. A–E) A) TEM image of SARS‐CoV‐2 sample with single virion marked by black square. B) Magnification of the area marked by the black square in (A), showing a single SARS‐CoV‐2 particle with its characteristic morphological appearance. C) AFM height and D) AFM deflection images of SARS‐CoV‐2 sample, demonstrating multiple round structures. E) Synchrotron FTIR spectrum and its 2nd derivative transform with the most prominent bands marked. The bands are color‐coded as follows: lipids (blue), proteins (green) and nucleic acids (orange). F) Raman spectrum (532 nm) of SARS‐CoV‐2 virions (red) compared to spectrum of purified RNA (black) with labelled bands.
Numerous bands are observed, reflecting the main chemical constituents of the virion particles (Table S1). These include protein bands at 1657, 1547, 1517 cm−1 (from spike, envelope, membrane and nucleocapsid proteins) along with lipid bands at 1740, 1464, 1382 and 1341 cm−1 (from lipid bilayer surrounding the nucleocapsid). In particular, multiple bands associated with RNA are present, including 1690, 1235, 1124, 1089, 996, 967 and 934 cm−1. [23] Similar spectral profiles were acquired of single virions using AFM‐IR spectroscopy (Figure S1).
It is important to note that the spectra will have minor contributions from fixative and residual media attached to the virus particles. In particular, bands at 1235 cm−1 and 1092 cm−1 were assigned to residual paraformaldehyde, which polymerizes when 4 % formalin dries (Figure S2). Raman spectra of SARS‐CoV‐2 virions compared to purified RNA show nucleic acid markers at 1242, 1110, 782, 723 and 670 cm−1 and an RNA‐specific marker band at 807 cm−1 (Figure 2 F). Raman spectroscopy confirms the purity of the virion extraction and shows the very strong RNA bands that characterize this RNA rich virus. The bands between 800–700 cm−1 are unique identifiers for RNA as evidenced by the corresponding RNA spectrum, which matches perfectly to many bands in the virion particle spectrum. The lack of bands from media or fixative confirms the purity of the virions. The relative contribution of RNA bands to the Raman spectrum is very high, likely reflecting the very high content of RNA in SARS‐CoV‐2, which contains the largest genome RNA‐containing viruses. In pursuit of a high throughput tool for point‐of‐care diagnosis, we optimized a PerkinElmer Spectrum Two infrared spectrometer to perform transflection measurements using a modified reflection accessory for infrared reflective slides. A top plate was 3D printed to enable an aluminum slide holder to be slid along the mount so that the background spectrum and each sample deposit could be measured successively. To improve throughput, slides were mounted as low as possible in the top plate. The mirrors of the reflection accessory were adjusted so the 8 mm beam matched the size of the deposit and hence maximize the absorbance. The larger infrared beam spot enables more sample and consequently more virions to be detected in the saliva compared to ATR‐FTIR and Raman spectroscopy. Raman has the advantage of being able to measure aqueous samples. However, the diameter of laser beam (≈1 μm) results in fewer virions being detected compared to the infrared based approaches. Close up photographs of the accessory are found in the Supporting Information (Figure S3). The transflection approach resulted in greater absorbance compared to ATR and less noise (Figure 3) because more sample is being interrogated by the infrared beam and thus the ability to detect virions improved. Other advantages include the ability to batch dry samples; viral transmission is minimized by self‐collection of saliva with no swab contribution, the instrument does not need to be cleaned between measurements, and the slides can be easily stored for future analysis making the transflection approach more conducive to point‐of‐site testing and mass screening compared to ATR‐FTIR. To test directly the application of the infrared approach as a diagnostic for COVID‐19 infection, we recorded 171 infrared spectra of triplicate dried saliva deposits from 57 human donors presenting to the Royal Melbourne Hospital with COVID‐19 like symptoms (Table S2). Of these, 29 subjects tested positive with SARS‐CoV‐2 by RT‐qPCR and 28 tested negative. Figure 4 A shows the averaged spectra (4000–800 cm−1) for the positive and negative SARS‐CoV‐2 infected saliva samples along with the corresponding second derivative spectra. Some of the spectra show a small contribution from Viral Transport Medium (VTM), which has bands at 1578 cm−1, 1408 cm−1 and 1078 cm−1 (Figure S4). In addition to signatures from infectious agents, infrared spectra acquired from saliva will contain information from components including mucins, proline‐rich proteins, cystains, histatins, statherins, amylases, carbonic anhydrases, salivary peroxidases, lipids, carbohydrates and inorganic compounds including nitrate and thiocyanate. [24] Saliva spectra have a distinctive band from thiocyanate at 2059 cm−1 and strong bands from proteins at 3288 cm−1, 1658 cm−1 and 1549 cm−1 assigned to the amide A, amide I and II modes, respectively. The protein bands on average appear more intense in the positive samples compared to the negative samples. In general, the protein amount of saliva is relatively small compared to other biofluids like serum. [24a] Hence, the significant difference in protein levels between infected and uninfected samples would likely be from viral proteins associated with the virus or antibodies produced by the host. On average, the thiocyanate band appears slightly more intense in the negative samples. Interestingly, thiocyanate is converted by salivary peroxidases to hypothiocyanite (OSCN−1) and is a potent antibacterial agent in the mouth, however, these levels will also change in response to SCN−1 intake in food and smoking.[ 24b , 24c ] The bands at 1240 cm−1 and 1078 cm−1 are assigned to the phosphodiester groups associated with nucleic acids [23] and are more intense in the positive saliva samples indicating a contribution from viral RNA to this band. However, the 1078 cm−1 band could also have minor contributions from VTM. We first applied Principal Component Analysis (PCA) to investigate general trends in the spectral data. The modelling was performed in the phosphodiester region (1300–800 cm−1) on vector normalized second derivative spectra where each spectrum is the average of the three replicates (Source Data 1 and External Modelling S1). The 1300–800 cm−1 region was chosen because this is where many important RNA and glycoprotein marker bands are located and there is less interference from VTM. The PC1 vs. PC8 scores plot shows a general separation of infected and uninfected saliva sample spectra along PC1 with most negatives clustered in the lower left quadrant (Figure 4 B). The corresponding PC1 vector indicated a number of RNA bands highlighted in orange (1237, 1121, 1078 and 940 cm−1) distinguishing the positive from the negative samples (Figure 4 C). It should be noted that other bands including glycoproteins would also contribute to these bands in this region of the spectrum but the correlation with the averaged second derivative spectrum shown of virion particles in Figure 2 E indicates that the major contribution to the infected saliva spectra is from RNA.
Figure 3.

A) Comparison of transflection spectra recorded using a PerkinElmer Spectrum Two FT‐IR spectrometer by depositing and drying the saliva samples (5 volunteers in triplicate) directly onto the ATR internal reflection element (red) and using the new transfection accessory with infrared transflection slides. B) Signal‐to‐noise noise comparison between the two techniques showing standard deviation error bars for saliva spectra from the 5 volunteers.
Figure 4.

Patient modelling (A–E) A) FTIR averaged spectra (bottom) and corresponding second derivative transformed spectra (top) from 87 spectra from 29 COVID‐19 positive subjects (red) and 84 spectra from 28 COVID‐19 negative subjects (blue) with important bands labelled. B) Principal Component Analysis (PCA) scores plot showing PC1 (54 % explained variance) and PC8 (2 % explained variance) with each spectrum plotted as a single point in multidimensional space with red dots associated with positive and blue dots negative spectra. The red and blue shading shows the general separation of the positive from negative spectra, which occurs along the diagonal. C) PC1 and PC8 loading plots showing the important bands discriminating the positive from negative sample spectra along each PC. The positive scores are associated with negative loadings and vice versa because the modelling was based on the second derivative spectra. D) Receiver Operating Characteristic (ROC) Curve showing the false‐positive rate versus the true positive rate for the MCDCV model. E) Probability diagram showing the averaged sample spectra plotted as points in multi‐dimensional space. The threshold value of 0.6 is shown by the dotted line, which is optimized to minimize the number of false positives classified by the spectroscopic model. The error bars represent the standard deviation for the 50 randomized test and model sets.
Partial Least Squares‐Discriminant Analysis (PLS‐DA) was employed to create discrimination models to predict the positivity of the sample using first derivative spectra from the patient cohort (Source Data 2 and External Modelling S2). The methodology was evaluated using Monte Carlo Double Cross Validation (MCDCV) with 50 randomized test (30 %) and model sets (70 %) (Figure 5). The test spectra were averaged, and no test replicates were included in the model avoiding over optimistic modelling, the so‐called technical replicate trap. By randomizing both the test and model set ensures the most robust and unbiased way of testing the model's performance. Furthermore, by keeping the numbers of variables small and using only the 1300–900 cm−1 region further increases the robustness of the modelling because the more variables in the model, such as the variable amount of VTM in the sample, the more chance of finding spurious correlations. Figure 4 D shows the Receiver Operating area under the ROC of 0.90, which is excellent for a small sample cohort. The MCDCV modelling approach achieved a sensitivity of 93 % (27/29) and a specificity of 82 % (23/28) based on the selection of a threshold of 0.6, which was optimized to reduce the number of false‐positives (Figure 4 E).
Figure 5.
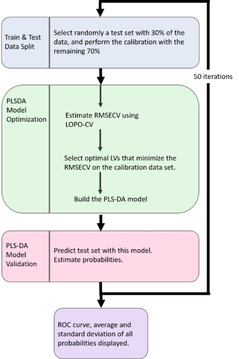
MCDCV flow chart showing model architecture with inner cross validation and outer prediction loops.
Conclusion
Here we report on a new transflection infrared based saliva test for COVID‐19. The results showed a 93 % sensitivity and 82 % specificity using the MCDCV modelling approach. Furthermore, we identified specific SARS‐CoV‐2 infrared and Raman marker bands from highly purified virions. To improve the sensitivity and specificity and determine if the technique has the specificity to distinguish SARS‐CoV‐2 from other respiratory viruses including influenza and other coronaviruses a larger patient cohort is required. RNA RT‐qPCR remains the “gold standard” diagnostic technique for SARS‐CoV‐2 infection. However, there is an urgent need for a point‐of‐care screening technique that could potentially triage subjects for specific RT‐qPCR testing. Such a tool would be extremely useful in the current pandemic enabling onsite screening at airports, sporting venues, universities and schools. An infrared based saliva test is logistically easier to perform, rapid, and minimizes the risk of transmission to health workers. Furthermore, self‐collection of saliva would reduce patient discomfort and improve community participation rates in testing.
Data and model availability: The datasets and model codes are available in the Zenodo repository (https://zenodo.org/record/4156646).
Conflict of interest
The authors declare no conflict of interest.
Supporting information
As a service to our authors and readers, this journal provides supporting information supplied by the authors. Such materials are peer reviewed and may be re‐organized for online delivery, but are not copy‐edited or typeset. Technical support issues arising from supporting information (other than missing files) should be addressed to the authors.
Supplementary
Supplementary
Acknowledgements
Mr. Finlay Shanks for instrumental support. Dr Emanuele Pedersoli for his assistance in graphic scripting. Funding: Part of this research was undertaken on the IRM beamline at Australian Synchrotron (Victoria, Australia), part of the Australian Nuclear Science and Technology Organisation (ANSTO). We acknowledge the support of the beamtime (Proposal ID. 16460 and 16476) provided by ANSTO, funded by the Australian Government. This work was in‐part funded by Monash Green Chemical Futures Special Project fund. Part of this work was funded by the A2 milk foundation. Instruments were loaned and modified for transflection infrared slides by Dr Jerry Sellors and Dr Robert Packer courtesy of PerkinElmer®. N.S.Q, S.G. and J.M. were supported by funds from the Jack Ma Foundation through a grant to D.P. and D.I.G. D.P. and D.I.G. were supported by the National Health and Medical Research Council of Australia (NHMRC), including a Senior Principal Research Fellowship (1117766) and the Australian Research Council CE140100011 for D.I.G. D.P.‐G. acknowledges the financial support from the 2019 Ramón y Cajal (RYC) Contracts Aids (RYC2019‐026556‐I).
B. R. Wood, K. Kochan, D. E. Bedolla, N. Salazar-Quiroz, S. L. Grimley, D. Perez-Guaita, M. J. Baker, J. Vongsvivut, M. J. Tobin, K. R. Bambery, D. Christensen, S. Pasricha, A. K. Eden, A. Mclean, S. Roy, J. A. Roberts, J. Druce, D. A. Williamson, J. McAuley, M. Catton, D. F. J. Purcell, D. I. Godfrey, P. Heraud, Angew. Chem. Int. Ed. 2021, 60, 17102.
Contributor Information
Prof. Bayden R. Wood, Email: bayden.wood@monash.edu.
Prof. Damian F. J. Purcell, Email: dfjp@unimelb.edu.au.
Prof. Dale I. Godfrey, Email: godfrey@unimelb.edu.au.
Dr. Philip Heraud, Email: prheraud@gmail.com.
References
- 1.World Health Organisation Coronavirus Disease (COVID-19) Dashboard, W.H.O., https://covid19.who.int/ 2020.
- 2. Czumbel L. M., Kiss S., Farkas N., Mandel I., Hegyi A., Nagy A., Lohinai Z., Szakacs Z., Hegyi P., Steward M. C., Varga G., Front. Med. 2020, 7, 465. [DOI] [PMC free article] [PubMed] [Google Scholar]
- 3. Walters W., Collins T., Evans A., Br. J. Oral Maxillofac. Surg. 2020, 58, e320–e322. [DOI] [PMC free article] [PubMed] [Google Scholar]
- 4. Ali F., Sweeney D. A., Clin. Infect. Dis. 2021, 72, e357–e358. [DOI] [PMC free article] [PubMed] [Google Scholar]
- 5. Williams E., Bond K., Zhang B., Putland M., Williamson D. A., J. Clin. Microbiol. 2020, 58, e00776-20. [DOI] [PMC free article] [PubMed] [Google Scholar]
- 6. Baker M. J., Trevisan J., Bassan P., Bhargava R., Butler H. J., Dorling K. M., Fielden P. R., Fogarty S. W., Fullwood N. J., Heys K. A., Hughes C., Lasch P., Martin-Hirsch P. L., Obinaju B., Sockalingum G. D., Sule-Suso J., Strong R. J., Walsh M. J., Wood B. R., Gardner P., Martin F. L., Nat. Protoc. 2014, 9, 1771–1791. [DOI] [PMC free article] [PubMed] [Google Scholar]
- 7. Heraud P., Chatchawal P., Wongwattanakul M., Tippayawat P., Doerig C., Jearanaikoon P., Perez-Guaita D., Wood B. R., Malar. J. 2019, 18, 348. [DOI] [PMC free article] [PubMed] [Google Scholar]
- 8. Roy S., Perez-Guaita D., Bowden S., Heraud P., Wood B. R., Clin. Spectrosc. 2019, 1, 100001. [Google Scholar]
- 9. Barauna V. G., Singh M. N., Barbosa L. L., Marcarini W. D., Vassallo P. F., Mill J. G., Ribeiro-Rodrigues R., Campos L. C. G., Warnke P. H., Martin F. L., Anal. Chem. 2021, 93, 2950–2958. [DOI] [PubMed] [Google Scholar]
- 10. Ke Z., Oton J., Qu K., Cortese M., Zila V., McKeane L., Nakane T., Zivanov J., Neufeldt C. J., Cerikan B., Lu J. M., Peukes J., Xiong X., Kräusslich H.-G., Scheres S. H. W., Bartenschlager R., Briggs J. A. G., Nature 2020, 588, 498–502. [DOI] [PMC free article] [PubMed] [Google Scholar]
- 11. Butler H. J., Brennan P. M., Cameron J. M., Finlayson D., Hegarty M. G., Jenkinson M. D., Palmer D. S., Smith B. R., Baker M. J., Nature 2019, 10, 565–576 . [DOI] [PMC free article] [PubMed] [Google Scholar]
- 12.
- 12a. Caixeta D. C., Aguiar E. M. G., Cardoso-Sousa L., Coelho L. M. D., Oliveira S. W., Espindola F. S., Raniero L., Crosara K. T. B., Baker M. J., Siqueira W. L., Sabino-Silva R., PLoS One 2020, 15, e0223461; [DOI] [PMC free article] [PubMed] [Google Scholar]
- 12b. Ferreira I. C. C., Aguiar E. M. G., Silva A. T. F., Santos L. L. D., Cardoso-Sousa L., Araujo T. G., Santos D. W., Goulart L. R., Sabino-Silva R., Maia Y. C. P., J. Oncol. 2020, 4343590; [DOI] [PMC free article] [PubMed] [Google Scholar]
- 12c. Maitra I., Morais C. L. M., Lima K. M. G., Ashton K. M., Date R. S., Martin F. L., Analyst 2019, 144, 7447–7456; [DOI] [PubMed] [Google Scholar]
- 12d. Paschotto D. R., Pupin B., Bhattacharjee T. T., Soares L. E. S., Anal. Sci. 2020, 36, 1059–1064. [DOI] [PubMed] [Google Scholar]
- 13.
- 13a. Munster V. J., Koopmans M., van Doremalen N., van Riel D., de Wit E., N. Engl. J. Med. 2020, 382, 692–694; [DOI] [PubMed] [Google Scholar]
- 13b. Harikrishnan P., J. Craniofac. Surg. 2020, 31, e653–e655. [DOI] [PMC free article] [PubMed] [Google Scholar]
- 14. Xu J., Li Y., Gan F., Du Y., Yao Y., J. Dent. Res. 2020, 99, 989. [DOI] [PubMed] [Google Scholar]
- 15. Wyllie A. L., Fournier J., Casanovas-Massana A., Campbell M., Tokuyama M., Vijayakumar P., Warren J. L., Geng B., Muenker M. C., Moore A. J., Vogels C. B. F., Petrone M. E., Ott I. M., Lu P., Venkataraman A., Lu-Culligan A., Klein J., Earnest R., Simonov M., Datta R., Handoko R., Naushad N., Sewanan L. R., Valdez J., White E. B., Lapidus S., Kalinich C. C., Jiang X., Kim D. J., Kudo E., Linehan M., Mao T., Moriyama M., Oh J. E., Park A., Silva J., Song E., Takahashi T., Taura M., Weizman O.-E., Wong P., Yang Y., Bermejo S., Odio C. D., Omer S. B., Dela Cruz C. S., Farhadian S., Martinello R. A., Iwasaki A., Grubaugh N. D., Ko A. I., N. Engl. J. Med. 2020, 383, 1283–1286. [DOI] [PMC free article] [PubMed] [Google Scholar]
- 16. Fernandes L. L., Pacheco V. B., Borges L., Athwal H. K., de Paula Eduardo F., Bezinelli L., Correa L., Jimenez M., Dame-Teixeira N., Lombaert I. M. A., Heller D., J. Dent. Res. 2020, 22034520960070. [DOI] [PubMed] [Google Scholar]
- 17. Peng M., Jie Y., Shi Q., Ying L., Zhu H., Zhu G., Ding X., He Z., Qin J., Wang J., Yan H., Bi X., Shen B., Wang D., Luo L., Zhao H., Zhang C., Lin Z., Hong L., Li J., SSRN Electron. J. 2020, 10.2139/ssrn.3541119. [DOI] [Google Scholar]
- 18. Nachtigall F. M., Pereira A., Trofymchuk O. S., Santos L. S., Nat. Biotechnol. 2020, 38, 1168–1173. [DOI] [PubMed] [Google Scholar]
- 19. Schwendicke F., Evid. Based Dent. 2020, 21, 62. [DOI] [PMC free article] [PubMed] [Google Scholar]
- 20.
- 20a. Caly L., Druce J., Roberts J., Bond K., Tran T., Kostecki R., Yoga Y., Naughton W., Taiaroa G., Seemann T., Schultz M. B., Howden B. P., Korman T. M., Lewin S. R., Williamson D. A., Catton M. G., Med. J. Aust. 2020, 212, 459–462; [DOI] [PMC free article] [PubMed] [Google Scholar]
- 20b. Lee J. Y. H., Best N., McAuley J., Porter J. L., Seemann T., Schultz M. B., Sait M., Orlando N., Mercoulia K., Ballard S. A., Druce J., Tran T., Catton M. G., Pryor M. J., Cui H. L., Luttick A., McDonald S., Greenhalgh A., Kwong J. C., Sherry N. L., Graham M., Hoang T., Herisse M., Pidot S. J., Williamson D. A., Howden B. P., Monk I. R., Stinear T. P., J. Med. Microbiol. 2020, 69, 1169–1178. [DOI] [PMC free article] [PubMed] [Google Scholar]
- 21.
- 21a. Masters P. S., Advances in Virus Research, Vol. 66, Academic Press, New York, 2006, pp. 193–292; [DOI] [PMC free article] [PubMed] [Google Scholar]
- 21b. Fehr A. R., Perlman S. in Coronaviruses: Methods and Protocols (Eds.: Maier H. J., Bickerton E., Britton P.), Springer New York, New York, 2015, pp. 1–23. [Google Scholar]
- 22. Goldsmith C. S., Tatti K. M., Ksiazek T. G., Rollin P. E., Comer J. A., Lee W. W., Rota P. A., Bankamp B., Bellini W. J., Zaki S. R., Emerging Infect. Dis. 2004, 10, 320–326. [DOI] [PMC free article] [PubMed] [Google Scholar]
- 23. Wood B. R., Chem. Soc. Rev. 2016, 45, 1980–1998. [DOI] [PubMed] [Google Scholar]
- 24.
- 24a. Schultz C. P., Ahmed M. K., Dawes C., Mantsch H. H., Anal. Biochem. 1996, 240, 7–12; [DOI] [PubMed] [Google Scholar]
- 24b. Pruitt K. M., Mansson-Rahemtulla B., Baldone D. C., Rahemtulla F., Biochemistry 1988, 27, 240–245; [DOI] [PubMed] [Google Scholar]
- 24c. Tenovuo J., Pruitt K. M., J. Oral Pathol. 1984, 13, 573–584. [DOI] [PubMed] [Google Scholar]
Associated Data
This section collects any data citations, data availability statements, or supplementary materials included in this article.
Supplementary Materials
As a service to our authors and readers, this journal provides supporting information supplied by the authors. Such materials are peer reviewed and may be re‐organized for online delivery, but are not copy‐edited or typeset. Technical support issues arising from supporting information (other than missing files) should be addressed to the authors.
Supplementary
Supplementary