

Abstract

Compared to conventional reservoirs, only a few studies were carried out on the heterogeneity of unconventional tight sandstone reservoirs. This paper focuses on the Upper Paleozoic tight gas sandstone reservoir in the southeast of the Ordos Basin. The reservoir heterogeneity is studied through thin section and scanning electron microscope observations, cathode luminescence, mercury intrusion, and logging data analysis. The results show that the dissolution pore and microfracture is the dominant pathway for the migration of natural gas. The distribution of gas and water within the sand body is affected by the rhythmic change of sandstone, and this rhythmicity is variable with the changing of particle size. It shows “water wrapping gas” for the positive rhythm, “gas wrapping water” for the reverse rhythm, and both of these features for the compound rhythm. Interlayers act as a cap rock or carrier bed on gas distribution. Along with the variation of breakthrough pressure of the interlayer and saturation pressure of the reservoir, the single sand body shows different distribution features of gas and water. The vertical differentiation of natural gas is caused by the barrier layer, and the more barrier layers exist, the worse the capacity of the reservoir to store natural gas. However, the existence of the barrier layer will make the reservoir close to the source area to be the favorable zone for oil and gas accumulation. In this study, the relationship between heterogeneity and gas as well as water distribution of tight sandstone is identified, which can provide guidance to the exploration and exploitation of tight gas in the future.
1. Introduction
The heterogeneity of reservoirs refers to the vertical non-uniformity of lithology, physical property, and rhythmicity in the early studies.1 Pettijohn classified the heterogeneity into macroscopic and microscopic aspects.2 Weber discussed the factors influencing the reservoir heterogeneity from the distribution features of the structure, interlayer, and barrier layer.3 Miall studied the heterogeneity of reservoirs from two classifications,4 that is, the ancient and present fluvial deposits. Qiu et al. divided reservoir heterogeneity into three types of interlayer, plane, and pore space, which is widely used in the relevant research of the petroleum system in China.5 In the quantitative analysis of reservoir heterogeneity, the variation, dart, and contrast coefficients of permeability are commonly used as typical parameters.6−8
In recent years, with the in-depth study of the hydrocarbon accumulation mechanism, there are more and more research works on the influence of reservoir heterogeneity on oil and gas accumulation, which were mainly from two perspectives of microscopic and macroscopic levels. At the microscopic aspect, the relation of heterogeneity and hydrocarbon accumulation was discussed by using an experimental method and numerical simulation, data analysis on the pore structure, contrast coefficient of permeability, and cement.9−14 While at the macroscopic level, rhythmicity, interlayers, microfractures, and barrier layers of sand bodies were the major factors for analyzing the effect of heterogeneity on oil and gas distribution.5,15−19
The Upper Paleozoic in the Ordos Basin developed multiple sets of gas-bearing sand bodies, and the heterogeneity of which was studied through feature description and quantitative analysis.20 According to the controlling factors of heterogeneity on the Permian reservoir in the Tabamiao area of Ordos Basin, Keyong et al. found that the reservoir heterogeneity was resulted from combined effects of sedimentation,21 diagenesis, and tectonism. Sedimentation determined the in-layer heterogeneity, while diagenesis controlled the microscopic heterogeneity. Anqing et al. discovered that the rhythmicity and heterogeneity of reservoirs have good consistency according to the genetic model of reservoir heterogeneity of the 8th He Section (P2h8) in the Yulin–Mizhi area of the Ordos Basin.22 Tian et al. revealed that the heterogeneity of the reservoir sand body was closely related to sedimentation by studying the heterogeneity features of the Upper Paleozoic reservoir in the Gaoqiao area.23 Previous studies are all aimed at conventional reservoirs, but the unique heterogeneity characteristics of tight sandstone, especially the migration features of natural gas in tight sandstone, are rarely mentioned. This paper focuses on the tight gas reservoir of Upper Paleozoic in the southeast of the Ordos Basin. The reservoir heterogeneity is studied through thin section and scanning electron microscope observations, cathode luminescence, mercury intrusion, and logging data analysis. In addition, the relationship between heterogeneity and gas along with the water distribution of tight sandstone is identified. This research can provide guidance for the exploration and exploitation of tight gas in the future.
2. Geological Background
The research area is located at the Yan’an City and Yulin City of Shannxi Province in China, with an exploration area of 2.6 × 10⁴ km2 (Figure 1).24,25 It belongs to the southeastern part of the Yishan Slope of the Ordos Basin according to the regional tectonics.26 Since the first exploratory well in 2003, the research area has been under exploration for many years and attracted tremendous attention. Till the end of 2017, the proved reserve of natural gas in this area was over 5 × 10¹² m3 (Yanchang Oilfield Company). Under the influence of sedimentary and tectonic evolution from the whole Ordos Basin,27−33 the Upper Paleozoic in the research area mainly developed Upper Permian Shiqianfeng Formation, Middle Permian Shihezi Formation, Lower Permian Shanxi and Taiyuan Formations, and Upper Carboniferous Benxi Formation, while Silurian, Devonian, and Lower Carboniferous were uplifted and eroded.34,35 The major gas-bearing section are in the Permian Shihezi Formation, as well as the first (P1s1) and second (P1s2) Shan sections of Shanxi Formation where delta front sedimentation developed, and also the Carboniferous Benxi Formation where the barrier island–tidal flat–lagoon sedimentation developed. The tight sandstone in the research area has experienced strong diagenesis such as compaction, pressure solution, cementation, and metasomatism due to the effect of tectonism and the sedimentary environment.36 The reservoir is characterized by the average porosity and permeability lower than 10% and 1 × 10⁻³ μm2, respectively, which belongs to the typical tight sandstone reservoir.
Figure 1.

Tectonic units and location of research area in the Ordos Basin.
3. Results
3.1. Microscopic Characteristics of Reservoir Heterogeneity
3.1.1. Petrologic Feature of Reservoirs
The reservoir capacity of sandstone is directly affected by its mineral composition, pore structure, and physical property.37 Based on the observation of field outcrops and sections, analysis of rock sample thin sections and injecting thin sections, cathode luminescence, and scanning electron microscope observation from 60 wells, combined with the data statistics of physical properties of 4311 samples from 213 wells in the research area, the reservoir structure and features of four major tight gas layers in the research area are described in this paper.
The statistics display that the lithology of tight sandstone is mainly quartzarenite, sublitharenite, and litharenite from Shihezi Formation to Benxi Formation, while that for P2h8 and P1s1 is mainly quartzarenite and sublitharenite (Figure 2).38 The sorting and roundness are both good, and the particle size is generally medium to coarse with the diameter between 0.3 and 1.2 mm. The P1s2 mainly developed quartzarenite and sublitharenite (Figure 2). The sorting and roundness are also good but with a smaller particle size (diameter is 0.25–1.0 mm). The Benxi Formation has a more mature sandstone structure and composition because the shore and shallow sea sedimentary environments provided long time wave washing. The lithology is mainly quartzarenite, sublitharenite, and litharenite with a similar particle size (diameter is of 0.25–1.0 mm) to that in the P1s2 (Figure 2).
Figure 2.

Ternary diagram of sandstone detrital grain compositions.
3.1.2. Microscopic Feature of the Pore Throat
The difference of pore throat system causes the variation of capillary pressure curve and permeability.33 Among the several ways of describing pore structure, the mercury intrusion method is more commonly used. According to the results of 173 samples, the displacement pressure is highest in the P1s1, followed by the P1s2, and lowest in the P2h8 and Benxi Formation (Table 1). The median throat radius is smaller than 1 μm, lowest in the P1s1 and P2h8 while highest in the Benxi Formation. The sorting coefficient of P1s1 and P1s2 is the best, followed by P2h8 and Benxi Formation. All the four sets of reservoirs have the skewness coefficient of pore throat higher than 1, and the overall mercury removal efficiency is high. Generally, the P2h8 and Benxi Formation have better pore structures. Through thin section observation, it can be seen that the original intergranular, intragranular dissolution, and intercrystalline pores are the main types of tight sandstone samples in Shihezi, Shanxi, and Benxi Formation (Figure 3). The original intergranular pores are chiefly irregular polygonal shaped and developed in samples of all three formations (Figure 3a,c). The intragranular dissolution pores are mainly narrow and fine pores of detrital minerals and fragments (Figure 3a,b,d,e). In addition, the intercrystalline pore of kaolinite is commonly developed in the tight sandstone samples of the study area, which constitute the mainstay of micropores of the pore space (Figure 3d–f). Meanwhile, the quartz overgrowth and the ferro-calcite as well as calcite cements are found in the samples, which lead to the reservoir densification to a certain extent (Figure 3g,h). Occasionally, the contact between detrital grains is a suture line, which reveal the tight sandstone diagenetic background of deep burial (Figure 3i).
Table 1. Capillary Pressure Curve Parameters of Reservoir in the Southeast of the Ordos Basina.
| strata | sample quantity | displacement pressure (MPa) | throat median radius (μm) | sorting | skewness | mercury withdrawal efficiency (%) |
|---|---|---|---|---|---|---|
| P2h8 | 143 |  |
 |
 |
 |
 |
| P1s1 | 111 |  |
 |
 |
 |
 |
| P1s2 | 190 |  |
 |
 |
 |
 |
| C2b | 103 |  |
 |
 |
 |
 |
Data are presented as  .
.
Figure 3.

Microscopic characteristics of the Upper Paleozoic tight gas sandstone in the southeast of the Ordos Basin. (A) Original intergranular pore (yellow arrow) and intragranular dissolution pore (red arrow), Benxi Formation, plane-polarized light (PPL); (B) intragranular dissolution pore (yellow arrow), P1s1 of Shanxi Formation, PPL; (C) original intergranular pore (yellow arrow), P2h8 of Shihezi Formation, PPL; (D) intergranular and intragranular dissolution pores of tuffaceous fragments (green arrow) as well as the intercrystalline pore of kaolinite (yellow arrow), P2h8 of Shihezi Formation, PPL; (E) intragranular dissolution pore of fragments (green arrow) and kaolinite transformed from fragment alteration (yellow arrow), P2h8 of Shihezi Formation, PPL; (F) intercrystalline pore of kaolinite (yellow arrow), Benxi Formation, PPL; (G) the original intergranular pore is compressed by the quartz overgrowth (yellow arrow), P1s1 of Shanxi Formation, PPL; (H) calcite (yellow arrow) and ferro-calcite cements (blue arrow) make the reservoir tight, P1s2 of Shanxi Formation, PPL; (I) the detrital grains are in suture contact, indicating pressure dissolution, P2h8 of Shihezi Formation, crossed-polarized light (CPL).
3.1.3. Physical Properties of Tight Sandstone Reservoirs
Although the Upper Paleozoic gas reservoirs in the southeast of the Ordos Basin has a giant range of permeability with the difference as big as five orders magnitude, they belong to typical tight sandstone reservoirs because the porosity and permeability are generally lower than 10% and 1 × 10⁻³ μm2, respectively (Table 2). The permeability is obviously high in some areas or some layers due to the existence of microfractures. Some areas show higher porosity but low permeability because of the intergranular pores and intense dissolution. The porosity of these four gas layers decreases with the increase of the depth, which is related to the enhanced compaction. The permeability of P1s2 is higher than that of the other three gas layers, resulting from the well-developed microfractures.
Table 2. Thickness, Porosity, and Permeability of Reservoir in the Southeast of the Ordos Basina.
| reservoir beds | thickness (m) | porosity (%) | permeability (×10–3 μm2) |
|---|---|---|---|
| P2h8 |  |
 |
 |
| P1s1 |  |
 |
 |
| P1s2 |  |
 |
 |
| C2b |  |
 |
 |
Data are presented as  .
.
3.2. Macroscopic Characteristics of Reservoir Heterogeneity
3.2.1. In-Layer Heterogeneity
The study on in-layer heterogeneity includes rhythmicity of particle size, sedimentary structure, and distribution frequency of in-layer discontinuous muddy interlayers.39 The in-layer heterogeneity is mainly controlled by sedimentation and can be quantitatively characterized by relevant parameters.23
-
(i)
Rhythmicity feature of sand layers
In the research area, the sedimentary feature is alternant facies of delta and lake of Permian Shihezi Formation to the Shanxi Formation. The sedimentary micro-facies contain a distributary channel, inter-distributary bay, mouth bar, distal bar, and delta-front sheet sand. In the Late Carboniferous, the research area was in the marine sedimentary environment of the barrier island—tidal flat lagoon, with barrier sand bar, lagoon mud, and tidal sand flat as the major micro-facies. Due to the influence from the sedimentary environment, different sand bodies show different vertical rhythm features. According to the vertical variation of particle size and permeability of sand bodies, the Upper Paleozoic reservoir in the southeast of Ordos Basin are classified into three types, namely, positive, reverse, and compound rhythms.
Positive rhythm type: the physical properties become worse from bottom to top (Figure 4a,e). Though the single sand body has multiple interlayers, it shows superposition of several sand layers with the positive rhythm on the whole. This kind of rhythm was formed in the lateral aggradation environment, which was caused by the sideways movement of flow.40 The sand body usually shows bar and band shapes and is mainly from the lateral aggradation of the underwater distributary channel of the delta front and barrier islands.41 This rhythm mainly exists in the thin sand layer of the single sand body in the Benxi, Shihezi and Benxi Formations.
Reverse rhythm type: in contrast to the positive rhythm type reservoir, the physical properties become better from bottom to top (Figure 4b,d). It is commonly seen in the mouth bar and some crevasse splay sand bodies. The reverse rhythm mainly developed in the sedimentary environment with progradation. The wave in the open terrain and the slope area with increasing grade has a lower transporting capacity, so the fragments begin to deposit and move ahead. This kind of rhythm mainly occurs in the Shanxi Formation.
Compound rhythm type: alternative distribution of high and low permeability layers or positive and reverse rhythms vertically (Figure 4c,f). It is mainly developed in the sedimentary environments with vertical aggradation.42 The P2h8 in the research area was formed by the vertical superposition of sand bodies that deposited in the underwater distributary channel of the delta front, showing obvious compound rhythm vertically. The compound rhythm contains two forms: “reverse–positive compound rhythm” with the permeability of top and bottom of the sand body increases to the middle part (Figure 4c); “positive–reverse compound rhythm” with an opposite permeability feature (Figure 4f).
-
(ii)
Interlayer feature of the reservoir
Interlayer refers to the impervious thin layer that has little capacity in the sand body, such as the politic strip and band, calcareous interlayer, silty mudstone, and impervious layer caused by bioturbation.43 Through the statistics of interlayers within the major gas-bearing sections in the research area, it is found that the heterogeneity is the strongest in the P2h81 with the average interlayer density as 0.48, the weakest in the P1s23 with the average interlayer density as 0.24, and middle in the P1s1 and Benxi Formation with the average interlayer density about 0.34 (Table 3).
Figure 4.

Heterogeneity characteristics of Upper Paleozoic sand bodies with different superposition relations in the southeast of Ordos Basin. (a, e) Positive rhythm formed by lateral aggradation; (b, d) reverse rhythm formed by progradation; (c, f) compound rhythm formed by vertical aggradation.
Table 3. Interlayer Features of Reservoir in the Southeast of the Ordos Basina.
| strata | sand thickness (m) | interlayer thickness (m) | interlayer density |
|---|---|---|---|
| C2b |  |
 |
 |
| P1s23 |  |
 |
 |
| P1s11 |  |
 |
 |
| P1s12 |  |
 |
 |
| P1s13 |  |
 |
 |
| P2h82 |  |
 |
 |
| P2h81 |  |
 |
 |
Data are presented as  .
.
3.2.2 Interlayer Heterogeneity
The interlayer heterogeneity is the difference between sand bodies44 and contains the regularity, distribution, and development of mudstone interlayers within the sand body vertically. During Permian, the Ordos Basin developed terrestrial facies and was under lacustrine basin deposition with narrow distributary channels that changed position laterally several times, resulting in strong heterogeneity.45 The barrier layer and permeability is commonly used to describe the features of interlayer heterogeneity.
-
(i)
Features of the barrier layer
The barrier layer is the relatively impervious mudstone, siltstone, and gypsolyte that stably developed between layers, with the thickness from tens of centimeters to tens of meters. The sedimentary environment of Upper Paleozoic in the southeast of the Ordos Basin is mainly the delta and barrier island.41 The barrier layers in the research area were formed in the underwater distributary channel and inter-distributary bay and lagoon.46
Benxi Formation and P2h8 in the research area generally developed one set of the sand body or two sets in some areas but seldom multiple sets (Figure 1). Therefore, the barrier layer shows as one layer at most and is relatively thick (Table 4). The P1s1 has multiple sets of sand bodies vertically due to multiple transgressive and regressive progresses. According to the statistics and analysis in the Table 4, the gross thickness and quantity of barrier layers in the single well of the P1s1 are the highest among the four gas-bearing sections. In the P1s2, the sand body only occurs in the third subsection (P1s23, Figure 1) with more barrier layers. However, the thickness of each barrier layer is generally lower than 1 m because the lake water environment was relatively stable during the deposition period of P1s2. There are several thin barrier layers developed due to the frequent change of river channels.
-
(ii)
Heterogeneity of permeability between layers
So far, the quantitative characterization of permeability heterogeneity between layers is mostly based on four parameters: rush, range, variation, and uniformity coefficients.23Table 5 shows that the major Upper Paleozoic gas-bearing layers in the research area have strong heterogeneity. Based on the comprehensive analysis of rush, contrast, and uniformity coefficients, the P1s2 has a much stronger heterogeneity than the other three sections due to well-developed microfractures. The microfracture obviously improved the connectivity of reservoirs, causing much bigger permeability than the other layers that have few microfractures.47,48 In addition, the tight sandstone in P2h8 also has some microfractures but less than that of P1s2. On the basis of all the four parameters, the heterogeneity is the weakest in P1s1, secondary in the Benxi Formation, and strongest in P1s2.
Table 4. Barrier Layer Features of Reservoir in the Southeast of the Ordos Basin.
| strata | strata thickness (m) | average thickness of each barrier layer (m) | barrier layer gross thickness of single well (m) | barrier layer quantity of single well |
|---|---|---|---|---|
| P2h8 | 26.60 | 8.30 | 9.30 | 1.00 |
| P1s1 | 50.83 | 9.87 | 12.20 | 2.10 |
| P1s2 | 17.80 | 0.88 | 1.46 | 1.40 |
| C2b | 54.71 | 5.07 | 5.86 | 1.14 |
Table 5. Heterogeneity Parameters of Reservoir in the Southeast of the Ordos Basin.
| heterogeneity parameters | P2h8 | P1s1 | P1s2 | C2b |
|---|---|---|---|---|
| rush coefficient | 6.71 | 5.09 | 9.20 | 5.75 |
| range parameter | 373.28 | 204.33 | 1098.17 | 668.46 |
| uniformity parameter | 0.31 | 0.35 | 0.29 | 0.39 |
| variation coefficient | 1.25 | 1.05 | 1.10 | 1.35 |
4. Discussion
4.1. Natural Gas Migrates along Dissolution Pores and Microfractures First and then Preferentially Accumulates in the Area with Good Physical Properties
The microscopic accumulation pattern of natural gas is affected by the pore throat size of tight sandstone. When the pore throat size of tight sandstone is generally smaller than 0.25 μm, the migration pattern is mainly overpressure displacement that is caused by the thermal pressure boost of hydrocarbon generation.49 After primary migration, the hydrocarbon accumulates in the reservoir near the source rock and forms a local high pressure. Then, the gas began secondary migration within sand layers when this pressure was higher than capillary resistance (Figure 5). The relatively large pore space of tight sandstone formed by later reformation, such as microfractures and dissolution pores, has become a favorable area for natural gas migration and accumulation because its capillary resistance is far less than that of other primary pore-throat combinations.
Figure 5.

Migration patterns and preferential reservoir space of natural gas in the tight sandstone in the southeast of the Ordos Basin.
The reservoir spaces of the Upper Paleozoic tight sandstone gas reservoir in the southeast of the Ordos Basin contain a residual and dissolved intergranular pore, dissolved intragranular pore, dissolved interstitial material pore, inter-crystal pore of authigenic minerals, and microfractures.50 The median throat radius is 0.11–0.93 μm, while that of dissolved intergranular pore and microfracture is generally higher than 2.5 μm (Figure 5). At the beginning of hydrocarbon generation, the generated natural gas migrated into the nearest reservoir first. However, the throat radius of reservoir space was generally small and the displacement pressure was mostly higher than 0.51 MPa, so the natural gas in the sand body preferentially migrated along the dominant pathway, where the capillary resistance was low.
Taking the gas layers in the Benxi Formation and P1s2 for example, their gas-bearing capacity is quite different even though both of them are close to the source rock (Wang et al., 2014).The Benxi Formation is mainly composed of quartz sandstone with a large median throat radius and small displacement pressure. It has a higher maturity of structure and composition but lower gas-bearing capacity than the P1s2 because the latter one has a better developed dissolution pore (lower content of interstitial materials and higher porosity) and microfracture (permeability contrast is 1098.17, twice as high). The Permian coal seam, one major source rock in the Ordos Basin, began to generate hydrocarbon since Late Triassic and the hydrocarbon-generation potential gradually reduced with the overall uplift of the Ordos Basin till the end of Cretaceous.51 The generated natural gas charged into the P1s2 first and for a longer time than the Benxi Formation, so the P1s2 has better gas-bearing capacity. Therefore, the area with well-developed dissolution pore and microfracture has much higher gas saturation than the other areas, so as to be the “sweet spot” of the natural gas exploitation of the Ordos Basin.24
The natural gas in tight sandstone migrates along the dissolution pore and microfracture during primary migration with the migration agent as buoyancy. As the dominant migration pathway and the surrounding reservoir space become full, the natural gas began to charge into smaller pores with the major migration agent as thermal pressure boost that was caused by hydrocarbon generation.
4.2. Sand Rhythm Affects the Microscopic Distribution of Gas and Water in the Sand Body
The rhythmic sand layer reflects the vertical heterogeneity of the sand body. Different sedimentations result in different rhythms of sand layers and greatly affect the physical properties of reservoirs, thereby affecting the gas saturation.52
The rhythm of Upper Paleozoic sand bodies in the research area shows good consistency with the physical properties of tight sandstones (Figure 4). The physical properties decrease from bottom to top in the positive rhythmic sand body and increase in the reverse rhythm, while decrease or increase from top and bottom to middle in the compound rhythm. The physical properties of tight sandstone further affect the gas saturation. For the positive rhythmic sand body, the lower part has a larger pore and throat combination with the average porosity higher than 10%, permeability higher than 1 × 10⁻³ μm2, and throat diameter bigger than 0.5 μm, so the major driving force for migration is buoyancy.49,53 The natural gas migrates in the state of Darcy flow in the sand body, showing the feature of “water on the top and gas in the bottom”. For the transitional part in the middle of sand body, the throat diameter is 0.5–1 μm, the migration agent is buoyancy and the abnormally high pressure caused by continuous charging of natural gas. So, the natural gas migrates in the state of slipping flow,24,54 showing the feature of “gas on the top and water in the bottom”.
Generally speaking, the positive rhythmic sand body shows “water–gas–water–gas–water” from top to bottom under sufficient natural gas charging and “water–gas–water” under insufficient charging, and therefore has the feature of “water wrapping gas” (Figure 6).49,53 On the contrary, the reverse rhythmic sand body shows “gas–water–gas–water–gas” from top to bottom under sufficient charging and “gas–water–gas” under insufficient charging, showing the feature of “gas wrapping water” (Figure 6). The compound rhythmic sand body has the features of both the above two types, showing “water wrapping gas” in the positive-reverse rhythm and “gas wrapping water” in the reverse–positive rhythm. According to the actual exploration results, the gas-bearing capacity is better in the reverse–positive rhythm than the positive–reverse rhythm under the same natural gas charge condition.
Figure 6.

Effect of rhythm on the distribution of natural gas and formation water in the tight sandstone.
4.3. Interlayer Causes Difference of Gas-Bearing Capacity in the Single Sand Body
The interlayer plays a dual function on natural gas distribution: first, as the cap rock. It divides the sand body into multiple flow units. Second is as the carrier. Natural gas or formation water breaks through interlayer and flows along sand layer. Due to the different sedimentary environments of the Upper Paleozoic reservoir in the southeast of the Ordos Basin, the interlayers have different development levels. For the P1s2 that is the closest to source rock, the average thickness of sand body is 9.34 m, while that of interlayer is 2.12 m. The interlayer is mainly calcareous, and its breakthrough pressure is far bigger than the saturation pressure of the underlying sand layer. Because of the closeness to the source rock, the P1s2 was under millions of years of charging from Late Triassic to the end of Early Cretaceous, resulting in a pure gas layer and less water production. For the P2h8 on the top, the breakthrough pressure of the muddy interlayer is smaller than the saturation pressure of the reservoir, but it is far from the source rock and under insufficient gas charging, so the sand body shows a gas–water layer on the whole with a severe water production problem during the gas-production process.
The influence of the interlayer on gas and water distribution in the single sand body was analyzed by the physical simulation experiment, which was composed of three parts: injection equipment, collection equipment, and samples (Figure 7). The simulation experiment box is made of metal, and the front is made of tempered glass, so as to observe the distribution and migration of gas and water in real time. The whole box has good strength, sealing, and thermal performance. The experimental sand is pure white quartz sand with different grain sizes, and the experimental soil and gas is clay and nitrogen, respectively. The purity, density, and viscosity of gas is about 90%, 1.2504 kg/m3, and 0.01691 P, respectively. The samples used in this experiment were designed based on the characteristics of the reservoir and interlayer in the Upper Paleozoic of the research area, and the experiment was run under the NPT environment. In order to observe the migration pathway of gas and the distribution condition of water, the sand body under the interlayer was saturated with blue water, and the overlaying sand body was saturated with red water. The sand will turn white when gas passes through. The experiment was carried out at room temperature. A helium cylinder was used to inject gas into the experimental chamber. The initial inflation pressure was 10 MPa. The migration and accumulation changes were observed while filling, and the pressure was adjusted according to the gas injection situation.
Figure 7.

Schematic diagram of the interlayer experiment simulation device. (1) Injection equipment, (2) collection equipment, (3) interlayer, (4) sandbody saturated by blue water, and (5) sandbody saturated by red water.
The experimental results show that the movable water that was expelled from pores by natural gas charging cannot break through the interlayer when the breakthrough pressure of the interlayer (Pb) is higher than the saturation pressure of the underlying reservoir (Pr). So, the water can only flow laterally along the underlying sand layer, while the natural gas can only charge and migrate within the underlying sand layer. As the underlying sand layer is saturated with natural gas, the pore pressure increases with continuous charging of natural gas, which breaks through the interlayer and leading Pr > Pb and then migrates and accumulates into the overlying sand layer (Figure 8a). When Pr > Pb and the natural gas begins to charge, the pore water in the underlying sand layer close to the interlayer breaks through the interlayer and migrates into the overlying sand layer. With the continuous charging, the natural gas first reaches the interlayer through the dominant pathways, and then it will break through the interlayer and migrate to the overlaying sand layer (Figure 8b). What should be noted is that Figure 8 is the idealized gas water distribution pattern, which cannot exactly reflect the simulation experimental process. By comparing these two situations, the gas-bearing capacity of sand layers on the both sides of the interlayer has no obvious difference under a sufficient gas source. However, when the gas source is not sufficient, the gas-bearing capacity of the underlying sand layer is obviously better than that of the overlying interlayer for the Pb > Pr situation, so the single sand body shows a clear differentiation of gas and water on both sides of the interlayer; though there is gas-bearing capacity difference of sand layers for the Pr > Pb situation, the single sand body shows a gas–water layer on both sides of the interlayer.
Figure 8.
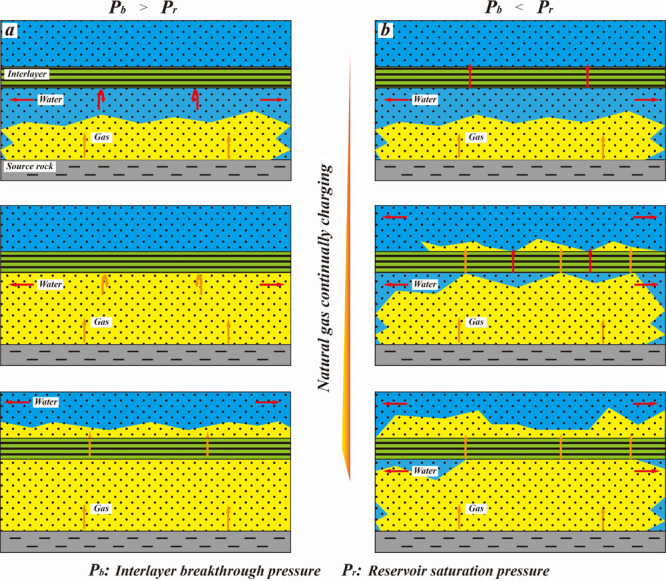
Two distribution patterns of natural gas and formation water that are caused by the interlayer in the tight sandstone. (a) Distribution pattern of natural gas and formation water in a Pb > Pr condition; (b) distribution pattern of natural gas and formation water in a Pb < Pr condition.
4.4. Barrier Layer Causes Vertical Difference of Natural Gas Distribution
Compared with interlayer, the barrier layer has larger thickness, worse trafficability, and wider distribution. The barrier layer causes the vertical differentiation of natural gas. When the microfracture is not developed, the existence of relatively more barrier layers between the reservoir and sand body will lead to a worse gas-bearing capacity. However, more barrier layers can help the reservoir close to the source rock become the favorable area for oil and gas accumulation.
The Upper Paleozoic of the southeast Ordos Basin has multiple combinations of the reservoir and cap rock, which is mainly in the form of interbedding. The relatively thicker mudstone layer overlies on the reservoir acts as the regional cap rock (Figure 1). Several mudstone barrier layers developed between the source rock and reservoir block the migration of natural gas, which makes the vertical differentiation of gas-bearing capacity of the target section in the study area obvious. For the gas layers of Benxi, Shanxi and Shihezi Formations, where the Upper Shihezi Formation as the regional cap rock, the gas-bearing capacity gradually reduces from P1s2 to the target layers due to the effect of multiple barrier layers from the coal seam source rock at the bottom of Shanxi Formation to other gas-bearing layers (Figure 1). There is an average of 3.5 barrier layers developed between the top gas layer of P2h8 and source rocks, with the average thickness of 22 m (Table 4). The accumulated diffusion and accumulation strength of natural gas in P2h8 is 0.68 × 10⁸ m3/km2, which is 85% of that in P1s2.The gas-bearing layers on the two sides of the regional cap rock also have obvious difference. For instance, the Shiqianfeng Formation overlying the cap rock has the average gas saturation of 13.6% even though it develops both the reservoir and cap rock. The secondary gas reservoir pool of the Shiqianfeng Formation only develop in the Shenmu–Mizhi area in the northeast of the Ordos Basin and the area around Shen 1 Well in the west because of the thinning or breaking of the cap rock.29 Those gas-bearing layers under the regional cap rock have much better gas-bearing capacity than the overlying layers, with the average gas saturation above 50%.
5. Conclusions
The tight sandstone reservoir mainly develops a small pore and throat, so the major driving force for gas migration is the thermal pressure boost caused by hydrocarbon generation, resulting in an episodic migration of natural gas in the sand body. The reservoir of which the pore structure was improved by dissolution pore and microfracture is the dominant pathway and favorable accumulation area of natural gas in the tight sandstone.
The rhythmicity and physical properties of tight sandstone show good consistency. The sand body shows a worse physical property trend from bottom to top for the positive rhythm, contrary feature for the reverse rhythm, and both of them for the compound rhythm. Under the effect of rhythmicity, the sand body shows “water wrapping gas” for the positive rhythm and “gas wrapping water” for the reverse rhythm. Moreover, it shows both features for the compound rhythm according to the changing characteristics of particle size, while the reverse–positive rhythm has better gas-bearing capacity than the positive–reverse rhythm.
The interlayer plays a dual function as the cap rock and carrier bed on the natural gas distribution in the tight sandstone. Under the effect of the interlayer, when the gas source is not sufficient, the sand body with Pb > Pr shows clear differentiation of gas and water on both sides of the interlayer, while that with Pr > Pb shows a gas–water layer on both sides.
The barrier layer causes the vertical differentiation of natural gas. When microfractures are not developed, more barrier layers between the sand body will lead to worse gas-bearing capacity. However, more barrier layers can help the reservoir, which is close to the source rock, become the favorable area for oil and gas accumulation.
Acknowledgments
The raw data in this study comes from Dr. Weili Wang, and the research is mainly based on his work. The authors gratefully acknowledge financial support from the College Innovation Ability Improvement Project of Gansu Province (no. 2019B-175) and the Research Foundation (no. LZCU-BS2019-02) of Lanzhou City University.
The authors declare no competing financial interest.
References
- Zhizhang W.; Zhanzhong S.. Modern Reservoir Descriprtion Technology; Oil Industry Press: Beijing, 1999; pp. 13–25. [Google Scholar]
- Pettijohn F. J.Sedimentary rocks; Harper: 1957. [Google Scholar]
- Weber K. J. Influence of Common Sedimentary Structures on Fluid Flow in Reservoir Models. J. Pet. Technol. 1982, 34, 665–672. 10.2118/9247-PA. [DOI] [Google Scholar]
- Miall A. D. Architectural-element analysis: A new method of facies analysis applied to fluvial deposits. Earth Sci. Rev. 1985, 22, 261–308. 10.1016/0012-8252(85)90001-7. [DOI] [Google Scholar]
- Qiu N.; Wan X.; Jin Z.; Zeng J.; Zhang S.; Jiang Z. Controlling model of permeability difference on the hydrocarbon accumulation of sand lens reservoirs. Pet. Explor. Dev. 2003, 30, 48–52. [Google Scholar]
- Shaochun Y. A new method for quantitatively studying reservoir heterogeneity. J.-Univ. Pet. China Nat. Sci. Ed. 2000, 24, 53–56. [Google Scholar]
- Yu C.; Lin C. Advancement of reservoir heterogeneity research. Pet. Geol. Recovery Effic. 2007, 14, 15–18. [Google Scholar]
- Mao L., Evaluation and Development tactics of Strong Heterogeneity Reservoir in L1 Segment of Weizhou 11-4N Oil Field; In China University of Petroleum: Beijing, 2010. [Google Scholar]
- England A. W.; Fleet A. J., Petroleum Migration; 1991.
- Rhea L.; Person M.; Marsily G. D.; Ledoux E.; Galli A. Geostatistical models of secondary oil migration within heterogeneous carrier beds: A theoretical example. AAPG Bull. 1994, 78, 1679–1691. [Google Scholar]
- Xiaorong L. T. L. The Inhomogeneity of Petroleum Migration in Clastic Carrier Beds [J]. Scientia Geologica Sinica 2001, 36, 402–413. [Google Scholar]
- dos Anjos S. M. C.; De Ros L. F.; Souza R. S. d.; de Assis Silva C. M.; Sombra C. L. Depositional and Diagenetic Controls on the Reservoir Quality of Lower Cretaceous Pendencia Sandstones, Potiguar Rift Basin, Brazil. AAPG Bull. 2000, 84, 1719. 10.1306/8626C375-173B-11D7-8645000102C1865D. [DOI] [Google Scholar]
- Jiang Z.; Li Z.; Li F.; Pang X.; Yang W.; Liu L. F.; Jiang F. J. Tight sandstone gas accumulation mechanism and development models. Pet. Sci. 2015, 12, 587–605. 10.1007/s12182-015-0061-6. [DOI] [Google Scholar]
- Liu Y.; Hu W.; Cao J.; Wang X.; Tang Q.; Wu H.; Kang X. Diagenetic constraints on the heterogeneity of tight sandstone reservoirs: A case study on the Upper Triassic Xujiahe Formation in the Sichuan Basin, southwest China. Mar. Pet. Geol. 2018, 92, 650–669. 10.1016/j.marpetgeo.2017.11.027. [DOI] [Google Scholar]
- Jianhui Z.; Zhijun J.. Physical Modeling of Oil and Gas Migration and Accumulation; In Oil Industry Press: Beijing, 2000, pp. 61–113. [Google Scholar]
- Wu S.; Zeng J.; Lin S.; Guo Y. Interlayer interference and differential ijection of hydrocarbon into a trap. Pet. Geol. Exp. 2003, 25, 285–289. [Google Scholar]
- Sahoo H.; Gani M.; Hampson G. J.; Gani N. D.; Ranson A. Facies- to sandbody-scale heterogeneity in a tight-gas fluvial reservoir analog: Blackhawk Formation, Wasatch Plateau, Utah, USA. Mar. Pet. Geol. 2016, 78, 48–69. 10.1016/j.marpetgeo.2016.02.005. [DOI] [Google Scholar]
- Ge X.; Fan Y.; Xiao Y.; Liu J.; Xing D.; Gu D.; Deng S. Quantitative evaluation of the heterogeneity for tight sand based on the nuclear magnetic resonance imaging. J. Nat. Gas Sci. Eng. 2017, 38, 74–80. 10.1016/j.jngse.2016.12.037. [DOI] [Google Scholar]
- Wang Y.; Liu L.; Cheng H. Gas Adsorption Characterization of Pore Structure of Organic-rich Shale: Insights into Contribution of Organic Matter to Shale Pore Network. Nat. Resour. Res. 2021, 30, 2377–2395. 10.1007/s11053-021-09817-5. [DOI] [Google Scholar]
- Liu P.; Wang X. F.; Li X. F.; Zhang T.; Du G. C.; Liu W. H. Competitive adsorption characteristics of CH4/C2H6 gas mixtures on model substances, coal and shale. Fuel 2020, 279, 9. 10.1016/j.fuel.2020.118038Get. [DOI] [Google Scholar]
- Keyong C.; Shaonan Z.; Yongzhang H. U.; Xiaoqi D. Heterogeneity and controlling factors of the Upper Paleozoic fragmental reservoir in Tabamiao, Ordos Basin, China. Journal of Chengdu University of Technology. Sci. Technol. Ed. 2007, 34, 273–276. [Google Scholar]
- Anqing C.; Hongde C.; Liangbiao L.. Genesis modes of heterogeneity of lithologic hydrocarbon reservoir: a case study in He8 member of Xiashihezi formation, Yulin-Mizhi area, Ordos Basin. Pet. Geol. Recovery Effic. 2010, 03. [Google Scholar]
- Tian J.; Liu W.; Wang F.; Chen R.; Lin X. Heterogeneity of the Paleozoic tight sandstone reservoirs in Gaoqiao Area of Ordos Basin. Oil Gas Geol. 2014, 35, 183–189. [Google Scholar]
- Wang W.; Wang W.; Yao J.; Cai Y. Tight gas reservoir accumulation conditions and distribution patterns during the Upper Palaeozoic of the East-central Ordos Basin, Central China. Energy Explor. Exploit. 2014, 32, 657–672. 10.1260/0144-5987.32.4.657. [DOI] [Google Scholar]
- Liu P.; Wang X. F.; Lin Y.; Liu C. J.; Li X. F.; Liu W. H. Chemical and carbon isotope fractionations of alkane gases desorbed from confined systems and the application toward shale gas reservoir. Mar. Pet. Geol. 2020, 113, 13. [Google Scholar]
- Guo R.; Zhao Y.; Wang W.; Hu X.; Zhou X.; Hao L.; Ma X.; Ma D.; Li S. Application of Rare-Earth Elements and Comparison to Molecular Markers in Oil-Source Correlation of Tight Oil: A Case Study of Chang 7 of the Upper Triassic Yanchang Formation in Longdong Area, Ordos Basin, China. ACS Omega 2020, 5, 22140–22156. 10.1021/acsomega.0c02233. [DOI] [PMC free article] [PubMed] [Google Scholar]
- Yang H.; Xi S.; Wei X.; Li Z. Evolution and natural gas enrichment of multi cycle superimposed basin in the Ordos Basin. China Pet. Explor. 2006, 1, 17–25. [Google Scholar]
- Wang D.; Fu J.; Lei Q.; Luo A.. Exploration technology and prospect of low permeability oil-gas field in Ordos Basin [J]. Lithologic Reservoirs 2007, 3. [Google Scholar]
- Li J.; Li D.; Yang D.; Ma S.. Exploration prospect of lithostratigraphic gas reservoirs in China [J]. Lithol. Reservoirs 2007, 4. [Google Scholar]
- Zhao L.; Xia X.; Dai J.; Hong F. Major factors controlling the enrichment of the upper Paleozoic natural gas in the Ordos basin. Exp. Pet. Geol. 2000, 22, 136–139. [Google Scholar]
- Xiaoli Z. Sedimentary facies evolution of Upper Palaeozoic formation in Ordos Basin. J. Earth Sci. Environ. 2005, 27, 26–37. [Google Scholar]
- Wang Y.; Liu L. F.; Cheng H. F. Pore structure of Triassic Yanchang mudstone, Ordos Basin: Insights into the impact of solvent extraction on porosity in lacustrine mudstone within the oil window. J. Pet. Sci. Eng. 2020, 195, 11. 10.1016/j.petrol.2020.107944Get. [DOI] [Google Scholar]
- Guo R.; Xie Q.; Qu X.; Chu M.; Li S.; Ma D.; Ma X. Fractal characteristics of pore-throat structure and permeability estimation of tight sandstone reservoirs: A case study of Chang 7 of the Upper Triassic Yanchang Formation in Longdong area, Ordos Basin, China. J. Pet. Sci. Eng. 2020, 184, 106555. 10.1016/j.petrol.2019.106555. [DOI] [Google Scholar]
- Wang H.; Zheng R.; Zhou Q.; Li F.; Wei Q.. Delta depositional system and sandbody distribution of the second member of Shanxi Formation in Changbei Gasfield, Ordos Basin [J]. Lithol. Reservoirs 2008, 2. [Google Scholar]
- Zhao M.; Behr H. J.; Ahrendt H.; Wemmer K.; Ren Z.; Zhao Z. Thermal and tectonic history of the Ordos Basin, China: evidence from apatite fission track analysis, vitrinite reflectance, and K-Ar dating. AAPG Bull. 1996, 80, 1110–1133. [Google Scholar]
- Zhang L.; Bai G.; Luo X.; Ma X.; Chen M.; Wu M.; Yang W. Diagenetic history of tight sandstones and gas entrapment in the Yulin Gas Field in the central area of the Ordos Basin, China. Mar. Pet. Geol. 2009, 26, 974–989. 10.1016/j.marpetgeo.2008.05.003. [DOI] [Google Scholar]
- Wang Y.; Bao Z.; Li Y. Pore evolution and controlling factors in reservoirs of palaeogene in west depression. J.- Daqing Pet. Inst. 2008, 32, 9. [Google Scholar]
- Folk R. L., Petrology and sedimentary rocks; Petrology of the sedimentary rocks: 1974. [Google Scholar]
- Bianjun L.; Bin L.; Shilin L. Diagenesis of tight standstone and the influence on reservoir. J. Southwest Pet. Univ.: Sci. Technol. Ed. 2008, 30, 57–61. [Google Scholar]
- Yang S. S.; Huang X. R.; Yin C.; Xu Y. Q.; Zhao Y. G.; Yan J. Intra-layer heterogeneity of sandstone with different origins in deep-water environment and its causes. Sust. Comput. 2019, 21, 10–18. [Google Scholar]
- Jungang P.; Wenhou L. I.; Youyun Y.; Yanqin G. U. O. Features Of Upper Paleozoic Depositional System In Zizhou Region, Ordos Basin. Nat. Gas Ind. 2007, 27, 58–61. [Google Scholar]
- Chen D.; Wang F.; Chen H.; Wei X.; Sun S.; Zhu S. Characterization of braided river reservoir architecture of the Upper Paleozoic He 8 member on Fugu Tianshengqiao outcrop,eastern Ordos Basin. Oil Gas Geol. 2019, 40, 335–345. [Google Scholar]
- Zhang Z.; Shi H.; Yang K.; Wei L.; Zhou W.; Ge Z. Application of Interlayer Controlling Gas Accumulation in Tight Sandstone Gas Reservoir: A Case of Xujiahe Formation Gas Reservoir in Dayi, West Sichuan Basin. Nat. Gas Geosci. 2012, 26, 493–500. [Google Scholar]
- Yuhong X.; Zhihong C.; Dianyuan C. Research on evaluation technology of gas-bearing reservoir anistropy and its application. Geophys. Prospect. Pet. 2007, 46, 353. [Google Scholar]
- Xiafei Z. Fluvial Facies Model and Heterogeneity of Fluvial Reservoirs. J.l Chengdu Univ. Technol. (Sci. Technol. Ed.) 1999, 26, 357–364. [Google Scholar]
- Zheng W.; Hu X.; Chen S.; Liu J.; Jia C. Characteristics of Sedimentary Evolution in the Upper Paleozoic, Daniudi Gasfield,Ordos Basin. Acta Sedimentol. Sin. 2015, 33, 306–313. [Google Scholar]
- Zeng L.; Jiang J.; Yang Y. Fractures in the low porosity and ultra-low permeability glutenite reservoirs: A case study of the late Eocene Hetaoyuan formation in the Anpeng Oilfield, Nanxiang Basin, China. Mar. Pet. Geol. 2010, 27, 1642–1650. 10.1016/j.marpetgeo.2010.03.009. [DOI] [Google Scholar]
- Zhu P.; Lin C.; Ren H.; Zhao Z.; Zhang H. Micro-fracture characteristics of tight sandstone reservoirs and its evaluation by capillary pressure curves: A case study of Permian sandstones in Ordos Basin, China. J. Nat. Gas Sci. Eng. 2015, 27, 90–97. 10.1016/j.jngse.2015.08.038. [DOI] [Google Scholar]
- Guo Q.; Chen N.; Hu J.; Xie H.; Yan W.; Gao R. Geo-model of tight sandstone gas accumulation and quantitative Simulation. Nat. Gas Geosci. 2012, 23, 199–207. [Google Scholar]
- Weili W.; Hairen G. Geologic characteristics and controlling factors of tight sand reservoir in the mid-eastern Ordos Basin. Lithol. Reservoirs 2013, 25, 71–77. [Google Scholar]
- Gao H.; Wang W. The newly discovered Yanchang gas field in the Ordos Basin, central China. J. Earth Sci. 2017, 28, 347–357. 10.1007/s12583-015-0661-5. [DOI] [Google Scholar]
- Feng H.; Jiang L.; Jiaqing H. Analysis of the oil/gas-bearing possibility and causes of heterogeneity of oil and gas reservoirs. Nat. Gas Geosci. 2015, 26, 608–615. [Google Scholar]
- Zou C.; Zhang G.; Yang Z.; Tao S.; Hou L.; Zhu R.; Yuan X.; Ran Q.; Li D.; Wang Z. Geological concepts, characteristics, resource potential and key techniques of unconventional hydrocarbon: On unconventional petroleum geology. Pet. Explor. Dev. 2013, 40, 385–399. [Google Scholar]
- Zhiqiang D.; Ping F.; Qingdong H.; Zhiheng L.; Yuqi B. Laboratory Investigation of Gas Slippage Mechanism in Low-Tight Sandstones. Fault-Block Oil Gas Field 2017, 24, 378–381. [Google Scholar]