

Abstract
Bitter taste receptors (TAS2Rs) and their signaling elements are detected throughout the body, and bitter tastants induce a wide variety of biological responses in tissues and organs outside the mouth. However, the roles of TAS2Rs in these responses remain to be tested and established genetically. Here we employed the CRISPR/Cas9 gene-editing technique to delete three bitter taste receptors-Tas2r143/Tas2r135/Tas2r126 (i.e., Tas2r TKO) in mice. The fidelity and effectiveness of the Tas2r deletions were validated genetically at DNA and mRNA levels and functionally based on the tasting of TAS2R135 and TAS2R126 agonists. Bitter tastants are known to relax airways completely. However, TAS2R135 or TAS2R126 agonists either failed to induce relaxation of pre-contracted airways in wild type mice and Tas2r TKO mice or relaxed them dose-dependently, but to the same extent in both types of mice. These results indicate that TAS2Rs are not required for bitter tastant-induced bronchodilation. The Tas2r TKO mice also provide a valuable model to resolve whether TAS2Rs mediate bitter tastant-induced responses in many other extraoral tissues.
Keywords: Bitter taste receptor, CRISPR/Cas9, Tas2r143/Tas2r135/Tas2r126 cluster, Bronchodilation, Lung slice
1 |. INTRODUCTION
Living organisms have evolved complex and multimodal systems to sense external and internal environmental cues and respond accordingly. Bitter taste, one of five basic taste qualities, is one essential component of the complicated sensing systems. Primarily this taste quality guides organisms to avoid harmful toxins and noxious substances and is critical to animal and human survival. In higher vertebrates and mammals (Chandrashekar et al., 2000; Mueller et al., 2005; Wong, Gannon, & Margolskee, 1996), bitter sensation initiates in specialized epithelial cells in the taste buds of the tongue when bitter tastants bind with type II taste receptors (TAS2Rs), a type-A G protein-coupled receptor. Activation of TAS2Rs induces a gustatory G protein to dissociate and release α-gustducin (GNAT3) and β/γ subunits. The latter subsequently triggers the phospholipase Cβ2 (PLCβ2)-inositol 1,4,5-trisphosphate receptor (IP3R)-Ca2+ release cascade, leading to a rise in cytosolic Ca2+, which in turn activates transient receptor potential cation channel subfamily M member 5 (TRPM5). The influx of Na+ via the TRPM5 channel turns on voltage-dependent sodium channels depolarizing the membrane and causing a release of adenosine triphosphate (ATP) through calcium homeostasis modulators 1 and 3 (Finger et al., 2005; Huang & Roper, 2010; Taruno et al., 2013; Ma et al., 2018). ATP finally acts on ionotropic purinergic receptors (P2X2 and P2X3) on gustatory afferent nerves, which carry impulses to the primary gustatory cortex, and bitterness is perceived (Peng et al., 2015).
The aforementioned bitter taste signaling was initially thought to function only in the oral cavity for bitter perception. However, over the last two and a half decades, this canonical bitter taste signaling pathway has been increasingly detected in cells, tissues, or organs outside the oral cavity. For example, multiple elements of the bitter taste signaling cascade are expressed in the gastrointestinal tract (Hofer, Puschel, & Drenckhahn, 1996; Janssen et al., 2011; Kaji, Karaki, Fukami, Terasaki, & Kuwahara, 2009; Luo et al., 2019; S. V. Wu et al., 2002), respiratory system (Deshpande et al., 2010; Shah, Ben-Shahar, Moninger, Kline, & Welsh, 2009; C.-H. Zhang et al., 2013), cardiovascular system (Foster et al., 2013), urogenital organs (Deckmann et al., 2014; X. Liu, Gu, Jiang, Chen, & Li, 2015; Rajkumar, Aisenberg, Acres, Protzko, & Pluznick, 2014; K. Zheng et al., 2017), brain (Dehkordi et al., 2012; Duarte et al., 2020; Garcia-Esparcia et al., 2013; Singh, Vrontakis, Parkinson, & Chelikani, 2011), sperm (Governini et al., 2020; Xu, Cao, Iguchi, Riethmacher, & Huang, 2013), adipocytes (Avau et al., 2015), immune cells (Grassin-Delyle et al., 2019; Malki et al., 2015; Tran, Herz, Ruf, Stetter, & Lamy, 2018), and endocrine cells (Tran et al., 2018). Moreover, bitter tastants can initiate a vast array of diverse biological functions, including innate and type 2 immune responses (Howitt et al., 2016; Lee et al., 2012; von Moltke, Ji, Liang, & Locksley, 2016), hormone secretion (Tran et al., 2018), muscle contraction, and relaxation (Deshpande et al., 2010; Manson et al., 2014; C.-H. Zhang et al., 2013), cilia beating (Shah et al., 2009), and urination reflex (Deckmann et al., 2014). Some of the activities initiated by bitter tastants are markedly reduced in gnat3 knockout and Trpm5 knockout mice (Cui et al., 2019; Hollenhorst et al., 2020; Howitt et al., 2016; X. Zheng et al., 2019), highlighting the potentially pivotal roles of the bitter taste signaling cascade in mediating bitter tastant-induced responses. This possibility is further substantiated by the finding that the expression of some Tas2rs is either up-regulated or down-regulated upon different stressor stimuli such as viral infection and food starvation and that people with TAS2R mutations are prone to chronic sinusitis, asthma, and cancers (Choi & Kim, 2019; Dotson, Wallace, Bartoshuk, & Logan, 2012; Foster et al., 2013; Lee et al., 2012; Martin et al., 2019; Orsmark-Pietras et al., 2013; Quinton et al., 2012; Schembre, Cheng, Wilkens, Albright, & Marchand le, 2013; Yamaki et al., 2017). Therefore, the bitter taste signaling is required for bitter perception and may also initiate many diverse biological functions outside the oral cavity.
However, whether TAS2Rs actually do participate in any functions of these systems has yet to be genetically established. To date, their roles are mainly inferred from non-specific TAS2R agonists or the knockout of TAS2R downstream elements such as GNAT3 and TRPM5. As a result, it remains uncertain whether bitter tastants activate TAS2Rs to produce different biological responses in extraoral systems. To address this fundamental question, we took a genetic approach to delete TAS2Rs in mice and study the physiological consequence of this in airway smooth muscle. We focus on the airway smooth muscle for at least two reasons. First, bitter tastants paradoxically relax pre-contracted airway smooth muscle (Deshpande et al., 2010; C.-H. Zhang et al., 2013). In principle, activation of the canonical TAS2R signaling cascade by bitter tastants raises cytosolic Ca2+, which in turn should cause airway smooth muscle contraction. It is thus of biological significance to understand the molecular mechanism underlying this paradoxical relaxation. Second, bitter tastants relax airways more completely than current commonly used bronchodilators for asthma (An et al., 2012; Deshpande et al., 2010; Pulkkinen, Manson, Safholm, Adner, & Dahlen, 2012; Tan & Sanderson, 2014; C.-H. Zhang et al., 2013). This effective response has motivated developing TAS2R agonists as bronchodilators for managing asthma and chronic obstructive pulmonary disease. Hence it is paramount to determine whether TAS2Rs are the targets of bitter tastants in airway smooth muscle.
To achieve our objectives, we first determined the expression of the Tas2r gene family in mouse airways and lungs. Of 35 mouse Tas2rs, we found nine transcripts (Tas2r108, 117, 119, 126, 135, 136, 137, 138, and 143) in the airways and four (Tas2r126, 135, 137 and 143) in the lungs. As Tas2r126, 135, and 143 form a cluster without any other genes in between them in the mouse genome, we designed a unique set of sgRNAs targeting each of them and successfully deleted all of them at once (i.e., Tas2r TKO) with CRISPR/Cas9 gene-editing technology. Tas2r TKO mice have an impaired ability to avoid the ligands of TAS2R135 or TAS2R126 that are currently available, confirming the deletion of these Tas2rs functionally. However, surprisingly, TAS2R135 and TAS2R126 ligands either failed to relax airways or generated the relaxation independently of whether TAS2R143, TAS2R135, and TAS2R126 were deleted. These unexpected results question the involvement of TAS2Rs in bitter tastant-induced bronchodilation and argue for the need to re-examine the roles of TAS2Rs in many other systems using genetic approaches.
2 |. MATERIALS AND METHODS
2.1 |. Mice
All animal procedures were approved by the Institutional Animal Care and Use Committees at the University of Massachusetts Medical School (UMMS) (protocol number A1473) following the National Research Council Publication Guide for the Care and Use of Laboratory Animals and NIH Guide for the Care and Use of Laboratory Animal. Mice were maintained under a standard 12 h light/dark cycle (lights on at 07:00 AM) with food and water ad libitum (room temperature 22±2.0°C). All mice used in this study were C57BL/6 background.
2.2 |. Reagents
Methacholine and bitter-tasting compounds were purchased from Sigma-Aldrich in St. Louis, MO, USA (Methacholine, Cat # A2251; Chloroquine, Cat # C6628; Acesulfame K, Cat # 04054; Allylisothiocyanate, Cat #377430; Phenanthroline, Cat# 131377; Saccharin, Cat# 240931; Helicin, Cat#851671; Epicatechin, Cat# E1753; D-Salicin, Cat# S0625; Quinine, Cat# 22620).
2.3 |. Generation of Tas2r143/135/126 triple knockout mice
sgRNAs targeting Tas2r143, Tas2r135, and Tas2r126 were designed by an online algorithm described in http://crispr.mit.edu/. For each gene, two sgRNAs with the highest scores were selected. As truncated sgRNAs improve CRISPR/Cas9 nuclease specificity (Fu, Sander, Reyon, Cascio, & Joung, 2014), two nucleotides (nts) from the end far from PAM were deleted. All the guide RNAs were 18 nts long in length (Fig. 1B) and cloned to pSpCas9(BB)-2A-PuroA (Plasmid #62988, Addgene, Watertown, MA, USA) following the protocol as described by Ran and his colleagues (Ran et al., 2013). After validation of their genomic editing in NIH3T3 cell lines, the T7 promoter was added to sgRNA templates by PCR amplification using primer pairs as listed in Table 1. T7-sgRNA PCR products were gel purified and used as the templates for in vitro transcription (IVT) using the MEGAshortscript T7 kit (Cat# AM1354, Life Technologies, Carlsbad, CA, USA). The sgRNA-RNAs were purified using the MEGAclear kit (Cat# AM1098, Life Technologies, Carlsbad, CA, USA) and eluted in RNase-free water. Subsequently, a 4× mixture of Cas9-mRNA (200μg/μl, Cat# CAS500A-1, System Biosciences, Palo Alto, CA, USA) and six sgRNA-RNAs (80μg/μl for each) was generated and sent to the UMMS Transgenic Animal Modeling Core for zygote injection. The mixture was injected into inbred C57BL/6 oocytes at the pronuclei stage. The injected zygotes were cultured in KSOM media with amino acids at 37 °C under 5% CO2 in the air for 3.5 days until they reached the blastocyst stage. After that, ten blastocysts were transferred into the uterus of pseudo-pregnant ICR females at 2.5 days post coitum. Mouse offspring were genotyped for mutations in Tas2r143, Tas2r135 and Tas2r126 by genomic PCR and confirmed by sequencing. The Tas2r143−/−; Tas2r135−/−; Tas2r126−/− mice are named Tas2r TKO mice.
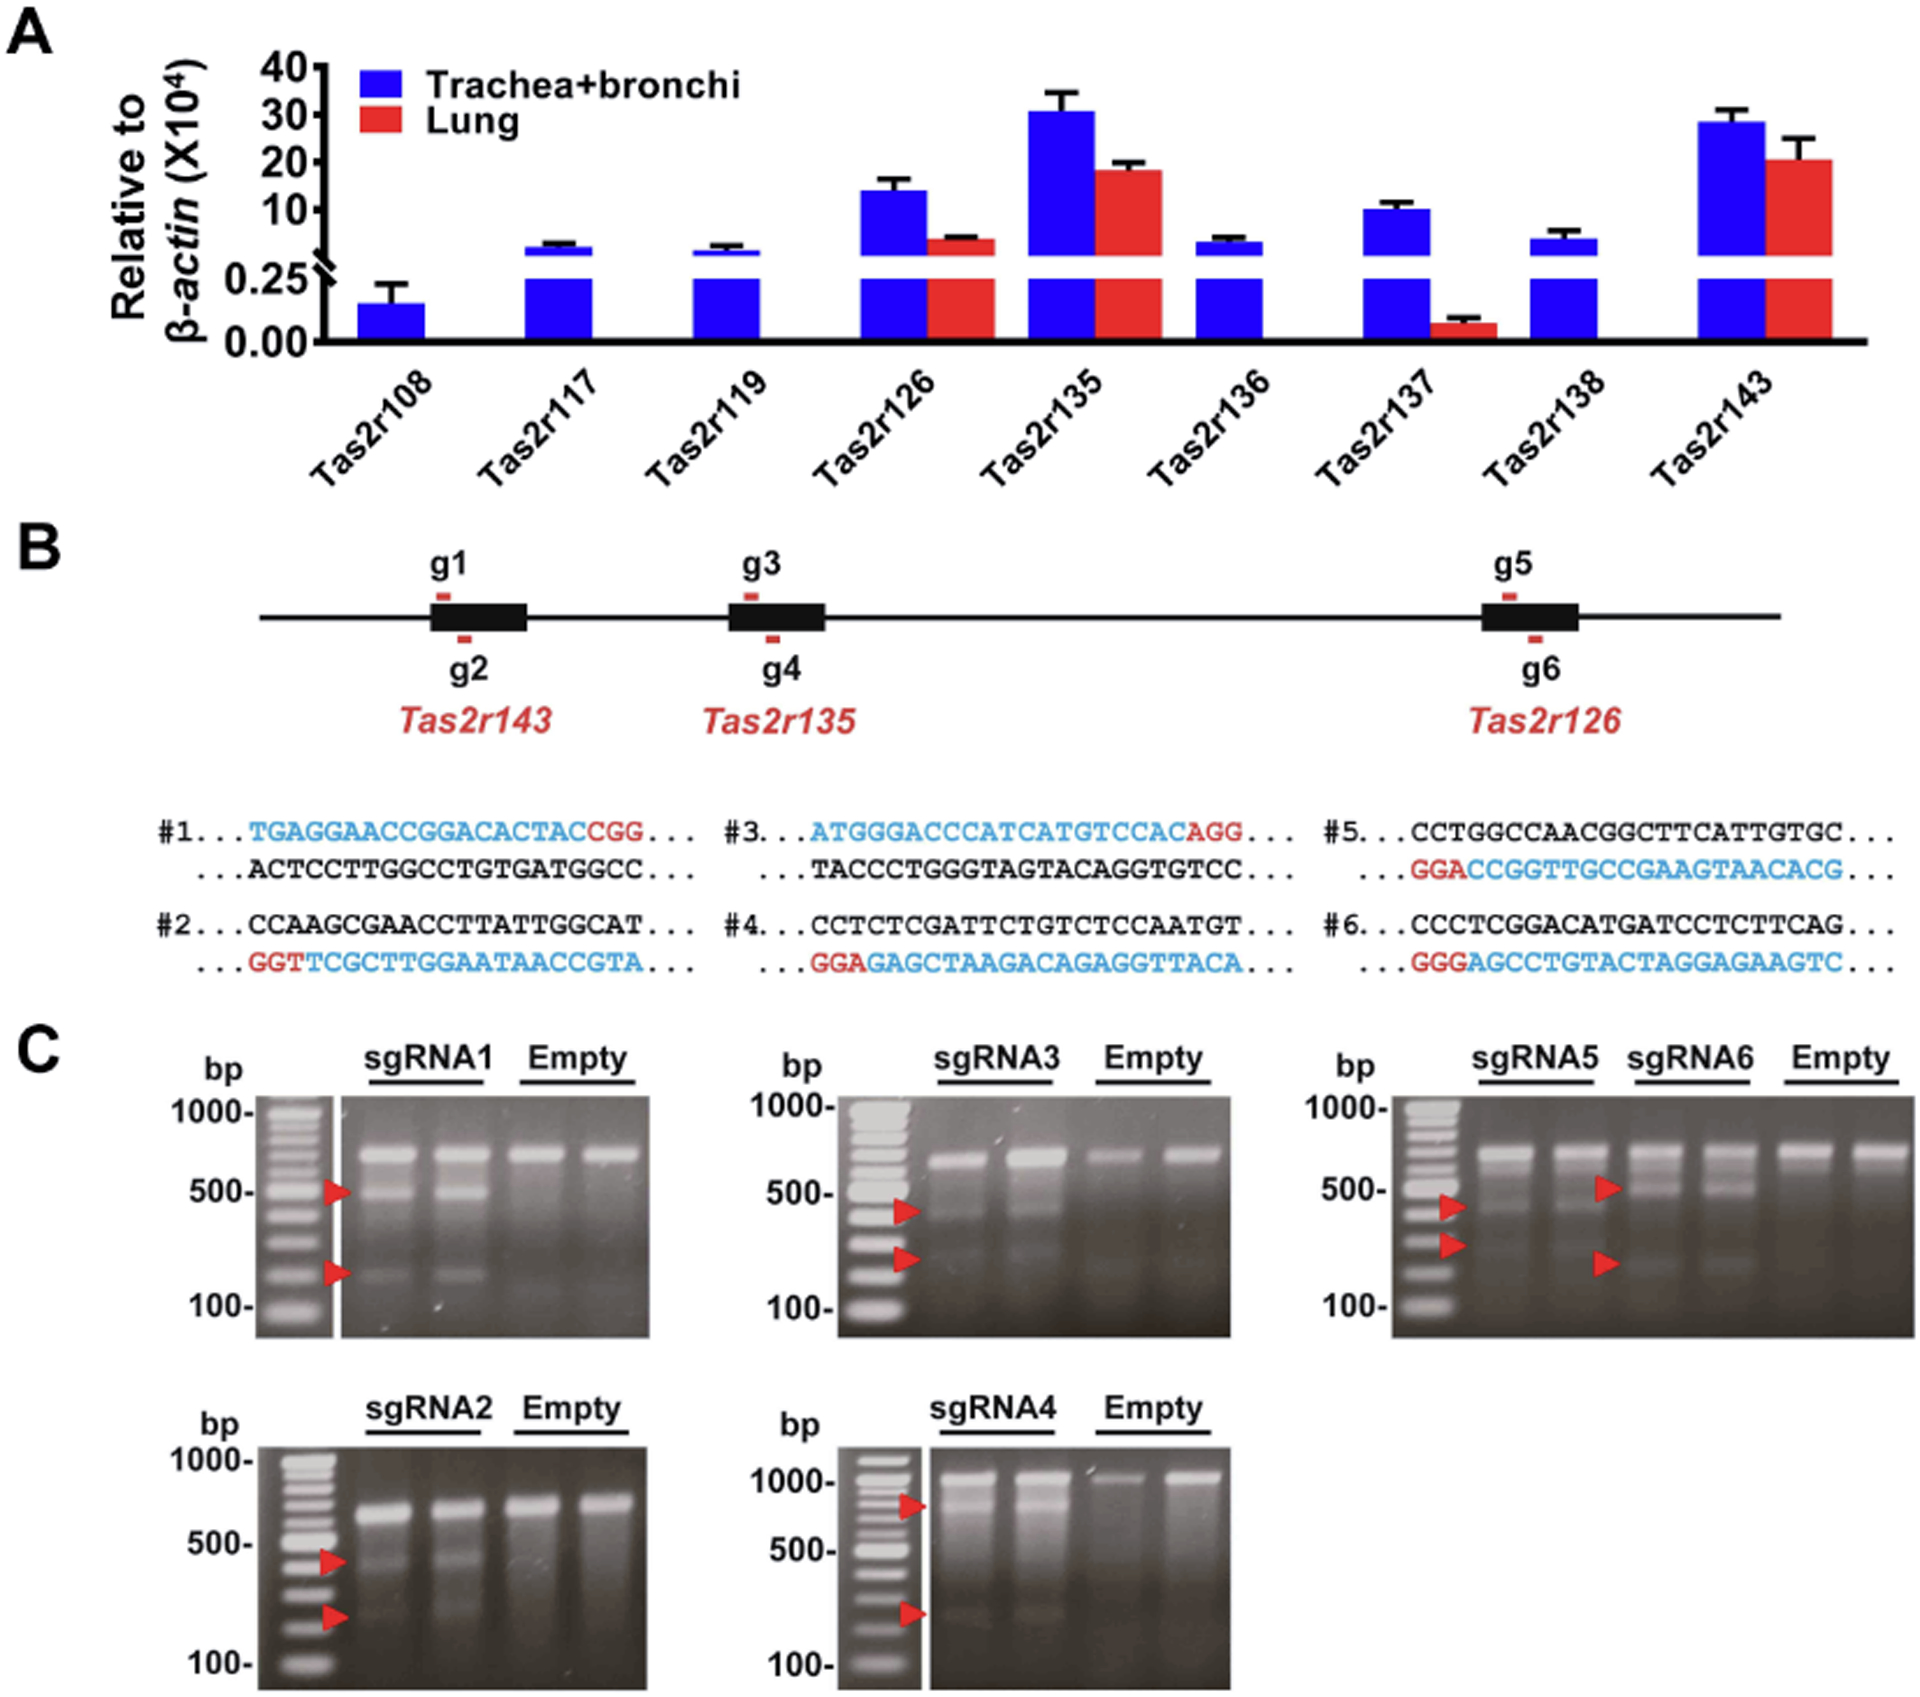
Figure 1. The expression profiles of Tas2rs in the mouse respiratory system and the design of sgRNAs for Tas2rs.
(A) Mouse trachea and main bronchi express nine Tas2rs and the lungs four, as quantified by qPCR. The expression level of each Tas2r was calculated using the 2−ΔCt method and was normalized against β-actin. Note that the remaining 26 Tas2rs (i.e., Tas2r102, 103, 104, 105, 106, 107, 109, 110, 113, 114, 115, 116, 118, 120, 121, 122, 123, 124, 125, 129, 130, 131, 134, 139, 140, and 144) were not detected in mouse airways or lungs. (B) The locations and target region sequences of sgRNAs for Tas2r143, Tas2r135, and Tas2r126. The pairs of g1/g2, g3/g4, and g5/g6 depict sgRNAs locations for Tas2r143, Tas2r135, and Tas2r126, respectively; their corresponding target DNA sequences are shown below the schematic diagram and marked as pairs of #1/#2, #3/#4 and #5/#6. In the DNA sequences, blue letters are CRISPR/Cas9 target sequences, and those in red are the protospacer adjacent motif (PAM). (C) The Surveyor mutation detection assay validates the function of sgRNAs in NIH3T3 cells. Two repeats for each sgRNA were carried out. Red arrowheads indicate cleaved DNA fragments as expected.
Table 1.
Primer sequences for genotyping, surveyor assay, Southern blotting probe cloning, and in vitro transcription.
| Name | Sequence | Function |
|---|---|---|
| Tas2r143F | ATGCCCTCCACACCCACATTGAT | genotyping |
| Tas2r143R | TAGTACCGATAGAAGTCCAGTG | genotyping |
| Tas2r135F | AGACTTTGGAAACTTAGCCTTGG | genotyping |
| Tas2r135R | AGAAACCTAGCAAAGAACAGAGC | genotyping |
| Tas2r126F | TGGCTCACATGCAGAATCCAACC | genotyping |
| Tas2r126R | AAGTCCCAGTGAAGACTAATGAG | genotyping |
| 143SY-F1 | AGTGGTTTGGCTGTAGATTCTGT | surveyor assay |
| 143SY-F2 | ATGCCCTCCACACCCACATTGAT | surveyor assay |
| 143SY-R | CACATGCTGGTACAGTGAGAAC | surveyor assay |
| 135SY-F1 | TGGATGTTGACAATGGGTAGGGGAT | surveyor assay |
| 135SY-R1 | GACAAAGACAGGATGGGTTAAGG | surveyor assay |
| 135SY-F2 | ATGGGACCCATCATGTCCACAG | surveyor assay |
| 135SY-R2 | TCAGCAGCAGCCCCTCTTTATC | surveyor assay |
| 126SY-F | GATGGGATAAGAATGATGGAACTC | surveyor assay |
| 126SY-R | AATCTTGATACAGAACAGGACGCT | surveyor assay |
| 143-Pb1-F | CCTCTGGGATTTCACTAACACTC | Probe 1 clone |
| 143-Pb1-R | GATGAAGAAGAAGGTAAGGGAT | Probe 1 clone |
| 135-Pb2-F | TTTGTGCCTGGTGGCAGTGGTAG | Probe 2 clone |
| 135-Pb2-R | AAGATGCTGAAGACAACAGTGGG | Probe 2 clone |
| 126-Pb3-F | ACGTGGCAAATACTGATGATAGC | Probe 3 clone |
| 126-Pb3-R | CATGTGAGCCAGAACTTCAATGT | Probe 3 clone |
| 126-Pb4-F | GGTTCTTGTTGGGCTCTATCTT | Probe 4 clone |
| 126-Pb4-R | AGGAGTAGCTGCCTGAAGGTG | Probe 4 clone |
| 143-T7-F1 | TTAATACGACTCACTATAGGTGAGGAACCGGACACTAC | IVT |
| 143-T7-F2 | TTAATACGACTCACTATAGGATGCCAATAAGGTTCGCT | IVT |
| 135-T7-F1 | TTAATACGACTCACTATAGGGGGACCCATCATGTCCA | IVT |
| 135-T7-F2 | TTAATACGACTCACTATAGGATTGGAGACAGAATCGAG | IVT |
| 126-T7-F1 | TTAATACGACTCACTATAGGACAATGAAGCCGTTGGCC | IVT |
| 126-T7-F2 | TTAATACGACTCACTATAGGGAAGAGGATCATGTCCGA | IVT |
| T7-R | AAAAGCACCGACTCGGTGCC | IVT |
2.4 |. Reverse transcription-PCR and quantitative real-time PCR
Trachea, two mainstem bronchi and left lung lobes from mice were carefully isolated and quickly cleaned by removing connective tissues. Subsequently, the airways (i.e., a mixture of the trachea and bronchi) and the lung lobes were frozen separately and ground to homogeneity in liquid nitrogen. Total cellular RNAs were isolated using Trizol (Cat# 15596018, Life Technologies, Carlsbad, CA, USA), as described in the manufacturer’s instructions. Baseline-ZERO™ DNase (Cat# DB0711K, Epicentre, Madison, WI, USA) was deployed to digest the residual genome (following the manufacturer’s manual). In each assay, 2 μg of isolated RNAs from each sample was reverse-transcribed into cDNA using SuperScript® III reverse transcriptase (Cat# 18064–022, Life Technologies, Carlsbad, CA, USA).
Quantitative real-time PCRs (qRT-PCR) were carried out to determine the mRNA levels of Tas2rs with iTaq™ Universal SYBR® Green Supermix (Cat# 172–5121, Bio-rad, Hercules, CA, USA) following the manufacturer’s protocols. As the expressions of Tas2rs were relatively low, input RNA (cDNA) for each well was 10 ng. The PCR consisted of a 45-cycle amplification of the template cDNA with primers annealing at 60°C. The expression level of each targeted gene was calculated using the 2−ΔCt method and normalized against the housekeeping gene β-actin. Those with Ct values >35 were considered low precision and counted as no expression since a 35-cycle PCR reaction should amplify even a single transcript to a measurable level. All the primers for mouse Tas2rs were the same as described in our previous study (K. Zheng et al., 2017).
2.5 |. Surveyor assay
The Surveyor assay was performed as described by Ran et al. (Ran et al., 2013). Briefly, NIH3T3 cells transfected with or without sgRNA-containing pSpCas9(BB)-2A-PuroA were harvested, and genomic DNAs were extracted. Primers 143SY-F1 and 143SY-R were used for Surveyor assay sgRNA1 related surveyor PCR; 143SY-F2 and 143SY-R for sgRNA2; 135SY-F1 and 135SY-R1 for sgRNA3; 135SY-F2 and 135SY-R2 for sgRNA4; and 126SY-F and 126SY-R for either sgRNA5 or sgRNA6 (Table 1). All the amplicons were separately denatured by heating to 95°C and slowly reannealed using a heat block to randomly rehybridize wild-type and mutant DNA strands. Samples were then incubated with SURVEYOR nuclease S (Cat# 706020, Surveyor Kit; Transgenomic, Omaha, NE, USA) for 1 hr at 42°C. The SURVEYOR nuclease S recognizes and cleaves DNA helices containing mismatches (e.g., where mutant sequences do not hybridize with wild type sequences). Digestion products were separated on a 1.5% agarose gel and visualized by staining with SYBR Safe (Cat# S33102, Life Technologies, Carlsbad, CA, USA). For the sgRNA1 surveyor assay, expected cleaved bands are ~210 bp and ~500 bp, and the surveyor PCR product is 707 bp in length. For the sgRNA2 related test, expected bands after cleavage are around 230 bp and 390 bp, and the surveyor PCR product is 621 bp. For sgRNA3, expected cleavage products are about 250 bp and 400 bp, and the surveyor PCR product is 653 bp. The sgRNA4 assay should yield ~220 bp and 750 bp bands and a surveyor PCR product of 966 bp. For sgRNA5, cleaved products are about 270 bp and 400 bp, and the surveyor product is 672 bp. For sgRNA6, the surveyor PCR products are the same as sgRNA5, while expected cleaved bands are ~200 bp and ~470 bp.
2.6 |. Southern blot
Southern blotting was carried out as described previously (He & Jacobson, 1995). Briefly, genomic DNAs, digested by enzymes as indicated in Fig 2A, were separated on a 1% agarose gel, transferred onto a nylon membrane (Cat# GERPN203B, Sigma-Aldrich in St. Louis, MO, USA), and hybridized with respective probes as indicated in Fig 2A. [α-32P]-dCTP (Perkin Elmer, Blu513Z) and a random primed DNA labeling kit (Roche, #11–004-760–001) was used to generate probes. Signals from southern blots were detected by phosphorimaging using a Fujifilm bio-imaging analyzer (BAS-2500). The primers for generating probes are listed in Table 1.
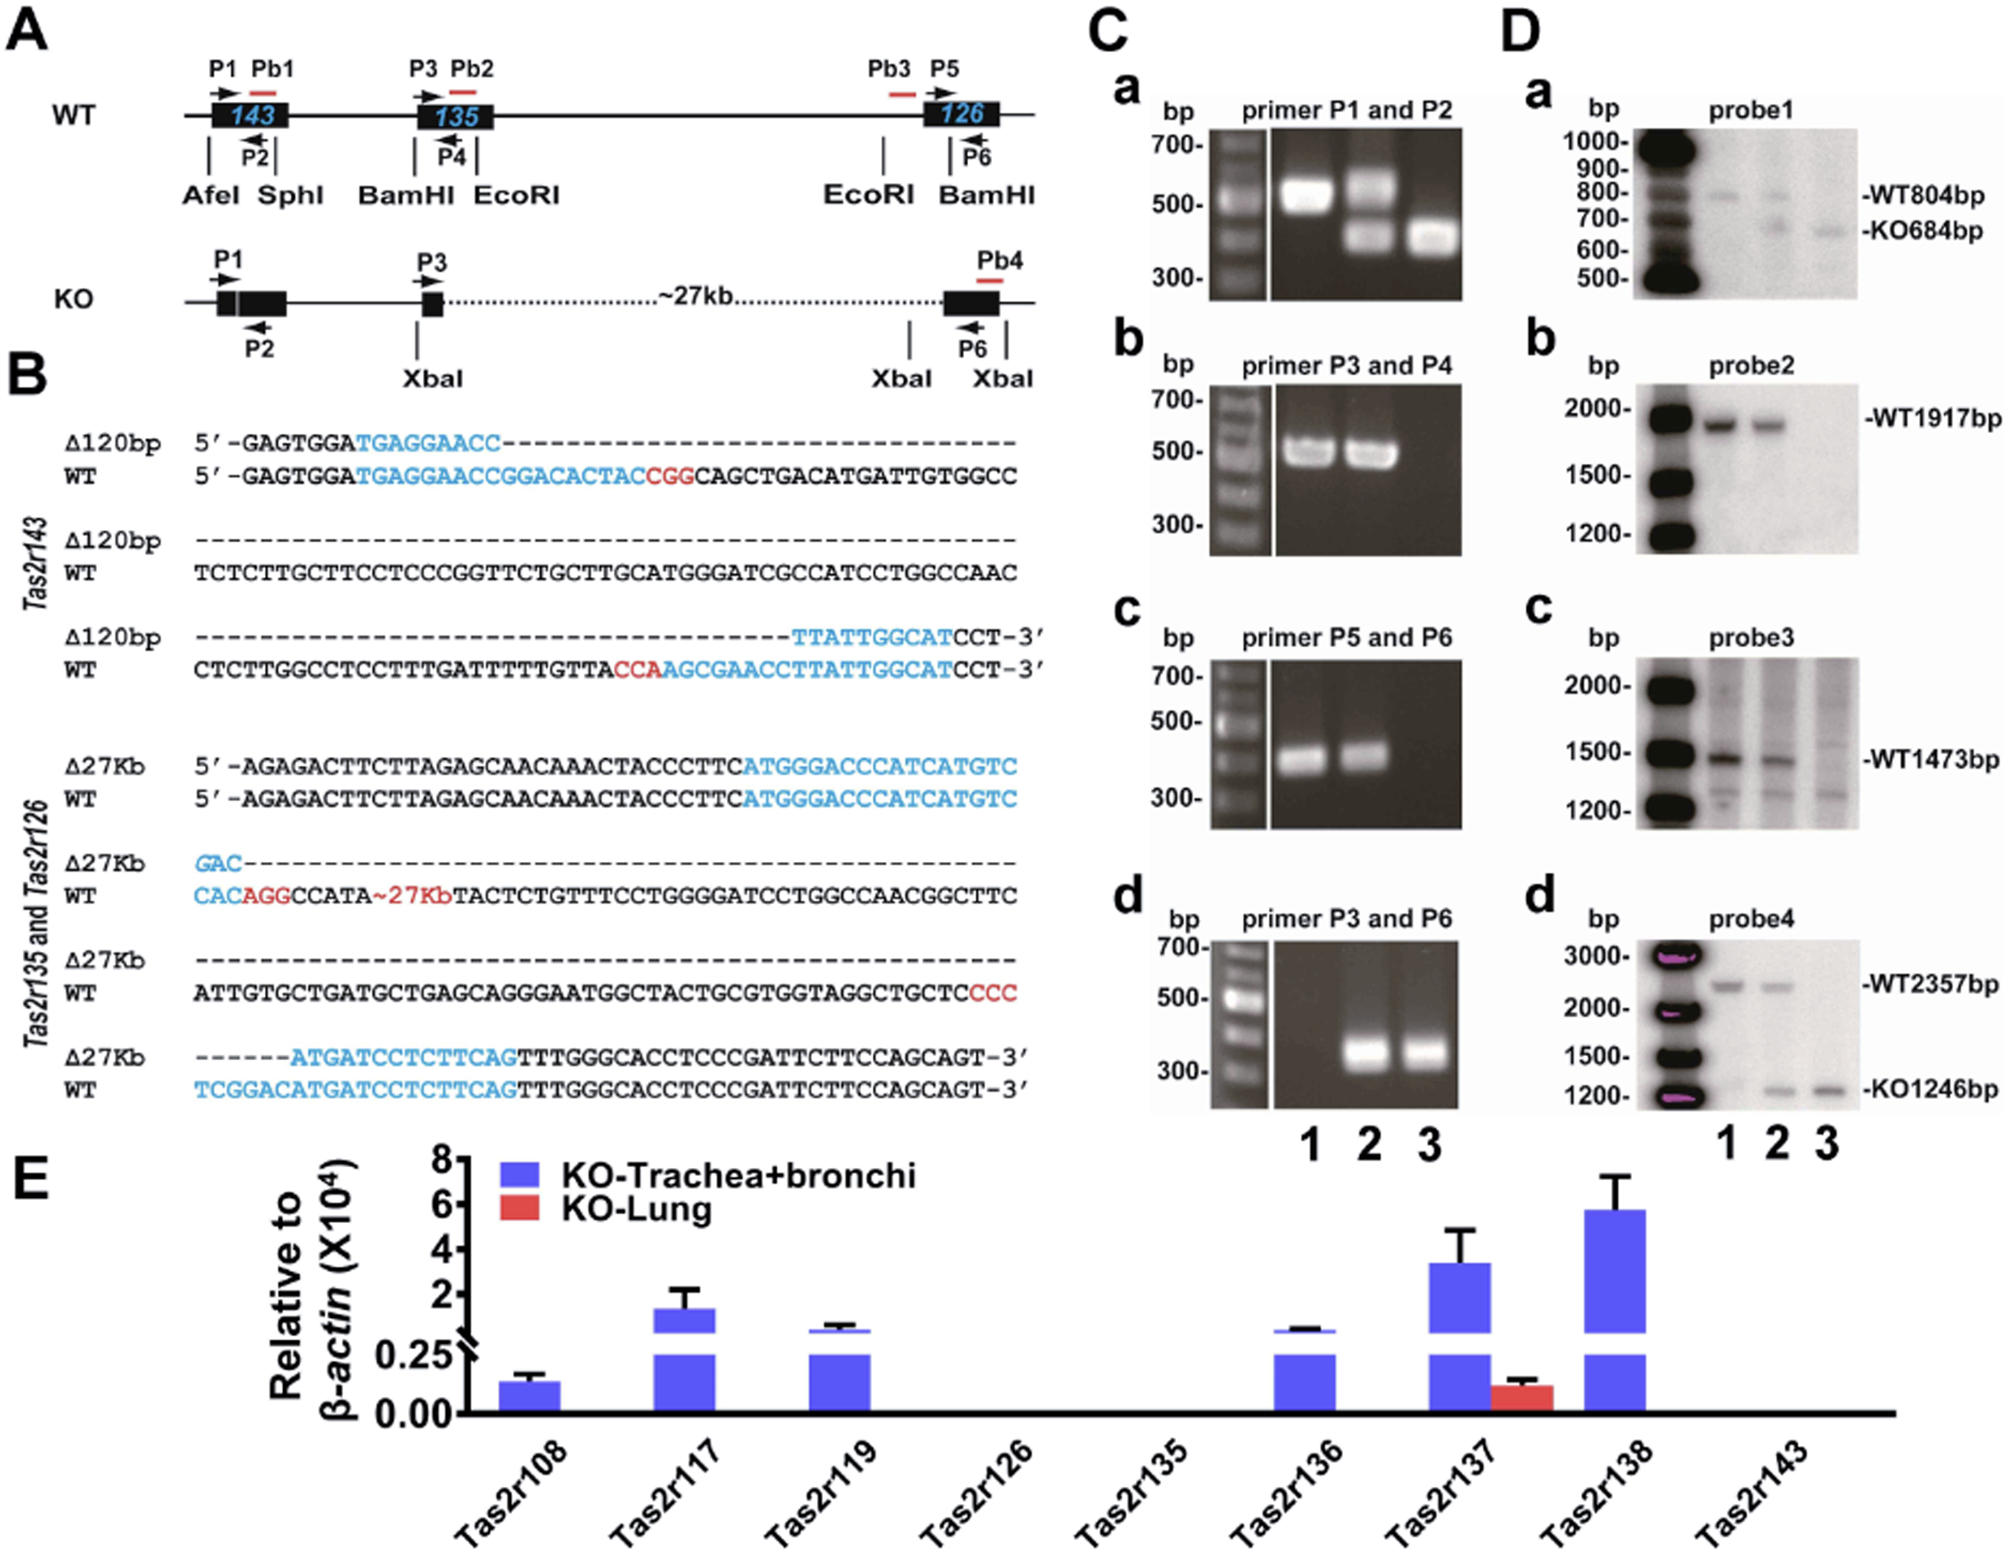
Figure 2. Generation of Tas2r143−/−;Tas2r135−/−;Tas2r126−/− mice with CRISPR/Cas9 technology.
(A) Schematic diagram showing PCR primers and Southern blot probes’ design for genotyping Tas2rs in wild type and null mice. (B) Nucleotide sequences covering the modified sites. From upper to lower, four blue highlighted are sgRNA1, sgRNA2, sgRNA3, and sgRNA6 target regions, respectively, and those with red are PAM sites. (C) Genotyping of triple-targeted six mouse clones by PCR analysis. (a) Tas2r143 PCR analysis with primers P1 and P2: WT=527 bp, TKO=407 bp, and heterologous with both bands; (b) Tas2r135 PCR analysis with primers P3 and P4: WT or heterologous=546 bp, and TKO=no band; (c) Tas2r126 PCR analysis with primers P5 and P6: WT or heterologous=397 bp, and TKO=no band; (d) PCR analysis for the ~27 kb deletion with primers P3 and P6: WT=no band, heterologous or TKO=327 bp. Genotypes: 1: wild type mouse; 2: heterozygote TKO mouse; 3: TKO mouse. (D) Southern blot analysis of triple-targeted Tas2rs. (a) Tas2r143 locus; (b) Tas2r135 locus; (c) Tas2r126 locus; and (d) the ~27 kb deletion detection. (E) Tas2r expression profiles in airways and lungs from Tas2r TKO mice.
2.7 |. Mouse taste preference test
To determine whether the deletion of Tas2rs affects bitter taste preference, we performed two-bottle preference tests using the protocol described in Ruiz et al. (Ruiz, Wray, Delay, Margolskee, & Kinnamon, 2003). Experiments were conducted in plastic cages with stainless steel wire lids. Two inverted bottles were placed on either side of a cage lid, and each had a neoprene stopper with a straight stainless-steel sipper tube that protrudes into the cage at a comfortable distance from the cage floor. Mice were housed individually, and food was available ad libitum. One bottle contained a proper concentration of bitter compound dissolved in distilled water, whereas the other was filled with distilled water only. The test lasted 48 hours. Twenty-four hours after the test initiation, two bottles’ positions were switched to avoid side bias. Amounts consumed were recorded at 48 hours, and a preference ratio (PR) [(amount of chemical solution consumed)/(amount of chemical solution consumed + amount of water consumed)] for each mouse was calculated.
2.8 |. Pulmonary mechanical measurements
Pulmonary mechanics were measured using forced oscillometry (FlexiVent system; SCIREQ, Montreal, Canada) in wild type mice and Tas2r TKO mice. Mice were anesthetized with an intraperitoneal injection of a ketamine (90 mg/kg; Animal Health International, Westlake, TX, USA) and xylazine (4.5 mg/kg; Propharma, Tokyo, Japan) mixture. Upon establishing an adequate anesthesia level (i.e., loss of withdrawal to toe pinch), a tracheotomy was performed, and a precalibrated cannula was introduced into the trachea. The mouse was then placed on a computer-controlled piston-ventilator FlexiVent system (SCIREQ) and ventilated at a tidal volume of 10 ml/kg, with a rate of 150 breaths/min and a positive end-expiratory pressure of 3 mmHg. Neuromuscular blockade with pancuronium bromide (2.5 mg/kg; Hospira, Lake Forest, IL, USA) was given to prevent spontaneous respiratory effort. Respiratory mechanics were obtained and calculated using FlexiWare software (SCIREQ) as previously described (Keeler et al., 2017; McGovern, Robichaud, Fereydoonzad, Schuessler, & Martin, 2013). In brief, measurements were obtained by analyzing pressure and volume signals acquired in reaction to predefined oscillatory airflow waveforms (perturbations) applied to the subject’s airways. After an initial mechanical scan protocol, animals were subjected to incremental doses (1.5, 3.125, 6.25, 12.5, 25, 50, and 100 mg/ml) of nebulized Mch. Respiratory system resistance (Rrs) was obtained by assessing the mouse’s response to a single frequency forced oscillation maneuver (McGovern et al., 2013). Central airway resistance (Rn) and small airway and tissue resistance (G) were measured using broadband low-frequency forced oscillation maneuvers over a range of frequencies (Quick Prime-3) (McGovern et al., 2013). These maneuvers were performed every 15 seconds for a total of 12 automated measurements per dose. Between each challenge, the mouse’s lungs were subjected to two deep lung inflations. To ensure that mice were alive during these in vivo pulmonary mechanical scans and dose-response, we monitored the heartbeat visually between each dose, during deep inflations, and at the end of the study.
2.9 |. Mouse airway smooth muscle isometric contraction bioassay
Mice were sacrificed, and entire respiratory trees were rapidly removed and immersed in Krebs physiologic solution containing (in mM) 118.07 NaCl, 4.69 KCl, 2.52 CaCl2, 1.16 MgSO4, 1.01 NaH2PO4, 25 NaHCO3, and 11.10 glucose. Trachea and mainstem bronchi were isolated and cut into rings (4 mm in length). The rings were mounted on a force transducer of a myograph system (610-M, Danish Myo Technology, Aarhus, Denmark). The rings with zero tension were immersed in 5 ml of Krebs physiologic solution, bubbled with 95% O2 and 5% CO2 at 37°C. After 40 min equilibration, the rings were subjected to three stretches (each 2.5 mN) at 5 min intervals. After these stretches, the rings usually settled with a tone of approximately 2 mN. To test the contractile response, each ring was then stimulated twice with KCl (60 mM) for 5min, separated by 10 min, before proceeding to other treatments (e.g., Mch). To assess the dose-dependent contraction (Fig. 4A) induced by Mch, eight levels (in M: 10−8, 10−7.5, 10−7, 10−6.5, 10−6, 10−5.5, 10−5, 10−4.5, and 10−4) of Mch were applied cumulatively. The contraction (%) was calculated as the tension generated by Mch divided by that caused by the second KCl stimulation, ×100. To test relaxation effects by bitter tastants, airway contraction was induced by 1 μM Mch. Once the contraction reached a plateau, usually 30 min after Mch administration, each bitter tastant was added cumulatively. The order and treatment time of agonists are indicated in Figure 5. Bitter tastant-induced relaxation (%) was calculated as tension decrease due to bitter tastant divided by tension increase due to Mch, ×100. The tension decrease at each concentration of bitter tastant was measured once the tension stabilized. The tension decrease at each increased level was always measured relative to the peak tension ((i.e., it is a total decrease, not the incremental decrease due to the additional bitter tastant added).
Figure 4. The triple deletion of TAS2R143, TAS2R135, and TAS2R126 does not change airway contractile responses to methacholine (Mch).
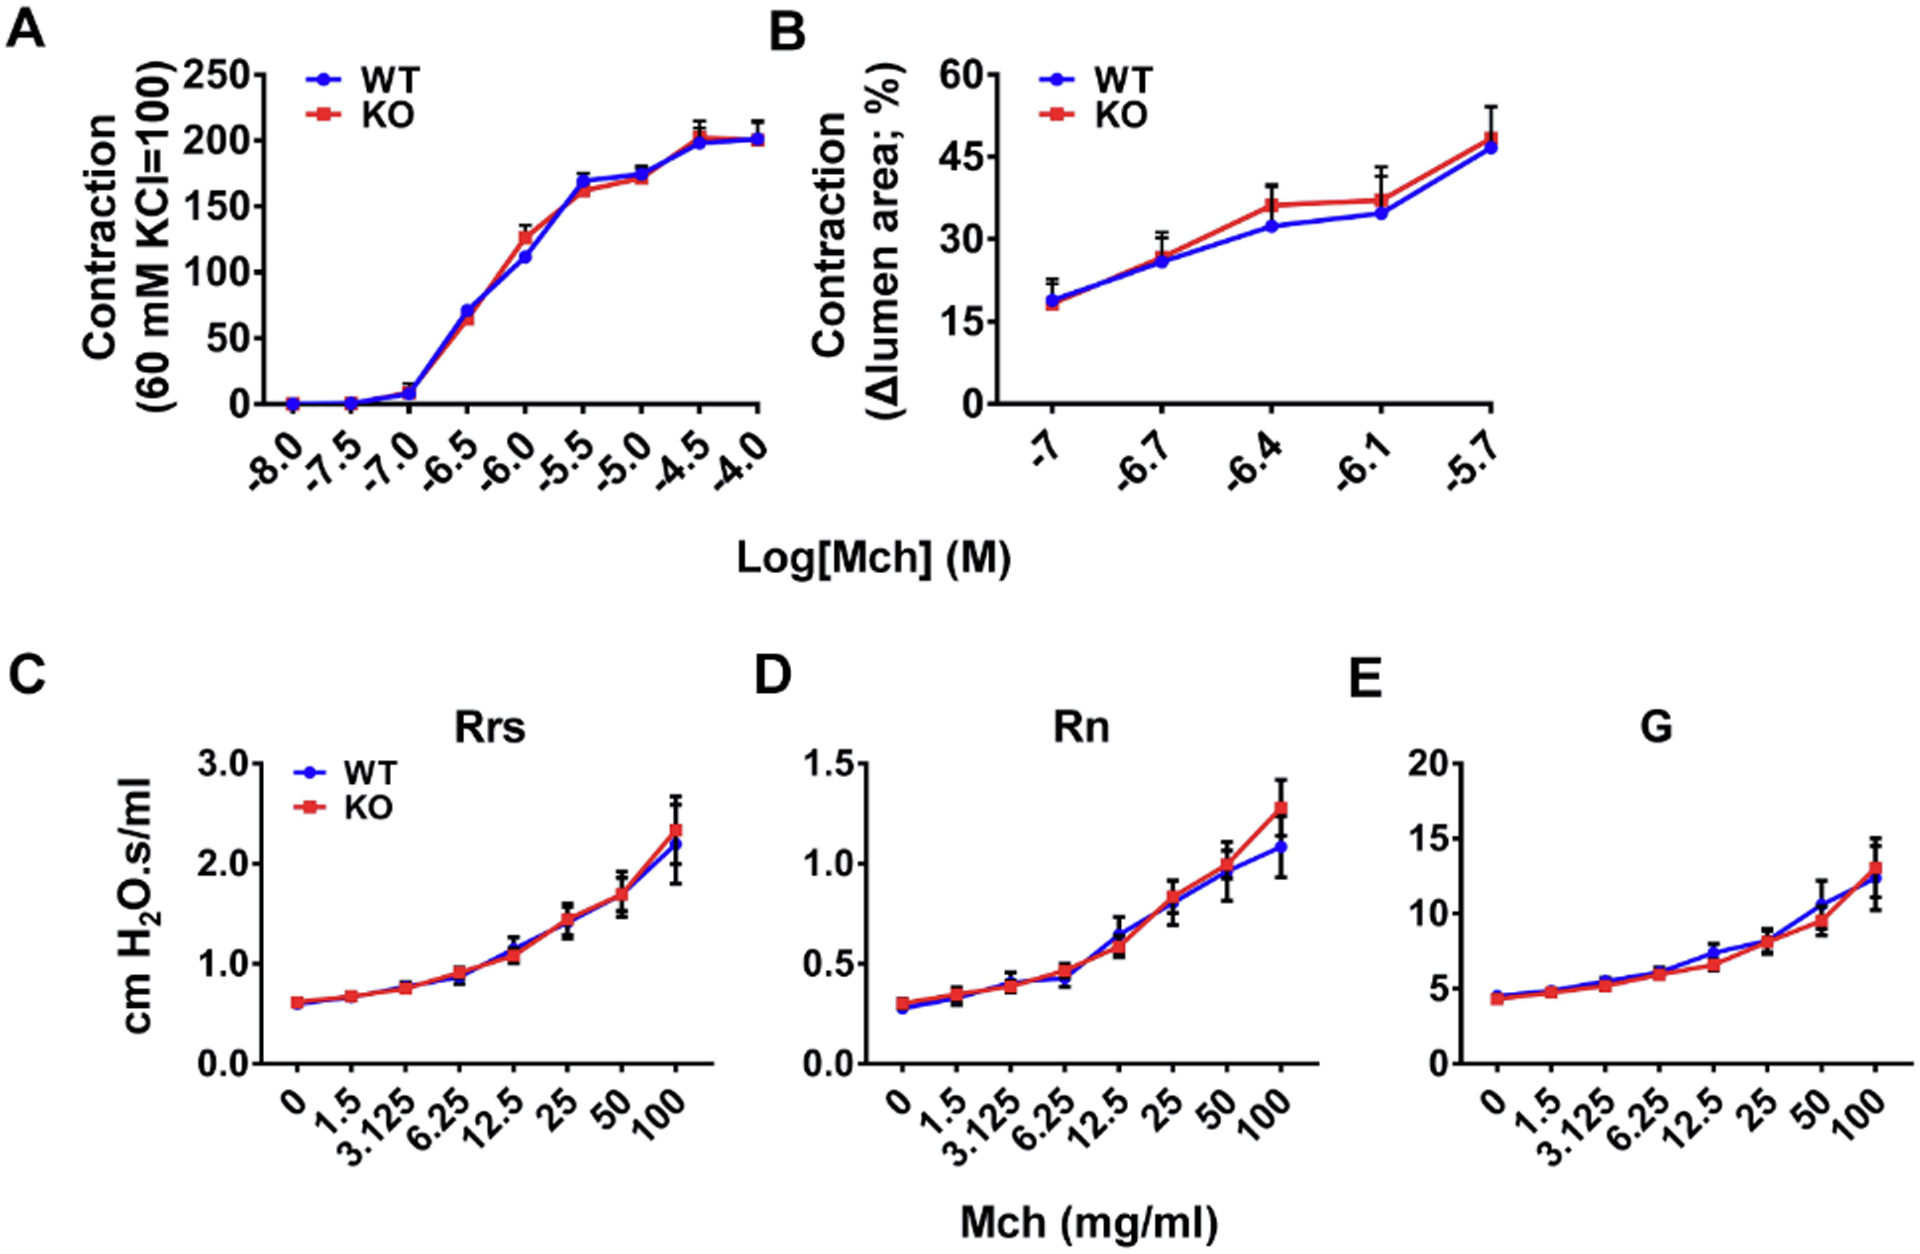
(A) Mch induced airway ring contraction in the same dose-dependent manner in wild type mice and Tas2r TKO mice. n=9 for WT and 8 for KO, p=0.97. (B) Mch caused small airway shortening to the same extent in PCLSes from wild type mice and Tas2r TKO mice. n=5 for each group, p=0.84. (C-E) Mch produced the same effect on overall respiratory resistance (Rrs, p=0.90), central airway resistance (Rn, p=0.70), and tissue damping (G, p=0.75) as assessed by Flexivent. n=10 for WT and 11 for KO. Results are presented as mean ± SEM, and statistical significances between wild type and Tas2r TKO mice were assessed using a two-way ANOVA with the Bonferroni post-hoc test.
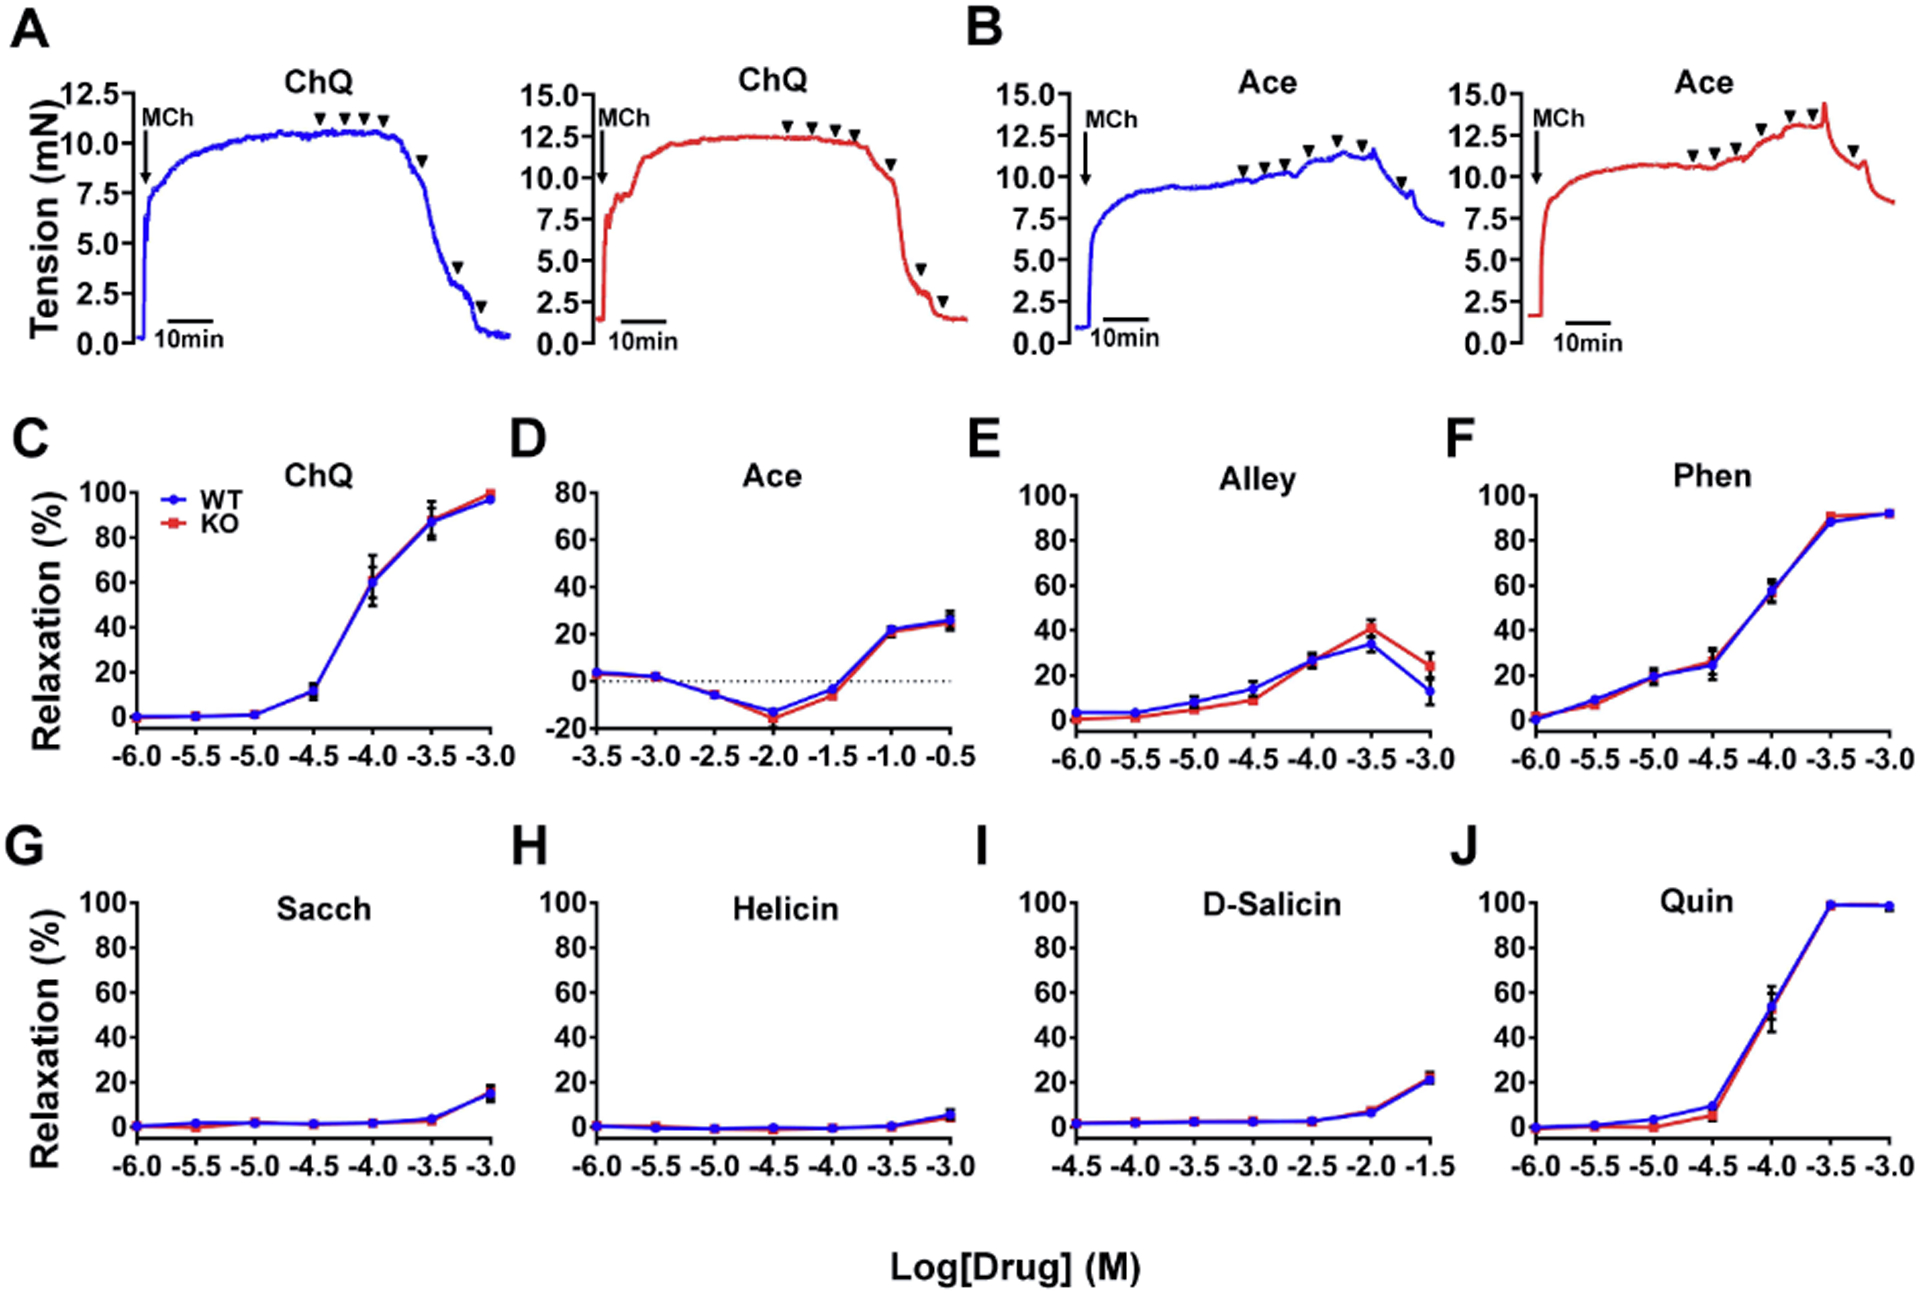
Figure 5. The triple deletion of TAS2R143, TAS2R135, and TAS2R126 exerts no effect on bitter tastant-induced relaxation of the trachea and main bronchi.
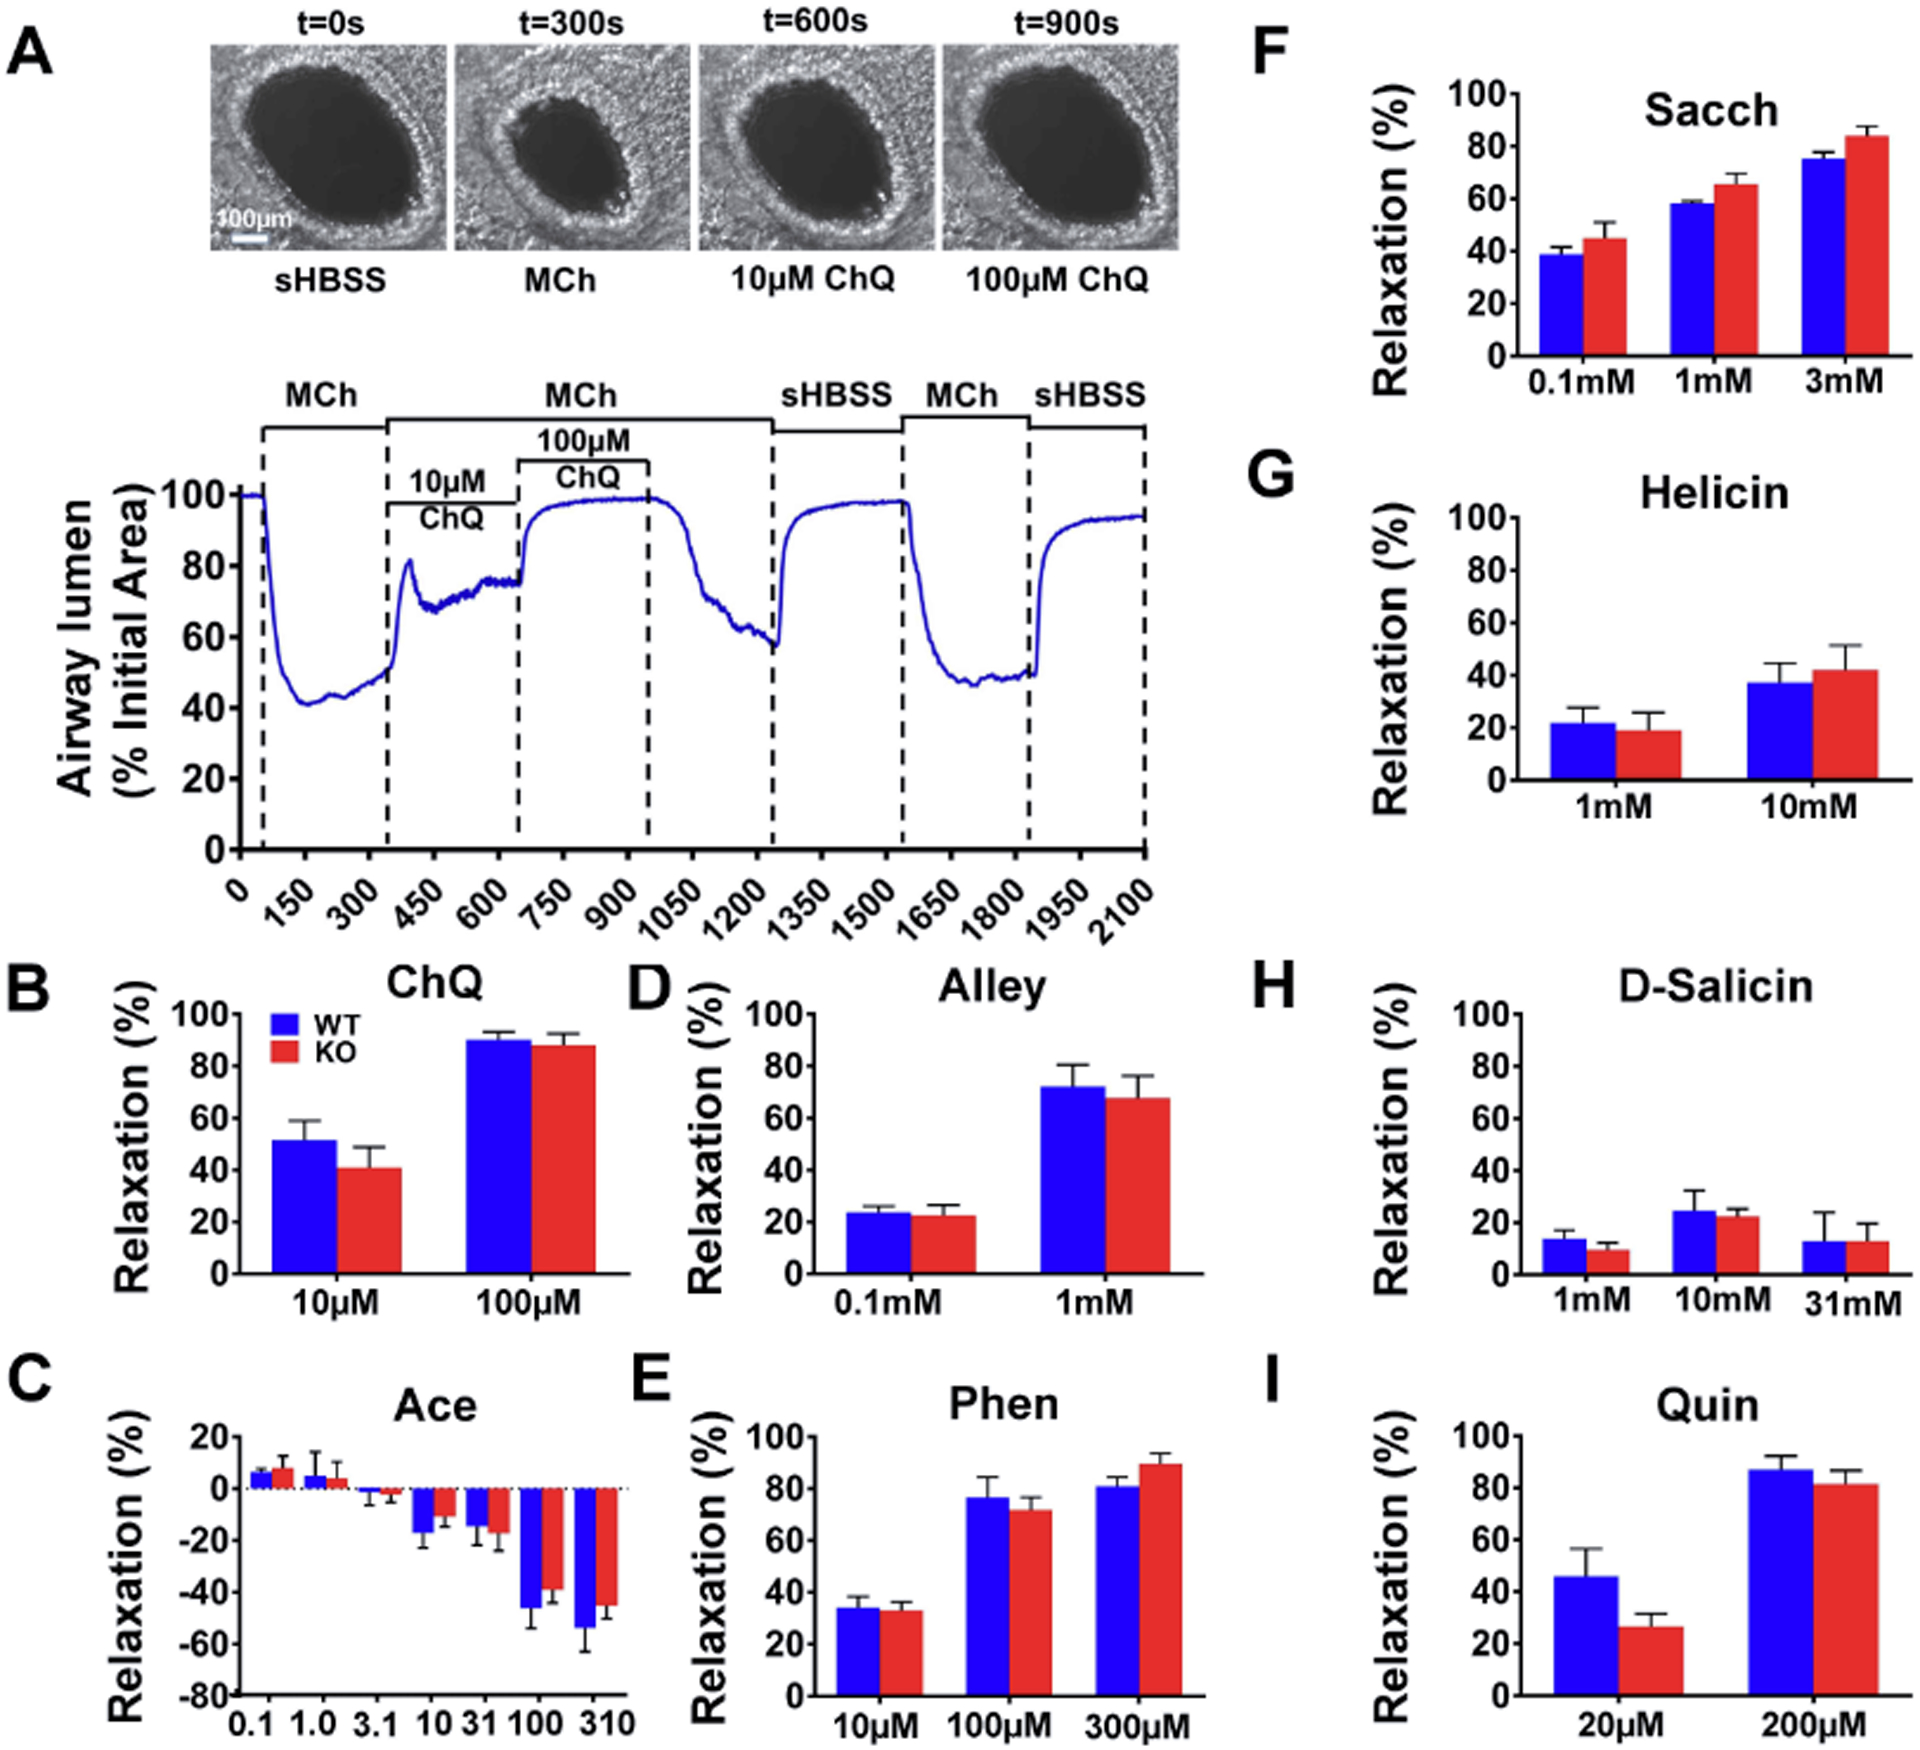
(A) Chloroquine dose-dependently reversed Mch-induced contraction of the trachea and main bronchi from wild type (left) and Tas2r TKO mice (right). Arrowheads indicate times when chloroquine (left to right (in mM): 0.001, 0.003, 0.01, 0.03, 0.1, 0.3 and 1) was added. (B) Acesulfame potassium produced no effect on Mch-induced airway contraction in wild type (left panel) and Tas2r TKO mice (right panel). Arrowheads mark the time when different doses of Acesulfame were applied (left to right (in mM) 0.3, 1, 3.1, 10, 31, 100 and 310). (C-J) The summarized results of TAS2R135 or TAS2R126 ligand-induced relaxation of airways pre-contracted by Mch in wild type mice and Tas2r TKO mice. Data are mean ± SEM. (C) ChQ: chloroquine, n=8 for each group, p=0.91. (D) Ace: acesulfame potassium, n=8 for each group, p=0.49. (E) Alley: allylisothiocyanate, n=13 for each group, p=0.78. (F) Phen: phenanthroline, n=8 for each group, p=0.92. (G) Sacch: saccharin, n=6 for each group, p=0.85. (H) Helicin, n=8 for each group, n=0.86. (I) D-salicin: n=6 for each group, p=0.73. (J) Quin: quinine, n=8 for each group, p=0.57. No statistical significance between wild type mice and Tas2r TKO mice was detected for all the panels using a two-way ANOVA with the Bonferroni post-hoc test.
2.10 |. Preparation of precision precision-cut lung slice (PCLS)
The detailed protocol was described previously (Perez & Sanderson, 2005). Briefly, mice were killed by cervical dislocation. After opening the thoracic cavity, lungs were inflated with ~1 ml of 1.8% agarose in sHBSS [i.e., Hanks’ balanced salt solution (HBSS, Cat# 1387, Sigma-Aldrich, St Louis, USA) was supplemented with 20 mM Hepes buffer and adjusted to pH 7.4 (so named as sHBSS)] at ~37°C via an intratracheal catheter. Subsequently, ~0.3 ml of air was injected to flush the agarose within the airways into the distal alveoli. After the agarose was gelled by cooling the lungs with ~4°C sHBSS, lung lobes were removed and sectioned into ~180 μm thick slices with a vibratome (VF-300; Precisionary Instruments, Greenville, NC, USA). PCLSes were maintained in Dulbecco’s modified Eagle’s medium with antibiotics at 37°C and 10% CO2 for up to 3 days. All experiments were performed at 37°C with constant perfusion using a custom-made, temperature-controlled microscope enclosure as described previously (Perez & Sanderson, 2005).
2.11 |. Measurement of airway contraction and relaxation in PCLS
The measurement was performed as detailed previously (Perez & Sanderson, 2005). Briefly, PCLSes were placed on a cover-glass mounted in a custom-made Plexiglas support and held down by a 200 μm nylon mesh with a hole aligned over a selected airway. A perfusion chamber was created by placing another smaller cover‐glass on the nylon mesh’s top and sealing the edges with silicone grease. Airway contraction and relaxation in response to different compounds were monitored with an inverted microscope (Diaphot; Nikon, Tokyo, Japan; or IX71; Olympus, Tokyo, Japan) with a 10X objective. Phase‐contrast images were collected at a rate of 0.5Hz with a CCD camera controlled by custom-programmed software based on Video Savant 4 (IO Industries, Montreal, Canada). The change in the lumen area of a selected airway was analyzed using ImageJ (http://imagesj.nih.gov; NIH, Bethesda, MD, USA) as described previously (Tan & Sanderson, 2014). After selecting an appropriate grayscale threshold to distinguish the lumen from the surrounding area, the lumen area of the PCLSes was calculated, with respect to time, by pixel summing. The summed area values were normalized to the initial pre-stimulation value, which was set as 100. To obtain the dose-response curve of Mch in small airways (Fig. 4B), the contraction was calculated as (100-AreaMch), where AreaMch was the lumen area after 5 min perfusion of Mch. Bitter tastant-induced relaxation (%) in Fig. 6 was calculated as (AreaBT-AreaMch)/(100- AreaMch)× 100, where AreaBT was the lumen area after 5 min of bitter tastant treatment, and AreaMch the lumen area after 5 min of Mch perfusion.
Figure 6. The triple deletion of TAS2R143, TAS2R135, and TAS2R126 does not change the bitter tastant-induced relaxation of small airways.
(A) Experimental paradigm: A PCLS was treated with 400 nM Mch followed by chloroquine. The trace shows the airway lumen area (a proxy of contraction) in response to Mch and chloroquine. The PCLS viability and chloroquine’s effect on airway shortening were confirmed by washout and a repeat stimulation with Mch in the trace’s 2nd part. The x-axis unit: second (S). Images above the trace were taken at the times as labeled. (B-I) The summarized results from the experiments as in panel A with chloroquine show that TAS2R135 or TAS2R126 ligands induce relaxation of small airways pre-contracted by 400 nM Mch in wild type mice and Tas2r TKO mice. Data are mean ± SEM. (B) ChQ: chloroquine, n=15 for WT and 8 for KO, p=0.84 at 10 μM and 0.48 at 100 μM WT vs KO. (C) Ace: acesulfame potassium, The x-axis unit: mM, n=5 for each group, p=0.68. (D) Alley: allylisothiocyanate, n=8 for WT and 9 for KO, p=0.81 at 0.1 mM and 0.71 at 1 mM WT vs KO. (E) Phen: phenanthroline, n=7 for WT and 12 for KO, p=0.89. (F) Sacch: saccharin, n=4 for WT and 5 for KO, p=0.2. (G) Helicin, n=5 for each group, p=0.39 at 1 mM and 0.51 at 10 mM WT vs KO. (H) D-salicin: n=3 for WT and 4 for KO, p=0.72. (I) Quin: quinine, n=7 for each group, p=0.18 at 20 μM, and 0.59 at 200 μM WT vs. KO. No statistical significance between wild type and Tas2r TKO mice was detected for all the panels using a two-tailed Student’s t-test (B, D, G and I) or two-way ANOVA with the Bonferroni post-hoc test (C, E, F and H).
2.12 |. Statistical analysis
Data are presented as means ± standard error of the mean (SEM). Sample sizes are indicated in each figure. Statistical analyses were performed using GraphPad Prism8. For groups with treatments of one or two doses, comparisons between groups were determined by an unpaired Student’s t-test. For groups with treatments of three or more doses, comparisons were made using a two-way analysis of variance (ANOVA) with the Bonferroni multiple comparison test for significant differences. The probability value was noted in the respective figure legends. The significance levels were set as follows: N.S. P>0.05, *P<0.05, **P<0.01, ****P<0.0001, and indicated in the respective figure legends.
3 |. RESULTS
3.1 |. Tas2r143/Tas2r135/ Tas2r126 cluster is expressed in mouse airways and lungs.
The airway has been used as a phenotypical tissue to explore the pathophysiology of extraoral TAS2Rs. As the first step to examine the role of TAS2Rs in airways genetically, we profiled the expression of this gene family (i.e., 35 Tas2rs) in large airways (i.e., trachea and mainstem bronchi) and lungs in mice. To do so, we employed qPCR because specific antibodies for mouse TAS2Rs are not available. Given that Tas2r genes do not have introns and the expression level of Tas2rs in extra-oral tissues is generally very low, we took extra care to prevent genome DNA contamination in our quantification. We found that commonly used genomic DNA elimination approaches, e.g., purification of mRNA with poly(T)-tag (Raz et al., 2011), digestion by DNase or genome-specific binding column filtering, could not yield satisfactory results (Supplementary Figure 1). After several rounds of experimental strategy optimization, we found that Baseline-ZERO™ DNase from Epicentre utilized for the sample preparation for RNA sequencing can more completely digest DNA than other commonly used commercial DNases and produces more convincing data (Supplementary Figure 1). With this methodology, we detected nine mRNA transcripts for Tas2r108, 117, 119, 126, 135, 136, 137, 138, and 143 in mouse airways (Fig. 1A). We also detected four transcripts for Tas2r 126, 135, 137, and 143 in mouse lungs (Fig. 1A). Interestingly, Tas2rs143, Tas2r135, and Tas2r126 are located near each other on chromosome 6 without any other known genes or coding sequences within this region. Their expression in both airways and lungs and their unique location in the genome prompted us to explore the possibility of genetically deleting these three Tas2rs.
3.2 |. Generation of Tas2r143, Tas2r135, and Tas2r126 triple knockout (Tas2r TKO) mice
The CRISPR/Cas9 gene-editing technology can precisely and efficiently modify the genomic DNA in various cells and organisms. Hence, we chose this technique to generate Tas2r knockout mice. We designed sgRNAs for Tas2r143, Tas2r135, and Tas2r126 with the algorithm as described at http://crispr.mit.edu/ and selected two specific sgRNAs for each gene (i.e., six in total for three Tas2rs) (Fig. 1B) for further testing. After validating the editing efficiency of each sgRNA in NIH3T3 cell lines (Fig 1C), we injected oocytes with a mixture of Cas9-mRNA and the six sgRNAs-RNAs. The blastocysts were then implanted into five foster mothers, and a total of 5 pups were born from 50 embryos transferred (i.e., 10% live-birth rate). Upon genotyping and sequencing, we identified three mice containing genomic editing at the cluster locus. These founders were backcrossed with wild type C57BL/6, giving rise to five lines of Tas2r(s) modified mice. Among them, two lines were triple-edited, and the remaining three lines were double-edited. In line with our goal of generating Tas2r triple knockout mice, we characterized the two triple-edited lines further.
Our sequencing results showed that the first triple-edited line had a 120 bp deletion in Tas2r143 locus between its two sgRNA locations and a massive (27 kb) deletion between the first sgRNA location of Tas2r135 and second sgRNA location of Tas2r126 (Fig. 2A, B and C). As a result, in this triple-edited line, TAS2R143 was missing 40-amino acids (from 39th to 78th in amino acid sequence) in the coded protein, TAS2R135 contained only the first seven amino acids, and TAS2R126 was missing the 1st to 45th amino acids that are coded by the first 135 bp coding sequence. A 40-amino acid deletion in Tas2r143 might only lead to an in-frame shift of the protein sequence; structure modeling, however, indicated that it removes half of the first intracellular loop, the second transmembrane α-helix and most of the first extracellular loop (Supplementary Fig. 2). Hence this 40-amino acid deletion may disrupt the function of TAS2R143. The 27 kb deletion between Tas2r135 and Tas2r126 joins the remaining 20 bp of Tas2r135 and the remaining part of Tas2r126, causing a frame-shift and early termination of translation (Supplementary Fig. 3) and thus disrupting both TAS2R135 and TAS2R126 protein sequences.
The second triple-edited line showed a 9 bp deletion in Tas2r143 around its first sgRNA location, an 11 bp deletion in Tas2r135 inside the second sgRNA location, and a 2 bp deletion in Tas2r126 (one base pair inside its second sgRNA location, and the other base pair in the PAM sequence). We named this line Tas2r143Δ9;Tas2r135Δ11;Tas2r126Δ2 mice (Supplementary Figs. 4–6). The 9 bp deletion in Tas2r143 results in a short in-frame shift, so TAS2R143 may still be functional. Both the 11 bp deletion in Tas2r135 and 2 bp deletion in Tas2r126 cause frame-shift, consequently disrupting their function.
Using the above analysis, we concluded that the first triple-edited line was better suited for further functional studies, and we named those mice Tas2r TKO mice. We then backcrossed Tas2r TKO mice with wild type C57BL/6 for eight generations to eliminate possible off-target mutants.
We performed Southern blotting to analyze further the targeted genomic regions in Tas2r TKO mice (Fig. 2D). To probe the Tas2r143 locus, genomic DNAs digested by AfeI and SphI were hybridized with probe 1. The expected bands were detected, i.e., 804 bp in wild type, 684 bp in the triple knockout, and both bands in heterologous mice (Fig. 2D, panel a). To verify the Tas2r135 locus, genomic DNAs digested by BamHI and EcoRI were hybridized with probe 2. A band of 1,917 bp was detected in wild type, and heterologous knockout mice, and no band could be detected in the TKO mice as expected (Fig. 2D, panel b). To confirm the Tas2r126 locus, genomic DNAs digested by BamHI and EcoRI were hybridized with probe 3. We detected a 1473 bp band in wild type and heterologous TKO mice and no band in the TKO mice, as expected (Fig. 2D, panel c). To confirm the ~27 kb deletion, genomic DNAs digested by XbaI were hybridized with probe 4. A 2357 bp fragment was detected in wild type mice, a 1246 bp fragment was detected in Tas2r TKO mice, and both bands were detected in heterologous TKO mice (Fig. 2D, panel d). Therefore, our Southern blotting results confirm the triple editing event in Tas2r TKO mice.
To assess the fidelity of Tas2r143, 135, and 126 deletions and the potential resultant compensation of other Tas2rs, we examined Tas2r transcripts in the large airways and lungs in Tas2r TKO mice (Fig. 2E). There were no expressions of Tas2r143, Tas2r135 or Tas2r126 in either large airways or lungs from TKO mice. Tas2r108, 117, 119, and 138 were expressed at the same level in large airways from wild type mice and TKO mice. However, compared to wild type mice, the Tas2r136 and 137 expressions in large airways from TKO mice were decreased by 88% and 67%, respectively. In the lungs, Tas2r137 expression showed no difference between wild type and TKO mice. These data demonstrated that the three targeted Tas2r genes were effectively deleted in airways and lungs and that there was altered expression for two other Tas2r genes in airways in Tas2r TKO mice.
3.3 |. Tas2r TKO mice have impaired detection of TAS2R135 and TAS2R126 ligands in the tongue.
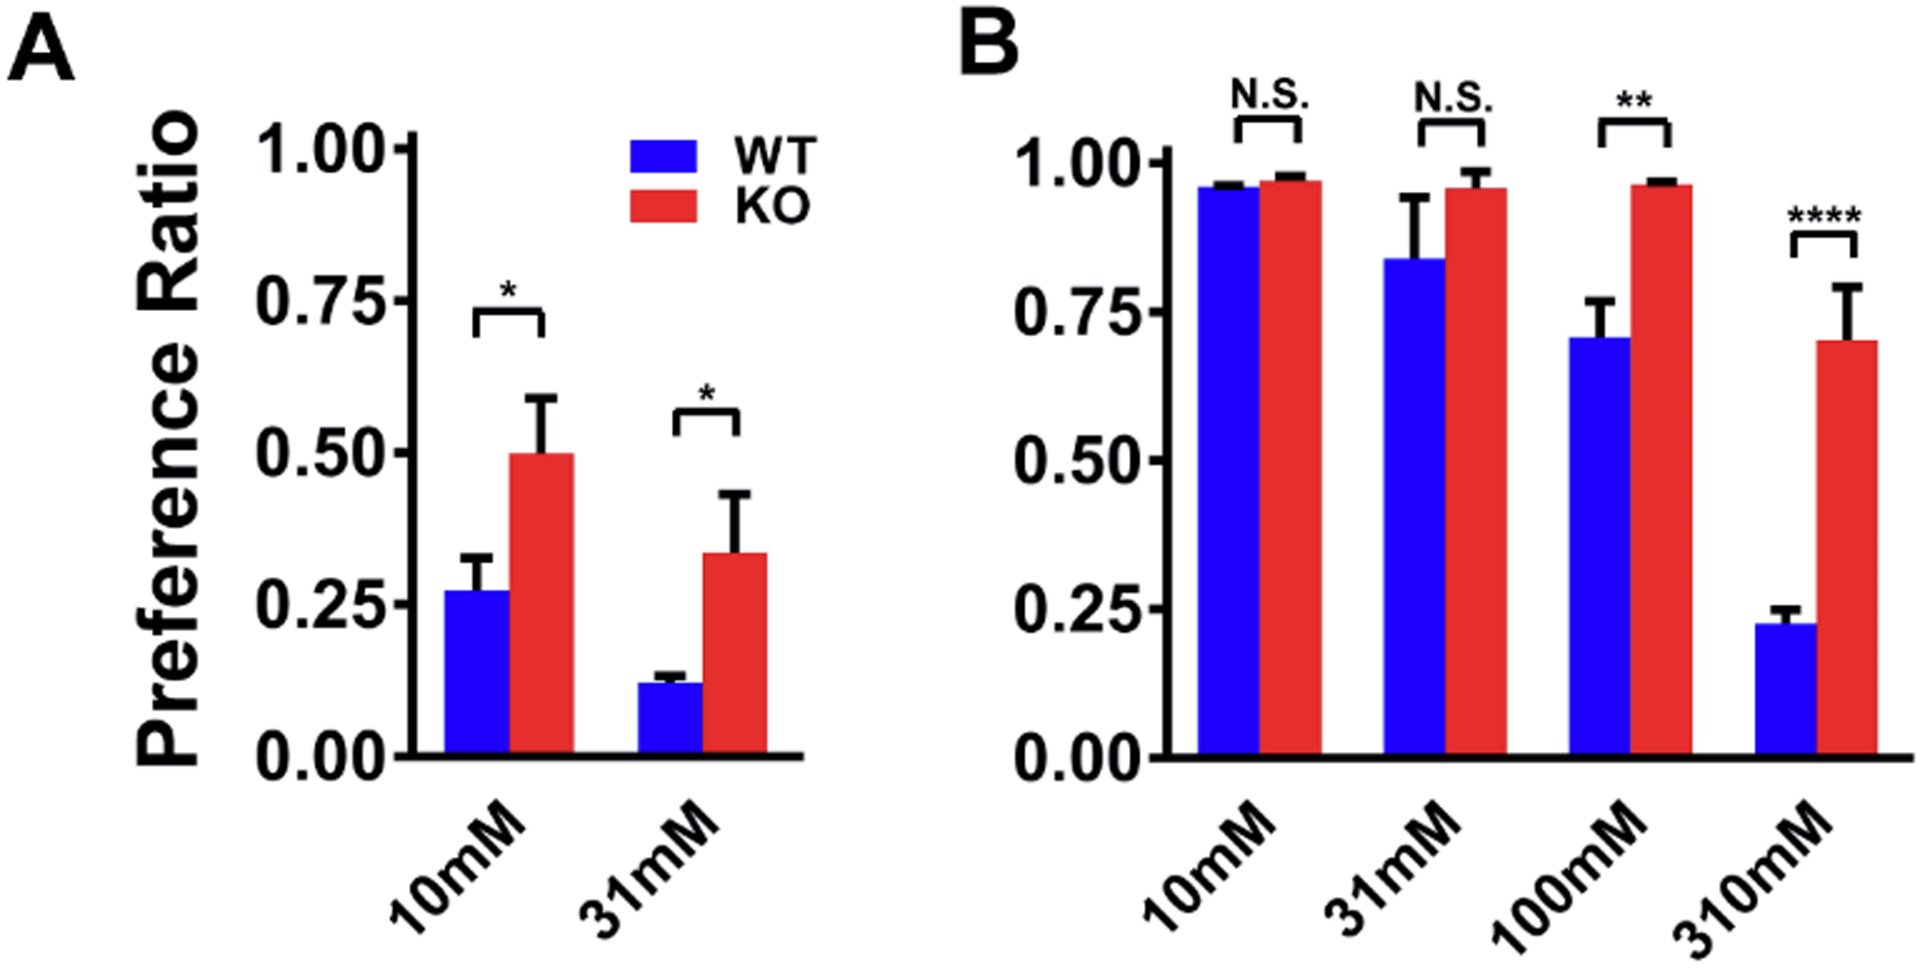
Tas2r143, Tas2r135, and Tas2r126 were initially found to express in the tongue, responsible for sensing bitter compounds that activate them (Adler et al., 2000). Therefore, we first examined whether the deletion of these Tas2rs alters the mice’s ability to recognize their corresponding bitter ligands with a standard 2-bottle taste preference assay (Ruiz et al., 2003). Only the ligands for mouse TAS2R135 and TAS2R126, but not for TAS2R143, have been reliably identified (Lossow et al., 2016). To avoid the complication of bitter ligands’ non-specific effects, we selected ligands that only activate TAS2R126 or TAS2R135 (among the 35 TAS2Rs) for testing. Doing so also minimizes any impact of altered Tas2r expression on these ligands’ responses in large airways from TKO mice. D-salicin, an agonist of TAS2R126, and acesulfame potassium, an agonist of TAS2R135, met the criteria for this line of experiments. Figure 3A shows that the preference ratios (PR) (i.e., consumed agonist solution divided by total liquid consumed) of D-salicin. At 10 mM, wild type mice (with a PR of 0.27 ± 0.05) displayed a strong avoidance of this bitter compound, while Tas2r TKO animals (with a PR of 0.50 ± 0.08) showed no avoidance. At 31 mM, wild type mice exhibited further avoidance with a PR of 0.12 ± 0.01, and Tas2r TKO mice also showed mild avoidance with a PR of 0.34 ± 0.09. However, compared to wild type mice, the TKO mice were less aversive to 31 mM D-salicin (p<0.05). For acesulfame potassium, both wild type mice and Tas2r TKO mice showed similar PRs at lower doses (i.e., 10 mM and 31 mM). It is worth noting that the PR to acesulfame potassium was greater than 0.5 because this bitter compound is also an agonist of sweet taste receptors (Damak et al., 2003; Nelson et al., 2001). However, as acesulfame potassium concentrations were raised to 100 mM and 310 mM, although the PRs in the TKO mice were decreased, it was by an amount significantly less than that in wild type (At 100 mM, 0.71 ± 0.05 in wild type vs. 0.96 ± 0.004 in TKO mice, p<0.01; at 310 mM, 0.23 ± 0.02 in wild type and 0.70 ± 0.08 in TKO mice, p<0.0001). These data are consistent with the finding that mice possess an intrinsic lingering bitter aftertaste to concentrated acesulfame (Kuhn et al., 2004). More importantly, they demonstrate that the Tas2r TKO mice have an impairment in detecting TAS2R135 and TAS2R143 ligands. The similar preference ratios of acesulfame potassium between wild type mice and Tas2r TKO mice at lower doses also indicate that the Tas2r deletion does not interfere with the sweet taste in Tas2r TKO mice. In sum, our taste preference test results strongly argue for the effectiveness and fidelity of the TAS2R ablation in Tas2r TKO mice.
Figure 3. The triple deletion of TAS2R143, TAS2R135, and TAS2R126 impairs bitter tastant intake in mice.
(A) TAS2R126 agonist D-salicin intake was significantly higher in Tas2r TKO mice. The intake preference was tested and measured by the two-bottle taste preference assay. (B) TAS2R135 agonist acesulfame potassium intake was higher in Tas2r TKO mice. Results are presented as mean ± SEM with n = 5 mice in both A and B; Statistical significances between wild type mice and Tas2r TKO mice were analyzed using two-tailed Student’s t-test (A) or two-way ANOVA with the Bonferroni test (B). N.S., no statistical significance; **P<0.01; ****P<0.0001.
3.4 |. The TAS2R143, TAS2R135, and TAS2R126 triple deletions exert no long-term effect on the airway smooth muscle’s intrinsic contractile responses.
Having established genetically and functionally the deletion of TAS2R143, TAS2R135, and TAS2R126 in Tas2r TKO mice, we went on to delineate the physiological role of these TAS2Rs in airway smooth muscle. We studied whether their deletion exerts a long-term effect that changes the airway smooth muscle’s contractile properties. We first examined this potential long-term effect using isolated trachea and mainstem bronchi, the two most commonly used airways in contraction assays. Fig. 4A shows that Mch produced the same dose-dependent contraction in isolated airways from both wild type and TKO mice (EC50 0.639 μM in WT vs. EC50 0.645 μM in TKO). Small airways have been increasingly recognized as a critical component of lung resistance and a key contributor to asthma pathogenesis (Carpaij, Burgess, Kerstjens, Nawijn, & van den Berge, 2019; Santus et al., 2020; Zinellu et al., 2019). Therefore, we investigated the potential long-term change in the contractile responses in small airways with precision-cut lung slices (Perez & Sanderson, 2005). Fig. 4B shows that Mch induced small airways to shorten to a similar extent in both WT and TKO mice at concentrations from 0.1 μM to 1.2 μM. To further evaluate the triple TAS2R deletion’s long-term effect, we compared Mch-induced lung mechanics changes in vivo between wild type and TKO mice with forced oscillometry. A significant advantage of the forced oscillometry is that lung mechanics can be assessed in vivo, and total respiratory system resistance, central airway resistance, and tissue resistance can be measured. As shown in Fig. 4C–E, no differences were detected in all three lung mechanics parameters between TKO mice and wild type mice. Hence, our analyses of airway contractility in vitro and in vivo reveal that the TAS2R143, TAS2R135, and TAS2R126 triple deletions do not alter intrinsic contractile properties of airway smooth muscle upon Mch stimulation.
3.5 |. The TAS2R143, TAS2R135, and TAS2R126 triple deletions do not affect bitter tastant-induced tracheal and main bronchial relaxation.
We next determined whether the triple TAS2R deletion impairs bitter tastant-induced airway relaxation. A commonly used protocol to test this is to contract airways followed by bitter tastant administration. Clinically, this paradigm mimics the rescue response by bronchodilators during an asthma attack. As no alteration in the Mch-induced airway contraction was detected in Tas2r TKO mice, we used Mch as the contractile agonist. 1 μM Mch (Fig. 5A and Fig. 5B) was chosen because at this level, Mch can induce a sustained contraction that lasts more than 1 hour. This time window is needed to test dose-response curves for bitter tastants. As a negative control, chloroquine, a mouse TAS2R115 agonist, dose-dependently reversed Mch-induced sustained contraction in wild type mice (Fig. 5A, left panel; Fig. 5C), and this relaxation did not show any difference in Tas2r TKO mice (Fig. 5A, right panel; Fig. 5C). To our surprise, acesulfame potassium at 3.1 mM and 31 mM contracted the airways up to 15%, and at higher concentrations it relaxed them up to ~25%. However, no differences in responses to acesulfame between wild type mice and TKO mice were detected (Fig. 5B and 5D). TAS2R135 agonists allylisothiocyanate (Fig. 5E) and phenanthroline (Fig. 5F) produced dose-dependent airway relaxations, and another TAS2R135 agonist saccharin (Fig. 5G) only slightly relaxed airways at 1 mM. However, all these TAS2R135 agonists yielded no differences in the relaxation between wild type mice and Tas2r TKO mice.
Both helicin and D-salicin activate only TAS2R126 (Lossow et al., 2016). At concentrations higher than 1 mM, helicin marginally relaxed Mch-precontracted airways from wild type mice and Tas2r TKO mice (Fig. 5H). D-salicin at concentrations less than 3.1 mM did not induce any relaxation of airways pre-contracted by Mch, but at 31 mM, it relaxed the airways by 21% in both wild-type mice and Tas2r TKO mice (Fig.5I). Epitcatechin, an agonist for TAS2R126 and TAS2R144 (Lossow et al., 2016), dose-dependently reversed Mch-induced contraction of airways from wild type mice and Tas2r TKO mice. However, this relaxation remained the same in the TKO mice (Supplementary Fig. 7A). The same relaxation pattern occurred with another TAS2R126 agonist, quinine (Fig. 5J). These findings suggest that TAS2R135 and TAS2R126 may not be functional in mediating bitter tastant-induced bronchodilation in mice.
3.6 |. The TAS2R143, TAS2R135, and TAS2R126 triple deletions do not change bitter tastant-induced relaxation of pre-contracted small airways by Mch.
Recent studies revealed that the trachea and mainstem bronchi display significant differences in contractile responses compared to small airways (Carpaij et al., 2019; Santus et al., 2020; Zinellu et al., 2019). Moreover, the small airway is a primary anatomic site of asthma pathogenesis (Bjermer, 2014; Carr, Altisheh, & Zitt, 2017). Therefore, we explored whether the triple TAS2R deletion causes any impairment in the relaxation of contracted small airways in response to bitter tastants. 400 nM Mch was chosen for this set of experiments as this concentration is around its EC50 (Fig. 4E). Fig 6A shows that 400 nM MCh induced airway contraction, decreasing lumen area by ~60% within 2 min of administration and maintaining it at ~50% of the initial size. Under continuous perfusion of 400 nM Mch, chloroquine reversed Mch-induced contraction dose-dependently (Fig. 6A and 6B). Upon removing Mch and chloroquine and recovery for 5 mins, airways contracted again in response to 400 nM Mch; this showed no toxic effect of chloroquine on the lung slices. However, chloroquine caused relaxation to the same extent in small airways from wild type mice and Tas2r TKO mice (Fig. 6B). Under the same experimental paradigm as for chloroquine, TAS2R135 agonist acesulfame potassium at concentrations below 1.0 mM produced almost no relaxation in Mch-induced contraction in small airways from wild type mice and TKO mice. However, at higher concentrations (3.1 mM – 310 mM) it contracted them dose-dependently in both wild type mice and TKO mice (Fig. 6C). Another three TAS2R135 agonists, allylisothiocyanate, phenanthroline and saccharin, all markedly relaxed small airways pre-contracted by Mch, but these relaxations were not significantly different in small airways from wild type mice and Tas2r TKO mice (Fig. 6D–6F). Both helicin and D-salicin partially reversed Mch-induced small airway contractions to the same extent in wild type mice and Tas2r TKO mice (Fig. 6G and 6H). Another two TAS2R135 agonists, quinine (Fig. 6I) and epitcatechin (supplementary Fig. 7B), relaxed Mch-induced small airway contraction to a greater extent than helicin, but no difference was detected between wild type mice and Tas2r TKO mice. These results are consistent with the findings from the isolated trachea and mainstem bronchi and reinforce that TAS2R135 and TAS2R126 may play no role in bitter tastant-induced relaxation of airways pre-contracted by Mch.
4 |. DISCUSSION
In this study, we gain insight into a long-standing question regarding the role of TAS2Rs in bitter-tastant-mediated biological responses in extraoral tissues. Since the discovery by Hofer et al. in 1996 that the gustatory G protein α-gustducin is expressed in brush cells of the stomach and duodenum in rats (Hofer et al., 1996), the idea that bitter taste signaling is involved in biological functions in extraoral tissues has been substantiated repeatedly. An astonishing number of tissues and organs express bitter taste signaling elements. Bitter tastants elicit diverse biological processes ranging from type 2 immune responses against bacterial and parasitic infection to innate immune responses against allergens, gut and thyroid hormone release, and sperm biology. Whether TAS2Rs contribute to any of the bitter tastant-induced responses in these extraoral tissues remained to be tested genetically. In this study, we took a genetic approach to examine the potential roles of TAS2Rs in extraoral biology unequivocally. We selected airway smooth muscle to test this hypothesis as bitter tastants fully reverse airway smooth muscle contraction in animals and humans from healthy and diseased conditions. However, to our surprise, the deletion of three TAS2Rs expressed in mouse airway smooth muscle exerted no effect on relaxation induced by the agonists of these TAS2Rs. This negative observation cannot be due to the ineffective disruption of these genes, as we confirmed and validated their deletion at the genomic and transcription levels (Figs. 1 and 2). More importantly, Tas2r TKO mice show marked defects in their ability to taste bitter ligands activating these receptors. Therefore, our results indicate that TAS2Rs may not play detectable roles in mediating bitter agonist-induced bronchodilation, at least in mice. These results underscore the necessity to re-examine the many other roles in extraoral tissues and organs where bitter taste signaling has been asserted to be functional.
Chloroquine and quinine used in the current study are two common bitter compounds for studying bitter tastant-induced bronchodilation. In mice, chloroquine only activates TAS2R115 among 35 mouse Tas2r genes (Lossow et al., 2016). We found no expression of this gene in mouse airway smooth muscle, so, likely, chloroquine does not activate TAS2Rs to relax mouse airway smooth muscle. Strikingly, chloroquine inhibits several ion channels, such as store-operated Ca2+ channels, IP3Rs, L-type voltage-dependent Ca2+ channels, and voltage-dependent Na+ channels (Baba, Dun, & Boyden, 2004; Capel et al., 2015; Ikhinmwin, Sofola, & Elebute, 1981; Y. F. Wu et al., 2017). In theory, inhibiting one of them could lead to airway smooth muscle relaxation. Thus chloroquine could act on one of these channels, independent of TAS2Rs, to relax mouse airways.
On the other hand, quinine is a broadly tuned TAS2R agonist that can activate mouse TAS2R105, TAS2R108, TAS2R115, TAS2R126, TAS2R137, TAS2R140 and TAS2R144 (Lossow et al., 2016). The fact that quinine relaxes airways in Tas2r TKO mice to the same level as in wild type mice could be simply due to the activation of TAS2R108 and TAS2R137, which are present in airway smooth muscle. However, just like chloroquine, quinine can inhibit several ion channels (Gees et al., 2014; Ikhinmwin et al., 1981; Michel, Wegener, & Nawrath, 2002; Wrighton, Muench, & Lippiat, 2015; Yang et al., 2014), so quinine may suppress one of these channels to cause airway relaxation in Tas2r TKO mice.
The results from Tas2r TKO mice do not favor the idea that TAS2Rs are involved in bitter tastant-mediated bronchodilation. However, previous studies targeting the downstream elements of the TAS2R signaling pathway suggested the contribution of TAS2Rs in bronchodilation. For example, in both mouse and human airway smooth muscle cells, Gβγ inhibition can partially prevent bitter tastant-induced Ca2+ responses (Deshpande et al., 2010; C.-H. Zhang et al., 2013). What might cause this discrepancy? One possibility is that downstream signaling components of TAS2Rs may be shared with non-gustatory GPCRs upon stimulation with bitter tastants. We found that Gnat3 deletion produces a marginal effect on chloroquine-induced myometrial relaxation (K. Zheng et al., 2017). In human airway smooth muscle cells, Kim et al. showed that bitter tastants activate several Gi members much more effectively than α-gustducin (Kim, Woo, Geffken, An, & Liggett, 2017). Hence bitter tastants may activate non-TAS2Rs that share the downstream elements of TAS2Rs. Interestingly, GPCR MrgprA3 can be activated directly by chloroquine (Q. Liu et al., 2009), but these receptors are only expressed in peripheral sensory neurons. It would be highly significant and useful to identify other extraoral receptors activated by chloroquine and other bitter tastants.
Many bitter compounds like quinine are broadly tuned TAS2R agonists, posing a challenge when studying the function of TAS2Rs in extraoral tissues in which multiple Tas2r genes are expressed. One strategy to overcome this challenge is to generate and use TAS2Rless mice. Mice possess 35 Tas2r genes, so it would be an extremely labor-intensive task to generate TAS2Rless mice. However, the advance in the CRISPR/Cas9 gene-editing technology and our successful deletion of three Tas2rs at once suggest it is feasible to accomplish this task. Of the 35 Tas2r genes, Tas2r119 and Tas2r134 locate on chromosome 15 and chromosome 2, while the remaining 33 members reside on chromosome 6 grouped into eight loci (Foster et al., 2013; S. V. Wu, Chen, & Rozengurt, 2005). Interestingly, beside Tas2r133, Tas2r118 and Tas2r138, which are single gene loci, the other thirty Tas2r genes form five clusters without any other functional genes within those clusters- except the longest one (~388.5 kb in length, covering 18 Tas2r genes), which has a single long non-coding RNA near one end. With this genomic organization of mouse Tas2r genes, one may be able to generate TAS2Rless mice by a series of step-wise applications of a dual-sgRNAs system targeting the five clusters followed by multiple sgRNAs targeting the other five separate individual Tas2rs. The major challenge of this approach lies in effectively deleting the most massive cluster with 18 Tas2r genes. In our study, we successfully deleted ~27 kb between two sgRNAs of Tas2r135 and Tas2r126. Others have used a combination of Cas9 and dual-targeting sgRNAs to recognize both ends of a target locus to make large somatic and heritable deletions of genomic fragments. For example, Essletzbichler et al. (2014) successfully deleted a 30 megabase (Mb) genome fragment, the largest deletion reported so far, in near-haploid human cell lines with the dual-sgRNAs system (Essletzbichler et al., 2014). In mice, several groups have generated up to 5Mb-deletion mutants by injecting two sgRNAs and Cas9 into a zygote with or without donor plasmid containing homology arms or donor single-stranded oligodeoxynucleotide containing a breakpoint sequence (Boroviak, Doe, Banerjee, Yang, & Bradley, 2016; Kato et al., 2017; Mizuno et al., 2015; L. Zhang et al., 2015). Therefore, our success in generating Tas2r TKO mutants and others’ similar endeavors suggests it is possible to generate TAS2Rless mice. These mice would be highly informative for understanding the roles of TAS2Rs in extraoral tissues.
The Tas2r TKO mice reveal that the Tas2r143, Tas2r135, and Tas2r126 cluster may not be required for bitter tastant-induced bronchodilation. However, their deletion changes the expressions of Tas2r136 and 137 but not that of Tas2r108, 117, 119, and 138 in large airways. This surprising finding implies that the three knocked out Tas2rs may play undiscovered roles regulating the expression of other Tas2rs in a receptor type-dependent manner in the airways. Potentially this regulation may be mediated via a paracrine or autocrine process because the triple Tas2r deletion alters Tas2r137 expression in large extrapulmonary airways but not in small intrapulmonary airways. The Tas2r TKO mice should be valuable in uncovering the underlying mechanisms of this regulation in the future. This mice line should also help understand this Tas2r cluster’s roles in bitter taste in the oral cavity and bitter tastant-induced biological responses in many other extraoral tissues and organs under physiological and diseased conditions. It is worth noting that Tas2r143, Tas2r135, and Tas2r126 are often expressed together in various extraoral tissues (Avau et al., 2015; Foster et al., 2013; Lund et al., 2013; K. Zheng et al., 2017). Moreover, their expression is up-regulated in rodent hearts under starvation, indicating that a common element could regulate these genes (Foster et al., 2013). Indeed, in silico analysis by detecting overlaps of histone marks and DNase-I hypersensitivity regions suggested a shared cis-regulatory area upstream of Tas2r143 (Foster et al., 2015). In addition, Tas2r TKO mice should be an attractive tool to establish the role of individual Tas2r in this cluster. For example, Tas2r126 is the only one expressed in brush cells from the murine airway and mouse stomach (S. Liu et al., 2017; Tizzano, Cristofoletti, Sbarbati, & Finger, 2011); Tas2r135 was in the top six up-regulated genes in anti-LIF-treated mice compared with control mice with pneumonia (Quinton et al., 2012); And Tas2r143 was up-regulated in the gut’s tuft cells upon Trichinella spiralis infection or by IL-13 treatment in the intestinal organoids (Luo et al., 2019). Tas2r TKO mice would allow us to test whether these three types of TAS2Rs are indeed required for biological changes under these conditions.
In conclusion, we used the CRISPR/Cas9 gene-editing technique to effectively delete at once three major TAS2Rs expressed in airway smooth muscle and several other tissues. However, the TAS2R triple deletion does not impact the bronchodilation induced by TAS2R agonists of these receptors. These results indicate that TAS2Rs may not play a physiological role in airway smooth muscle, and novel yet unknown mechanisms may be involved in bitter tastant-induced bronchodilation. Our results further underscore the necessity and importance of using genetic approaches to re-evaluate the asserted roles of bitter taste signaling in other extraoral tissues and organs in health and disease.
Supplementary Material
Suppl. Figure 1. The comparison of different methods for eliminating genomic DNA contaminations. The primers used for RT-PCR with different kits were the same for genotyping Tas2r143 (A), Tas2r135 (B) and Tas2r126 (C). Lanes 1 and 2: the RNAs were generated by Kit [RNeasy MinElute Cleanup Kit (Cat# 74204)] from Qiagen, which eliminates genomic DNAs by column binding; Lanes 3 and 4: the RNAs were produced by Kits [PureLink™ RNA Mini kit (Cat# 12183018A) combining with PureLink™ DNase (Cat# 12185–010)] from Invitrogen, which eliminates genomic DNAs by on-column DNase digestion.; Lanes 5 and 6: the RNAs were generated by kits with a combination of Trizol and Basal-ZERO; Lane 7: negative control with ddH2O as the template. The PCR cycle was 40. “+” represents reverse transcriptase was added when synthesizing cDNA; “-” no reverse transcriptase was added. The efficiency in eliminating genomes DNA: Basal-ZERO > Invitrogen > Qiagen.
Suppl. Figure 2. A TAS2R143 model (A) predicts the TASR143 mutant will be missing half of the first intracellular loop, the second α-helix, and most of the first extracellular loop (purple in A) due to the 40-aa (from 39th to 78th) deletion in the TAS2R143 mutant (B) in Tas2r TKO mice. Because no TAS2R atomic structure is available, 5a8e.1.A.pdb was automatically selected by the algorithm for its similarity to TAS2R143 and utilized as the template.
Suppl. Figure 3. A fusion of Tas2r135 and Tas2r126 due to the large segment (~27 kb) deletion disrupts both genes in Tas2r TKO mice. Red sequences are the remaining part from Tas2r135, blue from Tas2r126, and the stop codon is underlined and italicized.
Suppl. Figure 4. Sequences across the targeting region of Tas2r143 confirm the deletion of 9 bp in the triple-edited Tas2r143Δ9;Tas2r135Δ11;Tas2r126Δ2 mice. Underlined are the deleted nine nucleotides in the Tas2r143 mutant. In the DNA sequences, the blue highlighted region is the location of the sgRNA, and the red one is the location of PAM.
Suppl. Figure 5. Sequences across the targeting region of Tas2r135 confirm the deletion of 11 bp in the triple-edited Tas2r143Δ9;Tas2r135Δ11;Tas2r126Δ2 mice. The underlined region is the deleted 11 nucleotides in the Tas2r135 mutant. In the DNA sequences, the blue highlighted region is the location of the sgRNA, and the red one is PAM’s location.
Suppl. Figure 6. Sequences across the targeting region of Tas2r126 confirm the deletion of 2 bp in the triple-edited Tas2r143Δ9;Tas2r135Δ11;Tas2r126Δ2 mice. The underlined region is the deleted two nucleotides in the Tas2r126 mutant. In the DNA sequences, the blue highlighted region is the location of sgRNA, and the red one is the location of PAM.
Suppl. Figure 7. TAS2R126 ligand epicatechin-induced relaxation of the trachea and mainstem bronchi (A) and small airways (B) pre-contracted by Mch in wild type mice and Tas2r TKO mice (For A, n=12 for each group, p=0.361; For B, n= 9 mice for WT and 15 for KO, p=0.46 at 0.1 mM and 0.38 at 1 mM). No statistical significance between wild type mice and Tas2r TKO mice was detected using two-way ANOVA with the Bonferroni post-hoc test (A) or two-tailed Student’s t-test (B).
ACKNOWLEDGMENTS
We thank the Transgenic Animal Modeling Core at UMMS for their help generating Tas2r TKO mice and Feng He at UMMS for his insightful suggestions and discussion. The study is supported by NIH grants (RO1HL117104 and R01HL139686 to RZ).
Footnotes
CONFLICT OF INTERESTS
The authors declare that there are no conflict of interests
REFERENCES
- Adler E, Hoon MA, Mueller KL, Chandrashekar J, Ryba NJ, & Zuker CS (2000). A novel family of mammalian taste receptors. Cell, 100(6), 693–702. doi: 10.1016/s0092-8674(00)80705-9 [DOI] [PubMed] [Google Scholar]
- An SS, Wang WC, Koziol-White CJ, Ahn K, Lee DY, Kurten RC, … Liggett SB (2012). TAS2R activation promotes airway smooth muscle relaxation despite beta(2)-adrenergic receptor tachyphylaxis. Am J Physiol Lung Cell Mol Physiol, 303(4), L304–311. doi: 10.1152/ajplung.00126.2012 [DOI] [PMC free article] [PubMed] [Google Scholar]
- Avau B, Bauters D, Steensels S, Vancleef L, Laermans J, Lesuisse J, … Depoortere I (2015). The Gustatory Signaling Pathway and Bitter Taste Receptors Affect the Development of Obesity and Adipocyte Metabolism in Mice. PLoS One, 10(12), e0145538. doi: 10.1371/journal.pone.0145538 [DOI] [PMC free article] [PubMed] [Google Scholar]
- Baba S, Dun W, & Boyden PA (2004). Can PKA activators rescue Na+ channel function in epicardial border zone cells that survive in the infarcted canine heart? Cardiovasc Res, 64(2), 260–267. doi: 10.1016/j.cardiores.2004.06.021 [DOI] [PubMed] [Google Scholar]
- Bjermer L (2014). The role of small airway disease in asthma. Current opinion in pulmonary medicine, 20(1), 23–30. doi: 10.1097/MCP.0000000000000018 [DOI] [PubMed] [Google Scholar]
- Boroviak K, Doe B, Banerjee R, Yang F, & Bradley A (2016). Chromosome engineering in zygotes with CRISPR/Cas9. Genesis, 54(2), 78–85. doi: 10.1002/dvg.22915 [DOI] [PMC free article] [PubMed] [Google Scholar]
- Capel RA, Herring N, Kalla M, Yavari A, Mirams GR, Douglas G, … Burton RA (2015). Hydroxychloroquine reduces heart rate by modulating the hyperpolarization-activated current If: Novel electrophysiological insights and therapeutic potential. Heart rhythm : the official journal of the Heart Rhythm Society, 12(10), 2186–2194. doi: 10.1016/j.hrthm.2015.05.027 [DOI] [PMC free article] [PubMed] [Google Scholar]
- Carpaij OA, Burgess JK, Kerstjens HAM, Nawijn MC, & van den Berge M (2019). A review on the pathophysiology of asthma remission. Pharmacology & therapeutics, 201, 8–24. doi: 10.1016/j.pharmthera.2019.05.002 [DOI] [PubMed] [Google Scholar]
- Carr TF, Altisheh R, & Zitt M (2017). Small airways disease and severe asthma. World Allergy Organ J, 10(1), 20. doi: 10.1186/s40413-017-0153-4 [DOI] [PMC free article] [PubMed] [Google Scholar]
- Chandrashekar J, Mueller KL, Hoon MA, Adler E, Feng L, Guo W, … Ryba NJ (2000). T2Rs function as bitter taste receptors. Cell, 100(6), 703–711. doi:S0092–8674(00)80706–0 [pii] [DOI] [PubMed] [Google Scholar]
- Choi JH, & Kim J (2019). TAS2R38 Bitterness Receptor Genetic Variation and Risk of Gastrointestinal Neoplasm: A Meta-Analysis. Nutr Cancer, 71(4), 585–593. doi: 10.1080/01635581.2018.1559935 [DOI] [PubMed] [Google Scholar]
- Cui Y, Wu H, Li Q, Liao J, Gao P, Sun F, … Zhu Z (2019). Impairment of Bitter Taste Sensor Transient Receptor Potential Channel M5-Mediated Aversion Aggravates High-Salt Intake and Hypertension. Hypertension, 74(4), 1021–1032. doi: 10.1161/HYPERTENSIONAHA.119.13358 [DOI] [PubMed] [Google Scholar]
- Damak S, Rong M, Yasumatsu K, Kokrashvili Z, Varadarajan V, Zou S, … Margolskee RF (2003). Detection of sweet and umami taste in the absence of taste receptor T1r3. Science, 301(5634), 850–853. doi: 10.1126/science.1087155 [DOI] [PubMed] [Google Scholar]
- Deckmann K, Filipski K, Krasteva-Christ G, Fronius M, Althaus M, Rafiq A, … Kummer W (2014). Bitter triggers acetylcholine release from polymodal urethral chemosensory cells and bladder reflexes. Proc Natl Acad Sci U S A, 111(22), 8287–8292. doi: 10.1073/pnas.1402436111 [DOI] [PMC free article] [PubMed] [Google Scholar]
- Dehkordi O, Rose JE, Fatemi M, Allard JS, Balan KV, Young JK, … Jayam-Trouth A (2012). Neuronal expression of bitter taste receptors and downstream signaling molecules in the rat brainstem. Brain Res, 1475, 1–10. doi: 10.1016/j.brainres.2012.07.038 [DOI] [PubMed] [Google Scholar]
- Deshpande DA, Wang WC, McIlmoyle EL, Robinett KS, Schillinger RM, An SS, … Liggett SB (2010). Bitter taste receptors on airway smooth muscle bronchodilate by localized calcium signaling and reverse obstruction. Nat Med, 16(11), 1299–1304. doi: 10.1038/nm.2237 [DOI] [PMC free article] [PubMed] [Google Scholar]
- Dotson CD, Wallace MR, Bartoshuk LM, & Logan HL (2012). Variation in the gene TAS2R13 is associated with differences in alcohol consumption in patients with head and neck cancer. Chem Senses, 37(8), 737–744. doi: 10.1093/chemse/bjs063 [DOI] [PMC free article] [PubMed] [Google Scholar]
- Duarte AC, Rosado T, Costa AR, Santos J, Gallardo E, Quintela T, … Santos CRA (2020). The bitter taste receptor TAS2R14 regulates resveratrol transport across the human blood-cerebrospinal fluid barrier. Biochem Pharmacol, 177, 113953. doi: 10.1016/j.bcp.2020.113953 [DOI] [PubMed] [Google Scholar]
- Essletzbichler P, Konopka T, Santoro F, Chen D, Gapp BV, Kralovics R, … Bürckstümmer T (2014). Megabase-scale deletion using CRISPR/Cas9 to generate a fully haploid human cell line. Genome Res, 24(12), 2059–2065. doi: 10.1101/gr.177220.114 [DOI] [PMC free article] [PubMed] [Google Scholar]
- Finger TE, Danilova V, Barrows J, Bartel DL, Vigers AJ, Stone L, … Kinnamon SC (2005). ATP signaling is crucial for communication from taste buds to gustatory nerves. Science, 310(5753), 1495–1499. doi: 10.1126/science.1118435 [DOI] [PubMed] [Google Scholar]
- Foster SR, Porrello ER, Purdue B, Chan HW, Voigt A, Frenzel S, … Thomas WG (2013). Expression, regulation and putative nutrient-sensing function of taste GPCRs in the heart. PLoS One, 8(5), e64579. doi: 10.1371/journal.pone.0064579 [DOI] [PMC free article] [PubMed] [Google Scholar]
- Foster SR, Porrello ER, Stefani M, Smith NJ, Molenaar P, dos Remedios CG, … Ramialison M (2015). Cardiac gene expression data and in silico analysis provide novel insights into human and mouse taste receptor gene regulation. Naunyn Schmiedebergs Arch Pharmacol, 388(10), 1009–1027. doi: 10.1007/s00210-015-1118-1 [DOI] [PubMed] [Google Scholar]
- Fu Y, Sander JD, Reyon D, Cascio VM, & Joung JK (2014). Improving CRISPR-Cas nuclease specificity using truncated guide RNAs. Nat Biotechnol, 32(3), 279–284. doi: 10.1038/nbt.2808 [DOI] [PMC free article] [PubMed] [Google Scholar]
- Garcia-Esparcia P, Schluter A, Carmona M, Moreno J, Ansoleaga B, Torrejon-Escribano B, … Ferrer I (2013). Functional genomics reveals dysregulation of cortical olfactory receptors in Parkinson disease: novel putative chemoreceptors in the human brain. Journal of neuropathology and experimental neurology, 72(6), 524–539. doi: 10.1097/NEN.0b013e318294fd76 [DOI] [PubMed] [Google Scholar]
- Gees M, Alpizar YA, Luyten T, Parys JB, Nilius B, Bultynck G, … Talavera K (2014). Differential effects of bitter compounds on the taste transduction channels TRPM5 and IP3 receptor type 3. Chem Senses, 39(4), 295–311. doi: 10.1093/chemse/bjt115 [DOI] [PubMed] [Google Scholar]
- Governini L, Semplici B, Pavone V, Crifasi L, Marrocco C, De Leo V, … Piomboni P (2020). Expression of Taste Receptor 2 Subtypes in Human Testis and Sperm. J Clin Med, 9(1). doi: 10.3390/jcm9010264 [DOI] [PMC free article] [PubMed] [Google Scholar]
- Grassin-Delyle S, Salvator H, Mantov N, Abrial C, Brollo M, Faisy C, … Devillier P (2019). Bitter Taste Receptors (TAS2Rs) in Human Lung Macrophages: Receptor Expression and Inhibitory Effects of TAS2R Agonists. Frontiers in physiology, 10, 1267. doi: 10.3389/fphys.2019.01267 [DOI] [PMC free article] [PubMed] [Google Scholar]
- He F, & Jacobson A (1995). Identification of a novel component of the nonsense-mediated mRNA decay pathway by use of an interacting protein screen. Genes Dev, 9(4), 437–454. doi: 10.1101/gad.9.4.437 [DOI] [PubMed] [Google Scholar]
- Hofer D, Puschel B, & Drenckhahn D (1996). Taste receptor-like cells in the rat gut identified by expression of alpha-gustducin. Proc Natl Acad Sci U S A, 93(13), 6631–6634. doi: 10.1073/pnas.93.13.6631 [DOI] [PMC free article] [PubMed] [Google Scholar]
- Hollenhorst MI, Jurastow I, Nandigama R, Appenzeller S, Li L, Vogel J, … Krasteva-Christ G (2020). Tracheal brush cells release acetylcholine in response to bitter tastants for paracrine and autocrine signaling. FASEB J, 34(1), 316–332. doi: 10.1096/fj.201901314RR [DOI] [PubMed] [Google Scholar]
- Howitt MR, Lavoie S, Michaud M, Blum AM, Tran SV, Weinstock JV, … Garrett WS (2016). Tuft cells, taste-chemosensory cells, orchestrate parasite type 2 immunity in the gut. Science, 351(6279), 1329–1333. doi: 10.1126/science.aaf1648 [DOI] [PMC free article] [PubMed] [Google Scholar]
- Huang YA, & Roper SD (2010). Intracellular Ca(2+) and TRPM5-mediated membrane depolarization produce ATP secretion from taste receptor cells. J Physiol, 588(Pt 13), 2343–2350. doi: 10.1113/jphysiol.2010.191106 [DOI] [PMC free article] [PubMed] [Google Scholar]
- Ikhinmwin MK, Sofola OA, & Elebute O (1981). The effects of calcium ions on the depression of cardiac contractility by chloroquine and quinine. Eur J Pharmacol, 69(4), 507–510. doi: 10.1016/0014-2999(81)90458-1 [DOI] [PubMed] [Google Scholar]
- Janssen S, Laermans J, Verhulst PJ, Thijs T, Tack J, & Depoortere I (2011). Bitter taste receptors and alpha-gustducin regulate the secretion of ghrelin with functional effects on food intake and gastric emptying. Proc Natl Acad Sci U S A, 108(5), 2094–2099. doi: 10.1073/pnas.1011508108 [DOI] [PMC free article] [PubMed] [Google Scholar]
- Kaji I, Karaki S, Fukami Y, Terasaki M, & Kuwahara A (2009). Secretory effects of a luminal bitter tastant and expressions of bitter taste receptors, T2Rs, in the human and rat large intestine. Am J Physiol Gastrointest Liver Physiol, 296(5), G971–981. doi: 10.1152/ajpgi.90514.2008 [DOI] [PubMed] [Google Scholar]
- Kato T, Hara S, Goto Y, Ogawa Y, Okayasu H, Kubota S, … Takada S (2017). Creation of mutant mice with megabase-sized deletions containing custom-designed breakpoints by means of the CRISPR/Cas9 system. Sci Rep, 7(1), 59. doi: 10.1038/s41598-017-00140-9 [DOI] [PMC free article] [PubMed] [Google Scholar]
- Keeler AM, Liu D, Zieger M, Xiong L, Salemi J, Bellvé K, … ElMallah MK (2017). Airway smooth muscle dysfunction in Pompe (Gaa(−/−) ) mice. Am J Physiol Lung Cell Mol Physiol(1522–1504 (Electronic)). [DOI] [PMC free article] [PubMed] [Google Scholar]
- Kim D, Woo JA, Geffken E, An SS, & Liggett SB (2017). Coupling of Airway Smooth Muscle Bitter Taste Receptors to Intracellular Signaling and Relaxation Is via G(αi1,2,3). Am J Respir Cell Mol Biol, 56(6), 762–771. doi: 10.1165/rcmb.2016-0373OC [DOI] [PMC free article] [PubMed] [Google Scholar]
- Kuhn C, Bufe B, Winnig M, Hofmann T, Frank O, Behrens M, … Meyerhof W (2004). Bitter taste receptors for saccharin and acesulfame K. J Neurosci, 24(45), 10260–10265. doi: 10.1523/jneurosci.1225-04.2004 [DOI] [PMC free article] [PubMed] [Google Scholar]
- Lee RJ, Xiong G, Kofonow JM, Chen B, Lysenko A, Jiang P, … Cohen NA (2012). T2R38 taste receptor polymorphisms underlie susceptibility to upper respiratory infection. The Journal of Clinical Investigation. doi: 10.1172/JCI64240 [DOI] [PMC free article] [PubMed] [Google Scholar]
- Liu Q, Tang Z, Surdenikova L, Kim S, Patel KN, Kim A, … Dong X (2009). Sensory neuron-specific GPCR Mrgprs are itch receptors mediating chloroquine-induced pruritus. Cell, 139(7), 1353–1365. doi: 10.1016/j.cell.2009.11.034 [DOI] [PMC free article] [PubMed] [Google Scholar]
- Liu S, Lu S, Xu R, Atzberger A, Günther S, Wettschureck N, & Offermanns S (2017). Members of Bitter Taste Receptor Cluster Tas2r143/Tas2r135/Tas2r126 Are Expressed in the Epithelium of Murine Airways and Other Non-gustatory Tissues. Front Physiol, 8, 849. doi: 10.3389/fphys.2017.00849 [DOI] [PMC free article] [PubMed] [Google Scholar]
- Liu X, Gu F, Jiang L, Chen F, & Li F (2015). Expression of bitter taste receptor Tas2r105 in mouse kidney. Biochem Biophys Res Commun, 458(4), 733–738. doi: 10.1016/j.bbrc.2015.01.089 [DOI] [PubMed] [Google Scholar]
- Lossow K, Hubner S, Roudnitzky N, Slack JP, Pollastro F, Behrens M, & Meyerhof W (2016). Comprehensive Analysis of Mouse Bitter Taste Receptors Reveals Different Molecular Receptive Ranges for Orthologous Receptors in Mice and Humans. J Biol Chem, 291(29), 15358–15377. doi: 10.1074/jbc.M116.718544 [DOI] [PMC free article] [PubMed] [Google Scholar]
- Lund TC, Kobs AJ, Kramer A, Nyquist M, Kuroki MT, Osborn J, … Tolar J (2013). Bone marrow stromal and vascular smooth muscle cells have chemosensory capacity via bitter taste receptor expression. PLoS One, 8(3), e58945. doi: 10.1371/journal.pone.0058945 [DOI] [PMC free article] [PubMed] [Google Scholar]
- Luo XC, Chen ZH, Xue JB, Zhao DX, Lu C, Li YH, … Huang L (2019). Infection by the parasitic helminth Trichinella spiralis activates a Tas2r-mediated signaling pathway in intestinal tuft cells. Proc Natl Acad Sci U S A, 116(12), 5564–5569. doi: 10.1073/pnas.1812901116 [DOI] [PMC free article] [PubMed] [Google Scholar]
- Malki A, Fiedler J, Fricke K, Ballweg I, Pfaffl MW, & Krautwurst D (2015). Class I odorant receptors, TAS1R and TAS2R taste receptors, are markers for subpopulations of circulating leukocytes. Journal of leukocyte biology, 97(3), 533–545. doi: 10.1189/jlb.2A0714-331RR [DOI] [PMC free article] [PubMed] [Google Scholar]
- Manson ML, Safholm J, Al-Ameri M, Bergman P, Orre AC, Sward K, … Adner M (2014). Bitter taste receptor agonists mediate relaxation of human and rodent vascular smooth muscle. Eur J Pharmacol, 740, 302–311. doi: 10.1016/j.ejphar.2014.07.005 [DOI] [PubMed] [Google Scholar]
- Martin LTP, Nachtigal MW, Selman T, Nguyen E, Salsman J, Dellaire G, & Dupre DJ (2019). Bitter taste receptors are expressed in human epithelial ovarian and prostate cancers cells and noscapine stimulation impacts cell survival. Mol Cell Biochem, 454(1–2), 203–214. doi: 10.1007/s11010-018-3464-z [DOI] [PubMed] [Google Scholar]
- Ma Z, Taruno A, Ohmoto M, Jyotaki M, Lim JC, Miyazaki H, … Foskett JK (2018). CALHM3 Is Essential for Rapid Ion Channel-Mediated Purinergic Neurotransmission of GPCR-Mediated Tastes. Neuron, 98(3), 547–561. doi: 10.1016/j.neuron.2018.03.043 [DOI] [PMC free article] [PubMed] [Google Scholar]
- McGovern TK, Robichaud A, Fereydoonzad L, Schuessler TF, & Martin JG (2013). Evaluation of respiratory system mechanics in mice using the forced oscillation technique. J Vis Exp(75), e50172. doi: 10.3791/50172 [DOI] [PMC free article] [PubMed] [Google Scholar]
- Michel D, Wegener JW, & Nawrath H (2002). Effects of quinine and quinidine on the transient outward and on the L-type Ca(2+) current in rat ventricular cardiomyocytes. Pharmacology, 65(4), 187–192. doi: 10.1159/000064342 [DOI] [PubMed] [Google Scholar]
- Mizuno S, Takami K, Daitoku Y, Tanimoto Y, Dinh TT, Mizuno-Iijima S, … Yagami K (2015). Peri-implantation lethality in mice carrying megabase-scale deletion on 5qc3.3 is caused by Exoc1 null mutation. Sci Rep, 5, 13632. doi: 10.1038/srep13632 [DOI] [PMC free article] [PubMed] [Google Scholar]
- Mueller KL, Hoon MA, Erlenbach I, Chandrashekar J, Zuker CS, & Ryba NJ (2005). The receptors and coding logic for bitter taste. Nature, 434(7030), 225–229. doi: 10.1038/nature03352 [DOI] [PubMed] [Google Scholar]
- Nelson G, Hoon MA, Chandrashekar J, Zhang Y, Ryba NJ, & Zuker CS (2001). Mammalian sweet taste receptors. Cell, 106(3), 381–390. doi: 10.1016/s0092-8674(01)00451-2 [DOI] [PubMed] [Google Scholar]
- Orsmark-Pietras C, James A, Konradsen JR, Nordlund B, Soderhall C, Pulkkinen V, … Melen E (2013). Transcriptome analysis reveals upregulation of bitter taste receptors in severe asthmatics. Eur Respir J, 42(1), 65–78. doi: 10.1183/09031936.00077712 [DOI] [PubMed] [Google Scholar]
- Peng Y, Gillis-Smith S, Jin H, Trankner D, Ryba NJ, & Zuker CS (2015). Sweet and bitter taste in the brain of awake behaving animals. Nature, 527(7579), 512–515. doi: 10.1038/nature15763 [DOI] [PMC free article] [PubMed] [Google Scholar]
- Perez JF, & Sanderson MJ (2005). The frequency of calcium oscillations induced by 5-HT, ACH, and KCl determine the contraction of smooth muscle cells of intrapulmonary bronchioles. J Gen Physiol, 125(6), 535–553. doi: 10.1085/jgp.200409216 [DOI] [PMC free article] [PubMed] [Google Scholar]
- Pulkkinen V, Manson ML, Safholm J, Adner M, & Dahlen SE (2012). The bitter taste receptor (TAS2R) agonists denatonium and chloroquine display distinct patterns of relaxation of the guinea pig trachea. Am J Physiol Lung Cell Mol Physiol, 303(11), L956–966. doi: 10.1152/ajplung.00205.2012 [DOI] [PubMed] [Google Scholar]
- Quinton LJ, Mizgerd JP, Hilliard KL, Jones MR, Kwon CY, & Allen E (2012). Leukemia inhibitory factor signaling is required for lung protection during pneumonia. J Immunol, 188(12), 6300–6308. doi: 10.4049/jimmunol.1200256 [DOI] [PMC free article] [PubMed] [Google Scholar]
- Rajkumar P, Aisenberg WH, Acres OW, Protzko RJ, & Pluznick JL (2014). Identification and characterization of novel renal sensory receptors. PLoS ONE, 9(10), e111053. doi: 10.1371/journal.pone.0111053 [DOI] [PMC free article] [PubMed] [Google Scholar]
- Ran FA, Hsu PD, Wright J, Agarwala V, Scott DA, & Zhang F (2013). Genome engineering using the CRISPR-Cas9 system. Nat Protoc, 8(11), 2281–2308. doi: 10.1038/nprot.2013.143 [DOI] [PMC free article] [PubMed] [Google Scholar]
- Raz T, Kapranov P, Lipson D, Letovsky S, Milos PM, & Thompson JF (2011). Protocol dependence of sequencing-based gene expression measurements. PLoS One, 6(5), e19287. doi: 10.1371/journal.pone.0019287 [DOI] [PMC free article] [PubMed] [Google Scholar]
- Ruiz CJ, Wray K, Delay E, Margolskee RF, & Kinnamon SC (2003). Behavioral evidence for a role of alpha-gustducin in glutamate taste. Chem Senses, 28(7), 573–579. doi: 10.1093/chemse/bjg049 [DOI] [PubMed] [Google Scholar]
- Santus P, Radovanovic D, Pecchiari M, Ferrando M, Tursi F, Patella V, & Braido F (2020). The Relevance of Targeting Treatment to Small Airways in Asthma and COPD. Respiratory care. doi: 10.4187/respcare.07237 [DOI] [PubMed] [Google Scholar]
- Schembre SM, Cheng I, Wilkens LR, Albright CL, & Marchand le L (2013). Variations in bitter-taste receptor genes, dietary intake, and colorectal adenoma risk. Nutr Cancer, 65(7), 982–990. doi: 10.1080/01635581.2013.807934 [DOI] [PMC free article] [PubMed] [Google Scholar]
- Shah AS, Ben-Shahar Y, Moninger TO, Kline JN, & Welsh MJ (2009). Motile cilia of human airway epithelia are chemosensory. Science, 325(5944), 1131–1134. doi:1173869 [pii] 10.1126/science.1173869 [DOI] [PMC free article] [PubMed] [Google Scholar]
- Singh N, Vrontakis M, Parkinson F, & Chelikani P (2011). Functional bitter taste receptors are expressed in brain cells. Biochem Biophys Res Commun, 406(1), 146–151. doi: 10.1016/j.bbrc.2011.02.016 [DOI] [PubMed] [Google Scholar]
- Tan X, & Sanderson MJ (2014). Bitter tasting compounds dilate airways by inhibiting airway smooth muscle calcium oscillations and calcium sensitivity. Br J Pharmacol, 171(3), 646–662. doi: 10.1111/bph.12460 [DOI] [PMC free article] [PubMed] [Google Scholar]
- Taruno A, Vingtdeux V, Ohmoto M, Ma Z, Dvoryanchikov G, Li A, … Foskett JK (2013). CALHM1 ion channel mediates purinergic neurotransmission of sweet, bitter and umami tastes. Nature, 495(7440), 223–226. doi: 10.1038/nature11906 [DOI] [PMC free article] [PubMed] [Google Scholar]
- Tizzano M, Cristofoletti M, Sbarbati A, & Finger TE (2011). Expression of taste receptors in solitary chemosensory cells of rodent airways. BMC Pulm Med, 11, 3. doi: 10.1186/1471-2466-11-3 [DOI] [PMC free article] [PubMed] [Google Scholar]
- Tran HTT, Herz C, Ruf P, Stetter R, & Lamy E (2018). Human T2R38 Bitter Taste Receptor Expression in Resting and Activated Lymphocytes. Frontiers in immunology, 9, 2949. doi: 10.3389/fimmu.2018.02949 [DOI] [PMC free article] [PubMed] [Google Scholar]
- von Moltke J, Ji M, Liang HE, & Locksley RM (2016). Tuft-cell-derived IL-25 regulates an intestinal ILC2-epithelial response circuit. Nature, 529(7585), 221–225. doi: 10.1038/nature16161 [DOI] [PMC free article] [PubMed] [Google Scholar]
- Wong GT, Gannon KS, & Margolskee RF (1996). Transduction of bitter and sweet taste by gustducin. Nature, 381(6585), 796–800. doi: 10.1038/381796a0 [DOI] [PubMed] [Google Scholar]
- Wrighton DC, Muench SP, & Lippiat JD (2015). Mechanism of inhibition of mouse Slo3 (KCa 5.1) potassium channels by quinine, quinidine and barium. Br J Pharmacol, 172(17), 4355–4363. doi: 10.1111/bph.13214 [DOI] [PMC free article] [PubMed] [Google Scholar]
- Wu SV, Chen MC, & Rozengurt E (2005). Genomic organization, expression, and function of bitter taste receptors (T2R) in mouse and rat. Physiol Genomics, 22(2), 139–149. doi: 10.1152/physiolgenomics.00030.2005 [DOI] [PubMed] [Google Scholar]
- Wu SV, Rozengurt N, Yang M, Young SH, Sinnett-Smith J, & Rozengurt E (2002). Expression of bitter taste receptors of the T2R family in the gastrointestinal tract and enteroendocrine STC-1 cells. Proc Natl Acad Sci U S A, 99(4), 2392–2397. doi: 10.1073/pnas.042617699 [DOI] [PMC free article] [PubMed] [Google Scholar]
- Wu YF, Zhao P, Luo X, Xu JC, Xue L, Zhou Q, … Liu QH (2017). Chloroquine inhibits Ca(2+) permeable ion channels-mediated Ca(2+) signaling in primary B lymphocytes. Cell Biosci, 7, 28. doi: 10.1186/s13578-017-0155-5 [DOI] [PMC free article] [PubMed] [Google Scholar]
- Xu J, Cao J, Iguchi N, Riethmacher D, & Huang L (2013). Functional characterization of bitter-taste receptors expressed in mammalian testis. Mol Hum Reprod, 19(1), 17–28. doi: 10.1093/molehr/gas040 [DOI] [PMC free article] [PubMed] [Google Scholar]
- Yamaki M, Saito H, Isono K, Goto T, Shirakawa H, Shoji N, … Komai M (2017). Genotyping Analysis of Bitter-Taste Receptor Genes TAS2R38 and TAS2R46 in Japanese Patients with Gastrointestinal Cancers. Journal of nutritional science and vitaminology, 63(2), 148–154. doi: 10.3177/jnsv.63.148 [DOI] [PubMed] [Google Scholar]
- Yang N, Lei Z, Li X, Zhao J, Liu T, Ning N, … Li J (2014). Chloroquine stimulates Cl- secretion by Ca2+ activated Cl- channels in rat ileum. PLoS ONE, 9(1), e87627. doi: 10.1371/journal.pone.0087627 [DOI] [PMC free article] [PubMed] [Google Scholar]
- Zhang C-H, Lifshitz LM, Uy KF, Ikebe M, Fogarty KE, & R. Z (2013). The Cellular and Molecular Basis of Bitter Tastant-induced Bronchodilation. PLOS Biology, 11(3):e1001501. [DOI] [PMC free article] [PubMed] [Google Scholar]
- Zhang L, Jia R, Palange NJ, Satheka AC, Togo J, An Y, … Zheng Y (2015). Large genomic fragment deletions and insertions in mouse using CRISPR/Cas9. PLoS One, 10(3), e0120396. doi: 10.1371/journal.pone.0120396 [DOI] [PMC free article] [PubMed] [Google Scholar]
- Zheng K, Lu P, Delpapa E, Bellve K, Deng R, Condon JC, … ZhuGe R (2017). Bitter taste receptors as targets for tocolytics in preterm labor therapy. Faseb j, 31(9), 4037–4052. doi: 10.1096/fj.201601323RR [DOI] [PMC free article] [PubMed] [Google Scholar]
- Zheng X, Tizzano M, Redding K, He J, Peng X, Jiang P, … Margolskee RF (2019). Gingival solitary chemosensory cells are immune sentinels for periodontitis. Nat Commun, 10(1), 4496. doi: 10.1038/s41467-019-12505-x [DOI] [PMC free article] [PubMed] [Google Scholar]
- Zinellu E, Piras B, Ruzittu GGM, Fois SS, Fois AG, & Pirina P (2019). Recent Advances in Inflammation and Treatment of Small Airways in Asthma. International journal of molecular sciences, 20(11). doi: 10.3390/ijms20112617 [DOI] [PMC free article] [PubMed] [Google Scholar]
Associated Data
This section collects any data citations, data availability statements, or supplementary materials included in this article.
Supplementary Materials
Suppl. Figure 1. The comparison of different methods for eliminating genomic DNA contaminations. The primers used for RT-PCR with different kits were the same for genotyping Tas2r143 (A), Tas2r135 (B) and Tas2r126 (C). Lanes 1 and 2: the RNAs were generated by Kit [RNeasy MinElute Cleanup Kit (Cat# 74204)] from Qiagen, which eliminates genomic DNAs by column binding; Lanes 3 and 4: the RNAs were produced by Kits [PureLink™ RNA Mini kit (Cat# 12183018A) combining with PureLink™ DNase (Cat# 12185–010)] from Invitrogen, which eliminates genomic DNAs by on-column DNase digestion.; Lanes 5 and 6: the RNAs were generated by kits with a combination of Trizol and Basal-ZERO; Lane 7: negative control with ddH2O as the template. The PCR cycle was 40. “+” represents reverse transcriptase was added when synthesizing cDNA; “-” no reverse transcriptase was added. The efficiency in eliminating genomes DNA: Basal-ZERO > Invitrogen > Qiagen.
Suppl. Figure 2. A TAS2R143 model (A) predicts the TASR143 mutant will be missing half of the first intracellular loop, the second α-helix, and most of the first extracellular loop (purple in A) due to the 40-aa (from 39th to 78th) deletion in the TAS2R143 mutant (B) in Tas2r TKO mice. Because no TAS2R atomic structure is available, 5a8e.1.A.pdb was automatically selected by the algorithm for its similarity to TAS2R143 and utilized as the template.
Suppl. Figure 3. A fusion of Tas2r135 and Tas2r126 due to the large segment (~27 kb) deletion disrupts both genes in Tas2r TKO mice. Red sequences are the remaining part from Tas2r135, blue from Tas2r126, and the stop codon is underlined and italicized.
Suppl. Figure 4. Sequences across the targeting region of Tas2r143 confirm the deletion of 9 bp in the triple-edited Tas2r143Δ9;Tas2r135Δ11;Tas2r126Δ2 mice. Underlined are the deleted nine nucleotides in the Tas2r143 mutant. In the DNA sequences, the blue highlighted region is the location of the sgRNA, and the red one is the location of PAM.
Suppl. Figure 5. Sequences across the targeting region of Tas2r135 confirm the deletion of 11 bp in the triple-edited Tas2r143Δ9;Tas2r135Δ11;Tas2r126Δ2 mice. The underlined region is the deleted 11 nucleotides in the Tas2r135 mutant. In the DNA sequences, the blue highlighted region is the location of the sgRNA, and the red one is PAM’s location.
Suppl. Figure 6. Sequences across the targeting region of Tas2r126 confirm the deletion of 2 bp in the triple-edited Tas2r143Δ9;Tas2r135Δ11;Tas2r126Δ2 mice. The underlined region is the deleted two nucleotides in the Tas2r126 mutant. In the DNA sequences, the blue highlighted region is the location of sgRNA, and the red one is the location of PAM.
Suppl. Figure 7. TAS2R126 ligand epicatechin-induced relaxation of the trachea and mainstem bronchi (A) and small airways (B) pre-contracted by Mch in wild type mice and Tas2r TKO mice (For A, n=12 for each group, p=0.361; For B, n= 9 mice for WT and 15 for KO, p=0.46 at 0.1 mM and 0.38 at 1 mM). No statistical significance between wild type mice and Tas2r TKO mice was detected using two-way ANOVA with the Bonferroni post-hoc test (A) or two-tailed Student’s t-test (B).