Abstract
Brain metastases are refractory to therapies that control systemic disease in patients with human epidermal growth factor receptor 2 (HER2+) breast cancer, and the brain microenvironment contributes to this therapy resistance. Nutrient availability can vary across tissues, therefore metabolic adaptations required for brain metastatic breast cancer growth may introduce liabilities that can be exploited for therapy. Here, we assessed how metabolism differs between breast tumors in brain versus extracranial sites and found that fatty acid synthesis is elevated in breast tumors growing in brain. We determine that this phenotype is an adaptation to decreased lipid availability in brain relative to other tissues, resulting in a site-specific dependency on fatty acid synthesis for breast tumors growing at this site. Genetic or pharmacological inhibition of fatty acid synthase (FASN) reduces HER2+ breast tumor growth in the brain, demonstrating that differences in nutrient availability across metastatic sites can result in targetable metabolic dependencies.
INTRODUCTION
Metastatic dissemination from solid tumors remains a formidable clinical challenge and contributes to cancer-related mortality. Brain metastases in particular are associated with poor survival outcomes, as therapeutic options are limited1. Advances in human epidermal growth factor receptor 2 (HER2)-targeted therapy have improved disease control in patients with HER2+ breast cancer; however, brain metastases from this disease are refractory to therapies that otherwise control disease at extracranial sites1–3. The blood brain/tumor barrier (BBB/BTB) complicates drug delivery to brain metastases, but accumulating evidence suggests that the brain tumor microenvironment also contributes to challenges associated with treating cancers in this tissue site4–13.
In addition to affecting drug delivery, the BBB/BTB limits access to nutrients from circulation14, which creates a microenvironment that is hypoxic and depleted of many metabolites, growth factors, and proteins15. Of note, differences in nutrient availability in brain tissue relative to other tissues can necessitate metabolic adaptations by cancer cells to grow in the brain. For example, breast cancer brain metastases require de novo serine synthesis to proliferate in the brain microenvironment16, which has reduced amino acid levels relative to plasma17,18. Breast cancers growing in the central nervous system (CNS) have also been shown to upregulate proteins required to take up and metabolize specific nutrients, such as the neurotransmitter gamma-aminobutyric acid (GABA)19,20 and iron21. These studies suggest that the brain microenvironment can impose metabolic constraints on breast cancer cells, and suggest that identifying nutrient limitations in this tissue could inform strategies to control brain metastasis for patients with HER2+ breast cancer and other malignancies.
In this study, we investigated the differential metabolic dependencies of primary and metastatic disease to determine how the brain microenvironment influences breast tumor growth and metabolism. We performed metabolite profiling, gene expression analysis, and in vivo 13C-glucose tracing in preclinical models and found that breast cancers growing in the brain display increased fatty acid synthesis relative to tumors growing at other sites. Analysis of the nutrient levels of extracellular fluid revealed low levels of lipids in the brain environment, suggesting that breast cancers growing at this site must synthesize fatty acids de novo to support the requirement for lipids. Indeed, we determine that genetic and pharmacological inhibition of FASN suppresses breast cancer growth in the brain, suggesting that fatty acid synthesis is required for breast tumor growth in this tissue and could serve as a potential therapeutic target for breast cancer brain metastases.
RESULTS
To better understand how environmental differences might impact breast tumor growth in different tumor sites, we asked whether differences in metabolism are associated with HER2+ breast tumors growing in the brain compared to the mammary fat pad (MFP) of mice, representing brain metastases and primary breast tumors, respectively. For these studies, we utilized orthotopic transplantation models of ERBB2 (also known as HER2)-amplified breast cancer that have previously been shown to recapitulate clinical features of human HER2+ breast cancer brain metastasis, including resistance to drugs that are effective in controlling disease in the primary site6,22. Polar metabolite levels were analyzed in bulk tumor tissue derived from human BT474 breast cancer cells that were implanted in the brain or MFP of immunodeficient mice6,22. These tumors contain mostly breast cancer cells expressing HER2, but also contain host-derived stromal cells, including fibroblasts and macrophages in MFP lesion, and activated astrocytes, microglia and macrophages in brain lesions (Extended Data Fig. 1a–d). Unsupervised hierarchical clustering based on measured metabolites separated the tumor samples based on tissue site, with many differences in relative metabolite abundance between tumors growing in the brain and MFP (Fig. 1a). As expected, gamma-aminobutyric acid (GABA), the most abundant inhibitory neurotransmitter in the CNS, was higher in brain tumor tissue (Extended Data Fig. 2a)19. These data suggest that global differences in metabolism may exist in tumors that develop in each tissue, even when the lesions are derived from the same cancer cells.
Figure 1. Evidence for increased fatty acid synthesis in breast cancer brain metastases.
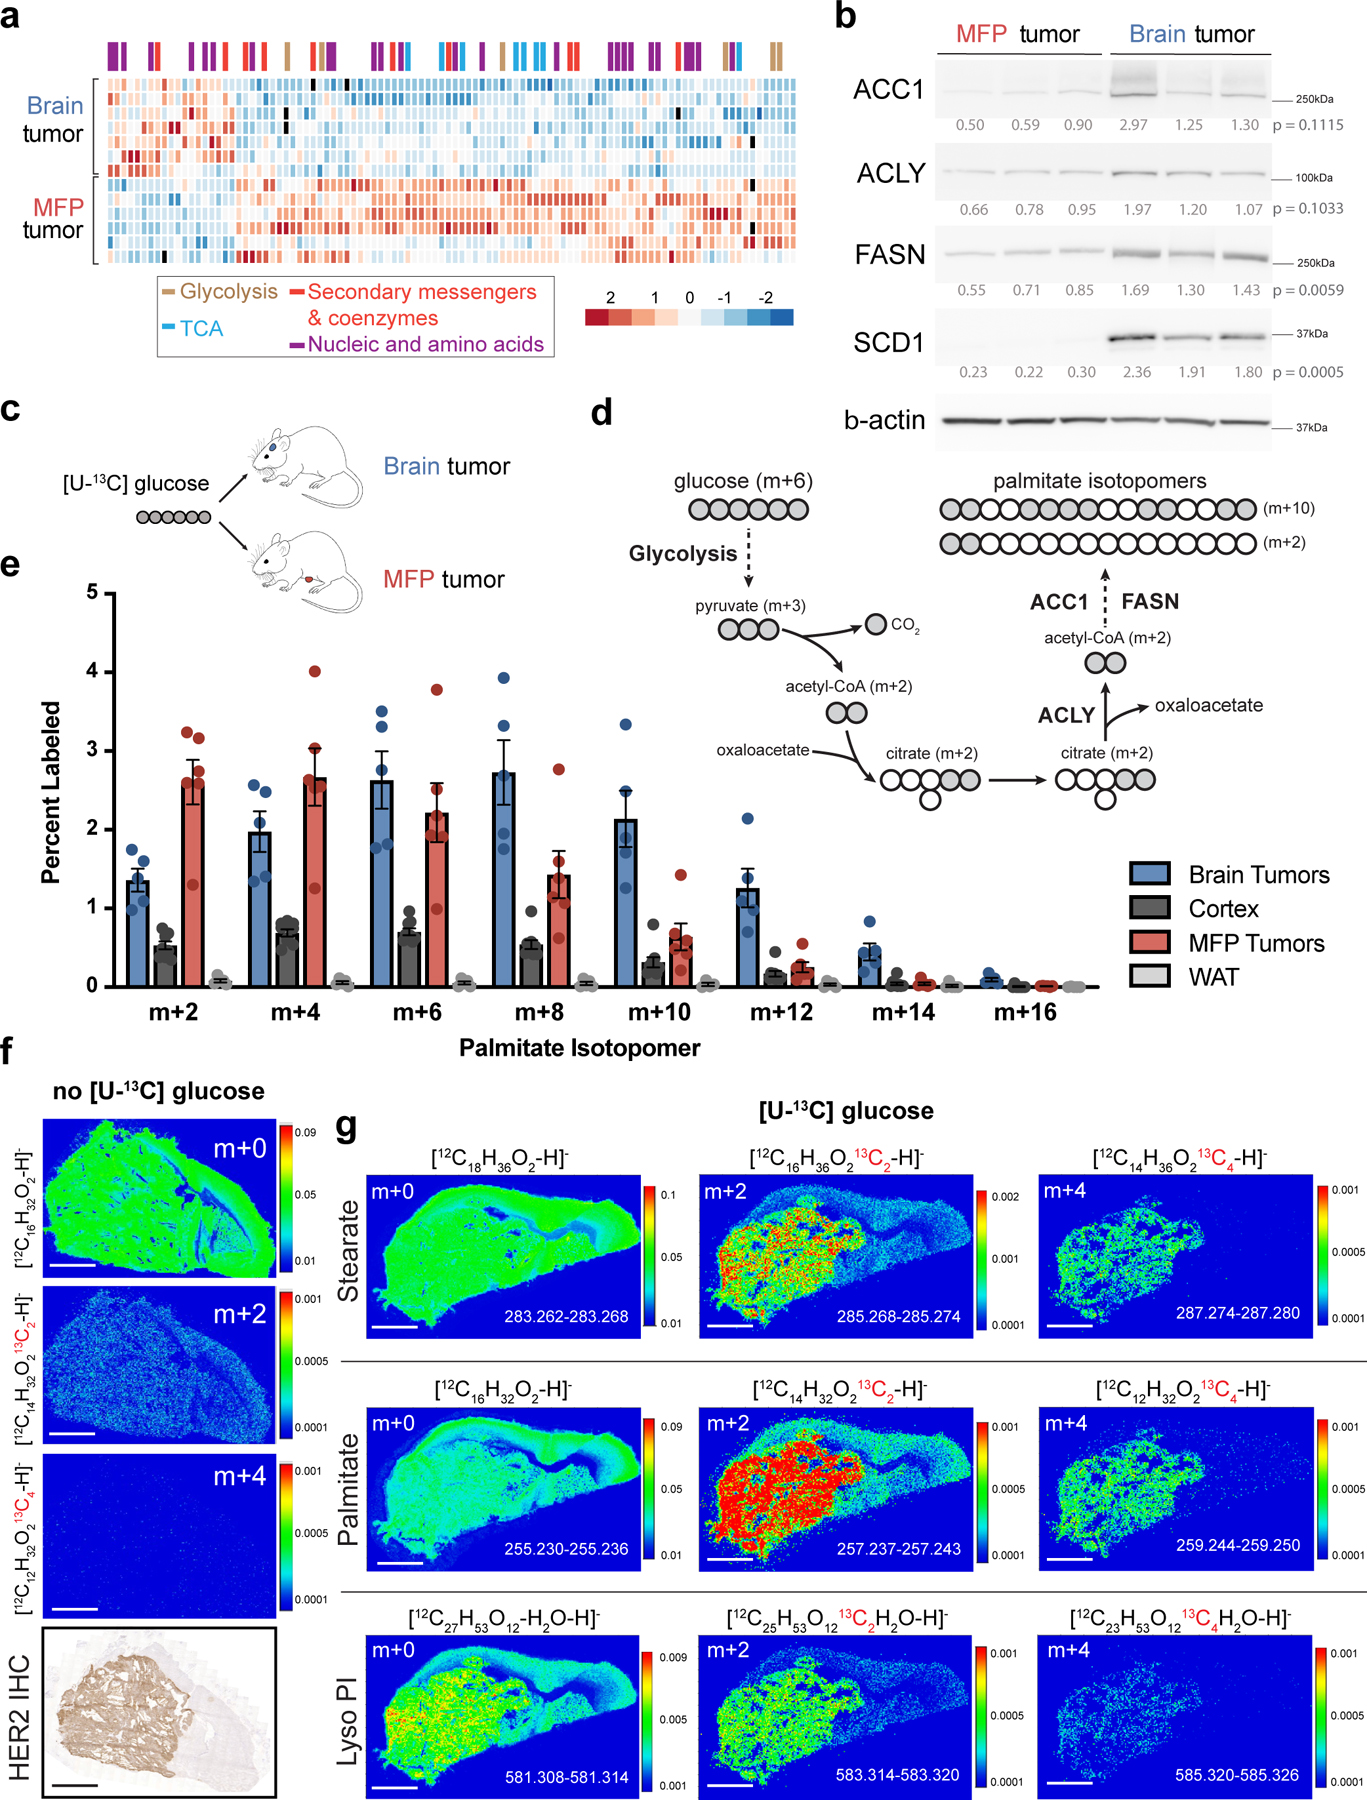
a) Heat map of metabolite levels as measured by liquid chromatography-mass spectrometry (LCMS) from established BT474 tumors isolated from the brain or mammary fat pad (MFP) of female nude mice. Metabolites with statistically significant differences between the two tissues (p < 0.05) are presented and were allowed to self-segregate by unsupervised hierarchical clustering. The full dataset is provided in Source Data Table 1. (Brain tumors, n=7; MFP tumors, n=6; tumors from independent mice).
b) Western blot analysis of acetyl-CoA carboxylase (ACC1), ATP citrate lyase (ACLY), fatty acid synthase (FASN), and stearoyl-CoA desaturase-1 (SCD1) and beta actin (β-actin) expression. Relative densitometry values (normalized to β-actin expression) were used for quantitation, and expression in brain and MFP tumor tissue was compared using a two-tailed t-test.
c) Schematic for tracing fully labeled 13C-glucose fate (m+6) in mouse orthotopic brain or MFP breast tumor models. d) Schematic depicting how carbons from fully labeled 13C-glucose (indicated by grey circles) are incorporated into the fatty acid palmitate. Two representative palmitate isotopologues are depicted, as are the steps in which ACLY, ACC1 and FASN contribute to fatty acid synthesis.
e) The distribution of 13C label in even isotopologues of saponified palmitate in BT474 tumors growing in the brain and MFP, in noncancerous brain (Cortex), and in noncancerous MFP adipose tissue (WAT) of nude mice was measured by gas chromatography mass spectrometry (GCMS) following a 12 hour 30 mg/kg/min 13C-glucose infusion. Isotopologues were normalized to plasma enrichment of 13C-glucose. Data presented are means ± SEM. (Brain tumor, n=5; Cortex tissue, n=9; MFP tumor, n=6; WAT, n=5).
f) Negative mode matrix assisted laser desorption/ionization-mass spectrometry imaging (MALDI-MSI) of a BT474 brain tumor collected from a NSG mouse. Spatial distribution of the isotopologues palmitate, including unlabeled (m+0) and those resulting from natural abundance of 13C (m+2, m+4) normalized to total ion counts (TIC) is shown. HER2 immunohistochemistry (IHC) staining of a brain-tumor section from the same mouse is also presented. (scale bar = 1 mm).
g) Negative mode MALDI-MSI of a BT474 brain tumor derived from a NSG mouse injected with 13C-glucose (4 daily bolus injection of 2 g/kg 13C-glucose). Spatial distribution of the indicated isotopologues of palmitate, stearate and lyso-phosphatidylinositol (Lyso-PI, 18:0) normalized to TIC are shown. Mass/charge (m/z) ratio is provided for each isotopologue in the bottom right of each panel. (scale bar = 1 mm).
To further explore metabolic differences between primary breast tumors and brain metastases, we queried a previously published dataset6 to evaluate differences in gene expression in BT474 tumors harvested from different tissue sites. This dataset is focused on differential expression of human genes, thus reflects differences in cancer cell gene expression in tumors growing in each tissue site. We observed numerous differences in gene expression, with gene set enrichment analysis showing differences in signatures involving metabolic processes, including a striking enrichment in gene sets associated with lipid metabolism in tumors growing in the brain (Supplementary Table 1). To confirm that these differences correspond to changes in metabolic enzyme expression, we assessed the expression of select enzymes involved in fatty acid synthesis in BT474 tumors growing in the MFP and brain. Higher expression of fatty acid synthase (FASN) and stearoyl-CoA desaturase 1 (SCD1), two enzymes involved in fatty acid synthesis, was observed in brain tumor tissue compared to MFP tumor tissue (Fig. 1b). Increased FASN and acetyl-CoA carboxylase alpha (ACACA, also known as ACC1) protein expression was also observed in a second model of HER2-amplified breast cancer, in which tumors were generated from MDAMB361 cells (Extended Data Fig. 2b).
To functionally assess breast cancer metabolism across different tumor sites, we traced the fate of glucose, a major substrate for fatty acid synthesis in cancer23, in BT474 tumors growing in the brain or MFP. For these experiments, we infused stable isotope-labeled 13C-glucose into conscious, tumor-bearing mice over 12 hours (Fig. 1c). Following the infusion, we confirmed that glucose was 13C-labeled in the plasma of mice bearing either brain or MFP tumors (Extended Data Fig. 2c) and analyzed metabolites in tumor and normal tissues obtained from each site. We found that an appreciable fraction of pyruvate was fully labeled (m+3) from 13C-glucose in all tissues (Extended Data Fig. 2d), and exhibited a similar labeling pattern as alanine and lactate (Extended Data Fig. 2e,f), consistent with known rapid label exchange between these metabolites24. The degree of 13C-labeling of many TCA cycle intermediates and related amino acids was different in brain BT474 tumors compared to MFP lesions, as well as in comparison to normal tissues (Extended Data Fig. 2g–m), further supporting that breast cancer metabolism differs from that of normal tissue, and is affected by tissue site. Of note, extensive 13C-labeling was observed in normal brain, consistent with glucose being the primary oxidative fuel for this organ,25.
We next analyzed the incorporation of carbon from 13C-glucose into saponified palmitate, an abundant fatty acid, isolated from BT474 brain and MFP tumors from 13C-glucose-infused mice. To contribute to fatty acids, glucose is first converted to two-carbon acetyl-CoA, which serves as a substrate for FASN (Fig. 1d)26. Thus, the distribution of 13C-labeled two-carbon units from 13C-glucose into palmitate is reflective of fatty acid synthesis from glucose. BT474 tumors in both sites displayed a greater degree of palmitate labeling than non-cancerous brain and MFP tissues, with greater 13C incorporation from glucose into palmitate in brain lesions when compared to MFP tumors, even when taking into account the total amount of palmitate extracted from each tissue (Fig. 1e, Extended Data Fig. 2n,o).
To further explore the possibility of increased fatty acid synthesis in brain metastatic tumors, we employed imaging mass spectrometry (IMS) to spatially assess 13C incorporation from glucose into lipid species in non-cancerous brain tissue and in BT474 tumors growing in the brain. As expected, the distribution of naturally occurring 13C-labeled palmitate isotopologues (m+2 and m+4) was low compared to unlabeled palmitate (m+0) in mice bearing BT474 brain tumors without exposure to 13C-glucose (Fig. 1f). To assess the contribution of glucose to lipids in brain tumors, tumor-bearing mice were given daily bolus injections of 13C-glucose over 4 days, and 13C incorporation into fatty acids in lipid species was rendered using IMS. We observed higher 13C labeling of palmitate, oleate, stearate, palmitoleate and L-alpha-lysophosphatidylinositol in tumors compared to normal brain (Fig. 1g, Extended Data Fig. 3a–c), and normalization of labeled palmitate signal (m+2) to total palmitate ion counts did not change the IMS signal distribution between normal brain and BT474 tumors (Extended Data Fig. 3d). These data suggest that newly synthesized fatty acids are present in tumor tissue and are incorporated into more complex lipids in breast tumors growing in the brain.
Though increased palmitate labeling from 13C-glucose is suggestive of higher lipid production in BT474 lesions growing in the brain than those growing in the MFP, the inability to reach steady-state labeling of fatty acids from glucose in vivo complicates interpretation of these data. Differences in label delivery or in glucose uptake between tissue sites might also contribute to the observed 13C label distribution. Metabolic pseudo-steady state is more readily achieved in tissue culture conditions27, and thus we next assessed whether differences in fatty acid labeling from glucose are retained when tumor tissue from each site is cultured ex vivo. To this end, we utilized organotypic slice cultures (Fig. 2a), which have been shown to retain cellular architecture and some metabolic characteristics found in tumors including retention of stromal cell populations28,29(Fig. 2b). Slice cultures derived from BT474 and MDAMB361 brain tumors displayed increased palmitate labeling from 13C-glucose relative to slice cultures generated from MFP lesions (Fig. 2c,d). Taken together, increased 13C-labeling of palmitate measured in vivo and in organotypic slice cultures, coupled with elevated expression of lipid synthesis enzymes in breast cancers growing in the brain relative to those growing at the primary site, suggests that the brain microenvironment may promote increased fatty acid synthesis in breast cancer.
Figure 2. The brain tumor microenvironment contributes to increased de novo lipid synthesis in breast tumors.
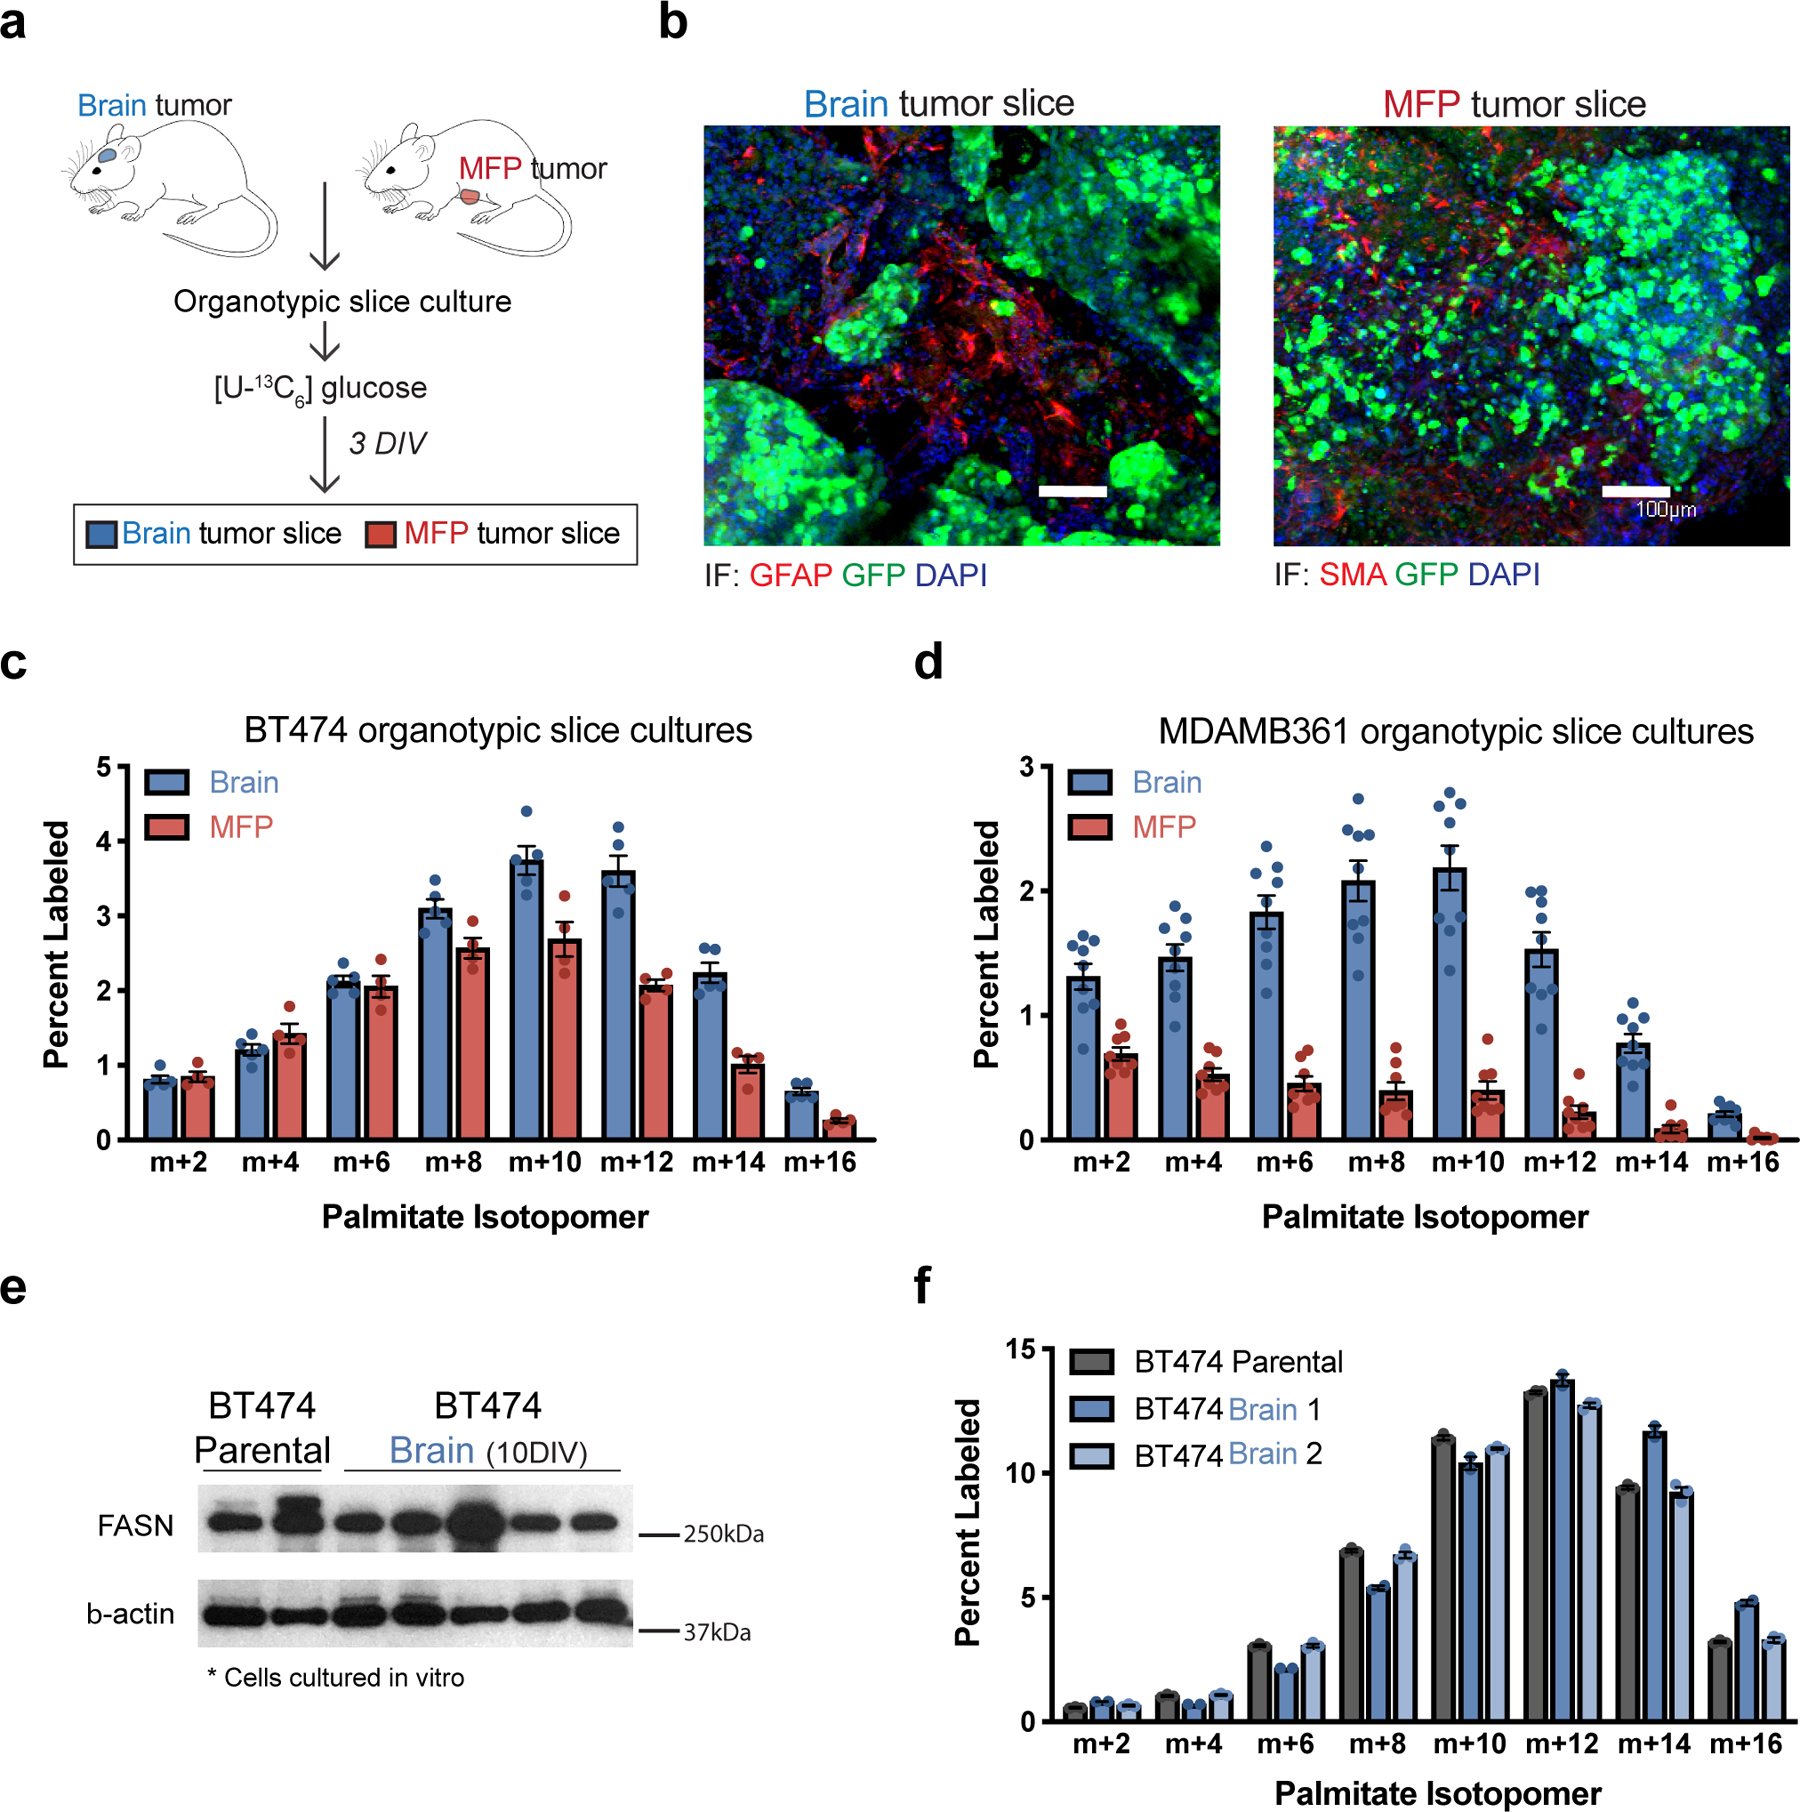
a) Schematic workflow used for organotypic slice culture experiments. Organotypic slice cultures were prepared from breast cancer tumors isolated from mouse orthotopic brain (permitted to reach a volume of ~60 mm3) or MFP (permitted to reach a volume of ~100–120 mm3). Slices were cultured for 3 days in vitro (DIV) prior to their use in an experiment.
b) Immunofluorescence (IF) staining of organotypic slice cultures prepared from breast cancer tumors isolated from orthotopic brain or MFP lesions established in NSG female mice from GFP-positive BT474 cells. Staining for α-smooth muscle actin (SMA) was performed on slices from MFP tumors, and staining for glial fibrillary acidic protein (GFAP) was performed on slices from brain tumors. DAPI staining and GFP fluorescence from tumor cells is also assessed as indicated. (scale bar = 100 μM).
c, d) The percent labeling of even isotopomers of saponified palmitate measured by gas chromatography–mass spectrometry (GCMS) in organotypic slice cultures exposed to 13C-glucose for 72 hours. Organotypic slice cultures were prepared from BT474 (c) or MDAMB361 (d) brain and MFP tumors established in Nude female mice. Slices cultures analyzed were obtained from 2–3 independent tumors from different mice. (BT474 brain tumor slices, n=5; BT474 MFP tumor slices, n =4; MDAMB361 brain tumor slices, n=9; MDAMB361 MFP tumor slices, n=8).
e) Western blot assessment of FASN expression in parental BT474 cells never exposed to the brain microenvironment (BT474 Parental), and in multiple independent cell line isolates from orthotopic brain BT474 tumors established in NSG mice and cultured for 10 days in vitro (BT474 Brain 10DIV). β-actin expression was also assessed as a loading control.
f) The percent labeling of even isotopomers of saponified palmitate measured by GCMS from parental BT474 cells, and cell line isolates from orthotopic BT474 brain tumors described in (e), that were cultured in vitro with 13C-glucose for 48 hours. Two independent isolates (BT474 Brain 1, BT474 Brain 2) were analyzed. (n=3 cell culture biological replicates).
Data in panels c, d and f represent means ± SEM.
To further assess whether increased lipid synthesis observed in brain tumors is retained by cells when removed from the brain tissue environment, we characterized cancer cells that were isolated from BT474-derived brain tumors and cultured for 10 days in vitro. Similar FASN protein expression and label incorporation into palmitate from 13C-glucose were observed in these brain tumor-derived cells as the BT474 parental line used to initiate the tumors (Fig. 2e,f). These data suggest that for these cells increased fatty acid synthesis is a metabolic adaptation that reflects exposure to the brain tissue environment.
To explore whether the evidence for increased fatty acid synthesis observed in these models was representative of human breast cancers, we analyzed a published RNAseq dataset30 for FASN mRNA levels based on site, and noted that FASN expression was higher in brain metastases when compared to patient-matched primary breast cancer biopsies (Fig. 3a). We next queried the same dataset to evaluate whether this was a unique feature of HER2+ breast cancer. The majority of patients with either HER2+ or triple negative breast cancer displayed higher FASN mRNA levels in brain metastases relative to matched primary lesions (Fig. 3b), although increased mRNA levels of SCD1, ACC1 and ATP citrate lyase (ACLY) mRNA was only found in HER2+ brain metastases (Extended Data Fig. 4a–c). To further assess FASN protein expression in human breast cancer, we analyzed a separate cohort of primary and patient-matched breast cancer brain metastases using immunohistochemistry. We observed FASN expression in all breast cancer brain metastasis samples analyzed (score of 2 or higher), but found that FASN expression can also be high in some primary lesions regardless of molecular subtype (Fig. 3c,d). Importantly, FASN expression in brain metastases was found in breast cancer cells in the tumor (Extended Data Fig. 4d,e). To further assess FASN expression in brain metastases compared to extracranial metastatic sites, we queried a transcriptomic database generated from biopsies of metastatic breast cancer containing unmatched extracranial and brain metastases31,32. We found that FASN mRNA expression levels were significantly higher in brain metastasis samples when compared to bone and lung metastases (Fig. 3e). No statistical difference in FASN mRNA expression was found between brain and liver lesions (Fig. 3e), but SCD1 mRNA levels were significantly enriched in brain lesions compared to all sites (Extended Data Fig. 4f), although only a small number of liver metastases were available for analysis. Taken together, these data suggest that FASN expression that is similar to, or higher than, that found in primary tumors, and FASN expression is a general feature of human breast cancers growing in the brain.
Figure 3. FASN is expressed in breast cancer brain metastases.
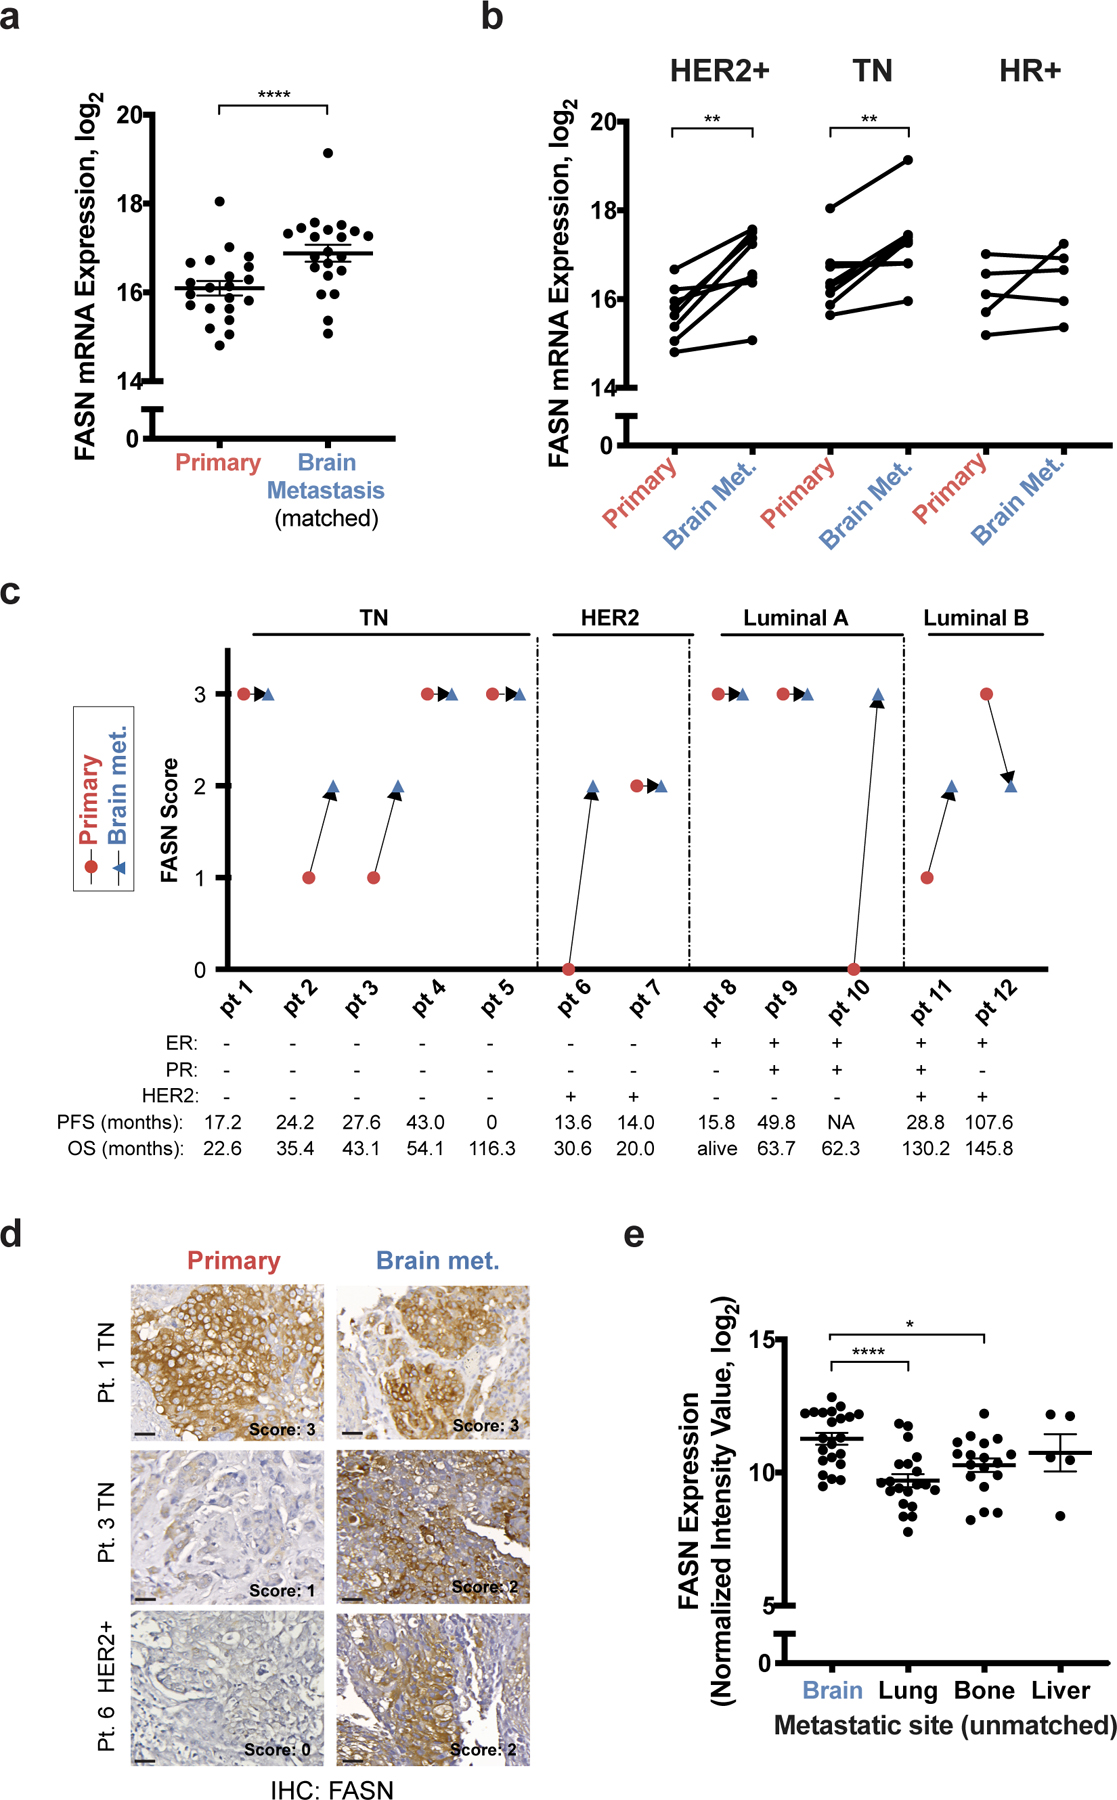
a, b) FASN mRNA expression levels from a patient-matched metastatic breast cancer RNAseq database30. Matched primary versus brain metastasis (Brain Met.) samples were analyzed with the major clinical molecular subtypes combined (a) or separated (b). **** p < 0.0001 (a), ** p = 0.0034 (HER2+, b) and ** p = 0.0057 (TN, b) by two-tailed paired sample t-test. (Human epidermal growth factor receptor 2+ tumors (HER2+), n=8; Triple negative (TN) tumors, n=8; Hormone receptor + (HR+) tumors, n=5).
c, d) Immunohistochemistry (IHC) analysis of FASN expression from formalin-fixed paraffin-embedded tissue sections of patient-matched biopsies of primary tumor and brain metastasis (Brain met.). FASN immunohistochemistry score (0=low, 3=high) observed in breast tumor sections from patient-matched samples grouped by clinical molecular subtype are shown in (c). Receptor status, progression free survival (PFS) and overall survival (OS) are indicated for each patient (Pt.) sample. Representative images and the corresponding FASN score are shown from patients with TN (Pt. 1 and 3) and HER2+ (Pt. 6) breast tumors are shown in (d). Estrogen Receptor (ER), Progesterone Receptor (PR). (scale bar = 300 μm).
e) Analysis of FASN mRNA expression from an unmatched metastatic breast cancer gene expression database31,32. * p = 0.0179, **** p < 0.0001 by one-way ANOVA followed by Dunnettś multiple comparisons test. (Brain tumors, n=22; Lung tumors, n=20; Bone tumors, n=18; Liver tumors, n=5).
Data presented in panels a and e are means ± SEM.
Extracellular lipid availability is an environmental variable that can affect the extent of de novo lipid synthesis in cancer33 and we confirmed that breast cancer cells cultured in delipidated media display increased SCD1 expression (Extended Data Fig 5a, b), as well as enhanced fatty acid synthesis from glucose (Fig. 4a, b, Extended Data Fig 5c, d), likely reflecting the expected transcriptional response to lipid deprivation34. MDAMB361 cells also exhibit a shift in the distribution of 13C-labeled palmitate isotopologues in lipid-depleted conditions relative to standard culture conditions (Fig. 4b), suggesting increased contribution of glucose to acetyl-CoA in these cells when they are deprived of exogenous lipids26. To begin to examine whether reduced lipid availability in the brain tissue microenvironment might account for the changes in FASN expression and 13C-labeling of fatty acids from glucose in breast tumors in this tissue, we quantified the relative abundance of complex lipids in cerebrospinal fluid (CSF) and plasma from mice. Although differences in fluid composition can impact relative metabolite measurements by mass spectrometry35, much lower levels of lipid species were measured in the CSF compared to plasma (Fig. 4c), which is consistent with known clinical laboratory values in humans36. To further assess the extracellular lipids available to cancer cells in the brain relative to the primary tissue site, we isolated extracellular fluid from non-tumor-bearing brain and MFP tissues37 and again assessed relative lipid abundances by mass spectrometry. Whereas few lipid species were measured to be higher in extracellular fluid isolated from brain relative to extracellular fluid isolated from MFP, many complex lipids were highly abundant in MFP extracellular fluid including triacylglycerols (TAG) (Fig. 4d). TAG levels were also measured to be lower in normal brain tissue when compared to MFP tissue (Fig. 4e). Further analysis of lipid species showed a relative enrichment in lipids containing monosaturated fatty acids (MUFA) in BT474-derived brain tumors, particularly within TAG species (Fig. 4f). In contrast, lipids from MFP tumors were enriched for those containing polyunsaturated fatty acids (PUFA) (Fig. 4f). MUFAs can be produced by de novo fatty acid synthesis in mammals, while many PUFAs are derived from essential fatty acids that must be obtained from the environment38,39. Consistent with this difference in MUFAs and PUFAs reflecting different lipid availability in the different sites, a similar increase in MUFAs and decrease in PUFAs was observed in acylglycerol species from BT474 and MDAMB361 cells when cultured in delipidated media (Extended Data Fig. 5e,f). Collectively, these data suggest that decreased access to lipids in the brain microenvironment could explain the increased fatty acid synthesis observed in breast tumors in the brain compared to the primary site.
Figure 4. Low levels of lipids are available to breast cancer cells in the brain microenvironment.
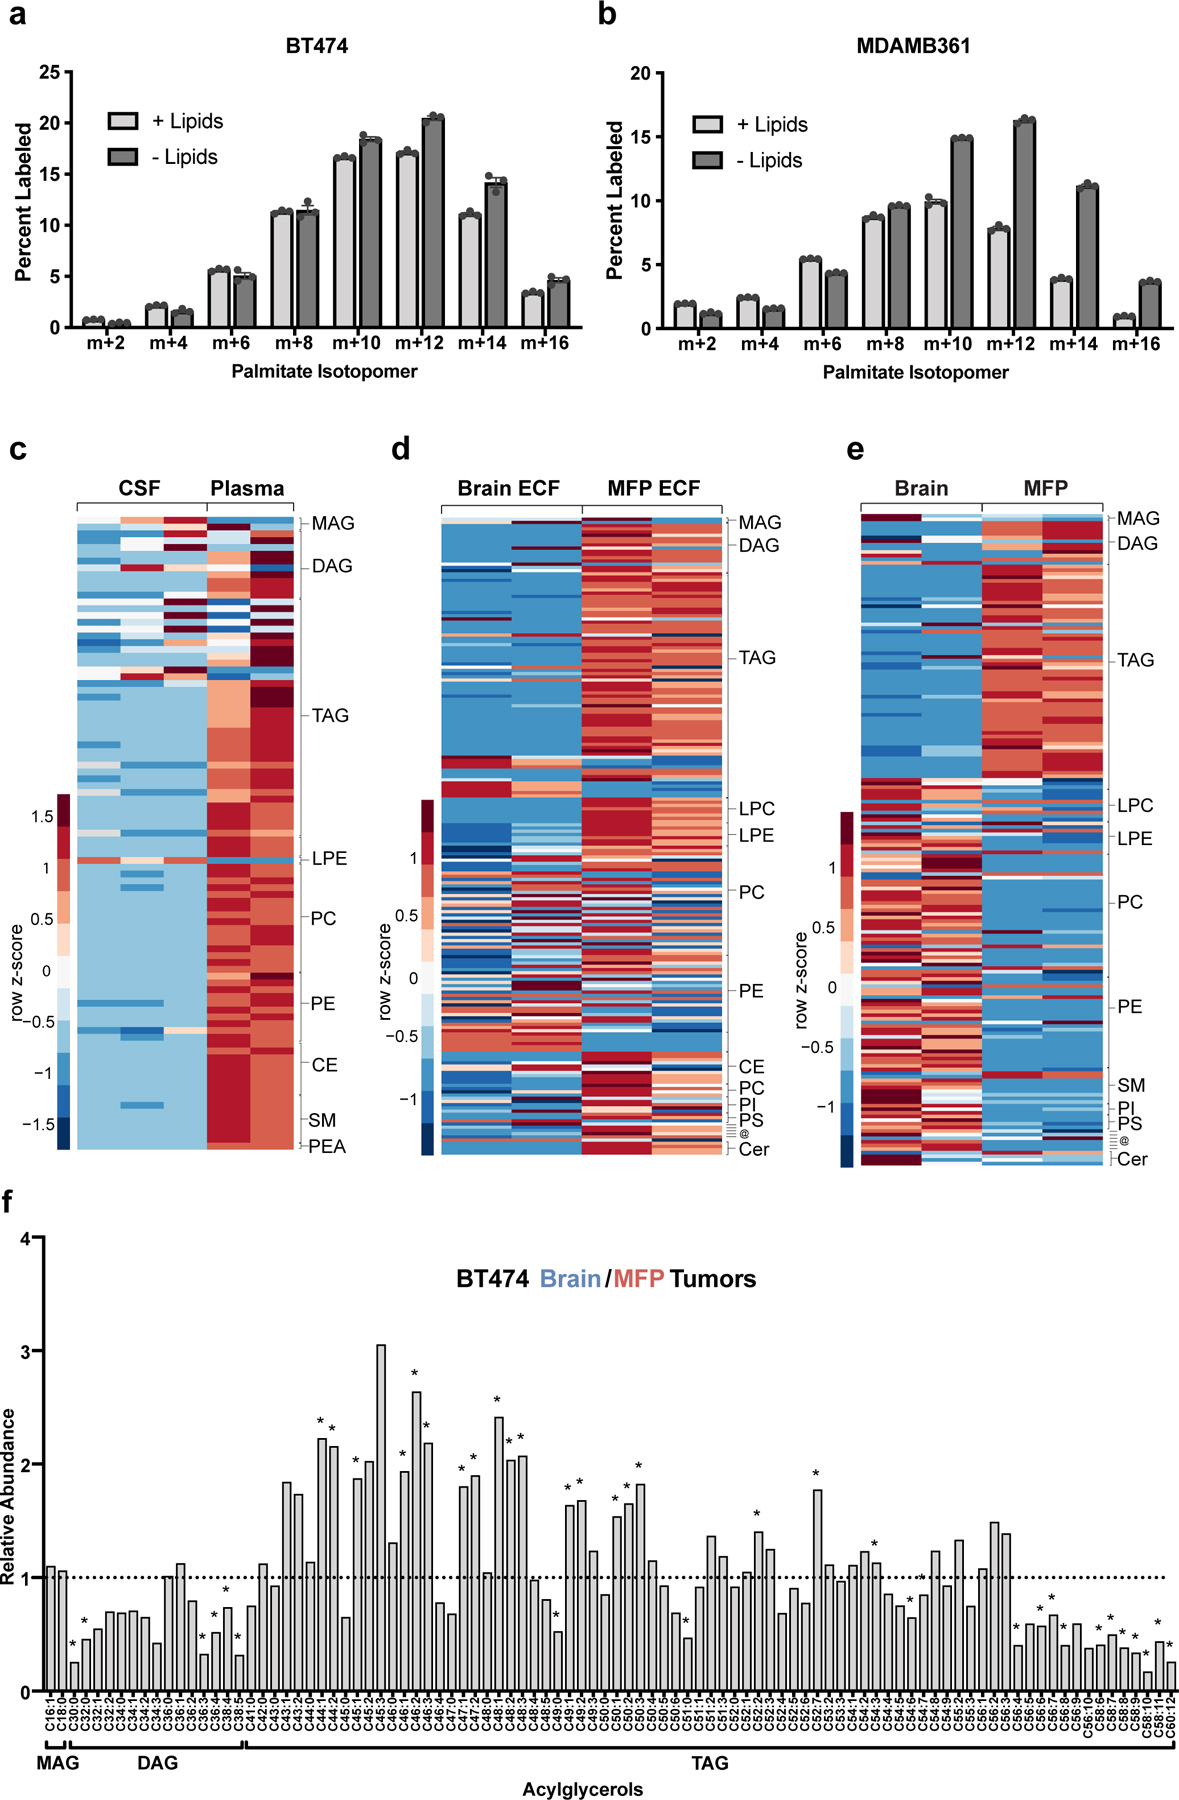
a, b) The percent labeling of even isotopologues of saponified palmitate as measured by GCMS in BT474 cells or MDAMB361 cells cultured in standard (+Lipids) or delipidated (-Lipids) media for 72 hours with 13C-glucose as indicated. Data presented are means ± SEM. (n=3 cell culture biological replicates).
c) Complex lipid levels in cerebrospinal fluid (CSF) and plasma from non-tumor bearing NSG mice measured by LCMS. Scaled values of each lipid species measured from five times the volume of CSF compared to plasma are presented as a heatmap with classes of lipid species grouped as indicated on the right of the heatmap. Data presented within each row were z-score normalized. (CSF, n=3; Plasma, n=2. Each biological replicate is from 2–3 pooled mice.).
d) Complex lipid levels in extracellular fluid (ECF) isolated from the mammary fat pad (MFP) and brain of non-tumor bearing NSG mice measured by LCMS. Scaled values of each lipid species measured are presented as a heatmap for each fluid with classes of lipid species grouped as indicated on the right of the heatmap. Data presented within each row were z-score normalized. (Brain ECF, n=2; MFP ECF, n=2 biological replicates. (Each biological replicate represents ECF pooled from up to ~8–10 mice.).
e) Complex lipid levels measured by LCMS in mammary fat pad (MFP), and brain tissue from non-tumor bearing NSG mice. Scaled values of each lipid species measured are presented as a heatmap for each tissue with classes of lipid species grouped as indicated on the right of the heatmap. Data presented within each row were z-score normalized. (Brain tissue, n=2; MFP tissue, n=2)
f) Levels of monoacylglyceride (MAG), diacylglyceride (DAG) and triacylglyceride (TAG) species were measured by LCMS from BT474 brain and MFP tumors collected from NSG mice and are presented as a ratio to show how levels differ based on tumor site. A black dotted line indicates a ratio of 1, representing no difference in lipid levels between BT474 brain and MFP tumors. *q < 0.1 by multiple t-test, False Discovery Rate corrected. (Brain tumors, n=3; MFP tumors, n=4).
Lipids: MAG- monoglyceride; DAG-diglyceride; TAG-triglyceride; LPC-lysophosphatidyl-choline; LPE-lysophosphotidyethanolamine; PC-phosphatidylcholine; PE-phosphatidylethanolamine; PI-phosphatidylinositol; PS-phosphatidylserine; SM-sphingomyelin; CE–cholesteryl ester; @-(top to bottom line) sphingosine, palmitoylethanolamide, 7−Dehydrodesmosterol, cholesterol, coenzyme Q9, coenzyme Q10; Cer-ceramide; PEA- Palmitoylethanolamide.
To test the requirement for fatty acid synthesis in different environments and tissues, we utilized CRISPR-Cas9 gene editing to disrupt FASN in BT474 and MDAMB361 cells. We were unable to isolate BT474 cells with complete loss of FASN expression (Fig. 5a), but confirmed editing leading to a frameshift in the FASN coding sequence in 83.16% of amplicon sequencing reads from BT474 sgFASN cells (Supplementary Figure 1). Importantly, both BT474 and MDAMB361 sgFASN cells exhibited reduced FASN expression (Fig. 5a). We further confirmed that the decreases in FASN expression impaired fatty acid synthesis, as a reduction in palmitate labeling from glucose was observed in BT474 sgFASN cells, with no label incorporation into palmitate in MDAMB361 sgFASN cells (Fig. 5b). The total amount of palmitate derived from saponified lipids was also reduced in sgFASN cells relative to control cells, and was depleted to a greater extent when cells were cultured in delipidated media (Fig. 5c). The proliferation of sgFASN cells in culture was also suppressed, particularly in delipidated media (Fig. 5d). Taken together, these data confirm that FASN expression is necessary for lipid synthesis and to maintain palmitate levels, especially in environments where exogenous lipids are not available.
Figure 5. FASN is required for breast tumor growth in the brain.
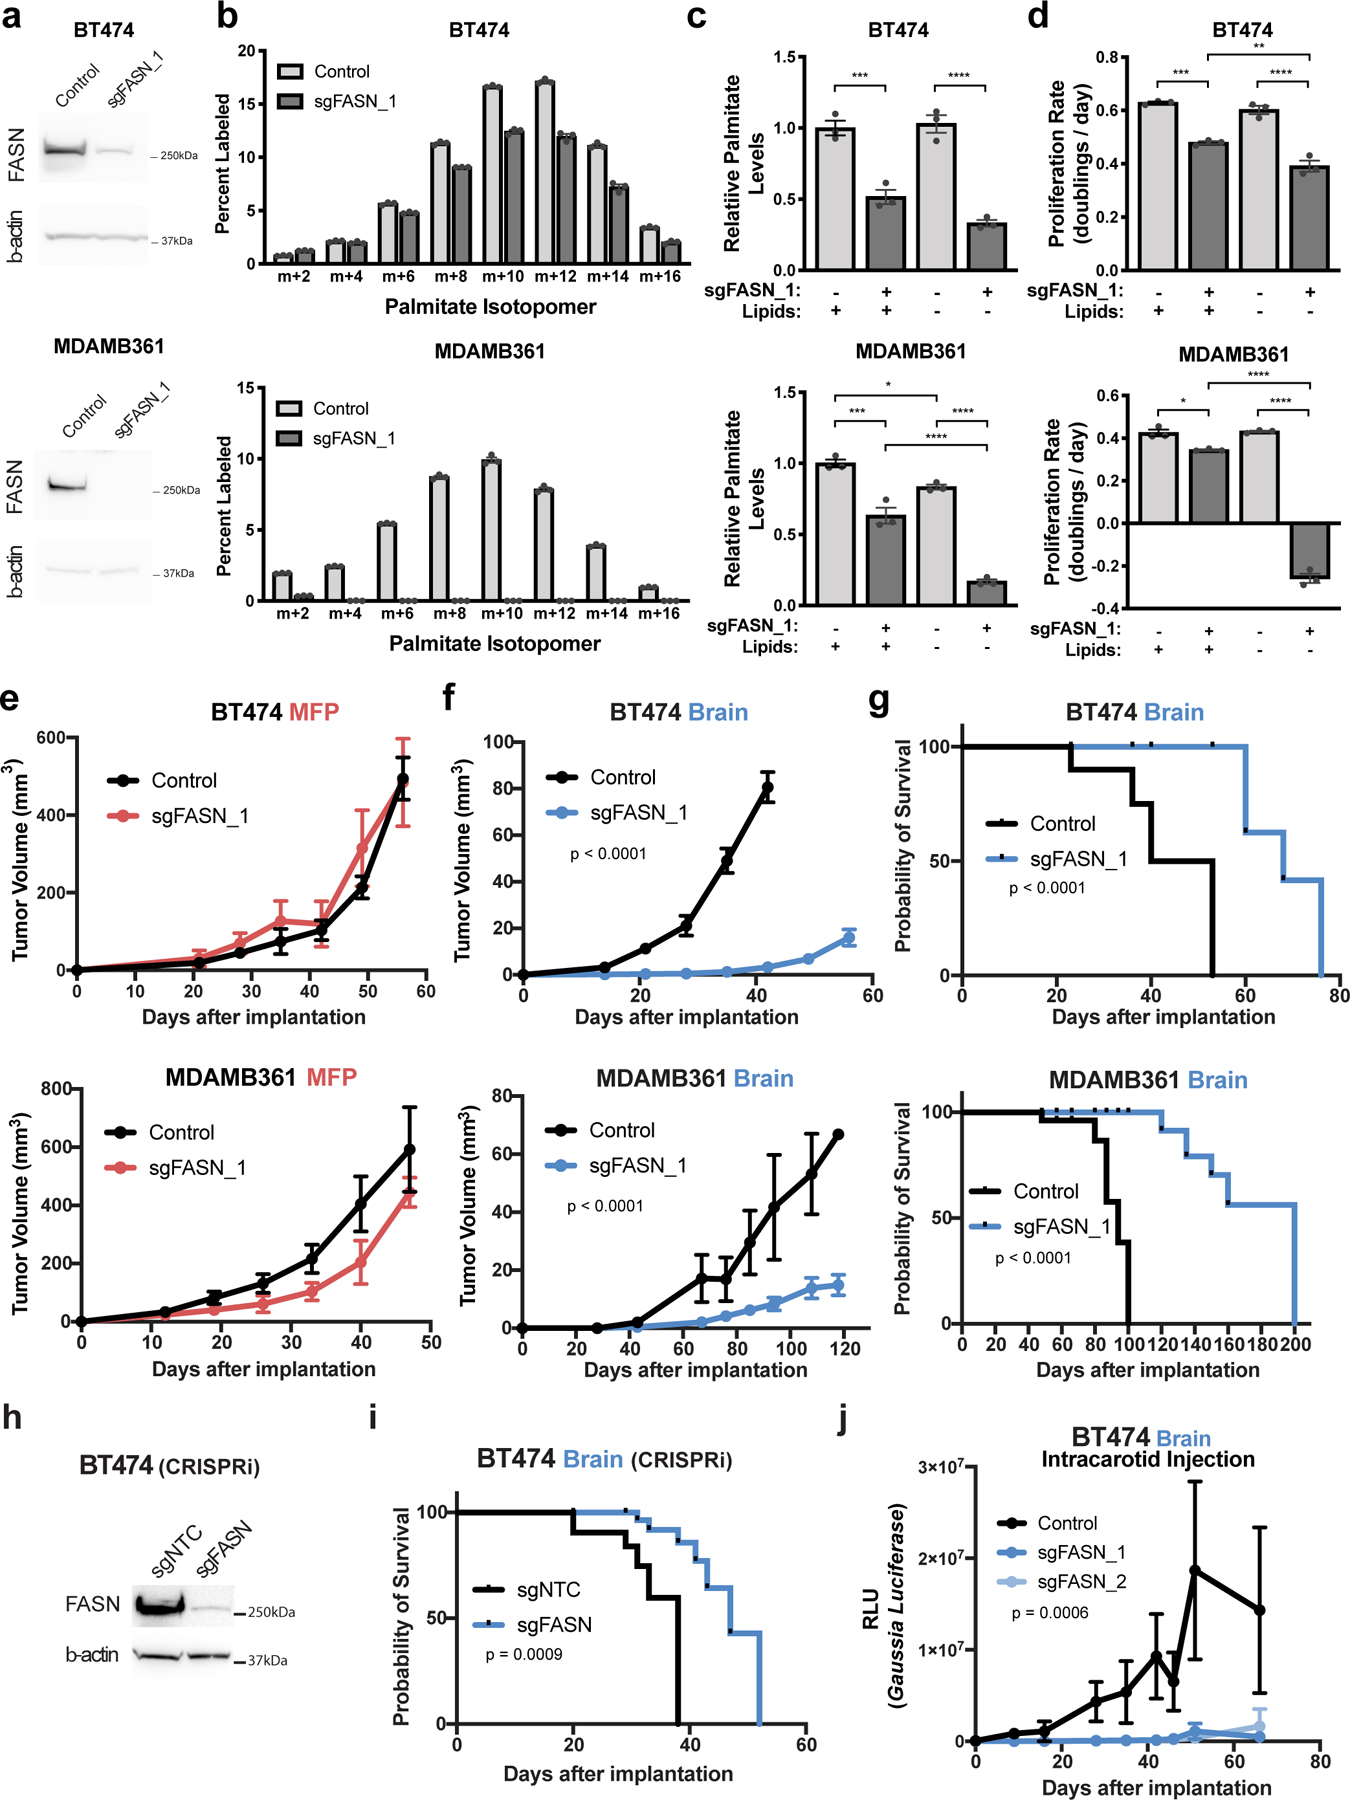
a) Western blot analysis of FASN and β-actin protein expression in BT474 and MDAMB361 lysates from control cells or in a clone in which FASN is disrupted with CRISPR/Cas9 (sgFASN_1).
b) The percent labeling of even isotopologues of saponified palmitate from control or sgFASN_1 BT474 and MDAMB361 cells cultured in standard media for 72 hours with 13C-glucose as measured by GCMS. The data for control BT474 and MDAMB361 cells are the same as that presented in Figure 4a,b. (n=3 cell culture biological replicates).
c) Relative levels of saponified palmitate measured from control or sgFASN_1 BT474 and MDAMB361 cells cultured in standard (+Lipids) or delipidated (-Lipids) media for 72 hours. Palmitate levels are normalized to the control standard media condition. BT474, *** p = 0.0004, **** p < 0.0001; MDAMB361, * p = 0.0307, *** p = 0.0002, **** p < 0.0001; by one-way ANOVA followed by Tukeýs multiple comparisons test. (n=3 cell culture biological replicates).
d) Proliferation rate of control or sgFASN_1 BT474 and MDAMB361 cells cultured in standard (+Lipids) or delipidated (-Lipids) media for 6 days. BT474, ** p = 0.0071, *** p = 0.0002, **** p < 0.0001; MDAMB361, * p = 0.0126, *** p = 0.0002, **** p < 0.0001; by one-way ANOVA followed by Tukeýs multiple comparisons test. (n=3 cell culture biological replicates).
e) Growth over time of MFP tumors generated from control or sgFASN_1 BT474 and MDAMB361 cells in NSG mice as indicated. Tumor volumes were measured by caliper. Growth difference was not significant by two-way ANOVA (Days × Group) for BT474 or MDAMB361. (BT474 control, n=5; BT474 sgFASN_1 tumors; n=5; MDAMB361 control tumors, n=5; MDAMB361 sgFASN_1 tumors, n=5).
f) Growth over time of brain tumors generated from control or sgFASN_1 BT474 and MDAMB361 cells in NSG mice as indicated. Tumor volumes were measured by ultrasound in cranial-window bearing mice. p < 0.0001 by two-way ANOVA (Days × Group) for BT474 and MDAMB361 respectively. (BT474 control tumors, n=7; BT474 sgFASN_1 tumors; n=7, MDAMB361 control, n=6; MDAMB361 sgFASN_1 tumors, n=8).
g) Kaplan-Meier survival curve for NSG mice bearing control or sgFASN_1 BT474 and sgFASN_MDAMB361 brain tumors from the experiment presented in (f). Median survival for mice bearing BT474 tumors was 46.5 days for control and 68 days for sgFASN_1 groups (hazard ratio = 9.721; 95% confidence interval = 0.8265 to 114.3; p < 0.0001). Median survival for mice bearing MDAMB361 tumors was 94 days for control and 200 days for sgFASN_1 groups (hazard ratio = 13.62, 95% confidence interval = 1.292 to 144.6, p < 0.0001). (BT474 control tumors, n=5; BT474 sgFASN_1 tumors, n=5; MDAMB361 control tumors, n=6; MDAMB361 sgFASN_1 tumors, n=8).
h) Western blot analysis of FASN and β-actin expression in BT474 cells in which CRIPSR interference (CRISPRi) was used to suppress FASN expression. Cells were transduced with sgRNA targeting FASN (sgFASN) or a non-targeting control (sgNTC).
i) Kaplan-Meier survival curve for NSG mice bearing brain tumors produced from the cells described in (h). Median survival was 38 and 47 days for mice bearing BT474 sgNTC and sgFASN tumors, respectively. Hazard ratio = 5.433; 95% confidence interval = 1.280 to 23.06. (BT474 sgNTC tumors, n=7; BT474 sgFASN tumors, n=7).
j) Tumor growth after intracarotid injection of BT474 control cells, or two independently derived BT474 cell clones in which FASN had been disrupted by CRISPR/Cas9 (sgFASN_1 cells are presented in panels Figure 5a–g and sgFASN_2 cells are presented in Extended Data Figure 6b–d). In all cases, cells had been previously engineered to express secreted Gaussia luciferase, allowing tumor growth in the brain to be assessed by measurement of blood luciferase6,22. p = 0.0006 by two-way ANOVA (Days × Groups [Control, sgFASN_1, sgFASN_2]). (BT474 control tumors, n=7; BT474 sgFASN_1 tumors, n=7; BT474 sgFASN_2 tumors, n=6).
Data presented in panels b, c, d, e, f, and j are means ± SEM.
To test whether fatty acid synthesis is required for breast cancer growth in different tissue sites, we implanted control and sgFASN cells into the brain and MFP of mice and assessed tumor growth over time by ultrasound using cranial windows and by caliper measurement, respectively. Though there were only minimal differences in tumor growth between control and sgFASN cells implanted in the MFP (Fig. 5e), the growth of tumors derived from sgFASN cells implanted in the brain was impaired (Fig. 5f, Extended Data Fig. 6a). Disruption of FASN expression also improved the survival of mice with breast tumors implanted in the brain (Fig. 5g). Similar findings were obtained when comparing growth of additional sgFASN BT474 and MDAMB361 clones generated from a different gRNA, such that in all cases FASN disruption was associated with impaired breast cancer growth in the brain (Extended Data Fig. 6b–f). The large size of the FASN cDNA prevented an ability to rescue FASN expression in knockout clones, so to determine whether clonal effects might contribute to the phenotypes we observe, we also targeted FASN expression in a population of BT474 cells by CRISPR interference (CRISPRi), and again found reduction in FASN expression led to increased survival of mice bearing brain tumors (Fig. 5h, i). CRISPRi-mediated knockdown of FASN expression also impaired growth of another HER2-amplified cell line, JIMT1, in the brain (Extended Data Fig. 7a, b). Taken together, these findings argue there is a dependency on FASN for breast cancer growth in the brain.
Breast cancer brain metastases models involving direct stereotactic implantation of breast cancer cells recapitulate some clinical findings, but can cause an artificial disruption of the BBB/BTB that is not found in spontaneous metastases6,22. Intracarotid injections of breast cancer cells is an alternative approach that allows for cells to specifically extravasate and colonize the brain, and disruption of FASN expression in BT474 cells also reduces brain tumor growth using this model (Fig. 5j)40. Taken together, these data further support that lipid synthesis is required for breast cancer cells to rapidly grow in the brain microenvironment.
Consistent with impaired fatty acid synthesis in BT474 sgFASN tumors, levels of some lipid species, including TAGs containing MUFAs, were measured to be lower in sgFASN tumor tissue compared to control tumor tissue, while TAG species containing PUFAs were increased in sgFASN tumor tissue compared to control tumors (Extended Data Fig. 8a). A similar pattern was observed in acylglycerol levels measured from cultured sgFASN cells compared to control cells (Extended Data Fig. 8b). These data further support a relative shift in MUFAs and PUFAs reflecting the contribution of de novo synthesized versus uptake of exogenous fatty acids, and supports that brain tumors require fatty acid synthesis due to decreased access to lipids in this tissue environment.
To further study whether fatty acid synthesis is a site-specific metabolic liability for breast cancer in the brain, we considered whether BT474 cells depend on FASN to grow in liver, a common site of breast cancer metastasis. We first assessed lipid availability at this site, and observed that the levels of many storage lipids were higher in liver extracellular fluid and tissue than in corresponding samples collected from brain, although the identity of many of the enriched lipid species differed from those measured in MFP extracellular fluid or tissue (Extended Data Fig. 9a,b). We found levels of FASN expression in BT474 liver and brain tumors to be similar (Extended Data Fig. 9c), consistent with data collected from clinical samples (Fig. 3e), although levels of SCD1 and ACLY were lower in liver lesions when compared to brain tumors (Extended Data Fig. 9c). We also assessed the fate of 13C-carbon from glucose in BT474 liver tumors and observed a contribution of glucose to palmitate that was reduced relative to BT474 brain tumors (Fig. 1e, Extended Data Fig. 9d–f). Finally, we assessed whether lipid synthesis was important for tumor growth in the liver, and observed that sgFASN BT474 liver tumor growth was similar to that of control tumors (Extended Data Fig. 9g). These data are consistent with a requirement for de novo lipid synthesis in breast cancer brain tumors that is not shared with other extracranial sites, and supports fatty acid synthesis as a site-specific metabolic liability of breast cancer brain metastases.
To further evaluate the therapeutic implications of these findings, we used brain tumor organotypic slice cultures to test whether availability of exogenous lipids impact response to pharmacological fatty acid synthesis inhibitors, as this system has the benefit of avoiding issues with delivery of both drugs and lipids across the BBB/BTB in vivo. TVB3166 is a selective FASN inhibitor related to a small molecule drug currently in clinical trials for treatment of patients with metastatic breast cancer (NCT03179904). We confirmed that TVB3166 robustly suppresses fatty acid synthesis and palmitate levels in BT474 cells in culture (Fig. 6a, b). Increased cancer cell death was observed when BT474 brain tumor-derived slices were exposed to TVB3166 in delipidated media, but tumor slices cultured in lipid-rich media were more resistant to TVB3166 (Fig. 6c Extended Data Fig. 10a–c). These data support decreased availability of environmental lipids promoting dependency on fatty acid synthesis for breast cancer cells in the brain.
Figure 6. Lipid availability determines response to pharmacological FASN inhibition.
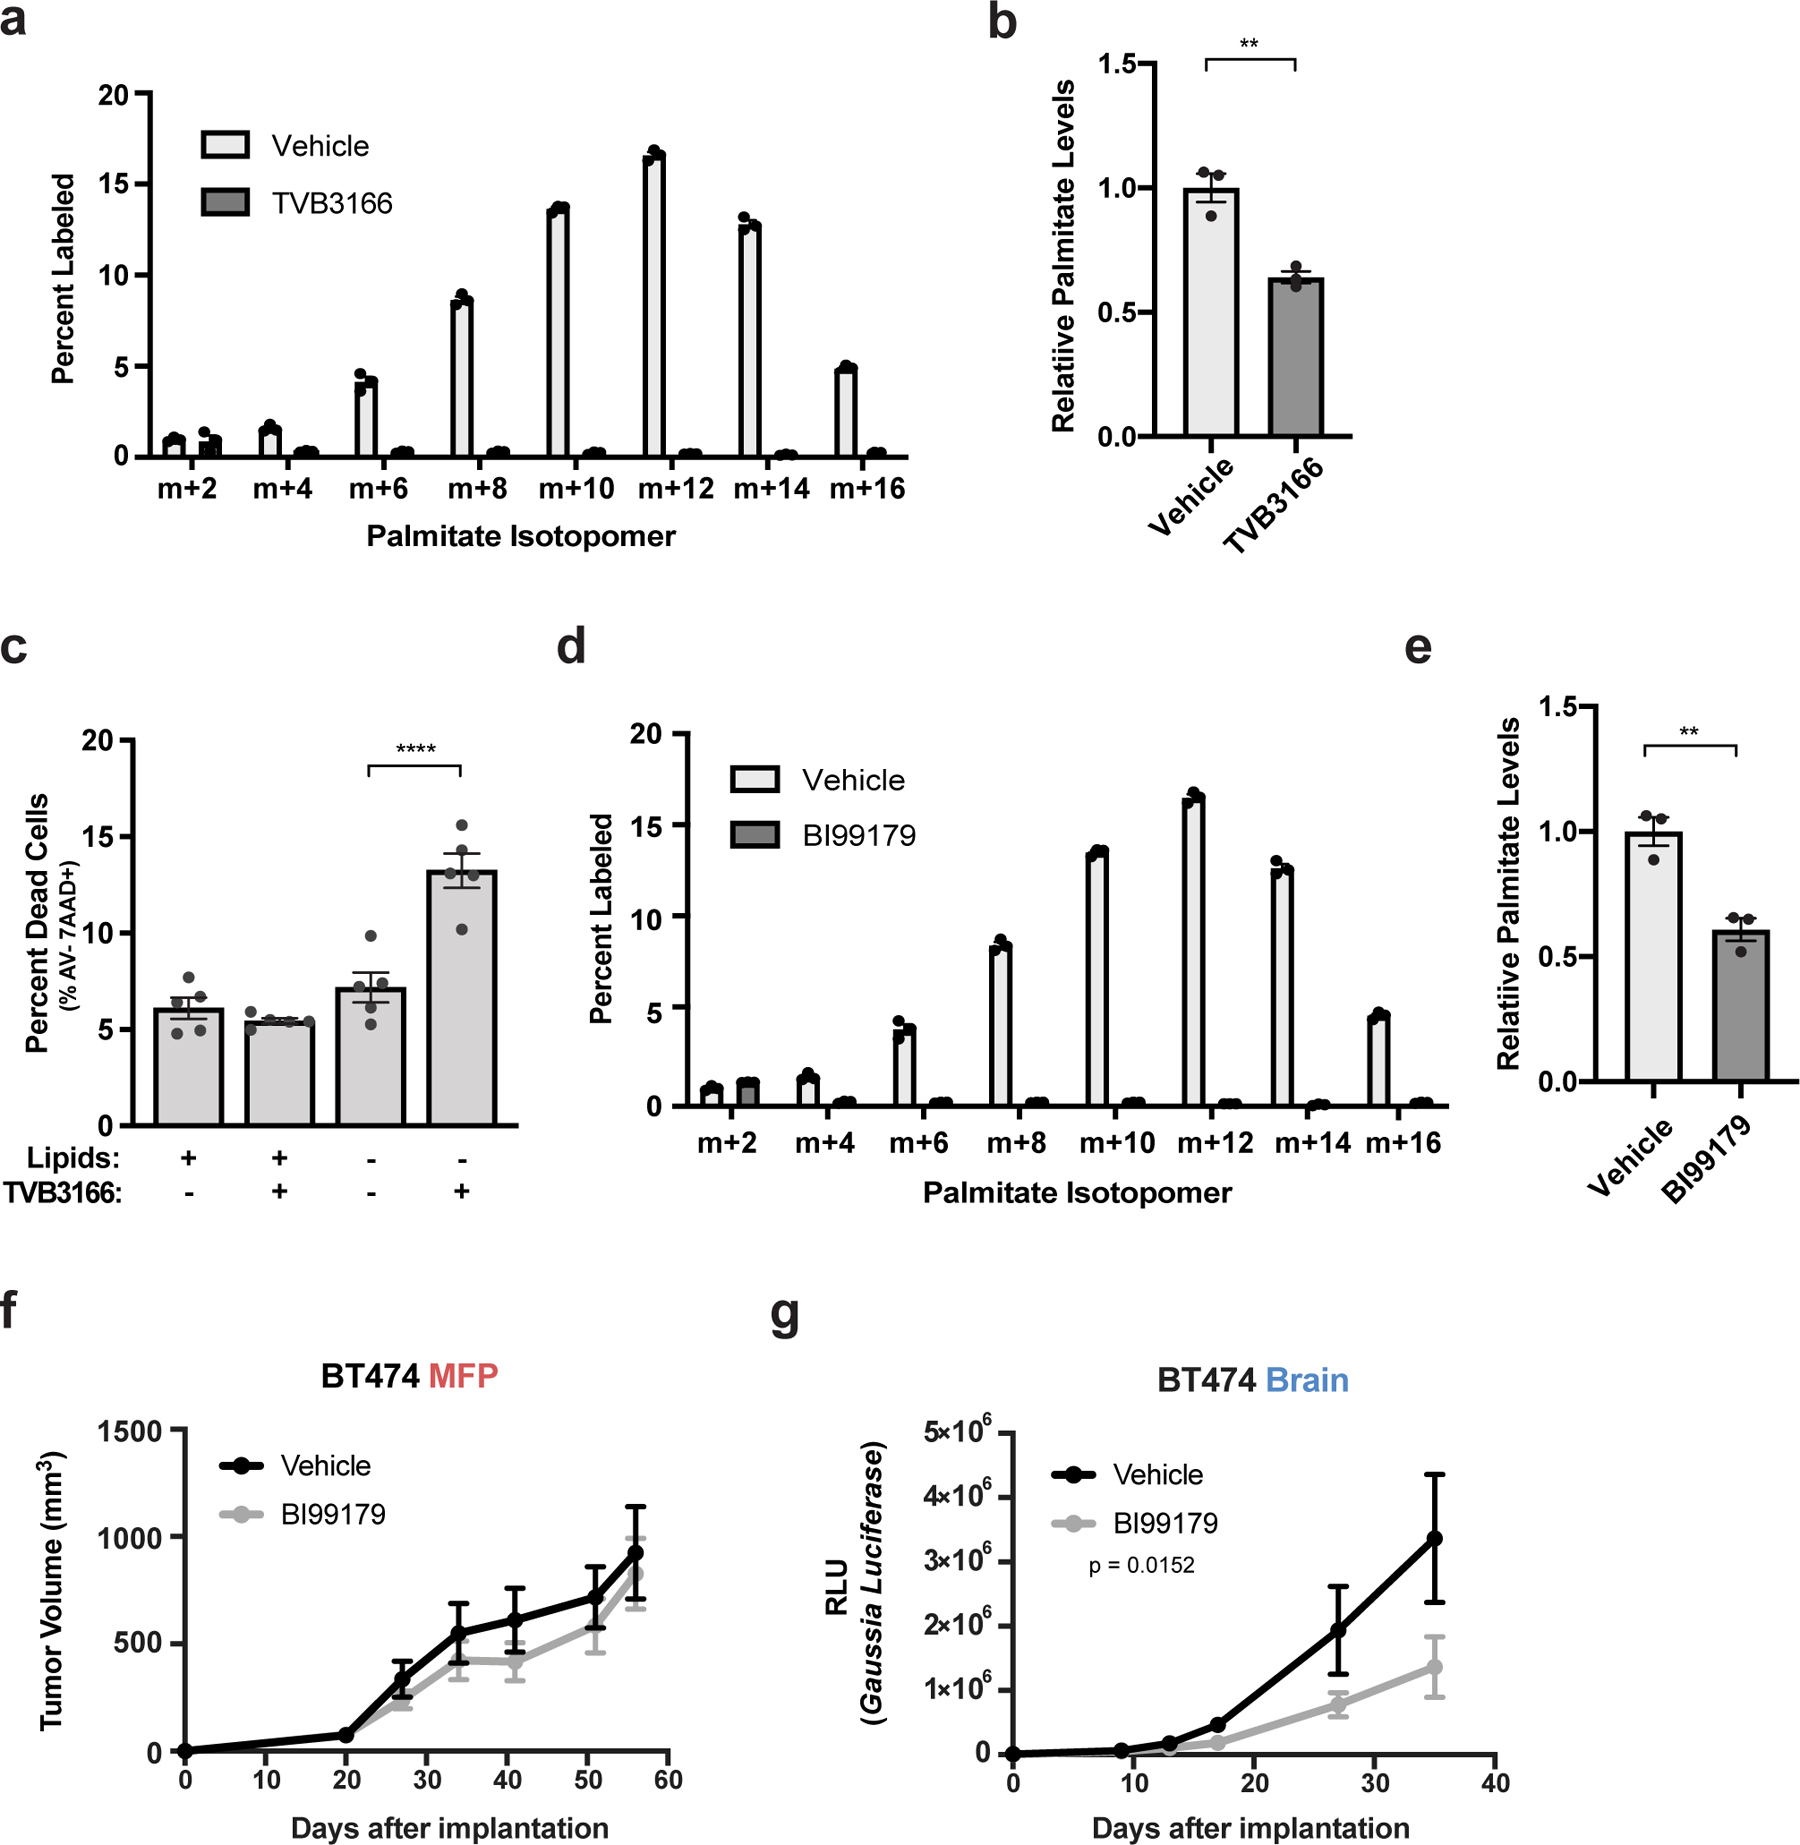
a) The percent labeling of even isotopologues of saponified palmitate as measured by GCMS from BT474 cells cultured in vitro for 72 hours with 13C-glucose and DMSO or 1 μM TVB3166. (n=3 cell culture biological replicates).
b) Relative levels of saponified palmitate measured by GCMS from BT474 cells cultured for 72 hours with DMSO or 500 nM TVB3166 as indicated. Palmitate levels are normalized to the vehicle-treated condition. ** p = 0.0042 by two-tailed unpaired t-test (n=3 cell culture biological replicates).
c) BT474 brain tumor-derived organotypic slice cultures were treated for 6 days with vehicle or 500 nM TVB3166 in standard (+Lipids) or delipidated (-Lipids) media. The percent of apoptotic and viable HER2 positive BT474 cells was determined by measuring Annexin V (AV) and 7-amino actinomycin D (7AAD) uptake by flow cytometry. The flow cytometry gating strategy is presented in Supplementary Figure 2. **** p < 0.0001 by one-way ANOVA followed by Tukeýs test (n=5 BT474 brain tumor slices).
d) The percent labeling of even isotopologues of saponified palmitate as measured by GCMS from BT474 cells cultured in vitro for 72 hours with 13C-glucose and DMSO or 1 μM BI99179. The vehicle control samples are the same as those presented in (a) (n=3 cell culture biological replicates).
e) Relative levels of saponified palmitate measured by GCMS from BT474 cells cultured in vitro for 72 hours with DMSO or 1 μM BI99179. Palmitate levels are normalized to the vehicle-treated condition. ** p = 0.0055 by two-tailed unpaired t-test. The vehicle control samples are the same as those presented in (b). (n=3 cell culture biological replicates).
f, g) Growth over time of BT474 MFP (f) or brain tumors (g) in NSG mice treated daily with vehicle or BI99179 (15 mg/kg). Tumor volumes were measured by caliper (MFP) or secreted Gaussia luciferase (Brain). MFP, not significant; Brain, p = 0.0152 by two-way ANOVA (Days × Group). (MFP vehicle tumors, n=5; MFP BI99179 tumors, n=7; Brain vehicle tumors, n=5; Brain BI99179 tumors, n=5). Data presented in all panels are means ± SEM.
To explore whether FASN inhibitors may be effective in controlling breast cancer brain metastasis, we evaluated the ability of a brain-permeable FASN inhibitor (BI99179)41 to affect breast tumor growth. We confirmed that BI99179 inhibited fatty acid synthesis and lowered palmitate levels in BT474 cells in culture (Fig. 6d,e), and then assessed the effect of BI99179 on the growth of BT474 tumors in vivo. We found that BI99179 treatment at doses that do not cause significant weight loss (Extended Data Fig 10d,e) specifically impaired tumor growth in the brain but not in the MFP (Fig. 6f,g). These data support fatty acid synthesis inhibition as a potential therapeutic approach for treating breast cancer brain metastasis.
DISCUSSION
Nutrient availability can differ across organs, which can influence how metabolism supports cancer cell proliferation and response to some therapies 29,37,42–46. To accumulate biomass, cells rely on de novo synthesis of materials that cannot be obtained from the extracellular environment. We show that the brain microenvironment has low lipid availability relative to other tissue sites, imposing a dependency for fatty acid synthesis in breast tumors growing in this tissue. Sterol regulatory element-binding protein (SREBF1), a transcription factor that regulates de novo lipogenesis including FASN, ACC1, and SCD1 expression, has recently been shown to be a requirement for breast cancer brain metastasis47, further supporting the hypothesis that activating fatty acid synthesis is required for breast cancer growth in the brain.
Interestingly, brain-tropic breast cancer lines exhibit reprogrammed lipid metabolism, including altered lipid transport, synthesis, and beta-oxidation48–50, which may reflect the fact that some breast cancers can use different strategies to overcome the limited access to lipids in the brain. The finding that FASN expression was high in all human breast cancer brain metastases examined argues that a requirement for de novo synthesis may be a common way to overcome lipid limitation in this tissue; however, whether activation of fatty acid synthesis is important prior to seeding the brain, or is induced by the lipid-poor brain tissue microenvironment remains an open question. The fact that high FASN expression is also observed in some primary lesions, and that pre-existing dependence on SREBF1 can predict which cells have propensity to colonize the brain47, suggests that extracranial selection for increased fatty acid synthesis may promote brain metastasis. However, our data suggest a functional requirement for fatty acid synthesis to grow in the brain, which requires FASN expression, but is not entirely predicted by FASN expression alone, and low environmental lipids also promote fatty acid synthesis. Of note, altered lipid metabolism has been demonstrated in primary brain tumors34,51, and either pre-existing selection for increased lipid synthesis or activation of lipid synthesis by exposure to the lipid-poor brain microenvironment could be a general feature of many cancers growing in this tissue site.
The brain is a lipid-rich tissue, but contains specialized lipids that differ from the storage lipids found in other sites52. Salvaging fatty acids from existing brain lipids may be an alternative to increasing fatty acid synthesis for some breast cancers and other malignancies, and could explain some variability in lipid synthesis enzyme expression observed in breast cancers growing in the brain. Gaining access to available brain lipids may be a mechanism of resistance to genetic or pharmacological inhibition of FASN, as delayed tumor growth is still observed in some animals despite targeting of this enzyme. Additionally, the permeability of the BBB/BTB can affect nutrient levels of the brain microenvironment, and could influence the degree to which tumors in this site have access to environmental lipids.
More broadly, these findings argue that the ability of cancer cells to synthesize specific biomass components that are not available in their environment may dictate whether they can form tumors in a particular tissue. Differential access to serine in tissues determines whether serine synthesis is required to grow in that tissue16,53 and access to other metabolites can also dictate tumor growth in specific sites21,54. Knowledge of environmental nutrient levels, and characterization of which nutrients are limiting for growth for different cancers in those environments, could guide therapeutic opportunities to target cancer metabolic dependencies in different tissue sites16,21,34,51,55,56, including brain metastasis.
METHODS
Cell Lines and Cell Culture.
BT474 and MDAMB361 cells were transduced with an expression cassette encoding Gaussia Luciferase and GFP as previously described6. JIMT1 cells were transduced with an expression cassette encoding Firefly Luciferase and GFP47. All lines studied harbor HER2 amplifications, and BT474 and MDAMB361 cells also express hormone receptors (estrogen receptor and progesterone receptor positive), while JIMT1 cells lack hormone receptor expression57. MDAMB361 and JIMT1 cells harbor PIK3CA hotspot mutations (E545K and C420R respectively). All cell lines were purchased from ATCC and authenticated. BT474 cells were maintained in RPMI 1640 supplemented with 10% fetal bovine serum (FBS). MDAMB361 were maintained in DMEM/F12 supplemented with 10% FBS. JIMT1 cells were cultured in DMEM supplemented with 10% FBS. For drug treatments, 500 nM TVB3166 1 μM BI99179 (Boehringer Ingelheim, https://opnme.com/molecules/fas-bi99179) or vehicle (DMSO) was added to culture media.
For experiments involving lipid depleted media, lipid stripped serum (-Lipids) was generated58. In brief, FBS was mixed with 0.8 volumes di-isopropyl ether and 0.2 volumes n-butanol for 30 minutes at room temperature. Phases were separated by centrifugation at 4,000×g for 15 minutes at 4°C, and the lower phase was mixed for 30 minutes at room temperature with a volume of di-isopropyl ether equal to the original volume of serum used. The lower aqueous phase was collected, stirred under a slow stream of nitrogen gas overnight, and subsequently dialyzed against 4×10 volumes of 9 g/L NaCl at 4°C. Control serum (+Lipids) was dialyzed in the same manner. The protein concentration of lipid stripped and control sera was quantified using a Bradford Assay, corrected with saline, and stored at −20°C.
Tumor Models Involving Different Tissue Sites.
Breast cancer xenografts in MFP, liver, and brain were generated in 8–9 week old female nude or NOD-Scid Gamma (NSG) mice as previously described6. Mice were implanted subcutaneously with a 0.36-mg 17β-estradiol pellet the day before implantation of tumor cells. Pellets were replaced in all animals at the expiration date. Nude mice were used for 13C-glucose tracing experiments performed in vivo and in organotypic slice cultures, and NSG mice were used for all other animal experiments. To generate MFP and liver tumors, 5×10⁶ BT474 cells were resuspended in 50 μL or 10 μL in a 1:1 ratio of phosphate buffered saline (PBS) and Matrigel Matrix. For brain tumors, 1×10⁵ BT474 cells were diluted in 1 μL PBS and stereotactically injected into the left frontal lobe of the mouse brain. For the intracarotid model, 2×10⁵ BT474 cells expressing Gaussia luciferase were diluted in 100 μL PBS and were injected through a catheter placed in the left carotid artery. For tissue studies, brain tumors were collected after reaching a volume of 60–80 mm3 by resecting the visually distinct tumor (GFP+). MFP tumors were resected upon reaching a size of 100–140mm3. All animal procedures were performed according to the guidelines of the Public Health Service Policy on Human Care of Laboratory Animals and in accordance with a protocol approved by the Institutional Animal Care and Use Committee of Massachusetts General Hospital and Massachusetts Institute of Technology.
Isolation of Cancer Cells from Brain Metastatic Tumors.
BT474 brain tumors were permitted to reach a size 60 mm3 and excised. Resected tissue was minced in RPMI and incubated in RPMI supplemented with 10% FBS, 1% penicillin/streptomycin (P/S), and 1 mg/mL collagenase/dispase enzyme mix at 37°C for 1 hour. Tissue was then centrifuged at 1500 rpm for 5 minutes, and the pellet resuspended in RPMI supplemented with 10% FBS and 1% P/S, pipetted well to dissociate clumps, and medium was refreshed the following day.
Tumor organotypic slice cultures.
Established brain or MFP BT474 mouse xenografts at a size of 100–120mm3 were excised and sliced into 300 μM thick sections using a microtome (Precisionary Instruments, Compresstome, VF-300). Slice cultures were grown on Hydrophilic PTFE cell culture inserts for up to 6 days. To trace 13C-glucose fate in tissue explants, each sample was washed three times with PBS and medium was replaced with DMEM without glucose, glutamine, or sodium pyruvate supplemented with 25 mM 13C-glucose, 4 mM glutamine, and 10% dialyzed FBS. Slice cultures were exposed to 13C-glucose for 3 days before metabolites were extracted for analysis. For drug studies involving slice cultures, 500 nM TVB3166 or vehicle (DMSO) was added to culture media supplemented with 10% dialyzed FBS (+Lipids) or with 10% lipid-stripped FBS (-Lipids). After 6 days, cells were dissociated (Accutase) and analyzed by flow cytometry using Aria III Fusion SORP. For this analysis, HER2-positive cells were sorted with a phycoerythrin-conjugated HER2 antibody and cell viability was assessed with 7-amino-actinomycin D, APC-Annexin V and Alexa Fluor® 700-Ki67 antibodies. For all experiments, medium was exchanged every 2 days. The flow cytometry gating strategy is presented in Supplementary Figure 2.
Tumor Growth Monitoring and Animal Drug Dosing.
To assess tumor volume, in vivo imaging was performed through a cranial window using a small animal ultrasonography device (FujiFilm VisualSonics Inc., Vevo 2100)59. When cranial windows were not used, serum luciferase was employed as a proxy for brain tumor size6,22,60. Tumors generated from BT474 and MDAMB361 cell lines engineered to express secreted Gaussia luciferase allow tumor size to be monitored by quantification of luciferase activity from blood collected from the tail vein. To monitor JIMT1 tumor growth, JIMT1 cells were engineered to express Firefly luciferase47 and tumor burden was evaluated using whole body luminescence imaging (IVIS® Lumina, Xenogen). MFP tumor volumes were measured by caliper6. Liver tumor growth was determined by small-animal, high-frequency ultrasonography imaging (Vevo 2100, FujiFilmVisualSonics Inc.)6.
For mouse FASN inhibitor studies, 15 mg/kg BI99179 (Boehringer Ingelheim) in PEG300 or vehicle alone was administered daily by oral gavage.
13C-Glucose Tracing Experiments.
To trace glucose fate in mouse tissues, tumors were permitted to reach a size of 100–120 mm3 for MFP and 60 mm3 for Brain BT474 tumors. Catheters were surgically implanted into the jugular vein of tumor bearing animals 3 days before the experiment, and mice were fasted for the last 6 hours. 13C−glucose (Cambridge Isotopes Laboratories) was infused at a constant rate of 30 mg/kg/min for 12 hours into conscious, free-moving animals, after which the animals were terminally anesthetized with 120 mg/kg sodium pentobarbital. Blood was collected immediately by cardiac puncture, and tumors and noncancerous tissue were harvested within 5 minutes of sacrifice. Tissues were frozen using the BioSqueezer (BioSpec Products, 1210) and stored at −80°C for subsequent metabolite extraction and analysis61.
To trace glucose fate in culture, cells were plated at 150,000 cells per well in 6-well dishes. The following day, cells were washed three times with PBS and incubated in DMEM without glucose, glutamine, or sodium pyruvate supplemented with 25 mM 13C-glucose, 4 mM glutamine, 10% dialyzed FBS and the indicated treatment condition for 3 days prior to metabolite extraction61.
Metabolite Extraction from Cells and Tissues.
Metabolites were isolated as described previously 61,62. Briefly, tissues or organotypic slice cultures were fragmented into small (~10–30 mg) pieces, weighed, and homogenized cryogenically (Retsch Cryomill). Metabolites were extracted using ice-cold HPLC-grade methanol, water, and chloroform at a volume ratio of 600:400:300. Samples were vortexed for 10 minutes at 4°C and centrifuged for 10 minutes at 21,000×g and 4°C to separate the top, aqueous layer and the bottom, organic layer. Each layer was collected and dried under nitrogen gas, and stored at −80°C for subsequent analysis by gas-chromatography mass-spectrometry (GCMS). Tissues processed to generate Figure 1a were suspended 1 mL of 80% cold HPLC-grade methanol and homogenized (Qiagen TissueLyser) by multiple 45 second rounds at 28 Hz until the sample was near homogenous. Next, samples were spun at 13,000×g for 5 minutes, and the supernatant was collected for metabolite analysis by liquid-chromatography mass-spectrometry (LCMS)
For cell culture experiments, cells in 6-well plates were washed three times with ice-cold saline and lysed with 400 μL of cold HPLC-grade methanol with 25 mg/L butylated hydroxytoluene and 2.5 μg/ml 17:1 standard. Samples were scraped, collected into glass vials and 800 μL of cold dichloromethane was added to the tube. The glass vials were then vortexed for 10 minutes at 4°C. 300 μL of 0.88% (w/v) KCl was added to the tube, vortexed for 5 minutes at 4°C and centrifuged at 4500 rpm at 4°C. 650 μL of the bottom fraction was collected into glass vials and dried down prior to derivatization prior to analysis on GCMS.
For lipidomics, pre-weighed samples were homogenized at 1:10 ratio (tumors) or 1:4 ratio (tissues) in water with 2×3mm beads for 2–4 minutes. For CSF, 5 μL of sample was extracted in 95 μL of extraction buffer (Isopropanol with 24:0 standard [1,2-didodecanoyl-sn-glycero-3-phosphocholine (Avanti Polar Lipids)]). For plasma, 10 μL of sample was extracted in 190 μL of extraction buffer. For ECF, 1 μL of sample was extracted in 100 μL of extraction buffer. For cells in culture, cells in 6-well plates were washed three times with ice cold saline and extracted in 500 μL of extraction buffer. Extracts were vortexed and incubated for 1 hour followed by centrifugation for 10 minutes at 10,000×g at room temperature prior to analysis on LCMS.
Metabolite Measurement by LCMS
Polar metabolites presented in Figure 1a were analyzed by a 5500 QTRAP hybrid dual quadrupole ion trap mass spectrometer (AB/SciEx) coupled to a Prominence HPLC (Shimadzu)62. Full data from this experiment is provided in Source Data Table 1. For analyses of polar and non-polar lipids, an LCMS system comprising a Shimadzu Nexera X2 U-HPLC coupled to an Exactive Plus Orbitrap Mass Spectrometer (Thermo Fisher Scientific) was used. 2 μL (Plasma & Tissues) or 10 μL (Tumors, CSF, and ECF) was injected onto an ACQUITY BEH C8 column (100 × 2.1 mm, 1.7 µm; Waters). The column was eluted isocratically with 80% mobile phase A (95:5:0.1 vol/vol/vol 10 mM ammonium acetate/methanol/formic acid) for 1 minute followed by a linear gradient to 80% mobile-phase B (99.9:0.1 vol/vol methanol/formic acid) over 2 min, a linear gradient to 100% mobile phase B over 7 minutes, then 3 minutes at 100% mobile-phase B. MS data were acquired using electrospray ionization in the positive-ion mode over 200–1100 m/z and at 70,000 resolutions. Other MS settings were: sheath gas 50, in source CID 5 eV, sweep gas 5, spray voltage 3 kV, capillary temperature 300 °C, S-lens RF 60, heater temperature 300 °C, microscans 1, automatic gain control target 1×10⁶, and maximum ion time 100 ms. Raw data were processed using TraceFinder 3.3 (Thermo Fisher Scientific) and Progenesis QI (Nonlinear Dynamics) software for detection and integration of LCMS peaks. Lipid identities were determined based on comparison to reference standards and reference plasma extracts and were denoted by total number of carbons in the lipid acyl chain(s) and total number of double bonds in the lipid acyl chain(s). Heatmaps were generated in heatmap R package with z-score normalization within each row (metabolite). For cell culture experiments, data was normalized to protein content as determined by sulforhodamine B (SRB) assay63. Full lipidomic data collected for all experiments is provided in Source Data Table 2.
Metabolite Measurement by GCMS
For derivatization of polar metabolites, frozen and dried metabolites from the aqueous phase were dissolved in 20 μL of Methoxamine (MOX) Reagent (2% solution of methoxyamine-hydrogen chloride in pyridine) and incubated at 37°C for 90 minutes. Subsequently, 25 μL of N-tert-Butyldimethylsilyl-N-methyltrifluoroacetamide (MTBSTFA) with 1% tert-Butyldimethylchlorosilane (t-BDMCS) was added and samples were held at 60°C for one hour. Samples were vortexed, transferred to GCMS vials and capped. For derivatization of glucose, frozen and dried metabolites from the aqueous phase were dissolved in 50 μL of 2 wt% hydroxylamine hydrochloride in pyridine and incubated at 90°C for 1 hour. Next, 100 μL of propionic anhydride was added and the samples were kept at 60°C for 30 minutes. The samples were dried under nitrogen gas, and resuspended in 100 μL of ethyl acetate, transferred to glass GCMS vials and capped.
For derivatization and analysis of fatty acid methyl-esters (FAME), frozen and dried metabolites from the organic phase were saponified to free fatty acids and esterified to form fatty acid methyl esters. For tissues, 500 μL of 2% H2SO4 was first added to each sample and incubated for 2 hours at 50°C. Next 100 μL of a saturated salt solution (sodium chloride dissolved in HPLC-grade water) and 500 μL of HPLC-grade hexane was added and the sample was vortexed. The top hexane layer was collected and evaporated under nitrogen gas. For cell culture experiments, 100μL of toluene and 200μL of H2SO4 was added to each sample and incubated overnight at 50°C. Next, 500 μL of 5% sodium chloride solution (in HPLC-grade water) and 500uL of HPLC grade hexane was added and sample was vortexed. The top hexane layer was collected and samples were extracted again with 500uL of HPLC grade hexane. The top hexane layers were combined and evaporated under nitrogen gas. Each sample was resuspended with 50 μL of fresh HPLC-grade hexane, vortexed, and transferred to glass GCMS sample vial.
GCMS analysis was performed using an Agilent 7890 GC equipped with 30m DB-35MS capillary column connected to an Agilent 5975B MS operating under electron impact ionization at 70eV. For each sample, 1 μL was injected at 270°C using helium gas as a carrier with a flow rate of 1 mL/min. For the measurement of polar metabolites, the GC oven temperature was kept at 100°C for three minutes and increased to 300°C at a rate of 3.5°C/min. The MS source and quadrupole were kept at 230°C and 150°C, respectively, and the detector was run in scanning mode, recording ion abundance within 100–605 m/z. Mass isotopologue distributions were determined by integrating the appropriate ion fragments and correcting for natural isotope abundance using in-house algorithms adapted as previously reported64,65. For cell culture experiments, data was normalized to protein content as quantified by SRB assay63.
Imaging Mass Spectroscopy.
Tissue sections (12 μm) were cut from brain biopsy specimens using a cryostat (Leica, CM1850) and thaw-mounted onto standard glass microscope slides66. For MALDI-MSI analysis, diaminonaphthalene (DAN) matrix, prepared at 5 mg/mL in acetone/water (7:3) was applied to the tissues via a TM-Sprayer automated MALDI tissue-prep device (HTX Technologies) under the following optimized conditions: a 0.05 mL/min flow rate, a 60°C nozzle temperature, and a 1.3 mm/s raster speed with 20 passes over the tissue. MALDI-MSI acquisition was performed using a MALDI LTQ Orbitrap XL mass spectrometer (Thermo Fisher Scientific) with a resolution of 60,000 at m/z 400 (full width at half maximum). Imaging data were acquired in full-scan mode to maximize sensitivity. Spectra were acquired in negative mode, across the mass range of m/z 200–2000 with a laser energy of 20 μJ and five shots per position (one microscan per position). 2D ion images were generated using Thermo ImageQuest software (v1.01). Normalized ion images of lipid signal were generated by dividing by the Total Ion Counts (TIC).
Western Blot Analysis.
Tumor tissues or cells were homogenized in RIPA buffer supplemented with protease and phosphatase inhibitors using a micro-homogenizer (Pro Scientific, PRO200) or cell scraper. Lysates were centrifuged at 18,000×g for 30 minutes at 4°C. Protein concentration was quantified using a Bradford Assay. Samples were boiled in LDS sample buffer under reducing conditions, and resolved by SDS-PAGE before proteins were transferred onto nitrocellulose membranes using the iBlot 2 Dry Blotting System (Thermo Fischer Scientific) or wet tank transfer system (Bio-Rad). For detection, HRP linked Anti-Rabbit IgG secondary antibody and chemiluminescent signal detection was used with a digital imager (GE Healthcare, LAS 4000). Uncropped Western blots images are presented in Source Data Files.
Whole Transcriptome Microarray Analysis.
Raw data from gene arrays are available at Gene Expression Omnibus (GEO accession number: GSE86849)6. Gene set enrichment analysis was performed using gene set permutation and signal-to-noise ratio as a ranking metric.
RNA sequencing analysis of matched human samples.
Raw count data (.txt file) from RNA sequencing of patients with matched primary breast and metastatic tumors were downloaded from https://github.com/npriedig/jnci_2018 30. The R packages “edgeR” and “DESeq2” were used to normalize and calculate differentially expressed genes. The results were then plotted using “heatmap.2” from the R packages “gplots” and “ComplexHeatmap”. The edgeR likelihood ratio (LR) was used to generate a pre-ranked gene list for Gene Set Enrichment Analysis. GSEA was then run pre-ranked with default parameters (1000 gene set permutations, weighted enrichment statistic), using the Hallmarks, Biocarta, and REACTOME gene set collections provided by MSigDB (http://software.broadinstitute.org/gsea/msigdb).
Gene expression analysis of unmatched human samples.
Microarray dataset GSE14020 was downloaded from Gene Expression Omnibus and collected using the Affymetrix Human Genome U133/A Array platforms32,33. The raw data was converted to a recognizable format by GEO2R (https://www.ncbi.nlm.nih.gov/geo/geo2r/). GEO2R performs comparisons on original submitter-supplied processed data tables using the GEOquery package which parses GEO data into R data structures that can be used by other R packages and limma (Linear Models for Microarray Analysis) R package from the Bioconductor project. After log2 transformation and normalization, a Fisher’s exact test was used to assess statistical significance of FASN (probe id: 212218_s_at) and SCD1 (probe id: 200832_s_at) expression between metastatic brain tissue samples and samples from other metastatic tissues (bone, lung, and liver).
Human cancer tissue analysis by Immunohistochemistry.
Immunohistochemistry studies were conducted on breast cancer tissues from 11 patients diagnosed with metastatic breast cancer at Massachusetts General Hospital (MGH) and Brigham and Women’s Hospital (BWH). This study was approved by the Institutional Review Board at BWH and MGH. The surgical pathology files were searched for matched pairs of primary invasive ductal carcinoma and metastasis to the brain. Patient records were reviewed for patient age, receptor status, treatment with neoadjuvant therapy, progression free survival and overall survival. All patient samples were de-identified prior to the study. Antibodies and conditions used for analysis are described below (see Immunohistochemistry and Immunofluorescence). Scoring for FASN expression in tumors cells was performed in a double-blinded fashion using a standardized scoring criteria, with whole number scores ranging from 0 to 3, reflective of staining intensity.
Immunohistochemistry and Immunofluorescence.
Paraffin-embedded BT474 MFP and brain tumors, primary human breast cancer and matched brain metastases were cut into 5 μm-thick serial sections and staining procedure done following the antibody manufacturer’s protocol immunohistochemistry (IHC) and immunofluorescence (IF). Epitopes were detected by DAB oxidation (IHC) or with an Cyanine3 or Cyanine5 fluorescence-conjugated secondary antibody (IF) and visualized by confocal microscopy. Sections were counterstained with hematoxylin and blued in Scott’s tap water substitute (Electron Microscopy Sciences) or 4′,6-diamidino-2- phenylindole (DAPI). For immunofluorescence analysis of organotypic slice cultures, slices were fixed using 4% paraformaldehyde in PBS and permeabilized in 0.5% Triton X-100 in PBS prior to immunostaining67.
Cell Proliferation Rate
BT474 or MDAMB361 cells were plated in triplicate in 12-well plates at 5×10⁴ and 1×10⁵ cells per well, respectively. Cells were allowed to adhere overnight, and to determine initial cell density three wells were counted at time of treatment using a Beckman Z2 Coulter Counter with a size selection setting of 10–30 μm. Remaining cells were washed three times with PBS and 2.5 mL of treatment media was added. Final cell counts (Coulter Counter) were measured 6 days after treatment, with medium replacement after 3 days.
Isolation of Cerebrospinal fluid, Extracellular Fluid, and Plasma.
Cerebrospinal fluid (CSF) was isolated from mouse brain as previously described68. Briefly, female NSG mice (8–12 weeks) were anesthetized and CSF collected by gently inserting a sharpened capillary (inner diameter 0.75 mm, outer diameter 1.0 mm) in the cisterna magna. Collected fluid was visually monitored for blood contamination. Extracellular fluid was isolated from organs using a previously described method37,69–72. Briefly, female NSG mice (8–12 weeks) were euthanized and tissues rapidly dissected, sliced in quadrants, and blotted on filter paper in less than 5 minutes. Tissue was placed onto 20 µm nylon filters affixed atop 50 mL conical tubes and centrifuged for 10 minutes at 4°C at 250×g. Extracellular fluid was collected, frozen in liquid nitrogen, and stored at −80°C. Fluid from tissues from up to ~8–10 mice was collected to permit analysis. Blood was also collected from the same animals via cardiac puncture and was immediately placed in EDTA-tubes and centrifuged at 845×g for 10 minutes at 4°C to separate plasma. Plasma was frozen in liquid nitrogen and stored at −80°C until further analysis.
Generation of FASN deficient cells.
sgRNA targeting FASN (Supplementary Figure 1, Supplementary Table 2) was cloned into lentiCRISPRv2. LentiCRISPRv2 empty vector was used for control cells. Lentiviral particles were produced and collected from 293T cells, and BT474 and MDAMB361 cell lines were transduced with lentiviral particles in the presence of 8 μg/ml polybrene. Virally transduced BT474 or MDAMB361 cells underwent puromycin selection (1 μg/ml) and were plated at low confluency and allowed to form single isolated colonies after 4 days. Medium was aspirated and the plate was washed with PBS. Cloning discs were dipped in trypsin, placed upon colonies, and allowed to incubate for 1–2 minutes. Discs were transferred with sterile forceps to a 24 well plate containing complete media. The expected disruption of the FASN coding sequence for both sgRNAs in BT474 and MDAMB361 cells was confirmed by either Next Generation Amplicon Sequencing or Sanger Sequencing (Supplementary Figure 1, Supplementary Table 2).
For FASN knockdown by CRISPRi, sgRNA targeting the promoter of FASN (Supplementary Table 2) were cloned into pLV hU6-sgRNA hUbC-dCas9-KRAB-T2a-Puro. Lentivirus was produced from 293T cells, and BT474 cells were transduced in the presence of 8 μg/mL polybrene and then selected with 1 μg/mL puromycin.
Statistics and Reproducibility.
Data are expressed as the means ± SEM unless otherwise noted. GraphPad Prism software was used for all statistical analysis. A t-test (two-tailed with equal variance) was used when only 2 groups were being compared. Paired t-test was performed for patient-matched expression analysis. In the case of multiple t-tests, a False Discovery Rate (FDR, 10%) correction was performed by the Benjamini, Krieger and Yekutieli approach. One-way ANOVA and Dunnet’s posttest were used to compare unmatched metastases to brain metastasis. One-way ANOVA and a Tukeýs posttest were used to compare multiple treatment arms in vitro. A grouped two-way ANOVA (mixed effect, Time X Group) were used to compare longitudinal tumor growth studies. Survival curves were estimated using the Kaplan–Meier method. A p-value < 0.05 was considered statistically significant. The number of mice required to demonstrate statistical significance in each group was estimated based on findings from previous experiments6. No statistical method was used to predetermine sample size. No data were excluded from the analyses. The Investigators were not blinded to allocation during experiments and outcome assessment. Experiments presented in Figure 1b, 2c, 4e–f, 5d, 5f, 6c, 6g and in Extended Data 2b, 5a, 5b, 10a–c were independently repeated and similar results were obtained. Experiments presented in Extended Data 1a–d were independently repeated 3 times, and similar results were obtained.
Extended Data
Extended Data Fig. 1. Histological characterization of MFP and brain BT474 tumors.
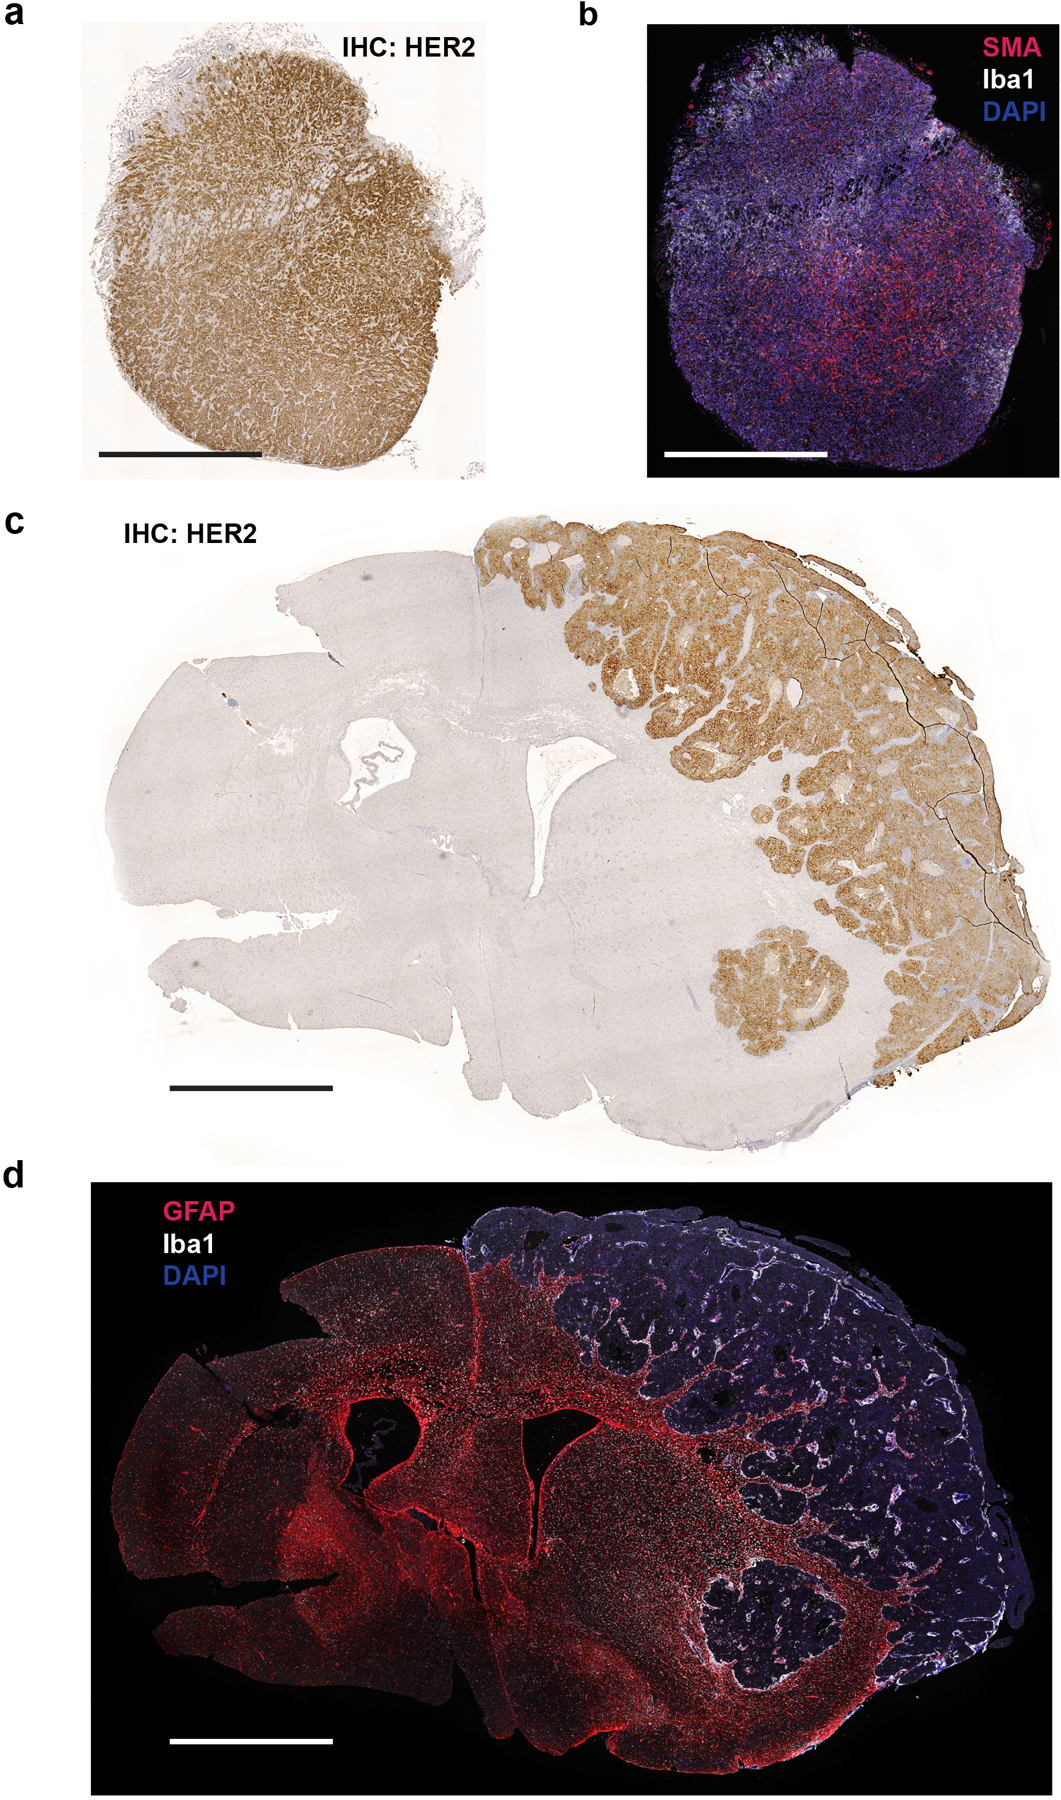
a) HER2 immunohistochemistry (IHC) of a BT474 mammary fat pad (MFP) tumor section.
b) Immunofluorescence (IF) of ionized calcium binding adaptor molecule 1 (Iba1) and α-smooth muscle actin (SMA) of a consecutive tissue section from the tumor presented in (a).
c) HER2 IHC of a BT474 brain tumor section.
d) IF of Glial fibrillary acidic protein (GFAP) and Iba1 of a consecutive tissue section from the tumor presented in (c).
For all panels, scale bar = 1 mm.
Extended Data Fig. 2. Assessment of glucose carbon fate in breast tumors growing in different tissue sites.
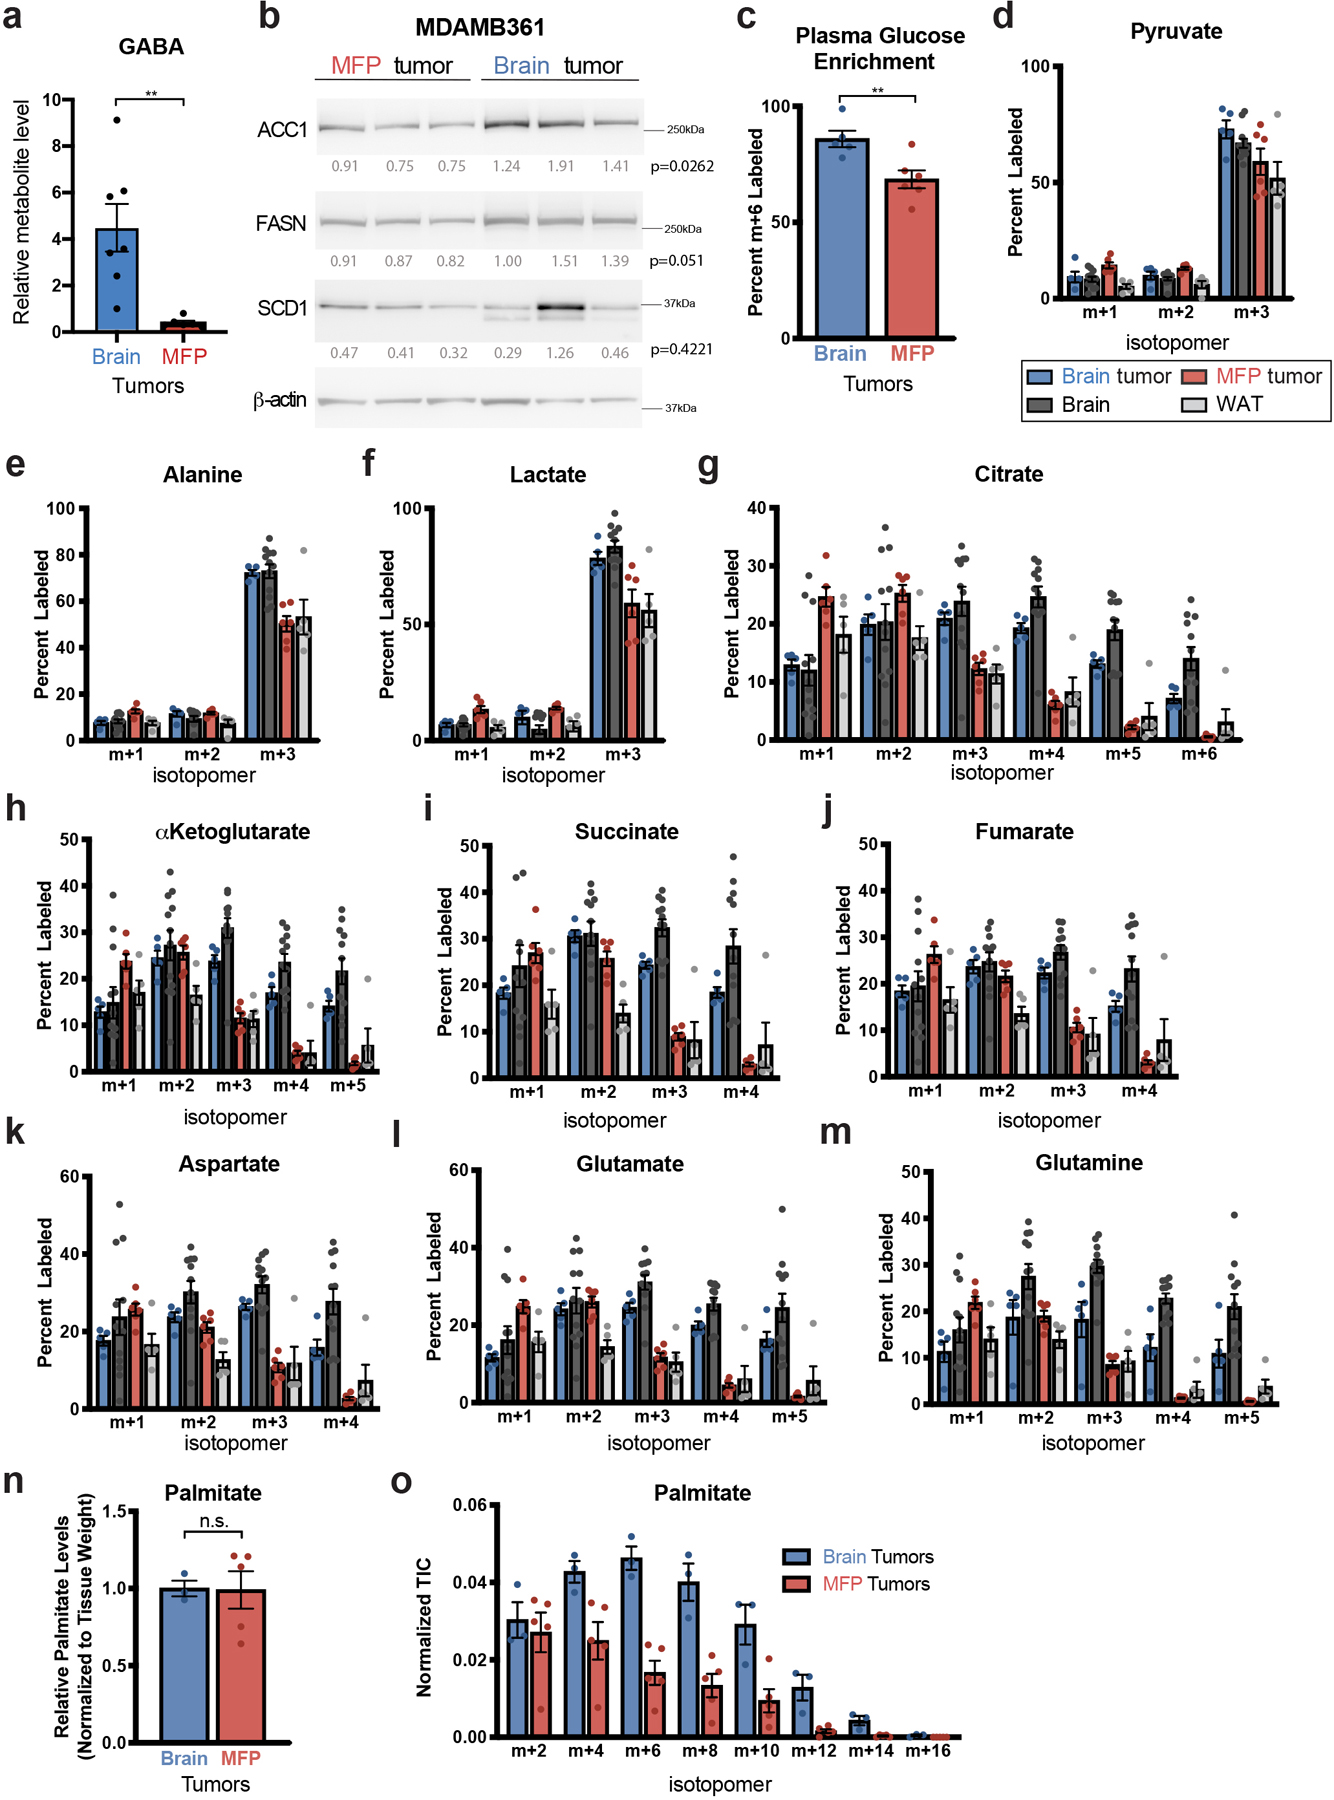
a) Relative gamma-aminobutyric acid (GABA) levels were measured by liquid chromatography–mass spectrometry (LCMS) in BT474 tumors isolated from the brain or mammary fat pad (MFP) of Nude mice. Data are from the dataset presented in Figure 1a and Extended Data Table 1. ** p = 0.0038 by two-tailed t-test (Brain tumors, n=7; MFP tumors n=6; tumors from independent mice).
b) Western blot analysis of acetyl-CoA carboxylase (ACC1), fatty acid synthase (FASN), and stearoyl-CoA desaturase-1 (SCD1) expression in MDAMB361 brain and MFP tumor tissue. β-actin expression was assessed as a loading control, and relative densitometry values (normalized to β-actin expression) were used for quantitation with values presented beneath each blot. Differences in protein expression between brain and MFP tumors was compared using a two-tailed t-test.
c) The percent of fully labeled glucose (m+6) in blood plasma following a 12 hour 30 mg/kg/min 13C-glucose infusion into Nude female mice bearing BT474 lesions in the brain or in the MFP as assessed by gas chromatography–mass spectrometry (GCMS). ** p = 0.0094 by two-tailed t-test. (Plasma from mice bearing BT474 brain tumors, n=5; Plasma from mice bearing BT474 MFP tumors, n=6).
d-m) The distribution of 13C-labeling in the indicated metabolites as measured by GCMS from BT474 tumors in the brain and MFP, and from noncancerous brain and MFP adipose tissue (WAT) after a 12 hour 30 mg/kg/min 13C-glucose infusion into Nude female mice. The data for each isotopologue presented was normalized to 13C-glucose labeling in plasma. (Brain tumors, n=5; MFP tumors, n=6; Cortex tissue, n=12; WAT, n=5).
n, o) BT474 brain and MFP tumors were collected following a 12 hour 30 mg/kg/min 13C-glucose infusion and saponified palmitate levels (n) and the distribution of 13C-label in even isotopologues of saponified palmitate (o) were assessed by GCMS. Palmitate levels were normalized to tissue weight and compared using a two-tailed t-test (n.s. denotes not significant). Each isotopologue was normalized to 13C-glucose labeling in plasma and to palmitate total ion counts. These data are from a separate experiment as that shown in Figure 1e, and were collected to enable normalization based on palmitate total ion counts. (Brain Tumors, n=3; MFP Tumors, n=5).
Data in panels a, c-o represent means ± SEM.
Extended Data Fig. 3. Higher lipid synthesis in breast cancer lesions when compared to surrounding brain tissue.
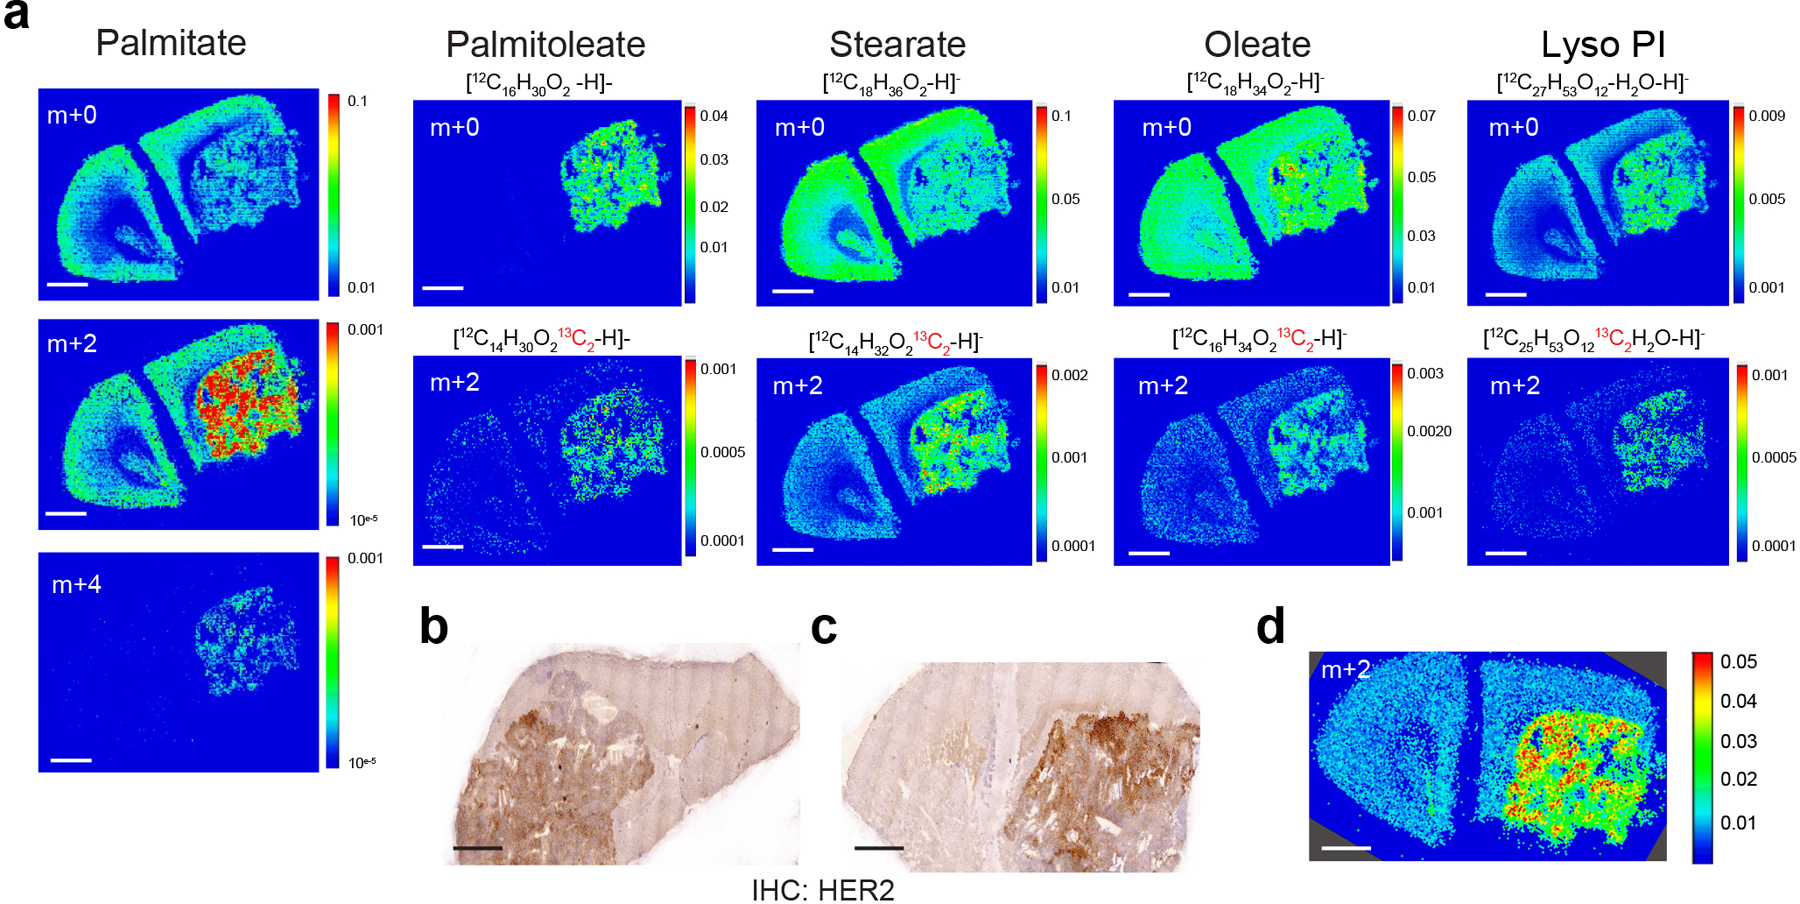
a) Negative mode matrix assisted laser desorption/ionization mass spectrometry imaging (MALDI-MSI) of brain tissue from a separate NSG mouse bearing a BT474 brain tumor than that shown in Figure 1 f,g that had been given 4 daily bolus intraperitoneal injections of 2 g/kg 13C-glucose. The spatial distribution of the indicated isotopologues of palmitate, stearate, oleate, and lyso-phosphatidylinositol (Lyso PI, 18:0) normalized to total ion counts are shown.
b, c) HER2 immunohistochemistry (IHC) staining of brain tissue sections collected from the tumors analyzed by MALDI-MSI in Figure 1g (b) and in Extended Data Figure 3a (c).
d) Negative mode MALDI-MSI of the m+2 palmitate isotopologue presented in (a) normalized to m+0 palmitate.
For all panels, scale bar = 1 mm.
Extended Data Fig. 4. FASN expression is high in breast cancer brain metastases.
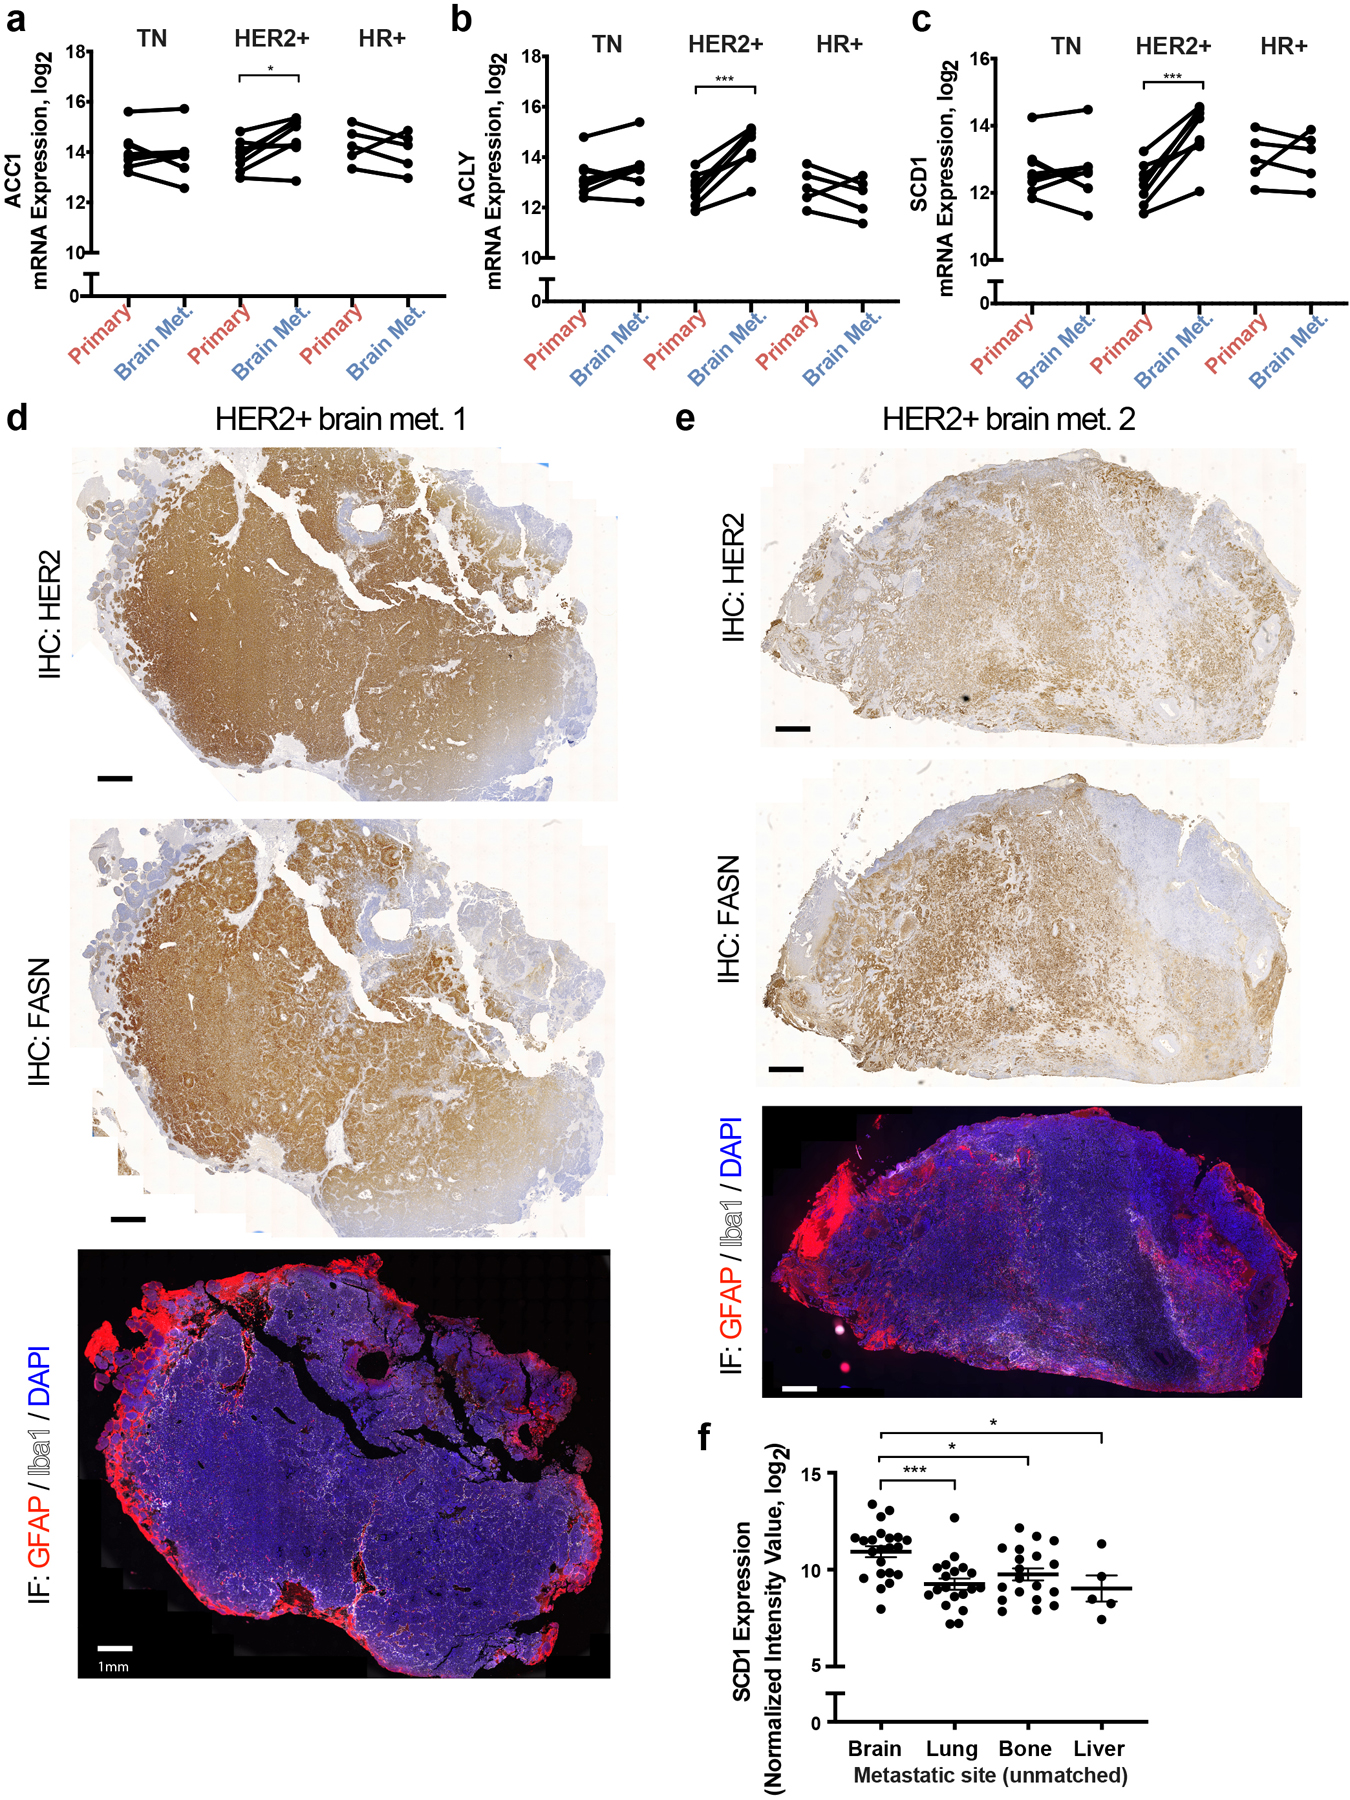
a-c) ACC1, ACLY and SCD1 mRNA expression levels from a patient-matched metastatic breast cancer RNAseq dataset30. Matched primary versus brain metastasis (Brain Met.) samples were analyzed separately for the major clinical molecular subtypes. * p = 0.0254 (a), *** = 0.0003 (b), **** p = 0.0005 (c), by two-tailed paired sample t-test. (Triple negative (TN) tumors, n=8; Human epidermal growth factor receptor 2+ (HER2+) tumors, n=8; Hormone receptor + (HR+) tumors, n=5).
d-e) Immunohistochemistry (IHC) and immunofluorescence (IF) assessment of brain metastasis tissue sections derived from 2 different patients with HER2+ breast cancer. IHC was performed to assess HER2 and FASN expression, and IF together with DAPI staining was used to assess glial fibrillary acidic protein (GFAP) and ionized calcium binding adaptor molecule 1 (Iba1) expression on consecutive tissue sections. (scale bar = 1mm).
f) Analysis of SCD1 mRNA expression from a metastatic breast cancer gene expression database comprised of unmatched human tumor samples32,33. Data presented represent mean expression ± SEM. * p = 0.0212 (Brain vs Bone), * p = 0.0172 (Brain vs Liver), *** p = 0.0006 by one-way ANOVA followed by Dunnettś multiple comparisons test (Brain tumors, n=22; Lung tumors, n=20; Bone tumors, n=18; Liver tumors, n=5).
Extended Data Fig. 5. Impact of extracellular lipids on lipid synthesis enzyme expression and lipid abundance.
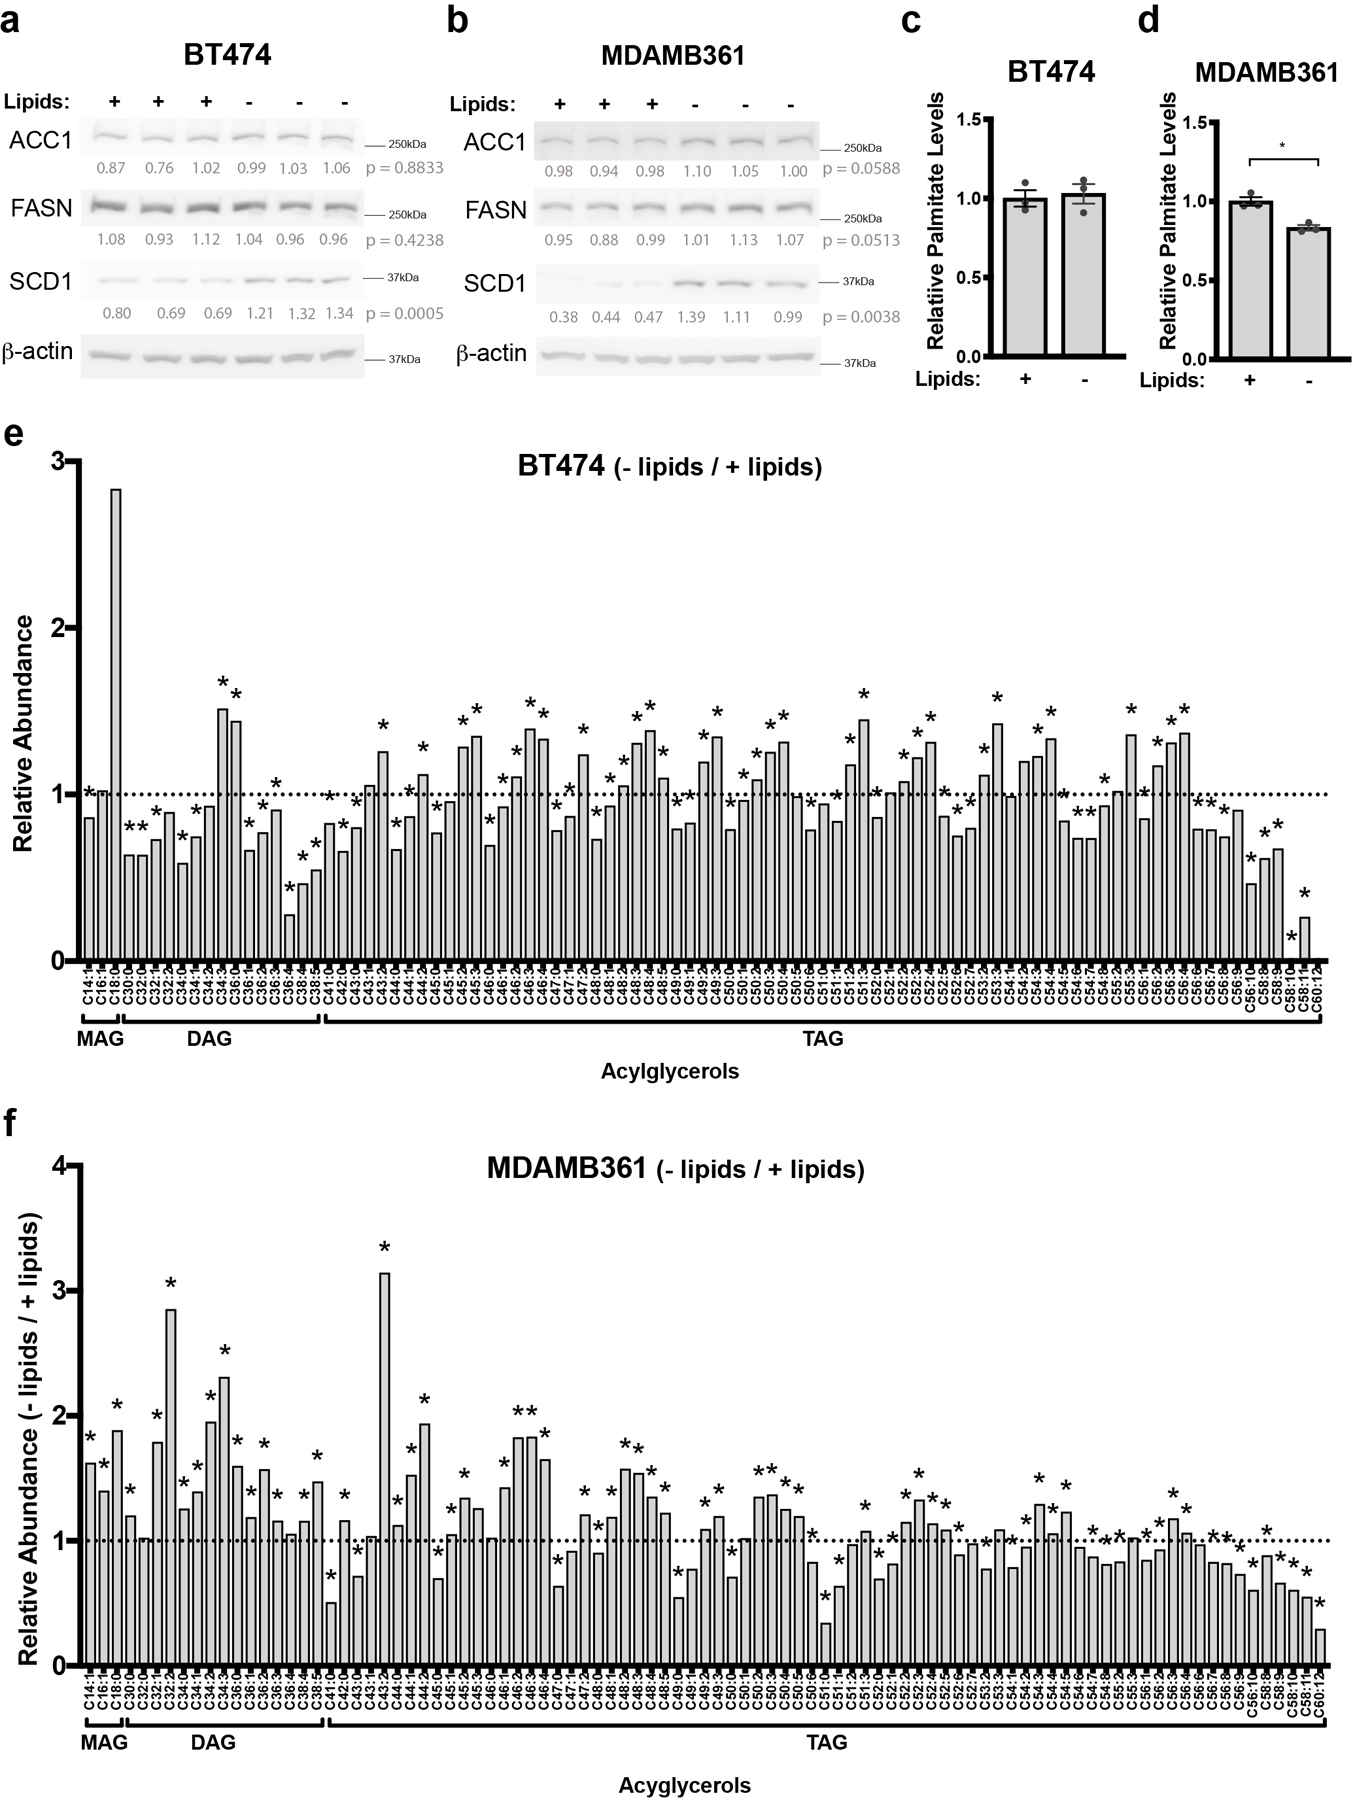
a, b) Western blot analysis of FASN, ACC1 and SCD1 in BT474 (a) and MDAMB361 cells (b) cultured in standard (+Lipids) or delipidated (-Lipids) media for 6 days. Lysates were generated from 3 independent samples. β-actin expression was assessed as a loading control. Relative densitometry values (normalized to β-actin expression) were used for quantitation and are presented below each blot. Differences in expression between conditions were compared by a two-tailed t-test.
c, d) Relative levels of saponified palmitate measured by GCMS in BT474 (c) and MDAMB361 (d) cells that were cultured in standard (+Lipids) or delipidated (-Lipids) media for 72 hours. The samples analyzed are the same as those presented in Figure 5c. Palmitate levels are normalized to the standard media condition * p = 0.0307 by two-tailed t-test. The data shown represent means ± SEM (n=3 cell culture biological replicates).
e, f) Ratio of complex lipid levels measured by LCMS of BT474 (e) and MDAMB361 (f) cells cultured in standard (+Lipids) or delipidated (-Lipids) media for 6 days. Lipid levels were normalized to protein content as quantified by sulforhodamine b and are presented as a ratio (−/+ Lipids) to show how levels differ based on media lipid availability. A black dotted line indicates a ratio of 1, representing no difference in lipid levels between − Lipids and + Lipids culture conditions. * q < 0.1 by Multiple t-test, False Discovery Rate corrected (n=3 cell culture biological replicates).
Extended Data Fig. 6. FASN expression is important for breast tumor growth in the brain.
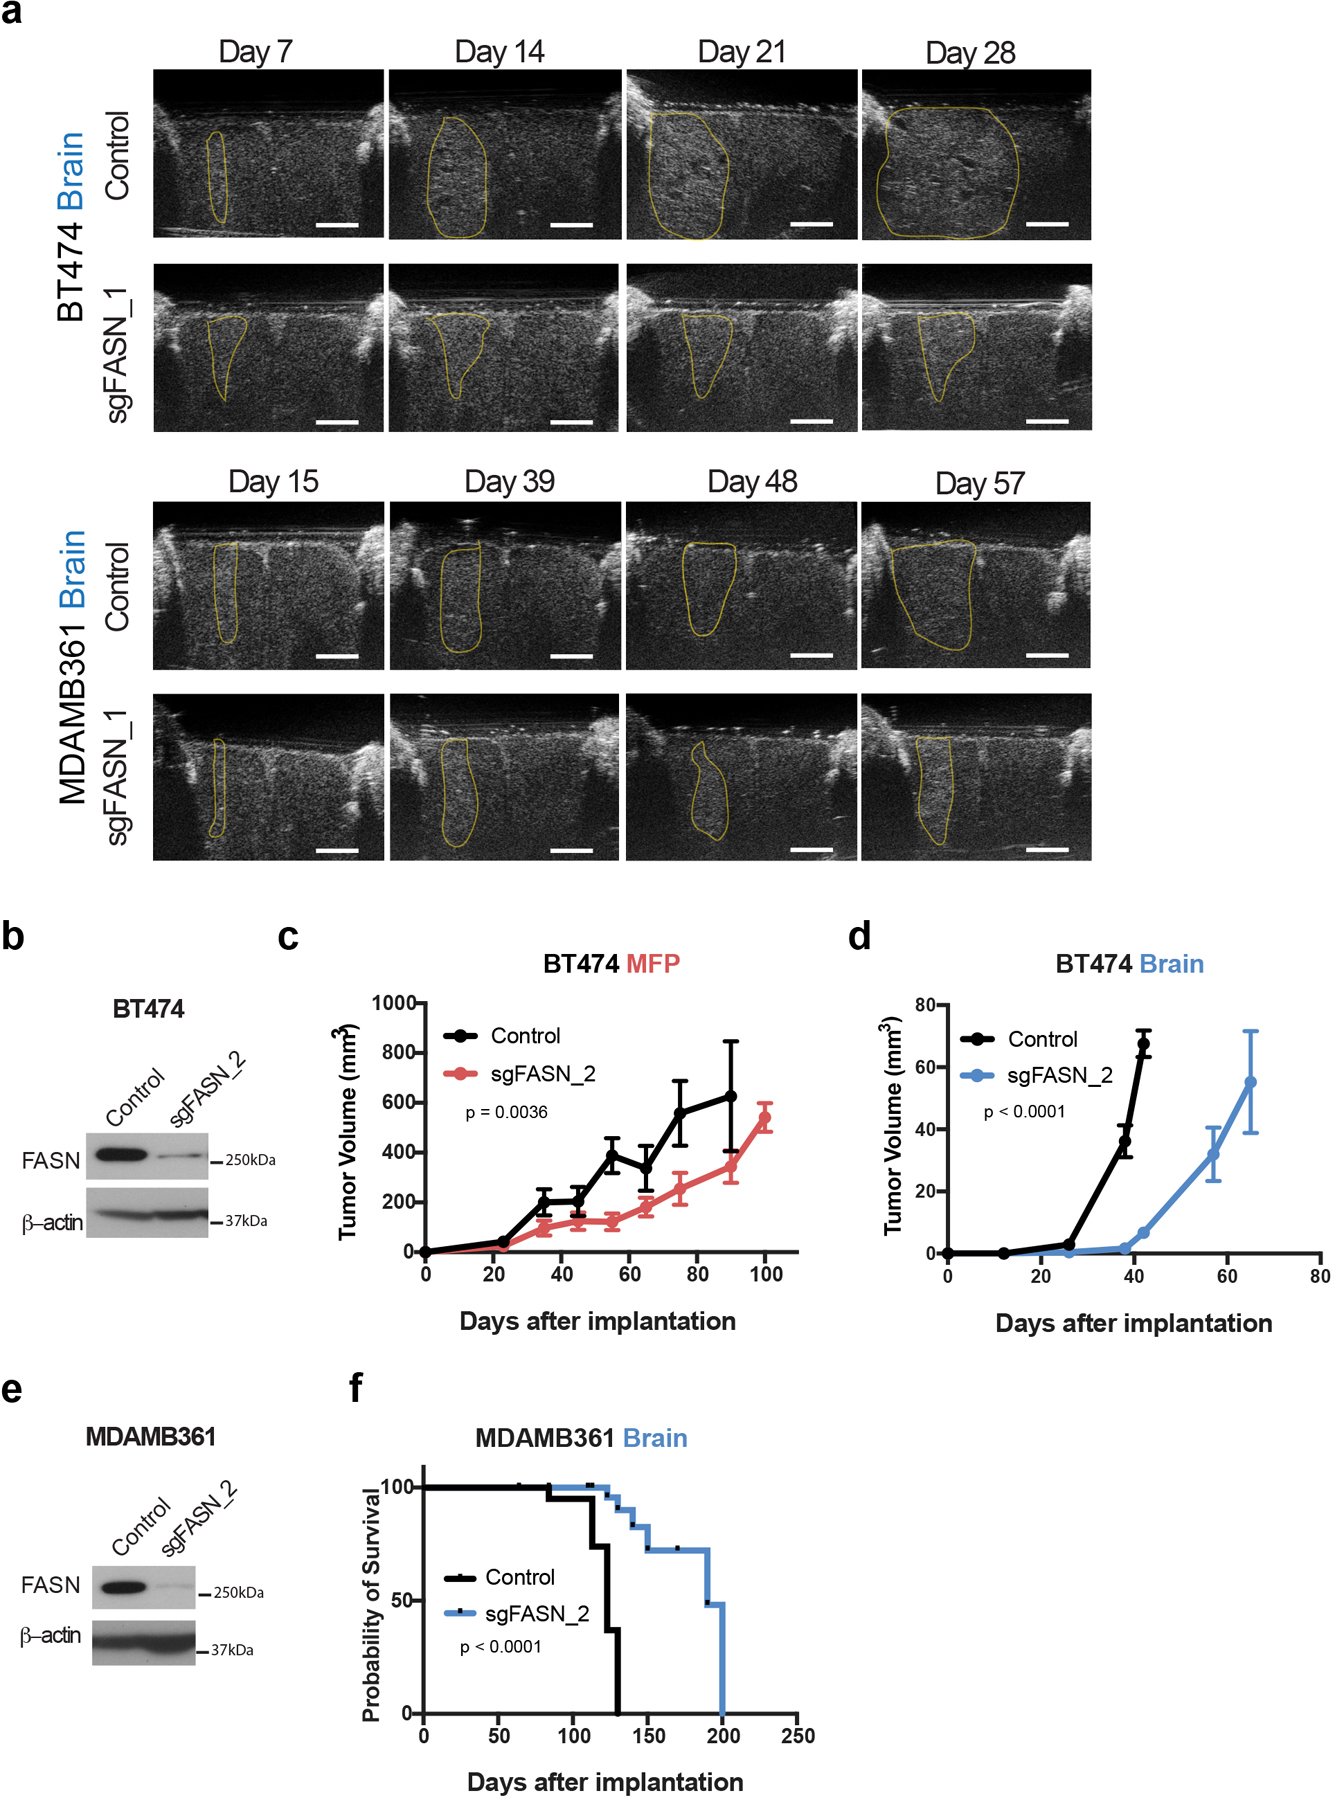
a) Representative ultrasound images used to assess size of BT474 and MDAMB361 brain tumors (delineated in yellow) in cranial-window bearing NSG mice. Summary data is presented in Figure 5f. (scale bar = 2 mm).
b) Western blot analysis of FASN and β-actin expression in control BT474 cells and in BT474 cell clone in which FASN expression is disrupted by CRISPR/Cas9 with sgFASN_2, a different sgRNA than was used to generate the BT474 sgFASN_1 clone presented in Figure 5a–g.
c, d) Growth over time of MFP (c) and brain (d) tumors generated in NSG mice from control or sgFASN_2 BT474 cells. Tumor volumes were measured by caliper or by ultrasound in cranial-window bearing mice, respectively. p values shown were determined using two-way ANOVA (Days × Group). (BT474 control MFP tumors, n=6; BT474 sgFASN_2 MFP tumors, n=4; BT474 control brain tumors, n=7; BT474 sgFASN_2, brain tumors, n=7).
e) Western blot analysis of FASN and β-actin expression in control MDAMB361 lysates or in a MDAMB361 clone in which FASN expression is disrupted CRISPR/Cas9 with sgFASN_2, a different sgRNA than was used to generate the MDAMB361 sgFASN clone presented in Figure 5a–g.
f) Kaplan-Meier survival curve for NSG mice bearing brain tumors produced from control or sgFASN_2 MDAMB361 cells. Median survival was 123 and 190 days for mice bearing MDAMB361 control and sgFASN_2 tumors, respectively. Hazard ratio = 7.842; 95% confidence interval = 1.314 to 46.81. (MDAMB361 control tumors, n=6; MDAMB361 sgFASN_2 tumors, n=6).
Extended Data Fig. 7. FASN expression is important for JIMT1 growth in the brain.
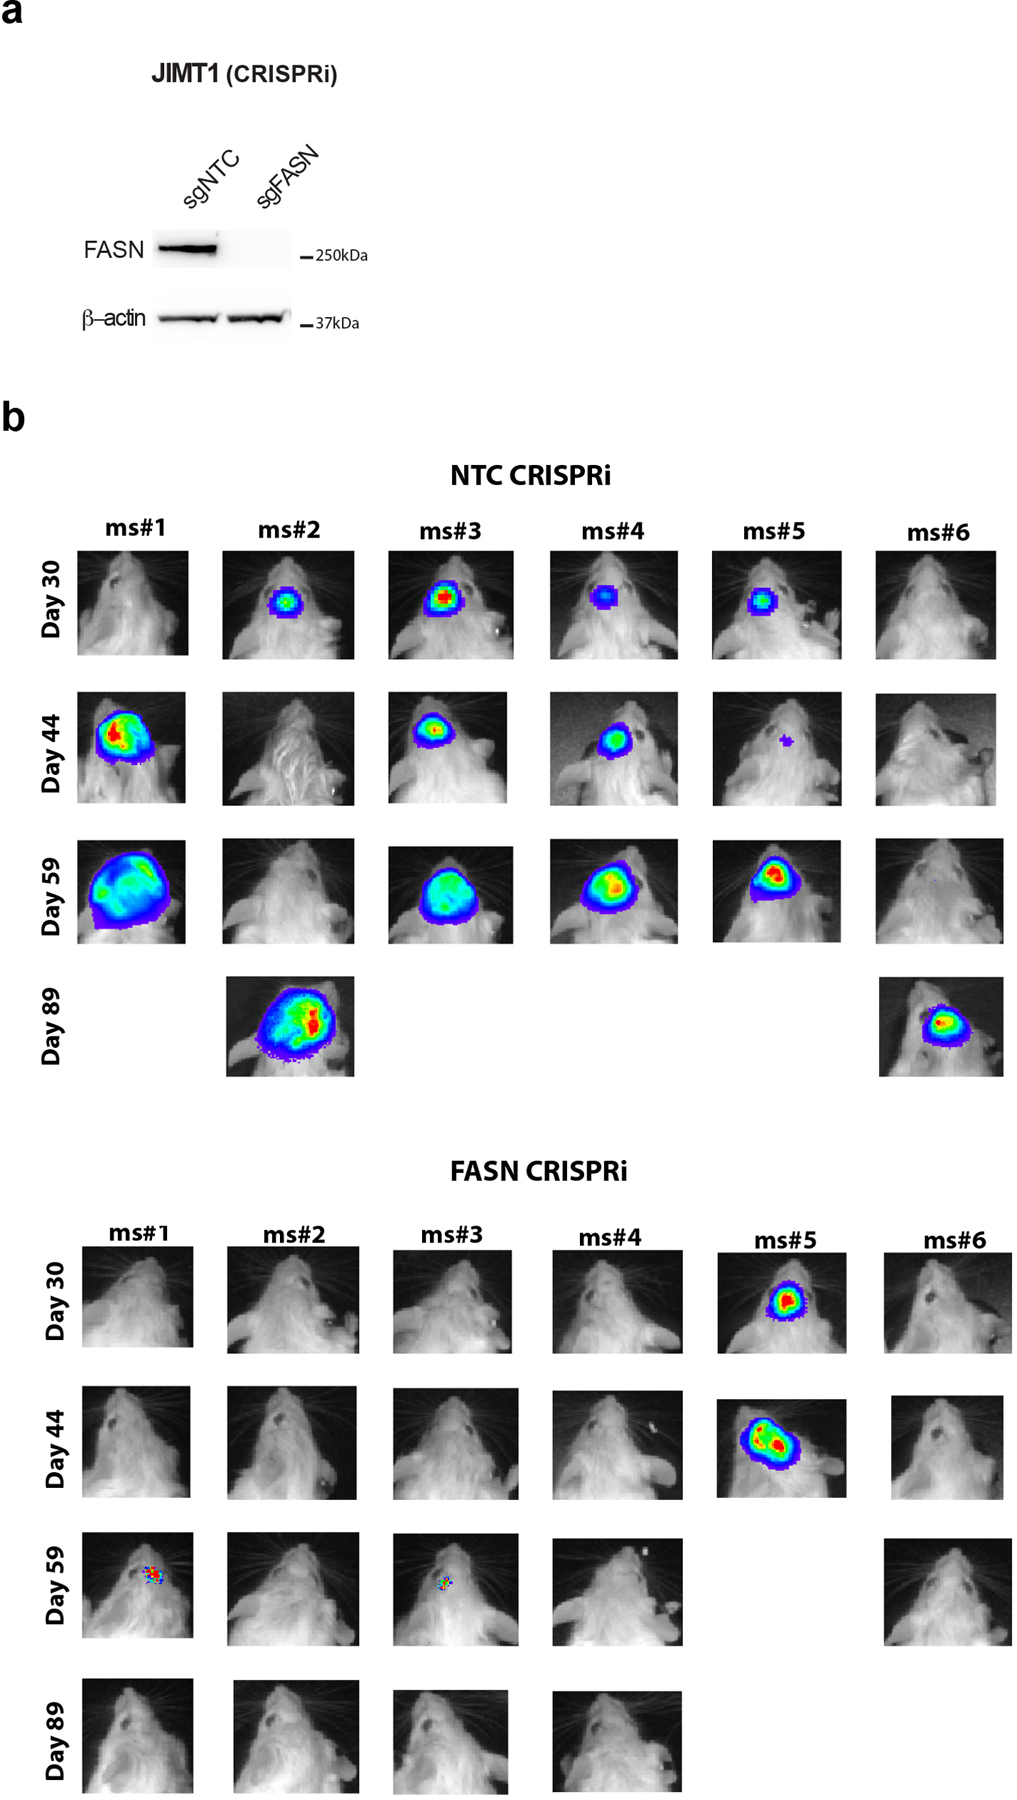
a) Western blot analysis of FASN and β-actin expression in JIMT1 cells in which CRIPSR interference (CRISPRi) was used to disrupt FASN. Cells were transduced with an sgRNA targeting FASN (sgFASN) or a non-targeting control (sgNTC).
b) Firefly luciferase-expressing sgNTC or sgFASN JIMT1 cells described in (a) were implanted into the brains of NSG mice, and tumor burden assessment by whole-body luminescence imaging is show for multiple animals on the indicated days after cell implantation in the brain (n=6 mice).
Extended Data Fig. 8. FASN knockdown alters cell lipid composition.
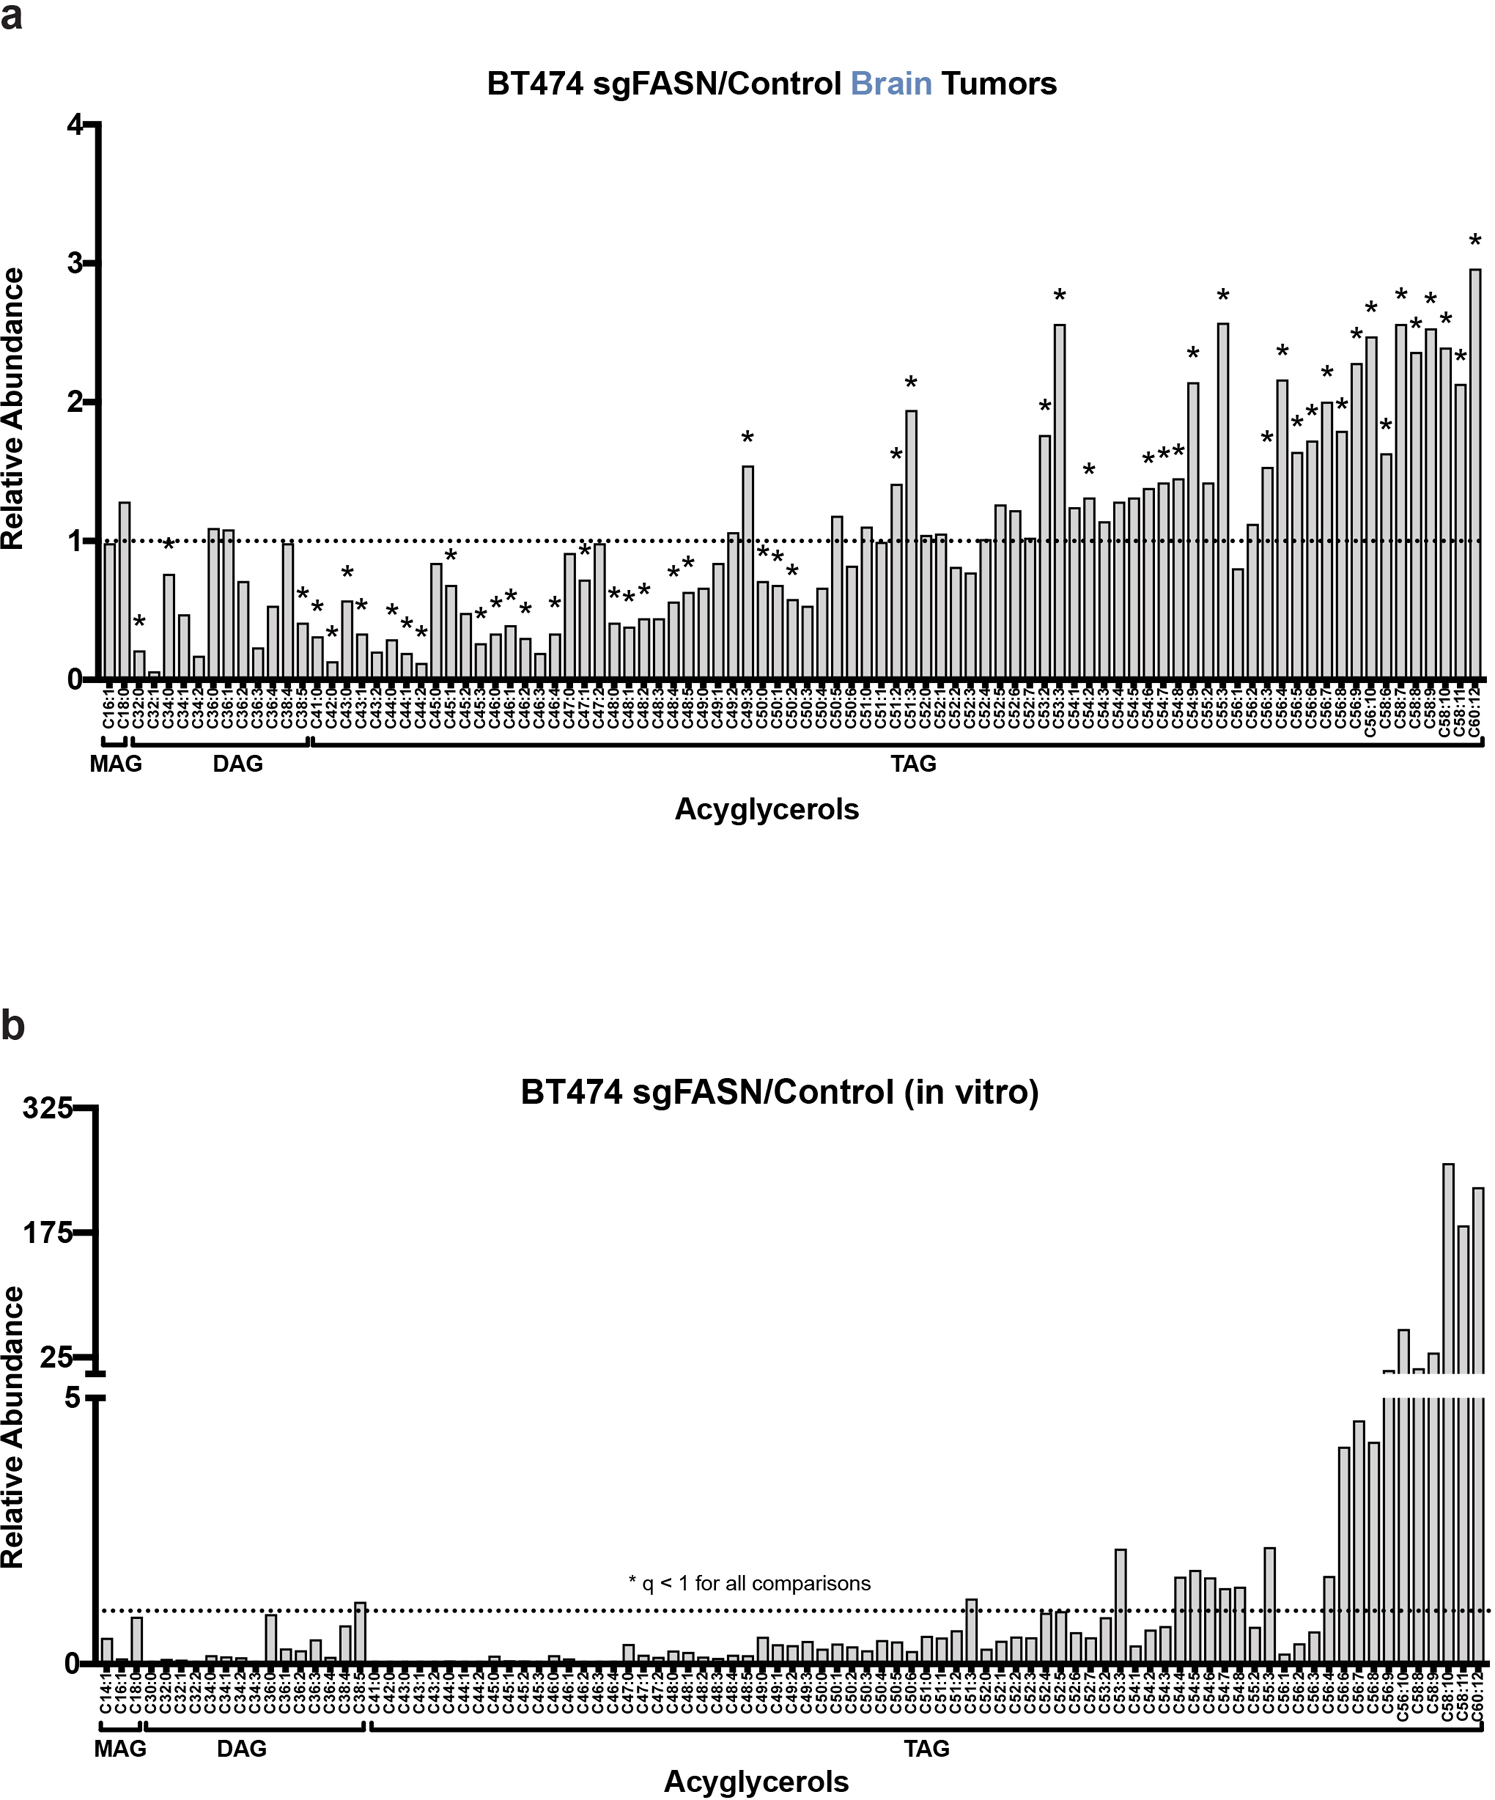
a) The indicated acylglycerol levels measured by LCMS from control and FASN-disrupted (sgFASN_1) BT474 tumors growing in the brain of NSG mice are presented as a ratio to show how levels differ based on FASN expression. A black dotted line indicates a ratio of 1, representing no difference in lipid levels between sgFASN_1 and control BT474 tumor tissue. * q < 0.1 by Multiple t-test, False Discovery Rate corrected (n=4 brain tumors).
b) Complex lipid levels measured by LCMS from control and FASN-disrupted (sgFASN_1) BT474 cells in culture (+Lipids) are presented as a ratio to show how levels differ based on FASN expression. A black dotted line indicates a ratio of 1, representing no difference in lipid levels between sgFASN_1 and control cells. Lipid levels were normalized to protein content as determined by sulforhodamine B. All comparisons are significant, q < 0.1 by Multiple t-test, False Discovery Rate corrected. (n=3 cell culture biological replicates).
Extended Data Fig. 9. FASN is not required for breast tumor growth in the liver.
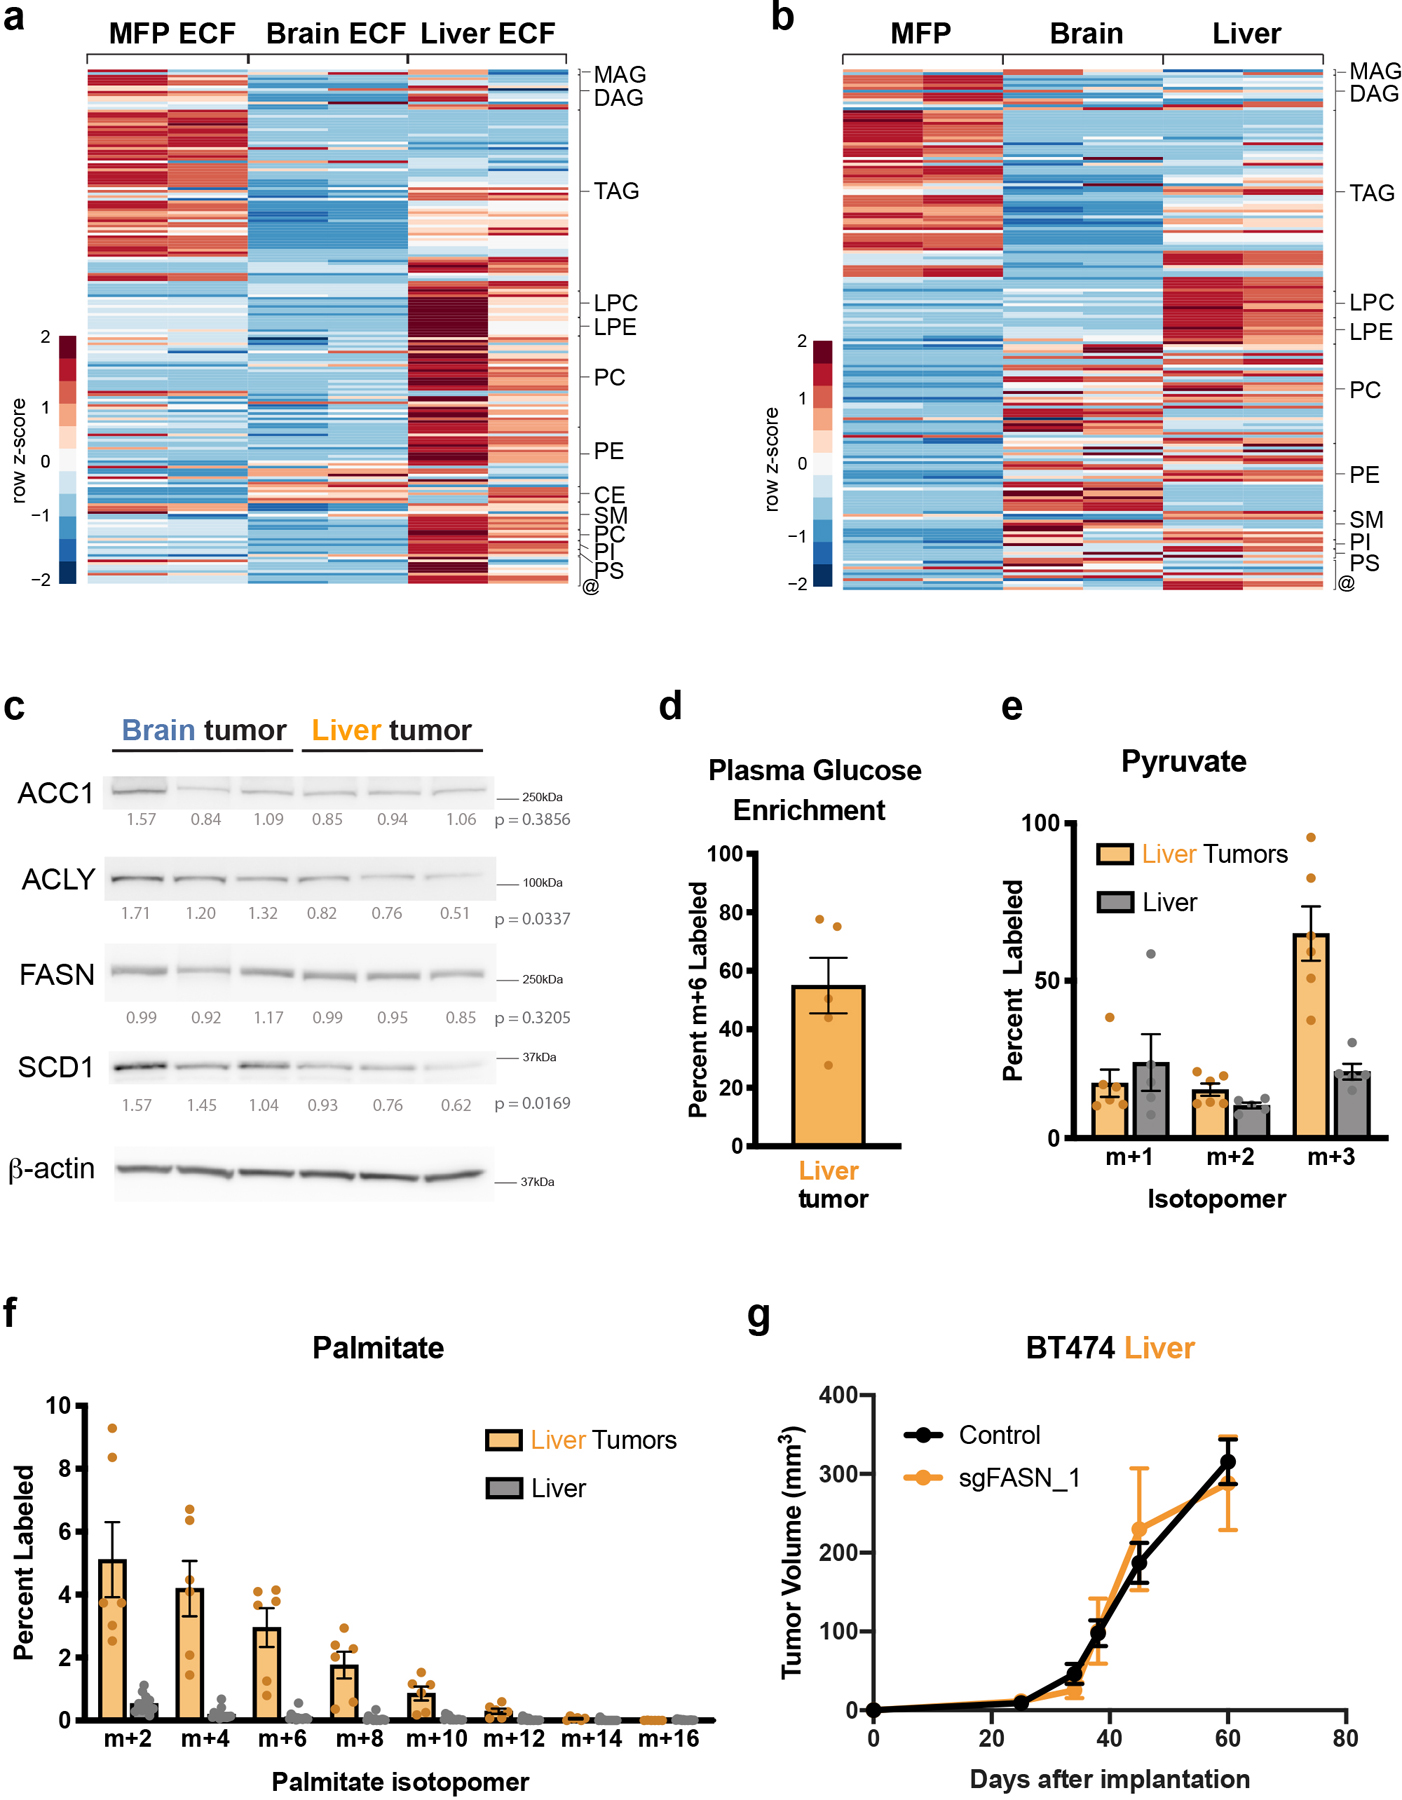
a) Heatmap showing complex lipid levels measured by LCMS in extracellular fluid (ECF) isolated from the MFP, brain, and liver of non-tumor bearing NSG mice. Data presented within each row were z-score normalized. The data for Brain and MFP ECF are the same as that shown in Figure 4d. (Brain ECF, n=2; MFP ECF, n=2 biological replicates. Each biological replicate represents ECF pooled from up to ~8–10 mice).
b) Heatmap showing complex lipid levels measured by LCMS of MFP, brain and liver tissue from non-tumor bearing NSG mice. Data presented within each row were z-score normalized. The data for brain and MFP are the same as that shown in Figure 4e. (Brain tissue, n=2; MFP tissue, n=2; Liver Tissue, n=2).
c) Western blot analysis of acetyl-CoA carboxylase (ACC1), ATP citrate lyase (ACLY), fatty acid synthase (FASN), and stearoyl-CoA desaturase-1 (SCD1) in BT474 brain and liver tumor tissue. β-actin expression was assessed as a loading control, and relative densitometry values (normalized to β-actin expression) were used for quantitation and are presented below each blot. Differences in protein expression between brain and liver BT474 lesions was compared by two-tailed t-test.
d) The percent of fully labeled (m+6) glucose in blood plasma following a 12-hour 30 mg/kg/min 13C-glucose infusion into female Nude mice bearing BT474 lesions in the liver as assessed GCMS (n=5 plasma from mice bearing BT474 liver tumors).
e) The distribution of pyruvate labeling in BT474 tumors growing in the liver and in non-cancerous liver tissue was measured by GCMS following a 12 hour 13C-glucose infusion into female Nude mice. Each isotopologue was normalized to 13C-glucose labeling in plasma (Liver tumor, n=6; Liver tissue, n=5).
f) The distribution of 13C label in even isotopologues of palmitate derived from saponified lipids in BT474 liver tumors and in non-cancerous liver tissue following a 12 hour 13C-glucose infusion into female Nude mice was measured by GCMS and normalized 13C-glucose labeling in plasma (Liver tumor, n=6; Liver tissue, n=5).
g) Tumor growth over time of liver tumors in NSG mice generated from control and FASN-disrupted (sgFASN_1) BT474 cells (presented in Figure 5a–g). Tumor volumes were measured by ultrasound. (BT474 control tumors, n=4; BT474 sgFASN_1 tumors, n=4).
MAG-monoglyceride; DAG-diglyceride; TAG-triglyceride; Cer-ceramide; LPC- lysophosphatidyl-choline; LPE-lysophosphotidyethanolamine; PC-phosphatidylcholine; PE-phosphatidylethanolamine; PI-phosphatidylinositol; PS-phosphatidylserine; SM-sphingomyelin; CE-cholesteryl ester; @-sphingosine, palmitoylethanolamide, 7−Dehydrodesmosterol, cholesterol, coenzyme Q9, coenzyme Q10. Data presented in panels d, e, f and g are means ± SEM.
Extended Data Fig. 10. Lipid availability determines response to pharmacological FASN inhibition.
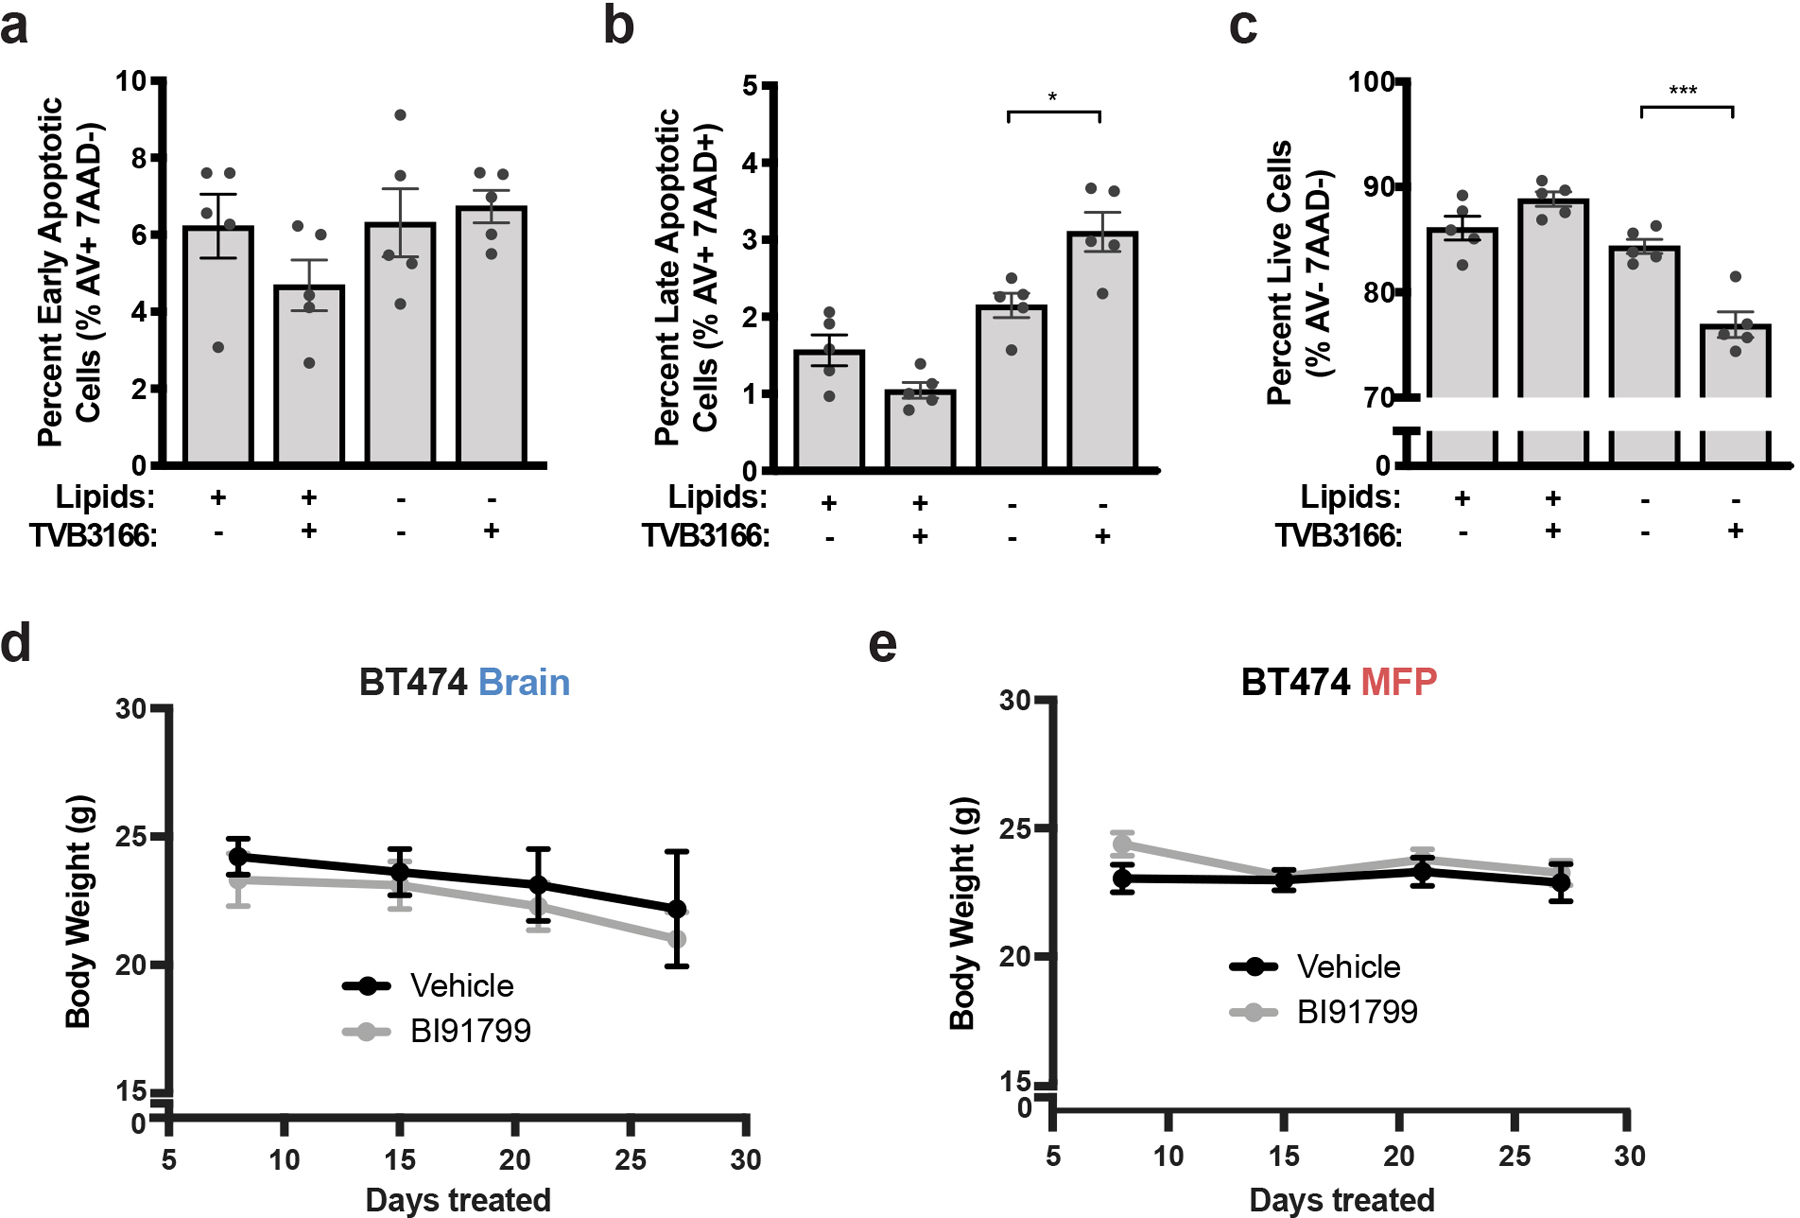
a-c) BT474 brain tumor-derived organotypic slice cultures were treated for 6 days with vehicle or 500 nM TVB3166 in standard (+Lipids) or delipidated (-Lipids) media. The percent of apoptotic and viable HER2 positive BT474 cells was determined by measuring Annexin V (AV) and 7-amino actinomycin D (7AAD) uptake by flow cytometry. The flow cytometry gating strategy is presented in Supplementary Figure 2. * p = 0.0111, *** p = 0.0003 by one-way ANOVA followed by Tukeýs test (n=5 BT474 brain tumor slices).
d,e) Mouse weights for the cohort presented in Figure 6f,g that was treated daily with BI99179 (15mg/kg) or vehicle control by oral gavage (n=5 mice).
Data presented in all panels are means ± SEM.
Supplementary Material
ACKNOWLEDGEMENTS
We thank the members of the Vander Heiden and Jain Laboratory for helpful discussions. We specifically thank Pragya Kumar, Ashwin Srinivasan Kumar, Jan Willem van Wijnbergen., Daniel Staiculescu, and Jeffrey A. Engelman for their input, as well as the MGH and MIT mouse facility and veterinary staff for technical support. We thank Dr. Hang Lee (MGH Biostatistics) for his helpful input on statistical analysis. We thank Boehringer Ingelheim for providing the BI99179 compound via their opnMe program (https://opnme.com/molecules/fas-bi99179). This work was supported by a Koch Institute/DFHCC Bridge project grant to M.G.V.H. and R.K.J. G.F. received a fellowship from Susan G. Komen for the Cure. A.A. received support as an HHMI Medical Research Fellow. A.L., K.L.A. and S.M.D. were supported by the National Science Foundation and T32GM007287. A.L. was also supported by the Ludwig Center for Molecular Oncology Fund. R.F. was supported by the Novo Nordisk Foundation (NNF10CC1016517) and the Knut and Alice Wallenberg Foundation. L.C.C. acknowledges support from the NIH (R35CA197588). V.A.D. acknowledges support from shared instrumentation grants (S10OD018072 and S10OD023524). R.K.J. acknowledges support from the NIH (R35CA197742, R01CA208205, U01CA224173), National Foundation for Cancer Research; the Ludwig Center at Harvard; the Jane’s Trust Foundation; the Advanced Medical Research Foundation and by the U.S Department of Defense Breast Cancer Research Program Innovator Award W81XWH-10–1-0016. M.G.V.H. acknowledges support from a Faculty Scholar grant from the Howard Hughes Medical Institute, Stand Up to Cancer, the MIT Center for Precision Cancer Medicine, the Ludwig Center at MIT, the Emerald Foundation, and the NIH (R35CA242379, R01CA201276, R01CA168653, P30CA14051).
Footnotes
COMPETING INTERESTS
A.L. is a current employee of a Flagship Pioneering biotechnology start-up company. I.C. is a current employee of Stimit Corporation. D.G.D. received consultant fees from Bayer, Simcere and BMS and research grants from Bayer, Exelixis and BMS. L.C.C. is a founder and member of the board of directors of Agios Pharmaceuticals and is a founder and receives research support from Petra Pharmaceuticals. R.K.J received honorarium from Amgen; consultant fees from Chugai, Merck, Ophthotech, Pfizer, SPARC, SynDevRx; owns equity in Accurius, Enlight, Ophthotech, SynDevRx; and serves on the Boards of Trustees of Tekla Healthcare Investors, Tekla Life Sciences Investors, Tekla Healthcare Opportunities Fund, Tekla World Healthcare Fund. Neither any reagent nor any funding from these organizations was used in this study. M.G.V.H is a scientific advisory board member for Agios Pharmaceuticals, Aeglea Biotherapeutics, Auron Therapeutics, Faeth Therapeutics, and iTeos Therapeutics.
Data Availability Statement.
All data generated by this study are included in the manuscript, extended data, supplementary files or source data files. Previously published microarray and RNA-sequencing data that were re-analysed here are available in Gene Expression Omnibus (GEO) under accession codes GSE86849 and GSE14020, and RNA-sequencing data that were re-analysed here are available at https://github.com/npriedig/jnci_2018.
Metabolomics data have been deposited to the EMBL-EBI MetaboLights database (DOI: 10.1093/nar/gkz1019, PMID:31691833) with the identifier MTBLS2434. The complete dataset can be accessed here https://www.ebi.ac.uk/metabolights/MTBLS2434 73.
Further information on research design is available in the Nature Research Reporting Summary linked to this article.
REFERENCES
- 1.Mills MN et al. Management of brain metastases in breast cancer: a review of current practices and emerging treatments. Breast Cancer Res Treat 180, 279–300, 10.1007/s10549-020-05552-2 (2020). [DOI] [PubMed] [Google Scholar]
- 2.Boire A, Brastianos PK, Garzia L & Valiente M Brain metastasis. Nat Rev Cancer 20, 4–11, 10.1038/s41568-019-0220-y (2020). [DOI] [PubMed] [Google Scholar]
- 3.Kabraji S et al. Drug Resistance in HER2-Positive Breast Cancer Brain Metastases: Blame the Barrier or the Brain? Clin Cancer Res 24, 1795–1804, 10.1158/1078-0432.CCR-17-3351 (2018). [DOI] [PMC free article] [PubMed] [Google Scholar]
- 4.Arvanitis CD, Ferraro GB & Jain RK The blood-brain barrier and blood-tumour barrier in brain tumours and metastases. Nat Rev Cancer, 10.1038/s41568-019-0205-x (2019). [DOI] [PMC free article] [PubMed]
- 5.Achrol AS et al. Brain metastases. Nat Rev Dis Primers 5, 5, 10.1038/s41572-018-0055-y (2019). [DOI] [PubMed] [Google Scholar]
- 6.Kodack DP et al. The brain microenvironment mediates resistance in luminal breast cancer to PI3K inhibition through HER3 activation. Sci Transl Med 9, 10.1126/scitranslmed.aal4682 (2017). [DOI] [PMC free article] [PubMed] [Google Scholar]
- 7.Monsky WL et al. Role of host microenvironment in angiogenesis and microvascular functions in human breast cancer xenografts: mammary fat pad versus cranial tumors. Clin Cancer Res 8, 1008–1013 (2002). [PubMed] [Google Scholar]
- 8.Lyle LT et al. Alterations in Pericyte Subpopulations Are Associated with Elevated Blood-Tumor Barrier Permeability in Experimental Brain Metastasis of Breast Cancer. Clin Cancer Res 22, 5287–5299, 10.1158/1078-0432.CCR-15-1836 (2016). [DOI] [PMC free article] [PubMed] [Google Scholar]
- 9.Gril B et al. Reactive astrocytic S1P3 signaling modulates the blood-tumor barrier in brain metastases. Nat Commun 9, 2705, 10.1038/s41467-018-05030-w (2018). [DOI] [PMC free article] [PubMed] [Google Scholar]
- 10.Zhang L et al. Microenvironment-induced PTEN loss by exosomal microRNA primes brain metastasis outgrowth. Nature 527, 100–104, 10.1038/nature15376 (2015). [DOI] [PMC free article] [PubMed] [Google Scholar]
- 11.Valiente M et al. Serpins promote cancer cell survival and vascular co-option in brain metastasis. Cell 156, 1002–1016, 10.1016/j.cell.2014.01.040 (2014). [DOI] [PMC free article] [PubMed] [Google Scholar]
- 12.Chen Q et al. Carcinoma-astrocyte gap junctions promote brain metastasis by cGAMP transfer. Nature 533, 493–498, 10.1038/nature18268 (2016). [DOI] [PMC free article] [PubMed] [Google Scholar]
- 13.Priego N et al. STAT3 labels a subpopulation of reactive astrocytes required for brain metastasis. Nat Med 24, 1024–1035, 10.1038/s41591-018-0044-4 (2018). [DOI] [PubMed] [Google Scholar]
- 14.Haddad-Tovolli R, Dragano NRV, Ramalho AFS & Velloso LA Development and Function of the Blood-Brain Barrier in the Context of Metabolic Control. Front Neurosci 11, 224, 10.3389/fnins.2017.00224 (2017). [DOI] [PMC free article] [PubMed] [Google Scholar]
- 15.McGale EH, Pye IF, Stonier C, Hutchinson EC & Aber GM Studies of the inter-relationship between cerebrospinal fluid and plasma amino acid concentrations in normal individuals. J. Neurochem 29, 291–297, 10.1111/j.1471-4159.1977.tb09621.x. (1977). [DOI] [PubMed] [Google Scholar]
- 16.Ngo B et al. Limited Environmental Serine and Glycine Confer Brain Metastasis Sensitivity to PHGDH Inhibition. Cancer Discov 10, 1352–1373, 10.1158/2159-8290.cd-19-1228 (2020). [DOI] [PMC free article] [PubMed] [Google Scholar]
- 17.Rainesalo S et al. Plasma and cerebrospinal fluid amino acids in epileptic patients. Neurochem Res 29, 319–324, 10.1023/b:nere.0000010461.34920.0c (2004). [DOI] [PubMed] [Google Scholar]
- 18.Dolgodilina E et al. Brain interstitial fluid glutamine homeostasis is controlled by blood-brain barrier SLC7A5/LAT1 amino acid transporter. J Cereb Blood Flow Metab 36, 1929–1941, 10.1177/0271678X15609331 (2016). [DOI] [PMC free article] [PubMed] [Google Scholar]
- 19.Neman J et al. Human breast cancer metastases to the brain display GABAergic properties in the neural niche. Proc Natl Acad Sci U S A 111, 984–989, 10.1073/pnas.1322098111 (2014). [DOI] [PMC free article] [PubMed] [Google Scholar]
- 20.Zeng Q et al. Synaptic proximity enables NMDAR signalling to promote brain metastasis. Nature 573, 526–531, 10.1038/s41586-019-1576-6 (2019). [DOI] [PMC free article] [PubMed] [Google Scholar]
- 21.Chi Y et al. Cancer cells deploy lipocalin-2 to collect limiting iron in leptomeningeal metastasis. Science 369, 276–282, 10.1126/science.aaz2193 (2020). [DOI] [PMC free article] [PubMed] [Google Scholar]
- 22.Askoxylakis V et al. Preclinical Efficacy of Ado-trastuzumab Emtansine in the Brain Microenvironment. J Natl Cancer Inst 108, 10.1093/jnci/djv313 (2016). [DOI] [PMC free article] [PubMed] [Google Scholar]
- 23.Baenke F, Peck B, Miess H & Schulze A Hooked on fat: the role of lipid synthesis in cancer metabolism and tumour development. Dis Model Mech 6, 1353–1363, 10.1242/dmm.011338 (2013). [DOI] [PMC free article] [PubMed] [Google Scholar]
- 24.Liu S, Dai Z, Cooper DE, Kirsch DG & Locasale JW Quantitative Analysis of the Physiological Contributions of Glucose to the TCA Cycle. Cell Metabolism 32, 619–628, 10.1016/j.cmet.2020.09.005 (2020). [DOI] [PMC free article] [PubMed] [Google Scholar]
- 25.Mergenthaler P, Lindauer U, Dienel GA & Meisel A Sugar for the brain: the role of glucose in physiological and pathological brain function. Trends Neurosci 36, 587–597, 10.1016/j.tins.2013.07.001 (2013). [DOI] [PMC free article] [PubMed] [Google Scholar]
- 26.Kamphorst JJ, Chung MK, Fan J & Rabinowitz JD Quantitative analysis of acetyl-CoA production in hypoxic cancer cells reveals substantial contribution from acetate. Cancer Metab 2, 23, 10.1186/2049-3002-2-23 (2014). [DOI] [PMC free article] [PubMed] [Google Scholar]
- 27.Buescher JM et al. A roadmap for interpreting (13)C metabolite labeling patterns from cells. Curr Opin Biotechnol 34, 189–201, 10.1016/j.copbio.2015.02.003 (2015). [DOI] [PMC free article] [PubMed] [Google Scholar]
- 28.Lane AN, Higashi RM & Fan TW Preclinical models for interrogating drug action in human cancers using Stable Isotope Resolved Metabolomics (SIRM). Metabolomics 12, 10.1007/s11306-016-1065-y (2016). [DOI] [PMC free article] [PubMed] [Google Scholar]
- 29.Sellers K et al. Pyruvate carboxylase is critical for non-small-cell lung cancer proliferation. J Clin Invest 125, 687–698, 10.1172/JCI72873 (2015). [DOI] [PMC free article] [PubMed] [Google Scholar]
- 30.Vareslija D et al. Transcriptome Characterization of Matched Primary Breast and Brain Metastatic Tumors to Detect Novel Actionable Targets. J Natl Cancer Inst 111, 388–398, 10.1093/jnci/djy110 (2019). [DOI] [PMC free article] [PubMed] [Google Scholar]
- 31.Zhang XH et al. Latent bone metastasis in breast cancer tied to Src-dependent survival signals. Cancer Cell 16, 67–78, 10.1016/j.ccr.2009.05.017 (2009). [DOI] [PMC free article] [PubMed] [Google Scholar]
- 32.Xu J et al. 14–3-3zeta turns TGF-beta’s function from tumor suppressor to metastasis promoter in breast cancer by contextual changes of Smad partners from p53 to Gli2. Cancer Cell 27, 177–192, 10.1016/j.ccell.2014.11.025 (2015). [DOI] [PMC free article] [PubMed] [Google Scholar]
- 33.Rohrig F & Schulze A The multifaceted roles of fatty acid synthesis in cancer. Nat Rev Cancer 16, 732–749, 10.1038/nrc.2016.89 (2016). [DOI] [PubMed] [Google Scholar]
- 34.Lewis CA et al. SREBP maintains lipid biosynthesis and viability of cancer cells under lipid- and oxygen-deprived conditions and defines a gene signature associated with poor survival in glioblastoma multiforme. Oncogene 34, 5128–5140, 10.1038/onc.2014.439 (2015). [DOI] [PubMed] [Google Scholar]
- 35.Tang LK, Dependence P of ion intensity in electrospray mass spectrometry on the concentration of the analytes in the electrosprayed solution. Analytical Chemistry 65, 3654–3668, 10.1021/ac00072a020 (1993). [DOI] [Google Scholar]
- 36.Irani D Cerebrospinal Fluid in Clinical Practice. Vol. 1 79 (Elsevier, 2009). [Google Scholar]
- 37.Sullivan MR et al. Quantification of microenvironmental metabolites in murine cancers reveals determinants of tumor nutrient availability. Elife 8, 10.7554/eLife.44235 (2019). [DOI] [PMC free article] [PubMed] [Google Scholar]
- 38.Liu JJ, Green P, John Mann J, Rapoport SI & Sublette ME Pathways of polyunsaturated fatty acid utilization: implications for brain function in neuropsychiatric health and disease. Brain Res 1597, 220–246, 10.1016/j.brainres.2014.11.059 (2015). [DOI] [PMC free article] [PubMed] [Google Scholar]
- 39.Benatti P, Peluso G, Nicolai R & Calvani M Polyunsaturated fatty acids: biochemical, nutritional and epigenetic properties. J Am Coll Nutr 23, 281–302, 10.1080/07315724.2004.10719371 (2004). [DOI] [PubMed] [Google Scholar]
- 40.Liu Z et al. Improving orthotopic mouse models of patient-derived breast cancer brain metastases by a modified intracarotid injection method. Sci Rep 9, 622, 10.1038/s41598-018-36874-3 (2019). [DOI] [PMC free article] [PubMed] [Google Scholar]
- 41.Kley JT, Mack J, Hamilton B, Scheuerer S & Redemann N Discovery of BI 99179, a potent and selective inhibitor of type I fatty acid synthase with central exposure. Bioorg Med Chem Lett 21, 5924–5927, 10.1016/j.bmcl.2011.07.083 (2011). [DOI] [PubMed] [Google Scholar]
- 42.Cantor JR et al. Physiologic Medium Rewires Cellular Metabolism and Reveals Uric Acid as an Endogenous Inhibitor of UMP Synthase. Cell 169, 258–272 e217, 10.1016/j.cell.2017.03.023 (2017). [DOI] [PMC free article] [PubMed] [Google Scholar]
- 43.Muir A et al. Environmental cystine drives glutamine anaplerosis and sensitizes cancer cells to glutaminase inhibition. Elife 6, 10.7554/eLife.27713 (2017). [DOI] [PMC free article] [PubMed] [Google Scholar]
- 44.Tardito S et al. Glutamine synthetase activity fuels nucleotide biosynthesis and supports growth of glutamine-restricted glioblastoma. Nat Cell Biol 17, 1556–1568, 10.1038/ncb3272 (2015). [DOI] [PMC free article] [PubMed] [Google Scholar]
- 45.Schug ZT et al. Acetyl-CoA synthetase 2 promotes acetate utilization and maintains cancer cell growth under metabolic stress. Cancer Cell 27, 57–71, 10.1016/j.ccell.2014.12.002 (2015). [DOI] [PMC free article] [PubMed] [Google Scholar]
- 46.Vande Voorde J et al. Improving the metabolic fidelity of cancer models with a physiological cell culture medium. Sci Adv 5, eaau7314, 10.1126/sciadv.aau7314 (2019). [DOI] [PMC free article] [PubMed] [Google Scholar]
- 47.Jin X et al. MetMap: a map of metastatic potential of human cancer cell lines. Nature 588, 331–336, 10.1038/s41586-020-2969-2 (2020). [DOI] [PMC free article] [PubMed] [Google Scholar]
- 48.Cordero A et al. FABP7 is a key metabolic regulator in HER2+ breast cancer brain metastasis. Oncogene 38, 6445–6460, 10.1038/s41388-019-0893-4 (2019). [DOI] [PMC free article] [PubMed] [Google Scholar]
- 49.Santana-Codina N et al. GRP94 Is Involved in the Lipid Phenotype of Brain Metastatic Cells. Int J Mol Sci 20, 10.3390/ijms20163883 (2019). [DOI] [PMC free article] [PubMed] [Google Scholar]
- 50.Zou Y et al. Polyunsaturated Fatty Acids from Astrocytes Activate PPARγ Signaling in Cancer Cells to Promote Brain Metastasis. Cancer Discov 9, 1720–1735, 10.1158/2159-8290.cd-19-0270 (2019). [DOI] [PMC free article] [PubMed] [Google Scholar]
- 51.Pinkham K et al. Stearoyl CoA Desaturase Is Essential for Regulation of Endoplasmic Reticulum Homeostasis and Tumor Growth in Glioblastoma Cancer Stem Cells. Stem Cell Reports 12, 712–727, 10.1016/j.stemcr.2019.02.012 (2019). [DOI] [PMC free article] [PubMed] [Google Scholar]
- 52.O’Brien JS & Sampson EL Lipid composition of the normal human brain: gray matter, white matter, and myelin. J Lipid Res 6, 537–544 (1965). [PubMed] [Google Scholar]
- 53.Sullivan MR et al. Increased Serine Synthesis Provides an Advantage for Tumors Arising in Tissues Where Serine Levels Are Limiting. Cell Metab 29, 1410–1421.e1414, 10.1016/j.cmet.2019.02.015 (2019). [DOI] [PMC free article] [PubMed] [Google Scholar]
- 54.Elia I et al. Breast cancer cells rely on environmental pyruvate to shape the metastatic niche. Nature 568, 117–121, 10.1038/s41586-019-0977-x (2019). [DOI] [PMC free article] [PubMed] [Google Scholar]
- 55.Villa GR et al. An LXR-Cholesterol Axis Creates a Metabolic Co-Dependency for Brain Cancers. Cancer Cell 30, 683–693, 10.1016/j.ccell.2016.09.008 (2016). [DOI] [PMC free article] [PubMed] [Google Scholar]
- 56.Luengo A, Gui DY & Vander Heiden MG Targeting Metabolism for Cancer Therapy. Cell Chem Biol 24, 1161–1180, 10.1016/j.chembiol.2017.08.028 (2017). [DOI] [PMC free article] [PubMed] [Google Scholar]
- 57.Jiang G et al. Comprehensive comparison of molecular portraits between cell lines and tumors in breast cancer. BMC genomics 17 Suppl 7, 525, 10.1186/s12864-016-2911-z (2016). [DOI] [PMC free article] [PubMed] [Google Scholar]
- 58.Hosios AM, Li Z, Lien EC and Vander Heiden MG Preparation of Lipid-Stripped Serum for the Study of Lipid Metabolism in Cell Culture. Bio-protocol 8, e2876 (2018). [DOI] [PMC free article] [PubMed] [Google Scholar]
- 59.Yuan F et al. Vascular permeability and microcirculation of gliomas and mammary carcinomas transplanted in rat and mouse cranial windows. Cancer Res 54, 4564–4568 (1994). [PubMed] [Google Scholar]
- 60.Kodack DP et al. Combined targeting of HER2 and VEGFR2 for effective treatment of HER2-amplified breast cancer brain metastases. Proc Natl Acad Sci U S A 109, E3119–3127, 10.1073/pnas.1216078109 (2012). [DOI] [PMC free article] [PubMed] [Google Scholar]
- 61.Davidson SM et al. Environment Impacts the Metabolic Dependencies of Ras-Driven Non-Small Cell Lung Cancer. Cell Metab 23, 517–528, 10.1016/j.cmet.2016.01.007 (2016). [DOI] [PMC free article] [PubMed] [Google Scholar]
- 62.Yuan M, Breitkopf SB, Yang X & Asara JM A positive/negative ion-switching, targeted mass spectrometry-based metabolomics platform for bodily fluids, cells, and fresh and fixed tissue. Nature protocols 7, 872–881, 10.1038/nprot.2012.024 (2012). [DOI] [PMC free article] [PubMed] [Google Scholar]
- 63.Vichai V & Kirtikara K Sulforhodamine B colorimetric assay for cytotoxicity screening. Nature protocols 1, 1112–1116, 10.1038/nprot.2006.179 (2006). [DOI] [PubMed] [Google Scholar]
- 64.Lewis CA et al. Tracing compartmentalized NADPH metabolism in the cytosol and mitochondria of mammalian cells. Mol Cell 55, 253–263, 10.1016/j.molcel.2014.05.008 (2014). [DOI] [PMC free article] [PubMed] [Google Scholar]
- 65.Heinrich P et al. Correcting for natural isotope abundance and tracer impurity in MS-, MS/MS- and high-resolution-multiple-tracer-data from stable isotope labeling experiments with IsoCorrectoR. Sci Rep 8, 17910, 10.1038/s41598-018-36293-4 (2018). [DOI] [PMC free article] [PubMed] [Google Scholar]
- 66.Blanc L, Lenaerts A, Dartois V & Prideaux B Visualization of Mycobacterial Biomarkers and Tuberculosis Drugs in Infected Tissue by MALDI-MS Imaging. Anal Chem 90, 6275–6282, 10.1021/acs.analchem.8b00985 (2018). [DOI] [PMC free article] [PubMed] [Google Scholar]
- 67.Gogolla N, Galimberti I, DePaola V & Caroni P Staining protocol for organotypic hippocampal slice cultures. Nature protocols 1, 2452–2456, 10.1038/nprot.2006.180 (2006). [DOI] [PubMed] [Google Scholar]
- 68.Lim NK et al. An Improved Method for Collection of Cerebrospinal Fluid from Anesthetized Mice. J Vis Exp, 10.3791/56774 (2018). [DOI] [PMC free article] [PubMed]
- 69.Haslene-Hox H et al. A new method for isolation of interstitial fluid from human solid tumors applied to proteomic analysis of ovarian carcinoma tissue. PLoS One 6, e19217, 10.1371/journal.pone.0019217 (2011). [DOI] [PMC free article] [PubMed] [Google Scholar]
- 70.Eil R et al. Ionic immune suppression within the tumour microenvironment limits T cell effector function. Nature 537, 539–543, 10.1038/nature19364 (2016). [DOI] [PMC free article] [PubMed] [Google Scholar]
- 71.Ho PC et al. Phosphoenolpyruvate Is a Metabolic Checkpoint of Anti-tumor T Cell Responses. Cell 162, 1217–1228, 10.1016/j.cell.2015.08.012 (2015). [DOI] [PMC free article] [PubMed] [Google Scholar]
- 72.Wiig H, Aukland K & Tenstad O Isolation of interstitial fluid from rat mammary tumors by a centrifugation method. Am J Physiol Heart Circ Physiol 284, H416–424, 10.1152/ajpheart.00327.2002 (2003). [DOI] [PubMed] [Google Scholar]
- 73.Haug K, Cochrane K, Nainala VC, Williams M, Chang J, Jayaseelan KV, O’Donovan C. MetaboLights: a resource evolving in response to the needs of its scientific community. Nucleic Acids Research, 48 (D1), D440–D444, 10.1093/nar/gkz1019 (2020). [DOI] [PMC free article] [PubMed] [Google Scholar]
Associated Data
This section collects any data citations, data availability statements, or supplementary materials included in this article.
Supplementary Materials
Data Availability Statement
All data generated by this study are included in the manuscript, extended data, supplementary files or source data files. Previously published microarray and RNA-sequencing data that were re-analysed here are available in Gene Expression Omnibus (GEO) under accession codes GSE86849 and GSE14020, and RNA-sequencing data that were re-analysed here are available at https://github.com/npriedig/jnci_2018.
Metabolomics data have been deposited to the EMBL-EBI MetaboLights database (DOI: 10.1093/nar/gkz1019, PMID:31691833) with the identifier MTBLS2434. The complete dataset can be accessed here https://www.ebi.ac.uk/metabolights/MTBLS2434 73.
Further information on research design is available in the Nature Research Reporting Summary linked to this article.


