Keywords: factor, flavonoid, hepcidin, in vitro, iron, Parkinson's disease, pathways, rotenone
Abstract
Multiple studies implicate iron accumulation in the substantia nigra in the degeneration of dopaminergic neurons in Parkinson’s disease. Indeed, slowing of iron accumulation in cells has been identified as the key point for delaying and treating Parkinson’s disease. Myricetin reportedly plays an important role in anti-oxidation, anti-apoptosis, anti-inflammation, and iron chelation. However, the mechanism underlying its neuroprotection remains unclear. In the present study, MES23.5 cells were treated with 1 × 10⁻⁶ M myricetin for 1 hour, followed by co-treatment with 400 nM rotenone for 24 hours to establish an in vitro cell model of Parkinson’s disease. Our results revealed that myricetin alleviated rotenone-induced decreases in cell viability, suppressed the production of intracellular reactive oxygen species, and restored mitochondrial transmembrane potential. In addition, myricetin significantly suppressed rotenone-induced hepcidin gene transcription and partly relieved rotenone-induced inhibition of ferroportin 1 mRNA and protein levels. Furthermore, myricetin inhibited rotenone-induced phosphorylation of STAT3 and SMAD1 in MES23.5 cells. These findings suggest that myricetin protected rotenone-treated MES23.5 cells by potently inhibiting hepcidin expression to prevent iron accumulation, and this effect was mediated by alteration of STAT3 and SMAD1 signaling pathways.
Chinese Library Classification No. R453; R741; R318
Introduction
Parkinson’s disease (PD) is a neurodegenerative disease that frequently occurs in older adults. Its main pathological features are degeneration and death of dopaminergic neurons in the substantia nigra (SN) (Bei et al., 2019; Deng et al., 2020; Ohira, 2020). Previous studies found that reactive oxygen species (ROS), oxidative stress, and iron accumulation in the SN are the main factors leading to the pathogenesis of PD (Rhodes and Ritz, 2008; Zhang et al., 2014, 2020). Recently, a growing body of evidence has indicated that iron is closely associated with the development of PD (Gozzelino and Arosio, 2016; Shi and Chen, 2017; Chen et al., 2019). Iron content in the SN is significantly increased in patients with critically severe PD, but not mild PD (Wang et al., 2017; Chen et al., 2019).
Currently, primary treatments for PD aim to prevent the degeneration of dopaminergic neurons. In particular, antioxidant and iron-chelating strategies have become a focus of attention (Powers et al., 2003; Moreau et al., 2018; Dani et al., 2020). Flavonoids are a promising candidate because they exert multiple biological properties (de Andrade Teles et al., 2018; Jung and Kim, 2018). A previous study showed that myricetin, an important flavonoid (Ma et al., 2007), inhibits 6-hydroxydopamine-induced neurotoxicity in rats and prevents cytotoxicity in 1-methyl-4-phenylpyridinium-treated MES23.5 cells (Zhang et al., 2011). In addition, myricetin can prevent the accumulation of amyloid-β-protein (Ono et al., 2003). Nevertheless, potential mechanisms underlying myricetin-mediated neuroprotection have not been investigated.
Recently, Mu et al. (2016) found that myricetin regulates iron homeostasis by suppressing hepcidin expression in human hepatocellular carcinoma cells. Hepcidin, known as the liver antibacterial peptide, was first identified in extracts of human serum and urine by two independent laboratories in 2000 and 2001 (Krause et al., 2000; Park et al., 2001). It plays a key role in maintaining the dynamic balance of iron in cells by regulating transcription and translation of ferroportin 1 (Fpn1). Based on this evidence, we hypothesized that myricetin may mediate a neuroprotective effect by suppressing iron toxicity via altered hepcidin expression. In the present study, we exposed MES23.5 cells to rotenone to establish a cellular model of PD, and investigated the protective effect of myricetin and its underlying mechanisms.
Materials and Methods
Cell culture and treatment
MES23.5 cells, provided by Dalian Medical University (Dalian, China), were grown in Dulbecco’s Modified Eagle’s Medium/Nutrient Mixture F-12 (Invitrogen, Carlsbad, CA, USA) containing Sato’s components supplemented with 5% fetal bovine serum, at 37°C in a humidified incubator.
Rotenone (2 mg; Sigma, St. Louis, MO, USA) was diluted in 0.5 mL of dimethyl sulfoxide (DMSO, Sigma). Rotenone (400 nM) was added to MES23.5 cells for 24 hours to create an in vitro model of PD (Yu et al., 2016). Next, myricetin (3.18 mg; Sigma) was diluted in 0.5 mL of DMSO. MES23.5 cells were then exposed to various concentrations (1 × 10–11, 1 × 10⁻¹⁰, 1 × 10⁻⁹, 1 × 10⁻⁸, 1 × 10⁻⁷, 1 × 10⁻⁶, 1 × 10⁻⁵, 1 × 10⁻⁴M) of myricetin for 24 hours. The optimum concentration of myricetin was chosen using a 3-(4,5-dimethyl-2-thiazolyl)-2,5-diphenyl-2H-tetrazolium bromide (MTT) assay.
To explore the protective effect of myricetin on rotenone, MES23.5 cells were divided into control, myricetin, rotenone, and myricetin + rotenone groups. In the myricetin group, cells were treated with 1 × 10⁻⁶ M myricetin for 24 hours. In the rotenone group, cells were exposed to 400 nM rotenone for 24 hours. In the rotenone + myricetin group, cells were pretreated exposed to 1 × 10⁻⁶ M myricetin for 1 hour, followed by co-treatment with 400 nM rotenone for 24 hours. The control group was administered DMSO for the indicated time (same as the rotenone group).
MTT assay
Cell viability was evaluated by MTT assay after rotenone and/or myricetin intervention. MTT (5 mg/mL; Sigma) in phosphate-buffered saline was added to each well of cell culture plates for 4 hours. Cell viability was measured at 490 nm using a microplate reader (RT-2100C; Rayto, Shenzhen, China).
Mitochondrial transmembrane potential measurement
After rotenone and/or myricetin intervention, cells were incubated in HEPES-buffered saline containing rhodamine 123 (5 μM; Sigma) for 30 minutes at 37°C. Fluorescence intensity of cells was determined by flow cytometry (BD Biosciences, Franklin Lakes, NJ, USA) under excitation and emission wavelengths of 488 and 525 nm, respectively. Next, we analyzed changes in mitochondrial transmembrane potential (Δψm). The results are presented as a histogram of fluorescence-1, setting the gated regions M1 and M2 as markers to observe changing levels of fluorescence intensity using Cellquest Software (BD Biosciences).
Intracellular ROS measurement
We measured levels of intracellular ROS using 2’,7’-dichlorodihydrofluorescein diacetate (H2 DCF-DA), as previously described (Zhang et al., 2009; Montalto et al., 2013). The non-fluorescent probe H2 DCF-DA can enter cells, whereby it is oxidized to the highly fluorescent compound DCF upon exposure to ROS; therefore, the observed fluorescence intensity is proportional to ROS content (Xu et al., 2020). After drug intervention, cells were incubated in HEPES-buffered saline (Sigma) containing H2 DCF-DA (5 μM; Beyotime Biotechnology Co., Shanghai, China) for 30 minutes at 37°C. Fluorescence intensity was determined by flow cytometry under excitation and emission wavelengths of 488 and 525 nm, respectively.
Real-time quantitative reverse transcription polymerase chain reaction
To evaluate the expression of iron-related genes, real-time quantitative reverse transcription polymerase chain reaction (RT-qPCR) was performed using a SYBR Green QPCR Master Mix Kit (MDBio Inc., Taipei, China). Total RNA was extracted with Reagent RNA Isolater (Vazyme Biotech Co, Ltd., Nanjing, China) and 0.5 μg of RNA was reverse transcribed using a reverse transcription kit (Vazyme Biotech). The obtained complementary DNA was used for RT-qPCR with the following primer sequences: hepcidin, forward 5’-GCC TGA GCA GCA CCA CCA T-3’ and reverse 5’-AGC ATT TAC AGC AGA AGA TGC AGA-3’; Fpn1, forward 5’-CAA GGT AGA GGA GTC AGA-3’ and reverse 5’-TTC AAG TTC ACG GAT GTT-3’; glyceraldehyde 3-phosphate dehydrogenase (GAPDH), forward: 5’-AAA TGG TGA AGG TCG GTG TGA AC-3’ and reverse 5’-CAA CAA TCT CCA CTT TGC CAC TG-3’. mRNA expression was analyzed using an Eppendorf system (Eppendorf, Hamburg, Germany) with SYBR Green PCR Master Mix (Qiagen, Hilden, Germany) and a two-step PCR program (40 cycles of 95°C for 30 seconds and 60°C for 30 seconds). The GAPDH gene was used as an internal control. The 2–ΔΔCt method was used to calculate relative expression levels of target genes.
Western blot analysis
Cells were lysed in radioimmunoprecipitation assay lysis buffer containing 1 mM phenylmethylsulfonyl fluoride. Proteins were separated by 10% sodium dodecyl sulfate polyacrylamide gel electrophoresis and then transferred to polyvinylidene difluoride membranes (Bio-Rad, Hercules, CA, USA). Membranes were blocked for 1 hour with 5% non-fat dry milk in Tris-HCl-buffered saline solution containing Tween-20, and then incubated with a primary rabbit anti-Fpn1 monoclonal antibody (1:800; Sigma) at 37°C overnight. To investigate signaling pathway activation, cells were pretreated with a phosphatase inhibitor (MDBio Inc.) for 30 minutes to inhibit degradation of phosphorylated proteins. Next, membranes were blocked for 2 hours in 5% bovine serum albumin, followed by incubation overnight at 4°C with rabbit-β-actin (1:10,000; Bioss, Beijing, China), mouse anti-STAT3 (1:1000; Cat# 9139; Cell Signaling Technology, Beverly, MA, USA), rabbit anti-phospho-STAT3 (pSTAT3; 1:1000; Cat# 8204; Cell Signaling Technology), rabbit anti-SMAD1 (1:1000; Cat# 6944; Cell Signaling Technology), or rabbit anti-pSMAD1/5/9 (an active form of SMAD1; 1:1000; Cat# 13820; Cell Signaling Technology). Secondary antibodies used for western blot analysis included anti-rabbit IgG-horseradish peroxidase and anti-mouse IgG-horseradish peroxidase (Santa Cruz Biotechnology, Dallas, TX, USA). Cross-reactivity was visualized using enhanced chemiluminescence western blotting detection reagents, analyzed by scanning densitometry using UVP VisionWorks™ LS Software (UVP, Cambridge, UK), and quantified with ImageJ Software (National Institutes of Health, Bethesda, MD, USA).
Statistical analysis
Data are expressed as mean ± standard deviation (SD), and were analyzed by one-way analysis of variance followed by post hoc Tukey’s test using GraphPad Prism 5 (GraphPad Software Inc., San Diego, CA, USA). Statistical significance was set at P < 0.05.
Results
Myricetin inhibits rotenone-induced cytotoxicity in MES23.5 cells
A high concentration (1 × 10⁻⁴M) of myricetin alone significantly reduced cell viability compared with the control group (P < 0.01; Figure 1A); thus, low doses (< 1 × 10⁻⁴M) were used in our experiment. Rotenone (400 nM) treatment for 24 hours significantly decreased cell viability to 65% of the control. However, pretreatment with 1 × 10⁻¹⁰M, 1 × 10⁻⁶M, or 1 × 10⁻⁵ M myricetin markedly increased cell viability compared with the rotenone group (Figure 1B). Among them, myricetin at a dose of 1 × 10⁻⁶ M produced the strongest protective effect (P < 0.001). Thus, this concentration was used in subsequent experiments.
Figure 1.
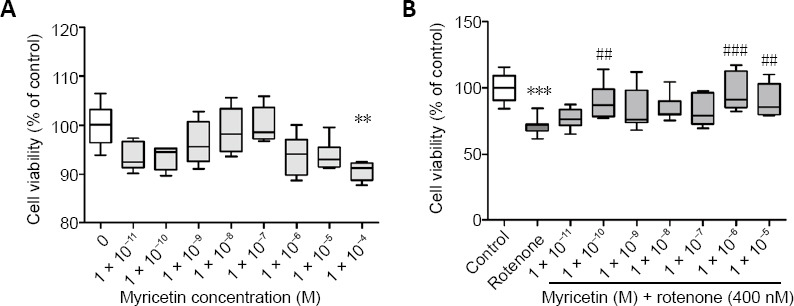
Effect of myricetin on the viability of rotenone-induced MES23.5 cells detected by 3-(4,5-dimethylthiazol-2-yl)-2,5-diphenyltetrazolium bromide assay.
(A) Exposure of 1 × 10⁻⁴ M myricetin alone for 24 hours resulted in decreased viability of MES23.5 cells, whereas 1 × 10–11 M to 1 × 10⁻⁵ M myricetin had no effect on cell viability compared with control. (B) Treatment with 400 nM rotenone for 24 hours decreased cell viability compared with the control. Pretreatment with different concentrations of myricetin enhanced cell viability compared with the rotenone group. Data are presented as mean ± SD (n = 6 in A, 12 in B). **P < 0.01, ***P < 0.001, vs. control group; ##P < 0.01, ###P < 0.001, vs. rotenone group (one-way analysis of variance followed by post hoc Tukey’s test).
Myricetin prevents rotenone-induced Δψm reduction in MES23.5 cells
Δψm, a marker of mitochondrial function, is involved in a variety of key events in oxidative stress and apoptosis (Deng et al., 2020). Treatment with 400 nM rotenone for 24 hours elicited an obvious decrease in Δψm (P < 0.001), which was significantly alleviated by myricetin (P < 0.05; Figure 2).
Figure 2.
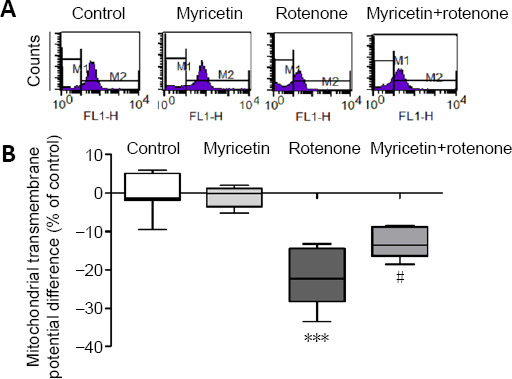
Effect of myricetin on the mitochondrial transmembrane potential of rotenone-induced MES23.5 cells detected by flow cytometry.
(A) Fluorometric assay of mitochondrial transmembrane potential. (B) Quantitative results of mitochondrial transmembrane potential. Rotenone (400 nM) treatment for 24 hours decreased mitochondrial transmembrane potentials compared with controls. Pretreatment with 1 × 10⁻⁶ M myricetin for 1 hour prevented the reduction of mitochondrial transmembrane potential reduction induced by rotenone. Data are presented as mean ± SD of eight independent experiments. ***P < 0.001, vs. control group; #P < 0.05, vs. rotenone group (one-way analysis of variance followed by post hoc Tukey’s test).
Myricetin reducs rotenone-induced ROS production in MES23.5 cells
Considering the involvement of Δψm in ROS production (Xu et al., 2020), we evaluated the effect of myricetin on rotenone-induced ROS generation in MES23.5 cells. As shown in Figure 3, rotenone treatment dramatically increased intracellular ROS production by 3-fold compared with the control (P < 0.001). However, myricetin pretreatment markedly inhibited ROS production in rotenone-treated MES23.5 cells (P < 0.05).
Figure 3.
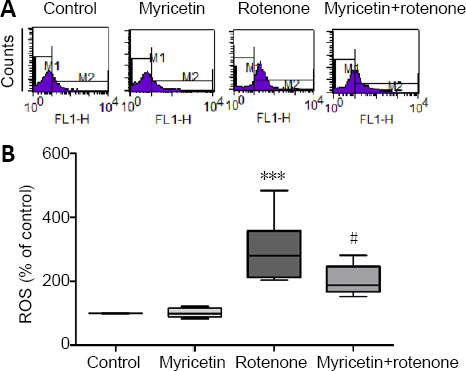
Effect of myricetin on ROS levels of rotenone-induced MES23.5 cells detected by flow cytometry.
(A) Representative images of fluorometric assay for ROS levels. (B) Quantitative results of ROS levels. Rotenone (400 nM) treatment for 24 hours increased ROS production compared with the control, but was alleviated by pretreatment with 1 × 10⁻⁶ M myricetin for 1 hour. Data are presented as mean ± SD of six independent experiments. ***P < 0.001, vs. control group; #P < 0.05, vs. rotenone group (one-way analysis of variance followed by post hoc Tukey’s test). ROS: Reactive oxygen species.
Myricetin inhibits rotenone-induced hepcidin upregulation in MES23.5 cells
We further investigated hepcidin mRNA expression in rotenone-treated MES23.5 cells. Hepcidin mRNA expression was upregulated 2.5-fold after rotenone treatment for 24 hours (P < 0.001). Myricetin significantly alleviated rotenone-induced hepcidin mRNA expression (P < 0.05; Figure 4).
Figure 4.
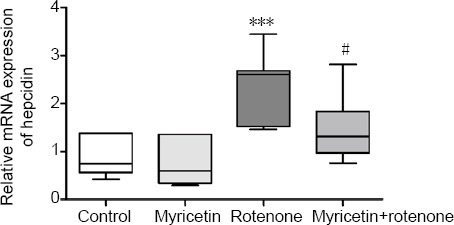
Effect of myricetin on hepcidin mRNA levels in rotenone-induced MES23.5 cells detected by real-time quantitative reverse transcription polymerase chain reaction.
Cells were pretreated with 1 × 10⁻⁶ M myricetin for 1 hour, followed by co-treatment with 400 nM rotenone for 24 hours. Compared with the control group, rotenone-treated cells displayed a significant increase in hepcidin mRNA expression. Myricetin significantly inhibited this effect. Hepcidin mRNA expression was normalized to that of GAPDH (optical density ratio). Results are presented as mean ± SD of seven independent experiments. ***P < 0.001, vs. control group; #P < 0.05, vs. rotenone group (one-way analysis of variance followed by post hoc Tukey’s test). GAPDH: Glyceraldehyde 3-phosphate dehydrogenase.
Myricetin prevents rotenone-induced Fpn1 downregulation in MES23.5 cells
Fpn1 is the only cellular iron efflux channel described thus far (Ganz, 2005). As a receptor for hepcidin, Fpn1 can be internalized and degraded, and upregulation of hepcidin may participate in regulation of Fpn1 expression (Nemeth et al., 2004). Thus, we next investigated the effects of myricetin on Fpn1 expression in rotenone-treated MES23.5 cells. As shown in Figure 5A, rotenone treatment for 24 hours markedly downregulated Fpn1 mRNA expression (P < 0.001), which was inhibited by 1 × 10⁻⁶ M myricetin pretreatment (P < 0.05). Consistent with the effect on mRNA expression, Fpn1 protein expression was significantly downregulated by rotenone treatment (P < 0.01), and partly reversed by myricetin (P < 0.05). Treatment with myricetin alone tended to increase Fpn1 protein, but with no statistical difference (P > 0.05, vs. control group; Figure 5B).
Figure 5.
Effect of myricetin on Fpn1 mRNA (A) and protein (B) expression in rotenone-induced MES23.5 cells.
Cells were pretreated with 1 × 10⁻⁶ M myricetin for 1 hour, followed by co-treatment with 400 nM rotenone for 24 hours. Rotenone treatment downregulated Fpn1 mRNA and protein expression compared with the control. Myricetin prevented induction of Fpn1 mRNA and protein levels by rotenone. Data represent mean ± SD (n = 4 in A, 10 in B). **P < 0.01, ***P < 0.001, vs. control group; #P < 0.05, vs. rotenone group (one-way analysis of variance followed by post hoc Tukey’s test). Fpn1: Ferroportin 1; GAPDH: glyceraldehyde 3-phosphate dehydrogenase. Relative mRNA expression of Fpn1 is normalized to that of GAPDH (optical density ratio). Relative protein expression of Fpn1 is expressed as the optical density ratio to β-actin.
Myricetin inhibits rotenone-induced activation of STAT3 and SMAD1 in MES23.5 cells
To test mechanisms of rotenone-induced hepcidin upregulation, STAT3 and SMAD1 activities were measured by western blot analysis. As shown in Figure 6, pSTAT3 and pSMAD1/5/9 protein expression was significantly increased after 400 nM rotenone treatment for 24 hours (P < 0.001, vs. control group), but was partly blocked by myricetin (P < 0.001, vs. rotenone group). 1 × 10⁻⁶ M myricetin alone had no effect on the activity of STAT3 or SMAD1 (P > 0.05, vs. control group).
Figure 6.
Myricetin inhibits rotenone-induced phosphorylation of STAT3 and SMAD1/5/9.
Cells were pretreated with 1 × 10⁻⁶ M myricetin for 1 hour, followed by co-treatment with 400 nM rotenone for 24 hours. (A) Original bands of phosphorylated and total STAT3 and SMAD1 in MES23.5 cells. β-Actin was used as a loading control. (B) Quantitative results of pSTAT3 expression, expressed as the optical density ratio to total STAT3. (C) Quantitative results of pSMAD1/5/9, expressed as the optical density ratio to total SMAD1. Data represent mean ± SD (n = 7 in B, 6 in C). **P < 0.01, ***P < 0.001, vs. control group; #P < 0.05, ###P < 0.001, vs. rotenone group (one-way analysis of variance followed by post hoc Tukey’s test). p: Phosphorylated; SMAD: drosophila mothers against decapentaplegic protein; STAT3: signal transducer and activator of transcription 3.
Discussion
In this study, we found that myricetin effectively protected MES23.5 cells against rotenone-induced cell death. The MES23.5 cell line is a dopaminergic neuroblastoma derived from somatic cell fusion of rat embryonic mesencephalon cells and the murine neuroblastoma-glioma cells (Zhang et al., 2011). This cell line has properties of dopaminergic neurons and is easier to culture than midbrain nerve cells. Therefore, these cells have been extensively used as a useful tool for studying neurodegenerative disease (Yu et al., 2004). Rotenone is commonly used to induce PD models because it faithfully replicates almost all PD hallmarks (Cannon et al., 2009). Studies have shown that many factors are involved in rotenone-induced dopamine neurotoxicity, including inhibition of mitochondrial complex I (Betarbet et al., 2000; Chinta et al., 2013), ROS production, and oxidative damage of proteins, lipids, and DNA. Mitochondria are not only the major site for ROS production, but also the main target for oxidative molecular damage. In addition, in vitro studies have shown that rotenone induces hydrogen peroxide production in cells, which causes changes in Δψm (Tada-Oikawa et al., 2003). Damage to mitochondrial membranes is considered a key event in pathogenic cascades of cell death (Hroudová et al., 2014). As an antioxidant, myricetin can effectively scavenge free radicals produced by both enzymatic and nonenzymatic systems (Zhang et al., 2011). Indeed, myricetin can inhibit lipid peroxidation in rat mitochondria (Ratty and Das, 1988), and affect scavenging of both superoxide anions (Robak and Gryglewski, 1988) and hydroxyl radicals (Chen et al., 2002). A recent study by Lagoa et al. (2011) demonstrated that flavonoids, which target mitochondrial complex I and cytochrome c, inhibit hydrogen peroxide production. Further study showed that these flavonoids, as well as myricetin, are able to provide two electrons to react with cytochrome c (Lagoa et al., 2017). In our study, myricetin pretreatment blocked the decrease in Δψm and increase in ROS induced by rotenone. These observations highlight the possibility that myricetin protects MES23.5 cells by anti-oxidative and mitochondrial-protective mechanisms.
Iron accumulation in the SN plays a crucial role in the etiology and pathogenesis of PD (Götz et al., 2004; Youdim et al., 2004; Berg and Hochstrasser, 2006). However, its underlying mechanism has not been fully elucidated. A previous study showed that rotenone significantly increased iron levels in the SN in mice (Zhao et al., 2017). In addition, decreasing iron levels by pretreatment with the iron chelator deferoxamine and nicotine reduced the loss of dopaminergic neurons induced by rotenone in the SN in rats (Mouhape et al., 2019). Furthermore, myricetin may regulate iron homeostasis by suppressing hepcidin expression (Mu et al., 2016). Overall, this evidence supports the possibility that myricetin may protect against rotenone-induced cell death by suppressing iron toxicity. Hepcidin, which is widely distributed in the brain (Clardy et al., 2006; Zechel et al., 2006; Wang et al., 2008), may be a key regulator in brain iron homeostasis. For example, hepcidin plays a key role in 6-hydroxydopamine-induced iron overload and apoptotic cell death in cell culture models of PD (Qin et al., 2016). Moreover, our results show that myricetin alleviated the upregulation of hepcidin expression induced by rotenone. Hepcidin regulates iron homeostasis by modulating the expression of several iron transporters (Du et al., 2015), such as Fpn1. As the only iron efflux transporter, Fpn1 can be internalized and degraded, thereby inhibiting iron efflux (Nemeth et al., 2004). Consistently, our results showed that rotenone treatment markedly downregulated Fpn1 expression, which was attenuated by myricetin. Therefore, we speculate that, in the pathogenesis of PD, neurotoxin stimulation of dopaminergic neurons in the SN causes increased hepcidin expression and decreased Fpn1 expression, resulting in the slowing of iron efflux and induction of abnormal iron accumulation. Myricetin triggers a neuroprotective effect by inhibiting alterations of hepcidin and Fpn1 levels. These results are consistent with a recent finding that myricetin regulates iron homeostasis by suppressing hepcidin expression in human hepatocellular carcinoma cells (Mu et al., 2016). Our results indicate that myricetin accelerates the release of cellular iron by increasing levels of the iron exporter Fpn1 through inhibition of hepcidin expression.
Considering the strong antioxidant capacity of myricetin, our finding showing attenuation of rotenone-induced upregulation of pSTAT3 is highly significant toward understanding mechanisms of myricetin-mediated neuroprotection. Our results show that myricetin inhibited rotenone-induced upregulation of pSMAD1/5/9 protein. As a receptor-activated factor, SMAD1/5/9 is activated and phosphorylated as a downstream component of the bone morphogenetic protein (BMP) signaling pathway. Studies have demonstrated an increasingly important role of BMP/SMAD signaling pathways in central nervous system development (Hegarty et al., 2013) and promotion of neurogenesis by midbrain dopaminergic neurons in vivo (Jovanovic et al., 2018). BMP expression is reportedly increased in the SN and cerebrospinal fluid of PD brains, suggesting that the BMP/SMAD signaling pathway is closely related to PD (Nagatsu et al., 2000). Hepcidin expression is regulated by BMP/SMAD signaling pathways (Gerjevic et al., 2012). Myricetin can reportedly regulate hepcidin expression by targeting the BMP/SMAD signaling pathway (Mu et al., 2016). Thus, it seems likely that mechanisms of myricetin-mediated inhibition of hepcidin expression may partly be attributed to suppression of SMAD1/5/9 activity by myricetin.
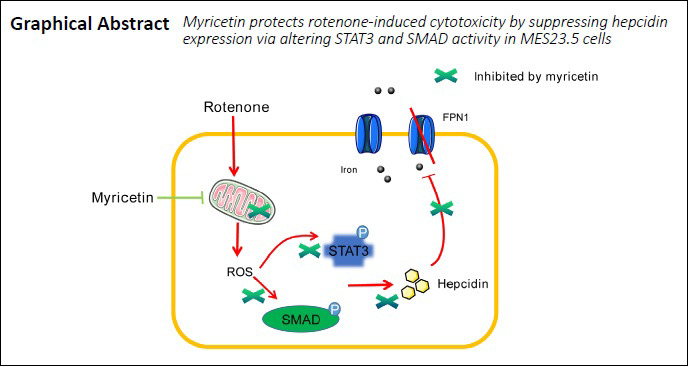
In conclusion, myricetin protected rotenone-treated MES23.5 cells by preventing iron accumulation through potent inhibition of hepcidin expression by altering STAT3 and SMAD1 signaling pathways. A simplified depiction of the neuroprotective mechanisms of myricetin against rotenone-induced cytotoxicity are summarized in Figure 7. However, this study has several limitations that should be considered. Our study only confirmed the protective effect of myricetin in cell models and the pathogenesis of Parkinson’s disease is highly complex. Further studies are needed to explore the molecular mechanisms of myricetin in animal models of PD before it could be considered as a candidate for clinical trials to mitigate PD pathology.
Figure 7.
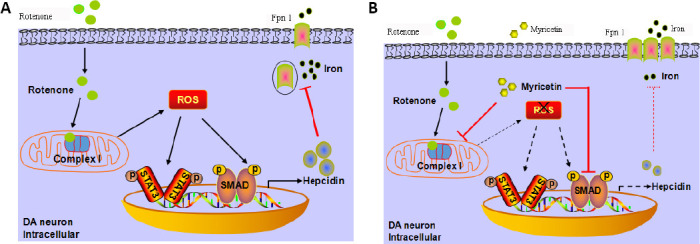
Schematic diagrams showing signaling pathways involved in myricetin-mediated neuroprotection.
(A) By increasing ROS production, rotenone upregulates hepcidin expression via activation of STAT3 and SMAD signaling pathways, thereby inhibiting Fpn1 expression. (B). Myricetin protects against rotenone-induced neurotoxicity by anti-oxidation and suppression of hepcidin expression through inhibition of STAT3 and SMAD signaling. DA: Dopamine; Fpn1: ferroportin 1; p: phosphorylated; ROS: reactive oxygen species; SMAD: mothers against decapentaplegic homolog; STAT3: signal transducer and activator of transcription 3.
Additional file:
Additional file 1 (321KB, pdf) : Original data of the experiment.
Acknowledgments:
We thanked the Dr. Wei-Dong Le from Dalian Medical University (Dalian, China) for providing the MES23.5 cells.
Footnotes
C-Editor: Zhao M; S-Editors: Yu J, Li CH; L-Editors: Deusen AV, Yu J, Song CP; T-Editor: Jia Y
Funding: This study was supported by the National Natural Science Foundation of China, No. 81671249; and the Natural Science Foundation of Shandong Province of China, No. ZR2016CM04 (both to ZGM).
Conflicts of interest: The authors declare that they have no conflict of interests.
Financial support: This study was supported by the National Natural Science Foundation of China, No. 81671249; and the Natural Science Foundation of Shandong Province of China, No. ZR2016CM04 (both to ZGM). The funders had no roles in the study design, conduction of experiment, data collection and analysis, decision to publish, or preparation of the manuscript.
Institutional review board statement: MES23.5 cells are commercial products, and are not directly obtained from humans or animals. So the study did not involve ethical issue.
Copyright license agreement: The Copyright License Agreement has been signed by all authors before publication.
Data sharing statement: Datasets analyzed during the current study are available from the corresponding author on reasonable request.
Plagiarism check: Checked twice by iThenticate.
Peer review: Externally peer reviewed.
References
- 1.Bei Z, Wen GQ, Chen Y. Efficacy of entacapone and pramipexole in treating non-motor symptoms of Parkinson’s disease: a prospective randomized controlled trial. Zhongguo Zuzhi Gongcheng Yanjiu. 2019;23:5052–5058. [Google Scholar]
- 2.Berg D, Hochstrasser H. Iron metabolism in Parkinsonian syndromes. Mov Disord. 2006;21:1299–1310. doi: 10.1002/mds.21020. [DOI] [PubMed] [Google Scholar]
- 3.Betarbet R, Sherer TB, MacKenzie G, Garcia-Osuna M, Panov AV, Greenamyre JT. Chronic systemic pesticide exposure reproduces features of Parkinson’s disease. Nat Neurosci. 2000;3:1301–1306. doi: 10.1038/81834. [DOI] [PubMed] [Google Scholar]
- 4.Cannon JR, Tapias V, Na HM, Honick AS, Drolet RE, Greenamyre JT. A highly reproducible rotenone model of Parkinson’s disease. Neurobiol Dis. 2009;34:279–290. doi: 10.1016/j.nbd.2009.01.016. [DOI] [PMC free article] [PubMed] [Google Scholar]
- 5.Chen JW, Zhu ZQ, Hu TX, Zhu DY. Structure-activity relationship of natural flavonoids in hydroxyl radical-scavenging effects. Acta Pharmacol Sin. 2002;23:667–672. [PubMed] [Google Scholar]
- 6.Chen Q, Chen Y, Zhang Y, Wang F, Yu H, Zhang C, Jiang Z, Luo W. Iron deposition in Parkinson’s disease by quantitative susceptibility mapping. BMC Neurosci. 2019;20:23. doi: 10.1186/s12868-019-0505-9. [DOI] [PMC free article] [PubMed] [Google Scholar]
- 7.Chinta SJ, Lieu CA, Demaria M, Laberge RM, Campisi J, Andersen JK. Environmental, ageing and glial cell senescence: a novel mechanistic link to Parkinson’s disease. J Intern Med. 2013;273:429–436. doi: 10.1111/joim.12029. [DOI] [PMC free article] [PubMed] [Google Scholar]
- 8.Clardy SL, Wang X, Boyer PJ, Earley CJ, Allen RP, Connor JR. Is ferroportin-hepcidin signaling altered in restless legs syndrome. J Neurol Sci. 2006;247:173–179. doi: 10.1016/j.jns.2006.04.008. [DOI] [PubMed] [Google Scholar]
- 9.Dani C, Proen?a IT, Marinho J, Peccin P, da Silva IRV, Nique S, Striebel V, Pochmann D, Elsner VR. Aquatic exercise program-modulated oxidative stress markers in patients with Parkinson’s disease. Neural Regen Res. 2020;15:2067–2072. doi: 10.4103/1673-5374.276337. [DOI] [PMC free article] [PubMed] [Google Scholar]
- 10.de Andrade Teles RB, Diniz TC, Costa Pinto TC, de Oliveira Júnior RG, Gama ESM, de Lavor É M, Fernandes AWC, de Oliveira AP, de Almeida Ribeiro FPR, da Silva AAM, Cavalcante TCF, Quintans Júnior LJ, da Silva Almeida JRG. Flavonoids as therapeutic agents in alzheimer’s and Parkinson’s diseases: a systematic review of preclinical evidences. Oxid Med Cell Longev. 2018;2018:7043213. doi: 10.1155/2018/7043213. [DOI] [PMC free article] [PubMed] [Google Scholar]
- 11.Deng H, Jia Y, Pan D, Ma Z. Berberine alleviates rotenone-induced cytotoxicity by antioxidation and activation of PI3K/Akt signaling pathway in SH-SY5Y cells. Neuroreport. 2020;31:41–47. doi: 10.1097/WNR.0000000000001365. [DOI] [PubMed] [Google Scholar]
- 12.Du F, Qian ZM, Luo Q, Yung WH, Ke Y. Hepcidin suppresses brain iron accumulation by downregulating iron transport proteins in iron-overloaded rats. Mol Neurobiol. 2015;52:101–114. doi: 10.1007/s12035-014-8847-x. [DOI] [PubMed] [Google Scholar]
- 13.Ganz T. Cellular iron: ferroportin is the only way out. Cell Metab. 2005;1:155–157. doi: 10.1016/j.cmet.2005.02.005. [DOI] [PubMed] [Google Scholar]
- 14.Gerjevic LN, Liu N, Lu S, Harrison-Findik DD. Alcohol activates TGF-beta but inhibits BMP receptor-mediated smad signaling and Smad4 binding to hepcidin promoter in the liver. Int J Hepatol. 2012;2012:459278. doi: 10.1155/2012/459278. [DOI] [PMC free article] [PubMed] [Google Scholar]
- 15.Götz ME, Double K, Gerlach M, Youdim MB, Riederer P. The relevance of iron in the pathogenesis of Parkinson’s disease. Ann N Y Acad Sci. 2004;1012:193–208. doi: 10.1196/annals.1306.017. [DOI] [PubMed] [Google Scholar]
- 16.Gozzelino R, Arosio P. Iron homeostasis in health and disease. Int J Mol Sci. 2016;17:130. doi: 10.3390/ijms17010130. [DOI] [PMC free article] [PubMed] [Google Scholar]
- 17.Hegarty SV, O’Keeffe GW, Sullivan AM. BMP-Smad 1/5/8 signalling in the development of the nervous system. Prog Neurobiol. 2013;109:28–41. doi: 10.1016/j.pneurobio.2013.07.002. [DOI] [PubMed] [Google Scholar]
- 18.Hroudová J, Singh N, Fišar Z. Mitochondrial dysfunctions in neurodegenerative diseases: relevance to Alzheimer’s disease. Biomed Res Int. 2014;2014:175062. doi: 10.1155/2014/175062. [DOI] [PMC free article] [PubMed] [Google Scholar]
- 19.Jovanovic VM, Salti A, Tilleman H, Zega K, Jukic MM, Zou H, Friedel RH, Prakash N, Blaess S, Edenhofer F, Brodski C. BMP/SMAD pathway promotes neurogenesis of midbrain dopaminergic neurons in vivo and in human induced pluripotent and neural stem cells. J Neurosci. 2018;38:1662–1676. doi: 10.1523/JNEUROSCI.1540-17.2018. [DOI] [PMC free article] [PubMed] [Google Scholar]
- 20.Jung UJ, Kim SR. Beneficial effects of flavonoids against Parkinson’s disease. J Med Food. 2018;21:421–432. doi: 10.1089/jmf.2017.4078. [DOI] [PubMed] [Google Scholar]
- 21.Krause A, Neitz S, Mägert HJ, Schulz A, Forssmann WG, Schulz-Knappe P, Adermann K. LEAP-1, a novel highly disulfide-bonded human peptide, exhibits antimicrobial activity. FEBS Lett. 2000;480:147–150. doi: 10.1016/s0014-5793(00)01920-7. [DOI] [PubMed] [Google Scholar]
- 22.Lagoa R, Samhan-Arias AK, Gutierrez-Merino C. Correlation between the potency of flavonoids for cytochrome c reduction and inhibition of cardiolipin-induced peroxidase activity. Biofactors. 2017;43:451–468. doi: 10.1002/biof.1357. [DOI] [PubMed] [Google Scholar]
- 23.Lagoa R, Graziani I, Lopez-Sanchez C, Garcia-Martinez V, Gutierrez-Merino C. Complex I and cytochrome c are molecular targets of flavonoids that inhibit hydrogen peroxide production by mitochondria. Biochim Biophys Acta. 2011;1807:1562–1572. doi: 10.1016/j.bbabio.2011.09.022. [DOI] [PubMed] [Google Scholar]
- 24.Ma ZG, Wang J, Jiang H, Liu TW, Xie JX. Myricetin reduces 6-hydroxydopamine-induced dopamine neuron degeneration in rats. Neuroreport. 2007;18:1181–1185. doi: 10.1097/WNR.0b013e32821c51fe. [DOI] [PubMed] [Google Scholar]
- 25.Montalto AS, Currò M, Russo T, Visalli G, Impellizzeri P, Antonuccio P, Arena S, Borruto FA, Scalfari G, Ientile R, Romeo C. In vitro CO2-induced ROS production impairs cell cycle in SH-SY5Y neuroblastoma cells. Pediatr Surg Int. 2013;29:51–59. doi: 10.1007/s00383-012-3206-3. [DOI] [PubMed] [Google Scholar]
- 26.Moreau C, Duce JA, Rascol O, Devedjian JC, Berg D, Dexter D, Cabantchik ZI, Bush AI, Devos D. Iron as a therapeutic target for Parkinson’s disease. Mov Disord. 2018;33:568–574. doi: 10.1002/mds.27275. [DOI] [PubMed] [Google Scholar]
- 27.Mouhape C, Costa G, Ferreira M, Abin-Carriquiry JA, Dajas F, Prunell G. Nicotine-induced neuroprotection in rotenone in vivo and in vitro models of Parkinson’s disease: evidences for the involvement of the labile iron pool level as the underlying mechanism. Neurotox Res. 2019;35:71–82. doi: 10.1007/s12640-018-9931-1. [DOI] [PubMed] [Google Scholar]
- 28.Mu M, An P, Wu Q, Shen X, Shao D, Wang H, Zhang Y, Zhang S, Yao H, Min J, Wang F. The dietary flavonoid myricetin regulates iron homeostasis by suppressing hepcidin expression. J Nutr Biochem. 2016;30:53–61. doi: 10.1016/j.jnutbio.2015.10.015. [DOI] [PubMed] [Google Scholar]
- 29.Nagatsu T, Mogi M, Ichinose H, Togari A. Changes in cytokines and neurotrophins in Parkinson’s disease. J Neural Transm Suppl. 2000:277–290. doi: 10.1007/978-3-7091-6301-6_19. [DOI] [PubMed] [Google Scholar]
- 30.Nemeth E, Tuttle MS, Powelson J, Vaughn MB, Donovan A, Ward DM, Ganz T, Kaplan J. Hepcidin regulates cellular iron efflux by binding to ferroportin and inducing its internalization. Science. 2004;306:2090–2093. doi: 10.1126/science.1104742. [DOI] [PubMed] [Google Scholar]
- 31.Ohira K. Dopamine as a growth differentiation factor in the mammalian brain. Neural Regen Res. 2020;15:390–393. doi: 10.4103/1673-5374.266052. [DOI] [PMC free article] [PubMed] [Google Scholar]
- 32.Ono K, Yoshiike Y, Takashima A, Hasegawa K, Naiki H, Yamada M. Potent anti-amyloidogenic and fibril-destabilizing effects of polyphenols in vitro: implications for the prevention and therapeutics of Alzheimer’s disease. J Neurochem. 2003;87:172–181. doi: 10.1046/j.1471-4159.2003.01976.x. [DOI] [PubMed] [Google Scholar]
- 33.Park CH, Valore EV, Waring AJ, Ganz T. Hepcidin, a urinary antimicrobial peptide synthesized in the liver. J Biol Chem. 2001;276:7806–7810. doi: 10.1074/jbc.M008922200. [DOI] [PubMed] [Google Scholar]
- 34.Powers KM, Smith-Weller T, Franklin GM, Longstreth WT, Jr, Swanson PD, Checkoway H. Parkinson’s disease risks associated with dietary iron, manganese, and other nutrient intakes. Neurology. 2003;60:1761–1766. doi: 10.1212/01.wnl.0000068021.13945.7f. [DOI] [PubMed] [Google Scholar]
- 35.Qin H, Buckley JA, Li X, Liu Y, Fox TH, 3rd, Meares GP, Yu H, Yan Z, Harms AS, Li Y, Standaert DG, Benveniste EN. Inhibition of the JAK/STAT pathway protects against a-synuclein-induced neuroinflammation and dopaminergic neurodegeneration. J Neurosci. 2016;36:5144–5159. doi: 10.1523/JNEUROSCI.4658-15.2016. [DOI] [PMC free article] [PubMed] [Google Scholar]
- 36.Ratty AK, Das NP. Effects of flavonoids on nonenzymatic lipid peroxidation: structure-activity relationship. Biochem Med Metab Biol. 1988;39:69–79. doi: 10.1016/0885-4505(88)90060-6. [DOI] [PubMed] [Google Scholar]
- 37.Rhodes SL, Ritz B. Genetics of iron regulation and the possible role of iron in Parkinson’s disease. Neurobiol Dis. 2008;32:183–195. doi: 10.1016/j.nbd.2008.07.001. [DOI] [PMC free article] [PubMed] [Google Scholar]
- 38.Robak J, Gryglewski RJ. Flavonoids are scavengers of superoxide anions. Biochem Pharmacol. 1988;37:837–841. doi: 10.1016/0006-2952(88)90169-4. [DOI] [PubMed] [Google Scholar]
- 39.Shi CK, Chen ZQ. Effect of microglia on iron metabolismin midbrain dopaminergic neurons and theunderlying mechanism: study protocol for anin vitro cellular experiment. Zhongguo Zuzhi Gongcheng Yanjiu. 2017;21:1262–1267. [Google Scholar]
- 40.Tada-Oikawa S, Hiraku Y, Kawanishi M, Kawanishi S. Mechanism for generation of hydrogen peroxide and change of mitochondrial membrane potential during rotenone-induced apoptosis. Life Sci. 2003;73:3277–3288. doi: 10.1016/j.lfs.2003.06.013. [DOI] [PubMed] [Google Scholar]
- 41.Wang Q, Du F, Qian ZM, Ge XH, Zhu L, Yung WH, Yang L, Ke Y. Lipopolysaccharide induces a significant increase in expression of iron regulatory hormone hepcidin in the cortex and substantia nigra in rat brain. Endocrinology. 2008;149:3920–3925. doi: 10.1210/en.2007-1626. [DOI] [PMC free article] [PubMed] [Google Scholar]
- 42.Wang QM, Xu YY, Liu S, Ma ZG. Isradipine attenuates MPTP-induced dopamine neuron degeneration by inhibiting up-regulation of L-type calcium channels and iron accumulation in the substantia nigra of mice. Oncotarget. 2017;8:47284–47295. doi: 10.18632/oncotarget.17618. [DOI] [PMC free article] [PubMed] [Google Scholar]
- 43.Xu YY, Wan WP, Zhao S, Ma ZG. L-type calcium channels are involved in iron-induced neurotoxicity in primary cultured ventral mesencephalon neurons of rats. Neurosci Bull. 2020;36:165–173. doi: 10.1007/s12264-019-00424-2. [DOI] [PMC free article] [PubMed] [Google Scholar]
- 44.Youdim MB, Stephenson G, Ben Shachar D. Ironing iron out in Parkinson’s disease and other neurodegenerative diseases with iron chelators: a lesson from 6-hydroxydopamine and iron chelators, desferal and VK-28. Ann N Y Acad Sci. 2004;1012:306–325. doi: 10.1196/annals.1306.025. [DOI] [PubMed] [Google Scholar]
- 45.Yu H, Li YH, Feng XL, Wu YC, Zhou H, Chen B. Identification and activity assay of the tyrosine hydroxylase in MES23.5 cells Zhongguo Shengwu Huaxue yu. Fenzi Shengwu Xuebao. 2004;20:95–100. [Google Scholar]
- 46.Yu J, Xu H, Shen X, Jiang H. Ghrelin protects MES23.5 cells against rotenone via inhibiting mitochondrial dysfunction and apoptosis. Neuropeptides. 2016;56:69–74. doi: 10.1016/j.npep.2015.09.011. [DOI] [PubMed] [Google Scholar]
- 47.Zechel S, Huber-Wittmer K, von Bohlen und Halbach O. Distribution of the iron-regulating protein hepcidin in the murine central nervous system. J Neurosci Res. 2006;84:790–800. doi: 10.1002/jnr.20991. [DOI] [PubMed] [Google Scholar]
- 48.Zhang K, Ma Z, Wang J, Xie A, Xie J. Myricetin attenuated MPP(+)-induced cytotoxicity by anti-oxidation and inhibition of MKK4 and JNK activation in MES23.5 cells. Neuropharmacology. 2011;61:329–335. doi: 10.1016/j.neuropharm.2011.04.021. [DOI] [PubMed] [Google Scholar]
- 49.Zhang S, Ma Y, Feng J. Neuroprotective mechanisms of e-viniferin in a rotenone-induced cell model of Parkinson’s disease: significance of SIRT3-mediated FOXO3 deacetylation. Neural Regen Res. 2020;15:2143–2153. doi: 10.4103/1673-5374.282264. [DOI] [PMC free article] [PubMed] [Google Scholar]
- 50.Zhang S, Wang J, Song N, Xie J, Jiang H. Up-regulation of divalent metal transporter 1 is involved in 1-methyl-4-phenylpyridinium (MPP(+))-induced apoptosis in MES23.5 cells. Neurobiol Aging. 2009;30:1466–1476. doi: 10.1016/j.neurobiolaging.2007.11.025. [DOI] [PubMed] [Google Scholar]
- 51.Zhang Z, Hou L, Song JL, Song N, Sun YJ, Lin X, Wang XL, Zhang FZ, Ge YL. Pro-inflammatory cytokine-mediated ferroportin down-regulation contributes to the nigral iron accumulation in lipopolysaccharide-induced Parkinsonian models. Neuroscience. 2014;257:20–30. doi: 10.1016/j.neuroscience.2013.09.037. [DOI] [PubMed] [Google Scholar]
- 52.Zhao X, Wang J, Hu S, Wang R, Mao Y, Xie J. Neuroprotective effect of resveratrol on rotenone-treated C57BL/6 mice. Neuroreport. 2017;28:498–505. doi: 10.1097/WNR.0000000000000789. [DOI] [PubMed] [Google Scholar]
Associated Data
This section collects any data citations, data availability statements, or supplementary materials included in this article.


