Abstract
Proinflammatory macrophages are key in the development of obesity. In addition, reactive oxygen species (ROS), which activate the Fgr tyrosine kinase, also contribute to obesity. Here we show that ablation of Fgr impairs proinflammatory macrophage polarization while preventing high-fat diet (HFD)-induced obesity in mice. Systemic ablation of Fgr increases lipolysis and liver fatty acid oxidation, thereby avoiding steatosis. Knockout of Fgr in bone marrow (BM)-derived cells is sufficient to protect against insulin resistance and liver steatosis following HFD feeding, while the transfer of Fgr-expressing BM-derived cells reverts protection from HFD feeding in Fgr-deficient hosts. Scavenging of mitochondrial peroxides is sufficient to prevent Fgr activation in BM-derived cells and HFD-induced obesity. Moreover, Fgr expression is higher in proinflammatory macrophages and correlates with obesity traits in both mice and humans. Thus, our findings reveal the mitochondrial ROS–Fgr kinase as a key regulatory axis in proinflammatory adipose tissue macrophage activation, diet-induced obesity, insulin resistance and liver steatosis.
Obesity is currently considered one of the major health problems since it underlies heart disease, strokes, cancer, liver steatosis, metabolic syndromes, high blood pressure and some autoimmune diseases, among other health risks. A combination of excess nutrient intake, lack of physical activity and genetic risk factors leads to an imbalance in energy demand versus energy consumption that initiates obesity. The adipose tissue is the nutrient depository but it also actively modulates metabolism by secreting cytokines that alter the tissue microenvironment with infiltrating immune cells that promote inflammation. Indeed, inflammation is a major driver contributing to the maintenance of obesity, promoting insulin resistance and metabolic syndrome. Macrophages infiltrated in the adipose tissue (ATM) orchestrate the inflammatory process 1–3. Macrophages contribute to the homeostatic state of many tissues due to their plasticity and rapid adaptation to changes in the microenvironment. In healthy mice and humans, adipocytes switch from lipolytic to lipogenic metabolism during excess nutrient intake and become larger. However, this is not the case when there is insulin resistance where lipogenesis is impaired in the adipose tissue. In parallel, the adipose tissue is infiltrated by proinflammatory macrophages, which form crown-like structures that surround adipocytes. This leads to overproduction of adipokines and proinflammatory mediators, such as tumour necrosis factor alpha (TNF-α), interleukin (IL)-1β and IL-6, which are linked to metabolic dysfunction4,5. Blocking proinflammatory macrophage polarization with pharmacological or nutritional anti-inflammatory interventions has thus become an appealing therapeutic strategy for obesity. Some studies point to dietary fatty acids, vitamins C, D and E, and polyphenols, as modulators of the proinflammatory profile in macrophages (reviewed in McArdle et al. 6). However, we need to learn more about how changes in nutrient use affect macrophage polarization and function and how we can target this pathway therapeutically.
We recently showed that ROS-dependent activation of Fgr (a tyrosine kinase from the Src family) is involved in the innate immune response to bacterial infection by targeting the production of inflammatory cytokines by macrophages7. Stressful situations that generate ROS such as starvation, reoxygenation after hypoxia, fuel switch or TLR activation, promote Fgr activation, which ultimately leads to complex II phosphorylation, increased complex II activity and complex I degradation8,9. We hypothesized that obesity could similarly lead to Fgr activation in macrophages, which would drive inflammation. Here, we show that Fgr ablation impairs proinflammatory macrophage polarization and prevents HFD-induced obesity. We demonstrate that BM cells are the drivers of insulin resistance and liver steatosis and that mitochondrial ROS in BM cells control diet-induced obesity. These findings identify the mitochondrial ROS–Fgr kinase axis as a potential target that can be inhibited to dampen the proinflammatory phenotype of macrophages infiltrating the adipose tissue, thus reducing the deleterious effects associated with diet-induced obesity.
Results
Proinflammatory polarization of macrophages requires mitochondrial ROS, Fgr kinase and complex II.
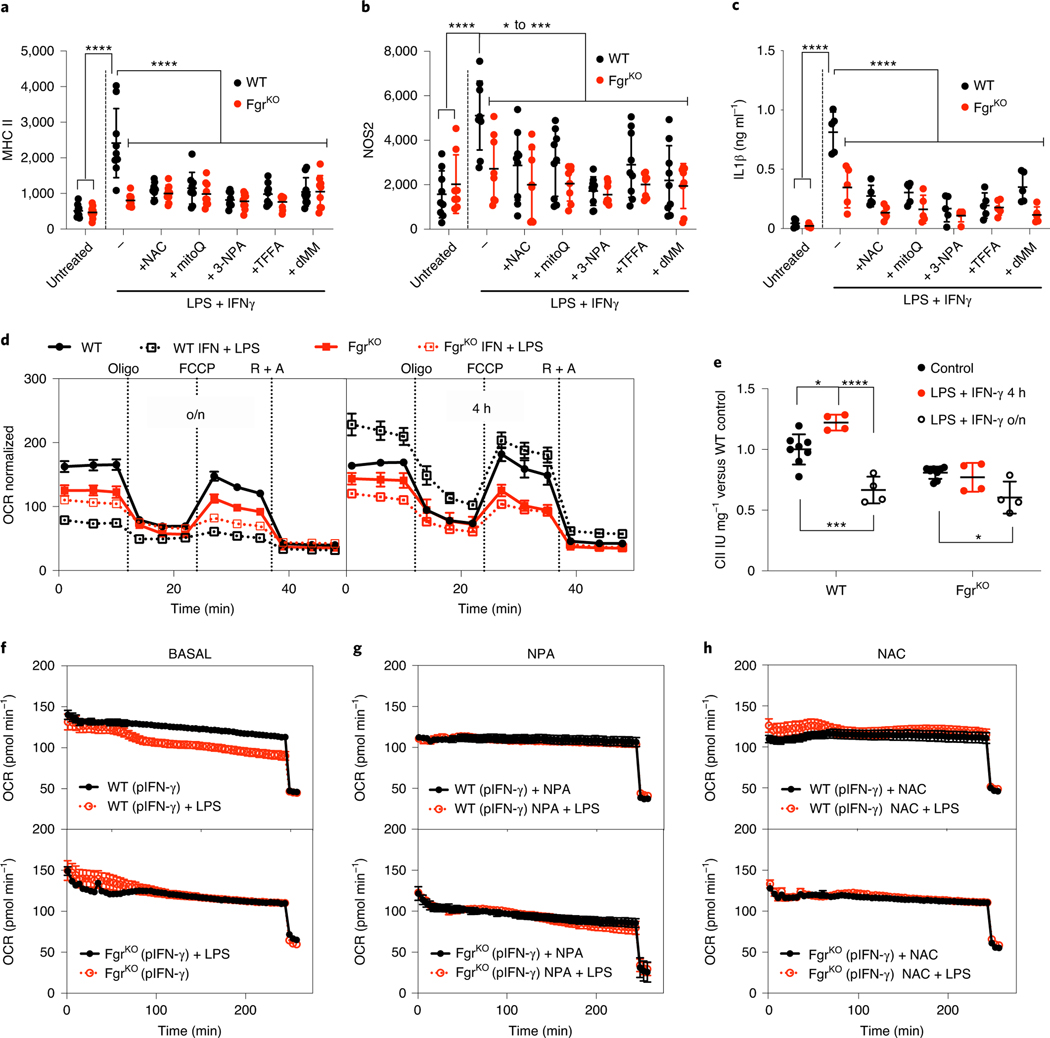
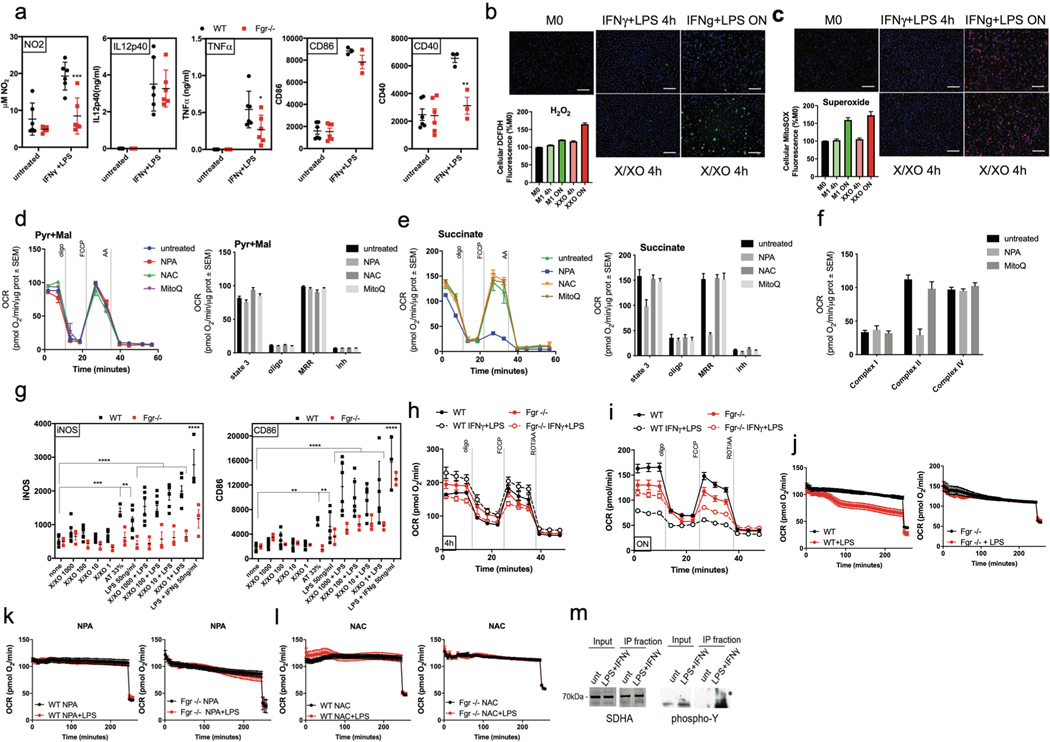
Mitochondria can switch among a variety of metabolic states that modulate cell function. A relevant parameter in the adaptation of mitochondrial oxidative phosphorylation is the ratio of NADH/FADH2 electrons, which depends on the use of different carbon sources10. This adaptation is regulated by H2O2-mediated activation of the Fgr tyrosine kinase9, which phosphorylates and activates complex II and triggers the remodelling of the mitochondrial ETC8. The ablation of Fgr impairs the metabolic adaptation of macrophages required to efficiently combat bacterial infection7, which depends on the activation of complex II7,11. Proinflammatory macrophages (linked to classically activated ‘M1’ polarization) promote TH1 responses and tumouricidal activity but also contribute to inflammation in obesity. Robust M1-like polarization can be achieved in vitro in BM-derived macrophages (BMDMs) through Toll-like receptor 4 (TLR4) stimulation with the pathogen-associated molecular pattern lipopolysaccharide (LPS) or the combination of interferon (IFN)-γ + LPS and is characterized by the induction of major histocompatibility complex (MHC) class II expression, inducible nitric oxide synthase (iNOS) expression and secretion of inflammatory cytokines such as IL-1β. When BMDMs from wild-type (WT) and Fgr-deficient mice (C57BL/6JOlaHsd genetic background) were cultured overnight in the presence of LPS or IFN-γ + LPS, we observed that the lack of Fgr impaired M1-like polarization (Fig. 1a–c and Extended Data Fig. 1a). Since ROS are major activators of Fgr9, we measured ROS using dichlorofluorescein diacetate (DCFDA) and MitoSOX in macrophages treated with IFN-γ + LPS or, as control, the combination of xanthine/xanthine oxidase that generates H2O2 (ref. 9). We found that M1-like polarization with IFN-γ + LPS resulted in ROS production (Extended Data Fig. 1b,c). Of note, polarization was blunted in WT macrophages in the presence of either general or mitochondrial-specific ROS scavengers (N-acetylcysteine (NAC) and mitoQ, respectively), mimicking Fgr loss (Fig. 1a–c). Moreover, M1-like polarization was also prevented by a variety of complex II inhibitors (Fig. 1a–c). None of these treatments further reduced M1-like polarization in Fgr-deficient macrophages, indicating that they are in the same pathway. These results suggest that innate stimulation of macrophages leads to production of mitochondrial ROS that activate Fgr kinase, which regulates complex II activity and thereby macrophage polarization. To test whether the scavengers or the inhibitors used could target mitochondria in ways other than by reducing ROS species or complex II activity, we measured respiration in isolated mitochondria under different conditions. We first measured pyruvate plus malate– and succinate-driven respiration in liver mitochondria pretreated for 20 min with either the complex II inhibitor 3-nitropropionic acid (NPA) or the ROS scavengers NAC and MitoQ. The results show that only complex II activity was affected in the presence of NPA, as expected (Extended Data Fig. 1d–e). We have also measured maximal oxygen consumption in frozen mitochondria12 under the same conditions and showed that only complex II activity is affected when using complex II inhibitors, so we did not find further effects of complex II inhibitors or ROS scavengers in ETC flux (Extended Data Fig. 1f). In addition, we tested whether ROS alone could promote macrophage polarization. It was only when ROS was combined with LPS, and only in WT macrophages, that we observed an increase in proinflammatory macrophage markers, suggesting that the increase in ROS is necessary but not sufficient to achieve full proinflammatory macrophage activation. These results also indicate that both pathogen-associated molecular pattern activation and ROS sensing by Fgr is required for full macrophage activation (Extended Data Fig. 1g).
Fig. 1 |. Lack of Fgr prevents proinflammatory M1-like polarization of BMDMs.
a–c, BMDMs from WT and Fgr-deficient (FgrKO) mice untreated or treated with LPS + IFN-γ in the presence, where indicated, of antioxidants NAC, MitoQ, and complex II inhibitors NPA, thenoyltrifluoroacetone (TTFA) and dimethylmalonate (dMM) were analysed by flow cytometry for MHC class II (a; data are from n = 8 independent experiments) and NOS2 (b; n = 8 experiments) and by ELISA for IL-1β (c; n = 5). d, Representative Seahorse profile of the oxygen consumption rate (OCR) of BMDMs from WT and FgrKO mice treated with LPS + IFN-γ for 16 h (overnight, o/n; left) or 4 h (right) normalized by cell number (n = 7 for untreated or n = 4 for treated). e, Complex II activity measured by spectrophotometry in lysates from BMDMs treated as in d (n = 4); IU, international units. f–h, Representative oxygen consumption analysis of IFN-γ-primed (pIFN-γ) BMDMs from WT (upper) and FgrKO (lower) mice treated with LPS (f), LPS + NPA (g) and LPS + NAC (h) at the start of the Seahorse assay (n = 3). *, P < 0.05; **, P < 0.01; ***, P < 0.001; ****, P < 0.0001. Statistical analyses were performed using one-way ANOVA and Tukey’s post hoc test (a–c and e). Each point represents a biological replicate. Data are shown as the mean ± s.e.m.
Fgr controls macrophage metabolism and response to white adipose tissue-conditioned medium.
To address the consequences of Fgr absence for mitochondrial metabolism in proinflammatory polarizing conditions, we studied respirometry in IFN-γ + LPS-stimulated macrophages. Analysis at 4 h after stimulation revealed an increase in respiration in stimulated WT BMDMs, which correlated with increased complex II activity13 and was prevented in the absence of Fgr (Fig. 1d,e and Extended Data Fig. 1h). Of note, as previously described14, overnight stimulation blocked respiration in WT macrophages, while stimulated Fgr−/− BMDMs showed a lower basal respiration in nonstimulated conditions, which was not further reduced by LPS treatment (Fig. 1d and Extended Data Fig. 1i). To address this desensitization to the LPS-driven metabolic switch in the absence of Fgr, we monitored mitochondrial respiration in real time in response to LPS stimulation. We performed respirometry assays on macrophages primed with IFN-γ overnight and stimulated in situ with LPS. Real-time treatment of WT macrophages with LPS led to decreased respiration (Fig. 1f), and this effect was prevented in the absence of Fgr (Fig. 1f and Extended Data Fig. 1j) by complex II inhibition (Fig. 1g and Extended Data Fig. 1k), and ROS scavenging (Fig. 1h and Extended Data Fig. 1l). These results suggest that mitochondrial metabolic changes associated with M1-like proinflammatory macrophage polarization need ROS-mediated complex II activation dependent on Fgr kinase (Extended Data Fig. 1m).
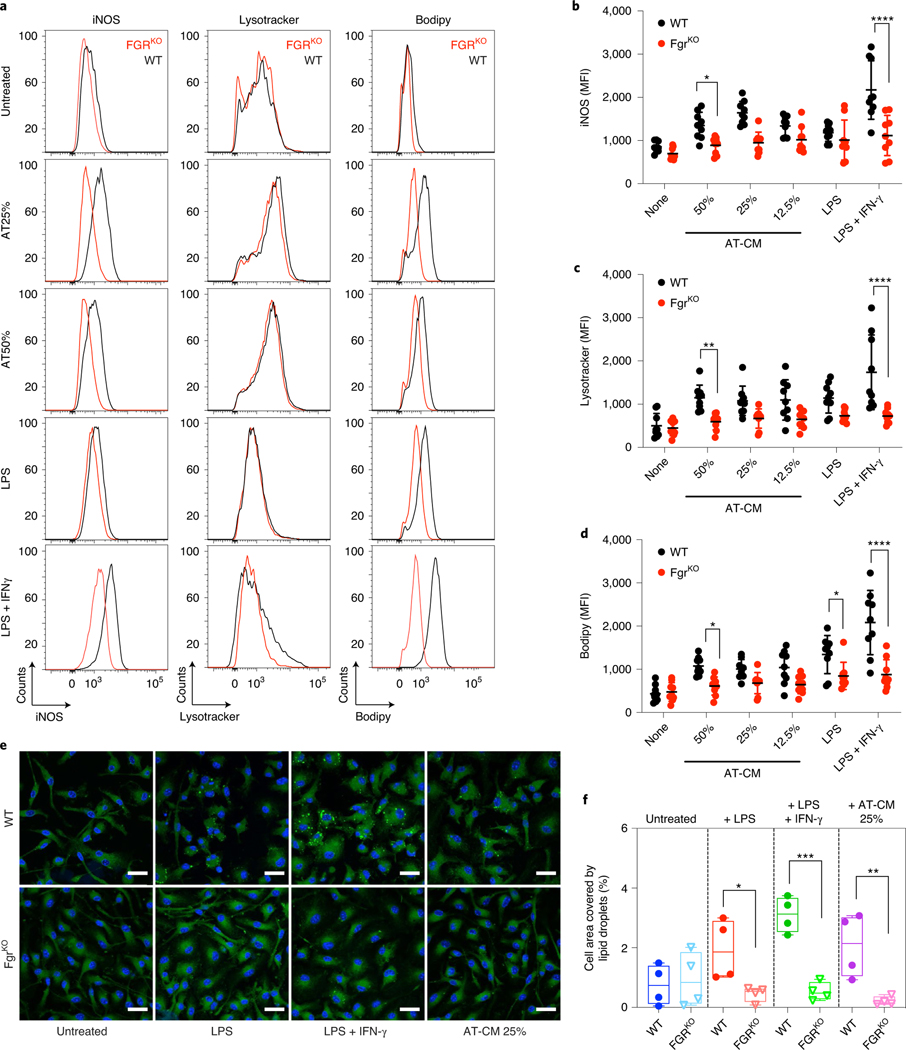
Diet-induced obesity promotes metabolic adaptive responses in the adipocyte that drive the release of cytokines in white adipose tissue (WAT). These cytokines foster accumulation of inflammatory macrophages that further contribute to metabolic dysfunction4,5,15. Steady-state adipose tissue macrophages exert a protective/homeostatic function by regulating lipid metabolism1. However, massive accumulation of lipids in macrophages favours insulin resistance and glucose intolerance16,17. Other studies have also shown that lipid accumulation in a novel and conserved Trem2+ lipid-associated macrophage subset within the adipose tissue actually protects against insulin resistance18,19. Lipid-laden macrophages do accumulate in obese insulin-resistant adipose tissue, but it is regarded as a protective mechanism rather than a mechanism promoting insulin resistance. Indeed, one of the hallmarks of WAT macrophages in obese mice is a lysosomal-dependent accumulation of lipid droplets16. Since Fgr regulates proinflammatory macrophage activation, we next studied the effect of cytokines and adipokines produced by WAT in macrophage activation. BMDMs from WT or Fgr-deficient mice were incubated in the presence of increasing concentrations of WAT-conditioned media (AT-CM) obtained from WT obese mice fed a HFD for 12 weeks, LPS alone and LPS + IFN-γ as controls. Notably, like LPS + IFN-γ, AT-CM induced iNOS expression (Fig. 2a,b) and lipid droplet formation (Fig. 2a,c) in BMDMs, which was prevented in the absence of Fgr. The Fgr-dependent increase in lipid droplet formation following activation of BMDMs with AT-CM, LPS and LPS + IFN-γ was confirmed by confocal imaging (Fig. 2d,e), as previously reported20–23. These results confirm that triglyceride synthesis and lipid droplet formation is required for inflammatory macrophage function and proinflammatory cytokine production.
Fig. 2 |. Lack of Fgr prevents At-CM polarization of BMDMs.
a–c, BMDMs from WT and FgrKO mice were cultured o/n in the presence of AT-CM, LPS or LPS + IFN-γ; iNOS, Lysotracker and BODIPY were determined by flow cytometry. Representative histograms of iNOS, Lysotracker and BODIPY (a). Red, FgrKO; black, control. Mean fluorescence intensity (MFI) quantifications (b–d). e, Representative images of BMDMs treated as indicated o/n and subsequently stained with DAPI (blue) and BODIPY 493 (green). Scale bars: 20 μm. f, Lipid droplet quantification in BMDMs after polarization in the indicated conditions. a–d, Data are from n = 8 independent experiments; e and f, n = 5 experiments. For image analysis, more than 100 cells were analysed per experiment and averaged for quantification purposes. *, P < 0.05; **, P < 0.01; ***, P < 0.001; ****, P < 0.0001. Statistical analyses were performed using two-way ANOVA and Tukey’s post hoc test. Each point represents a biological replicate and data are shown as the mean ± s.e.m.
Fgr-deficient mice are protected against HFD-induced obesity.
Since obesity is associated with metabolic rewiring and polarization to proinflammatory macrophages in the adipose tissue24, we determined whether Fgr could be contributing to obesity. WT and Fgr−/− mice were fed a HFD for 10 weeks. Since some C57BL/6J strains harbour a null mutation in the nicotinamide nucleotide transhydrogenase (Nnt) gene, which affects the severity of the liver phenotype induced by HFD25, we performed our studies with both NNTWT and NNTKO genotypes in the C57BL/6J strain.
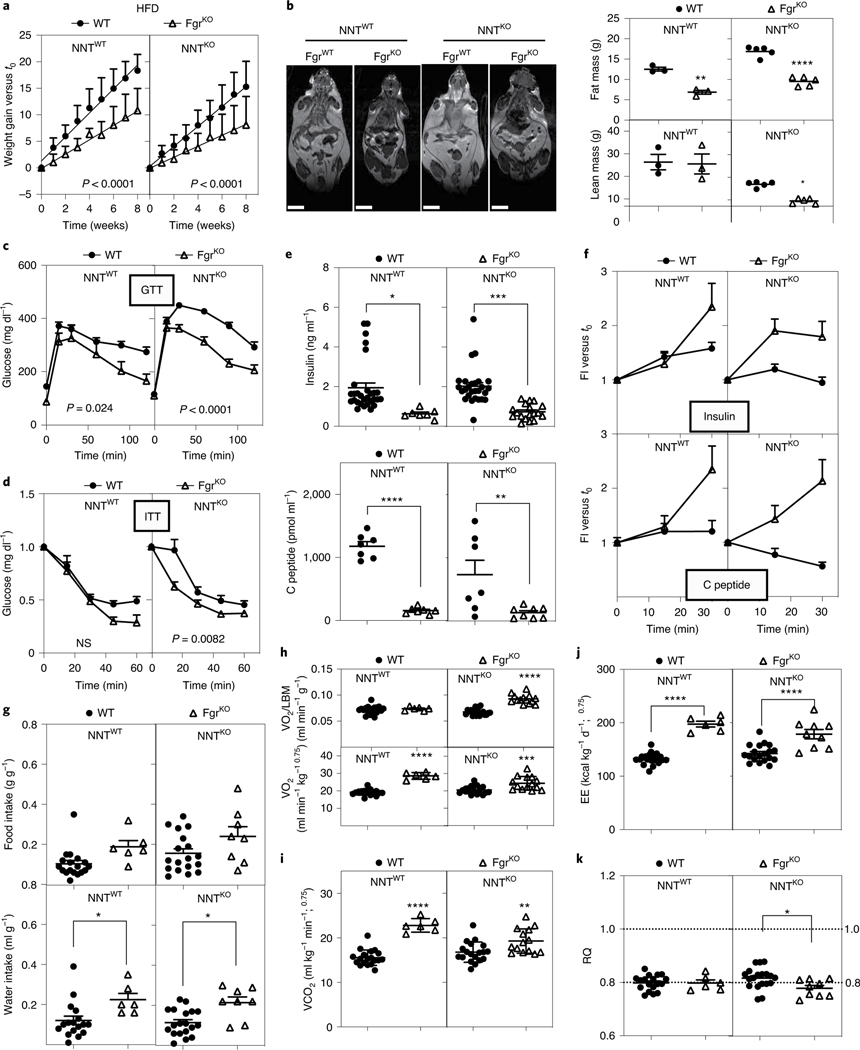
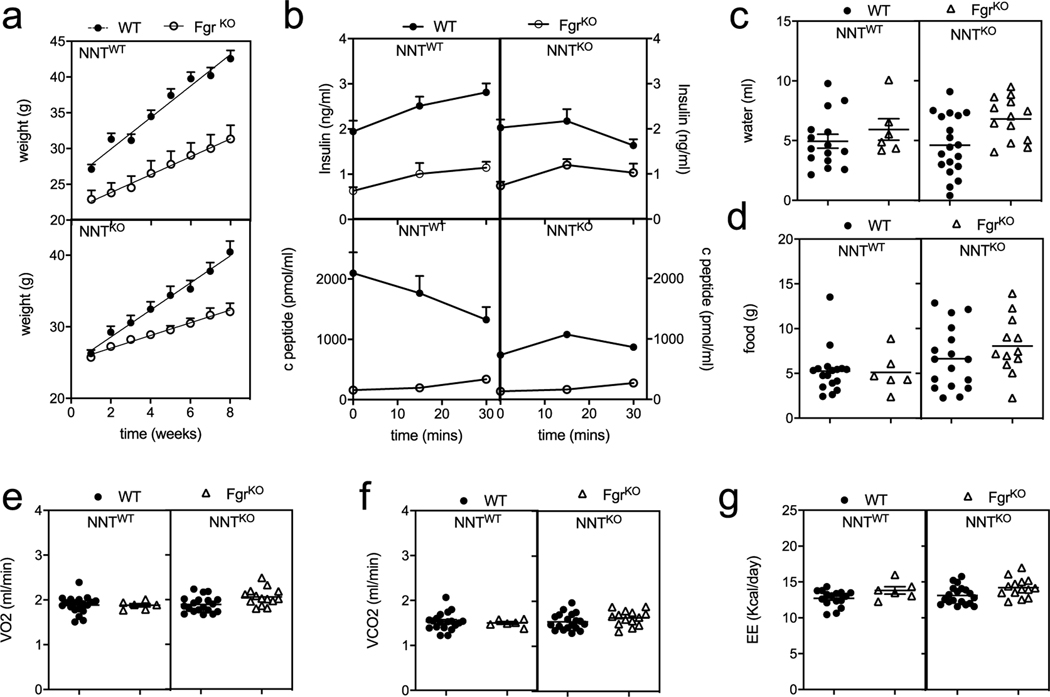
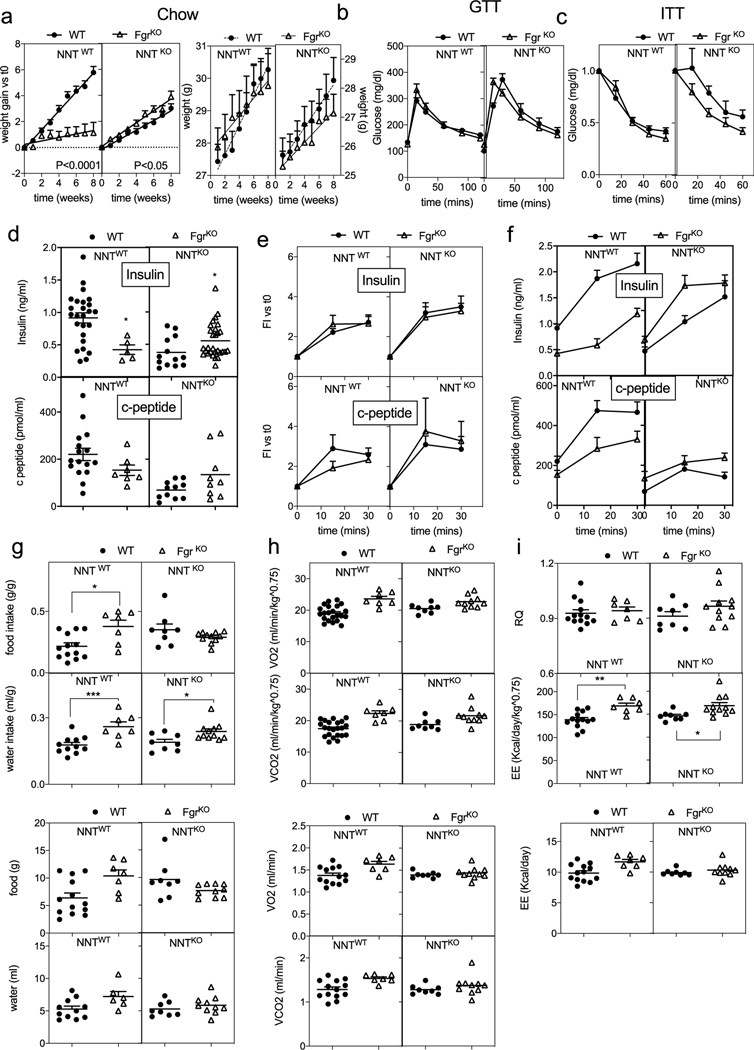
The ablation of Fgr caused a divergent effect in weight gain between NNTWT and NNTKO mice when fed with a standard diet (SD; Extended Data Figs. 2a and 3a), illustrating the interaction between both mitochondrial genes. However, when fed with a HFD, mice lacking Fgr consistently gained significantly less weight (Fig. 3a), with lower fat mass (Fig. 3b) than their isogenic control, independently of NNT. Accordingly, only HFD-induced glucose intolerance in WT mice was prevented in the absence of Fgr regardless of their NNT genotype (Fig. 3c and Extended Data Fig. 3). Insulin tolerance was influenced by both genes (Nnt and Fgr) and by diet type (Fig. 3d and Extended Data Fig. 3c); for example, mice lacking Fgr showed lower basal insulin and C-peptide levels (Fig. 3e and Extended Data Fig. 3d), with normal profiles for insulin release, indicative of better glucose metabolism in Fgr−/− animals (Fig. 3f and Extended Data Figs. 2b and 3e,f). When analysing whole-body metabolism, we observed that Fgr−/− mice drank significantly more water than controls in any diet, regardless of the NNT status (Fig. 3g and Extended Data Figs. 2c and 3g), while food intake differences could not explain the lean phenotype associated with Fgr ablation for the HFD group (Fig. 3g and Extended Data Figs. 2d and 3g). Notably, Fgr deficiency caused both an increase in expired CO2 and consumed O2 volumes, resulting in similar respiratory quotient values and increased energy expenditure compared with their isogenic controls, regardless of diet type and NNT genotype (Fig. 3h–k and Extended Data Figs. 2e–g and 3h,i). Of note, only Fgr-NNT deficient mice had an increase in consumed O2 volumes, when normalized by lean body mass (Fig. 3h).
Fig. 3 |. Fgr-deficient mice are protected against HFD-induced obesity.
a, Weight gain of WT and FgrKO mice in the NNTWT or NNTKO background fed a HFD for 8 weeks (NNTWT background, n = 11; NNTKO background; n = 26); significance was assessed by linear regression. b, Magnetic resonance imaging showing body composition and quantification of lean and fat mass among the indicated genotypes (n = 3–5). Scale bars: 1 cm. c,d, Glucose levels in serum samples following a glucose tolerance test (GTT) (c) and an insulin tolerance test (ITT) (d) in mice fed a HFD for 10 weeks (NNTWT background, n = 8; NNTKO background, n = 20). Significance was assessed by two-way ANOVA and Tukey’s post hoc test; NS, not significant. e, Basal insulin (upper) and C-peptide (bottom) levels in WT and FgrKO mice in the NNTWT or NNTKO background that were fed a HFD for 8–10 weeks; significance was assessed by one-way ANOVA and Tukey’s post hoc test. f, Fold induction of insulin (upper) and C-peptide (bottom) compared to basal level after glucose injection (insulin release assay) in WT (solid circles) and FgrKO (open triangles) mice in the NNTWT or NNTKO background that were fed a HFD (insulin levels in d and e: NNTWT background, n = 7; NNTKO background, n ≥ 18; C-peptide levels, n = 7). g, Food (upper) and water (bottom) intake by mice assessed in metabolic cages for 48 h; significance was assessed by one-way ANOVA and Tukey’s post hoc test. h,i, Consumed O2 volume (VO2) normalized either by lean body mass (LBM; upper) or total body weight (lower; n = 6; h) and expired CO2 volume (VCO2) of mice in metabolic cages for 48 h (n = 6; i); significance was assessed by one-way ANOVA and Tukey’s post hoc test. j,k, Respiratory quotient (RQ) (j) and energy expenditure (EE) (k) measured in mice in metabolic cages for 48 h (n = 6); significance was assessed by one-way ANOVA and Tukey’s post hoc test; *, P < 0.05; **, P < 0.01; ***, P < 0.001; and ****, P < 0.0001. Each point represents a biological replicate. Data are shown as the mean ± s.e.m.
Fatty acid oxidation is increased in liver from mice lacking Fgr.
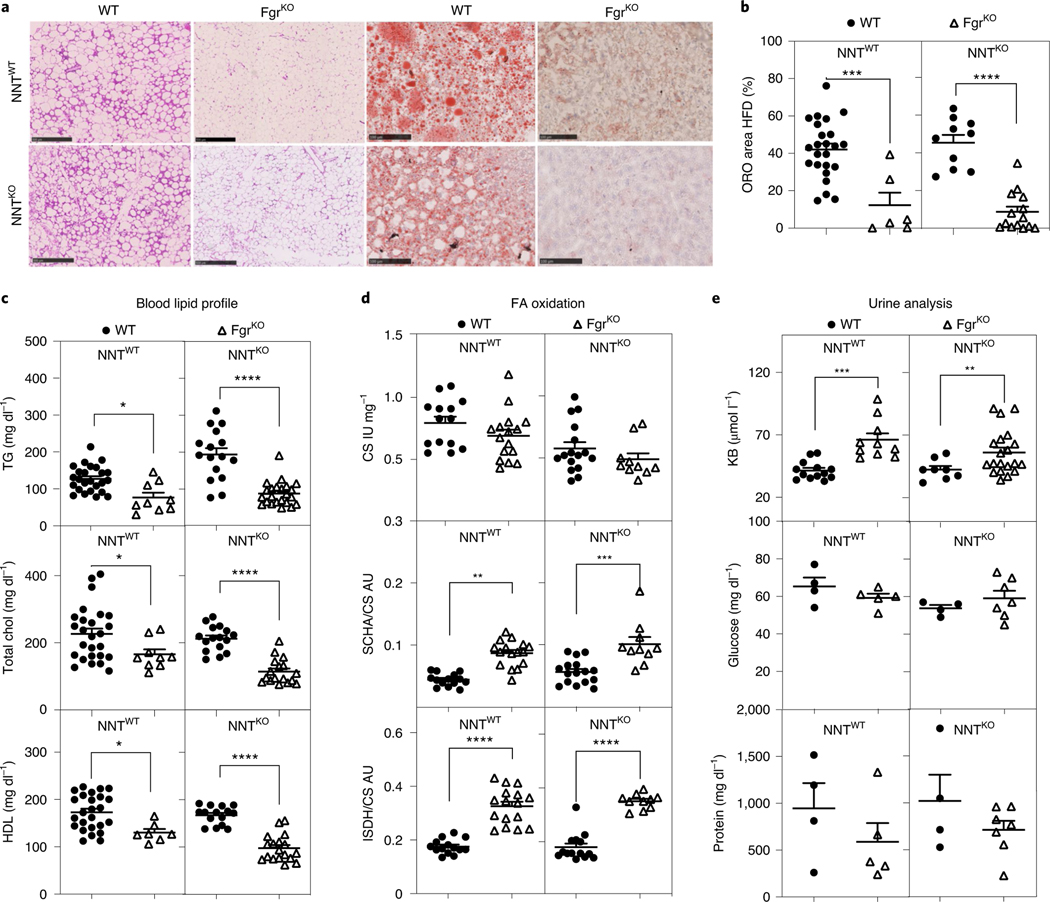
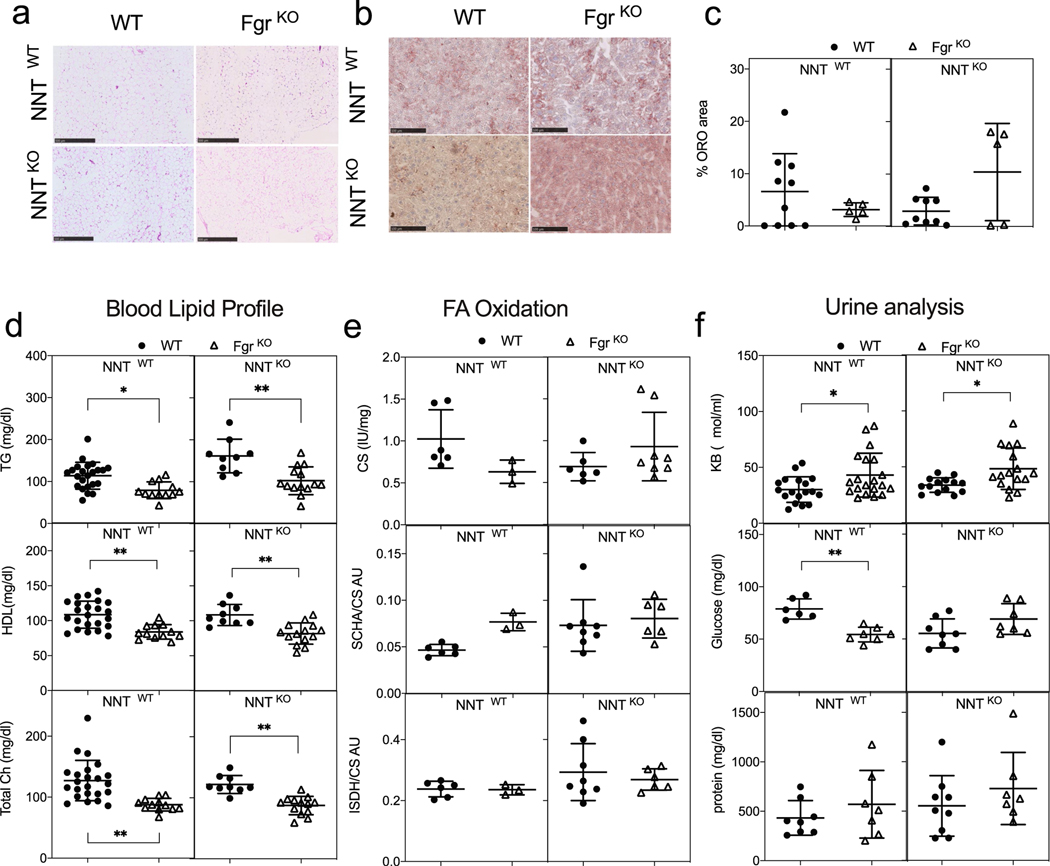
HFD feeding is associated with the development of WAT crown-like structures and liver steatosis—obesity hallmarks that were absent in mice lacking Fgr (Fig. 4a,b and Extended Data Fig. 4a,c). Interestingly, circulating triglycerides, total cholesterol and high density lipoprotein (HDL) cholesterol were reduced in Fgr-deficient mice compared with their isogenic controls when fed with a SD or HFD (Fig. 4c and Extended Data Fig. 4d). These results suggest that Fgr−/− mice eliminate the nutrient excess without promoting lipogenesis. Thus, while liver citrate synthase (CS) activity was unaffected by the lack of Fgr in the conditions analysed, liver fatty acid oxidation (FAO) was significantly higher in Fgr−/− mice fed with a HFD compared with WT mice (Fig. 4d and Extended Data Fig. 4e). Notably, the excess metabolites generated by increased FAO in Fgr-deficient mice were eliminated through the urine in the form of ketone bodies (Fig. 4e and Extended Data Fig. 4f). Collectively, these results suggest that mice lacking Fgr are hypermetabolic, since they do not switch their metabolism to storage upon similar food intake, but instead burning lipids that are excreted as ketone bodies26. In summary, Fgr ablation affects the metabolism of the adipose tissue and leads to reduced lipogenesis.
Fig. 4 |. Lack of Fgr prevents liver steatosis through increased FAO in a HFD.
a, Representative haematoxylin and eosin (H&E) staining of WAT paraffin sections of the indicated genotypes in a HFD (left); scale bars: 500 μm. Representative Oil red O (ORO) staining of OCT-embedded liver sections of the indicated genotypes in a HFD (right); scale bars: 100 μm. b, Quantification of ORO-positive stained area versus total liver area in OCT liver sections of the indicated genotypes in the HFD group (n = 6). c, Serum lipid profile for triglycerides (TG; upper), total cholesterol (Chol; middle) and HDL (bottom) in WT and FgrKO mice in the NNTWT or NNTKO background fed a HFD for 8 weeks (NNTWT background, n = 9; NNTKO background, n = 16). d, Enzymatic activities of citrate CS (upper), short chain 3-hydroxyacyl CoA dehydrogenase (SCHA) versus CS (middle) and isocitrate dehydrogenase (ISDH) versus CS (bottom) measured by spectrophotometry in the different mouse genotypes in HFD (n = 10); AU, arbitrary units. e, Ketone bodies (KB, upper), glucose (middle) and protein (bottom) concentration in urine in the indicated mouse genotypes in the HFD group (glucose and protein, n = 4; KB, n = 8). *, P < 0.05; **, P < 0.01; ***, P < 0.001; and ****, P < 0.0001; significance was assessed by one-way ANOVA test and Tukey’s post hoc test. Each point represents a biological replicate. Data are shown as the mean ± s.e.m.
Lack of Fgr in BM-derived cells protects from HFD-induced liver steatosis.
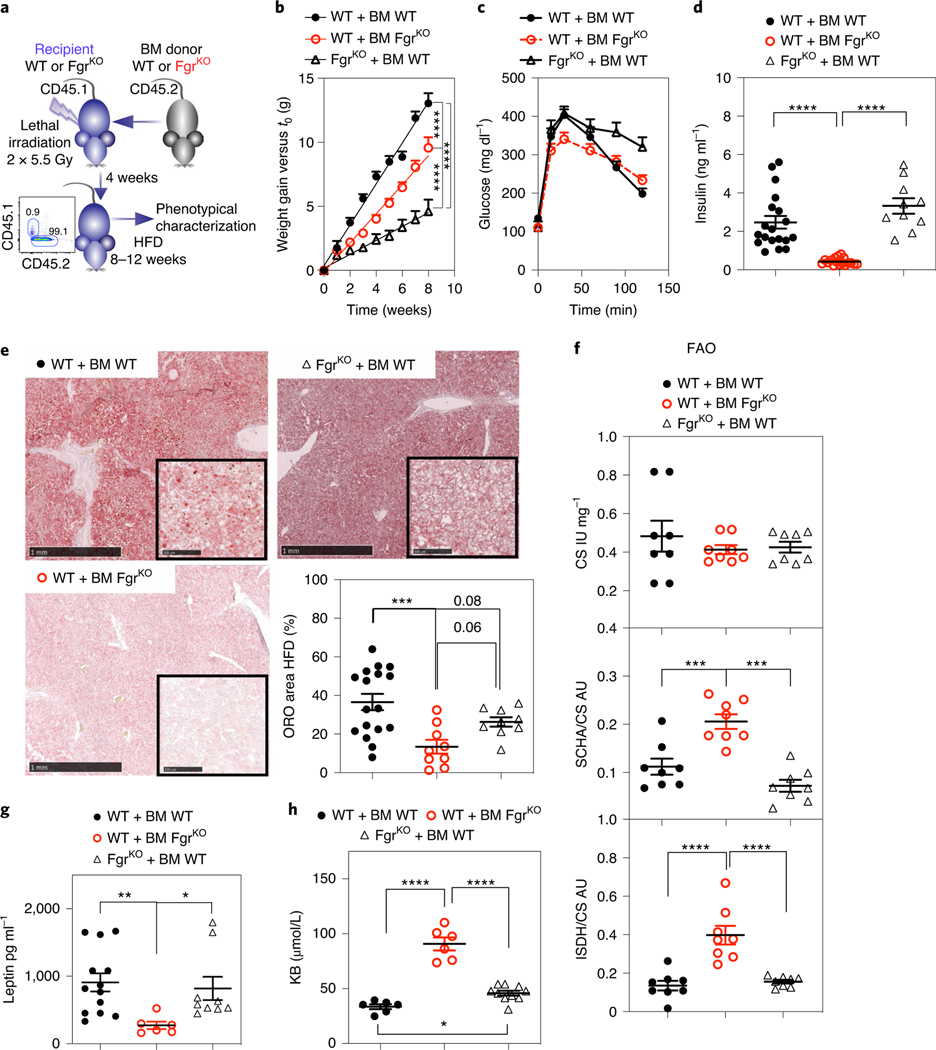
Fgr expression (https://www.immgen.org/databrowser/index.html/) is high in macrophages and monocytes, which infiltrate adipose tissue and polarize to proinflammatory M1-like macrophages during obesity27. Given our results above show that Fgr ablation precludes M1-like polarization and systemic deletion protects against HFD-induced obesity, we inquired whether this protection was associated with Fgr loss in BM-derived cells, in radiation-resistant cells or in both compartments. Following lethal irradiation (2 × 5.5 Gy) and transfer of Fgr−/− BM to WT hosts and completion of the reciprocal experiment (Fig. 5a), mice were fed with a HFD and weight and metabolic parameters were quantified. Lack of Fgr in BM was sufficient to reduce body weight, improve glucose tolerance, decrease insulin release and reduce liver steatosis (Fig. 5b–e and Extended Data Fig. 5a). In addition, WT hosts transferred with Fgr-deficient BM showed increased liver FAO activity and ketone body secretion in urine and reduced serum leptin compared with control WT hosts that were transferred with WT BM (Fig. 5f–h). Of note, the reciprocal BM transplantation (Fgr-deficient hosts grafted with WT BM) showed an effect of Fgr absence in the radiation-resistant compartment as a reduction of weight gain (Fig. 5b), but no effect was observed in glucose tolerance, insulin release, liver steatosis, liver FAO activity, serum leptin or ketone body secretion compared with WT hosts grafted with WT BM (Fig. 5c–h). Despite low weight and almost no weight gain in Fgr−/− mice transplanted with WT BM, the effect in steatosis and other readouts such as macrophage polarization markers in adipose tissue is clear, pointing to no correction of the metabolic phenotype. Our results suggest that Fgr deficiency inhibits M1-like polarization intrinsically (Fig. 2b), and it is known that fat macrophage infiltration controls steatosis and glucose metabolism28. Thus, the reduced M2/M1 balance in the Fgr−/− mice reconstituted with WT BM would result in reduced glucose tolerance and increased steatosis, even in conditions of limited weight gain. These results show that major metabolic hallmarks associated with glucose intolerance and liver FAO are linked to Fgr loss in BM-derived cells.
Fig. 5 |. Lack of Fgr in BM-derived cells protects from HFD-induced liver steatosis.
a, Schematic indicating the strategy for BM transplantation and HFD treatment, and representative histogram showing full reconstitution of CD45.1 host with CD45.2 donor BM. b, Weight gain over time in HFD-fed mice after BM transplantation of the indicated genotypes (n = 16). c, GTT of BM-transplanted mice as indicated in HFD (n = 9). d, Basal insulin levels in BM-transplanted mice as indicated for the HFD group (n = 10). e, Representative ORO staining of OCT liver sections of the indicated genotypes in HFD. Scale bars: 1 mm (low magnification view) and 100 μm (insets). Quantification of ORO-positive stained area versus total liver area in OCT liver sections of the indicated genotypes in the HFD group (n = 8, right bottom). f, Spectrophotometric enzymatic activities of CS (upper), SCHA versus CS (middle) and ISDH versus CS (bottom) in the different mouse genotypes in the HFD group (n = 8). g, Analysis of leptin levels in the serum of BM-transplanted mice as indicated in the HFD group (n ≥ 6). h, Analysis of ketone bodies (KB) in the urine of BM-transplanted mice as indicated in the HFD group (n ≥ 7). Significance was assessed by linear regression in b and one-way ANOVA with Sidak’s correction for multiple comparisons in d–h. *, P < 0.05; ***, P < 0.001; and ****, P < 0.0001. Each point represents a biological replicate. Data are shown as the mean ± s.e.m.
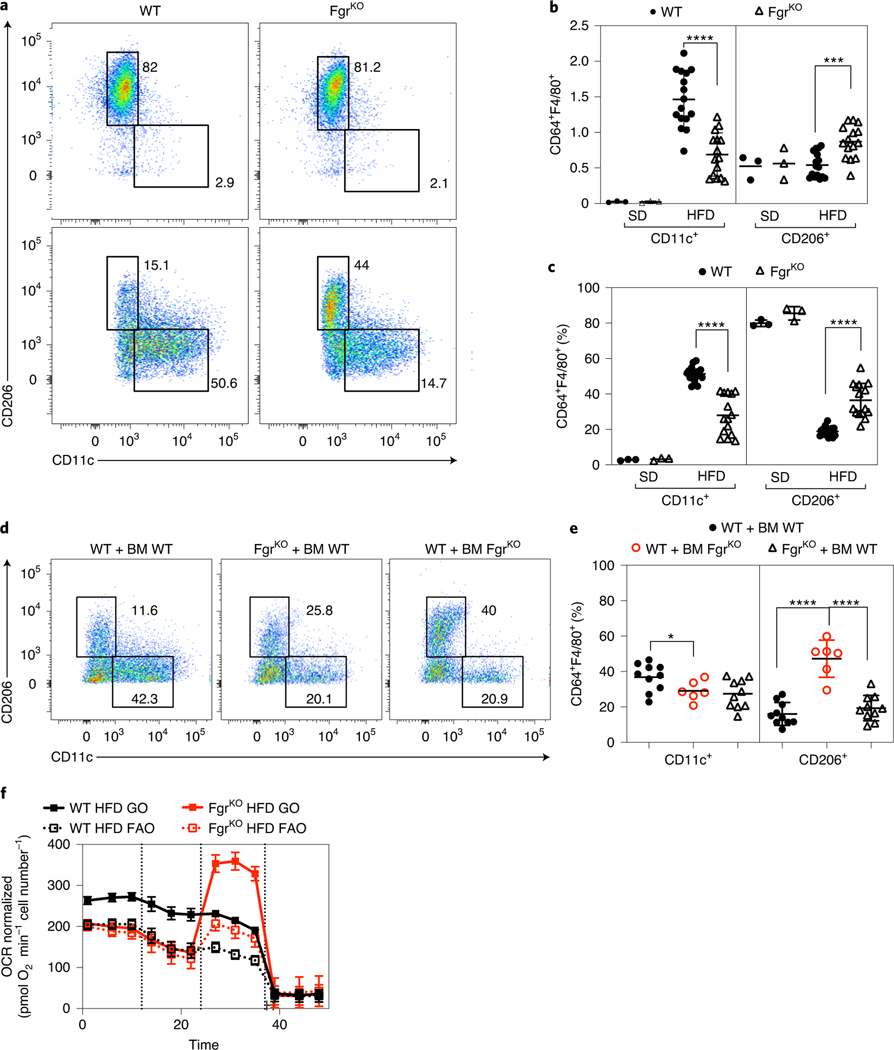
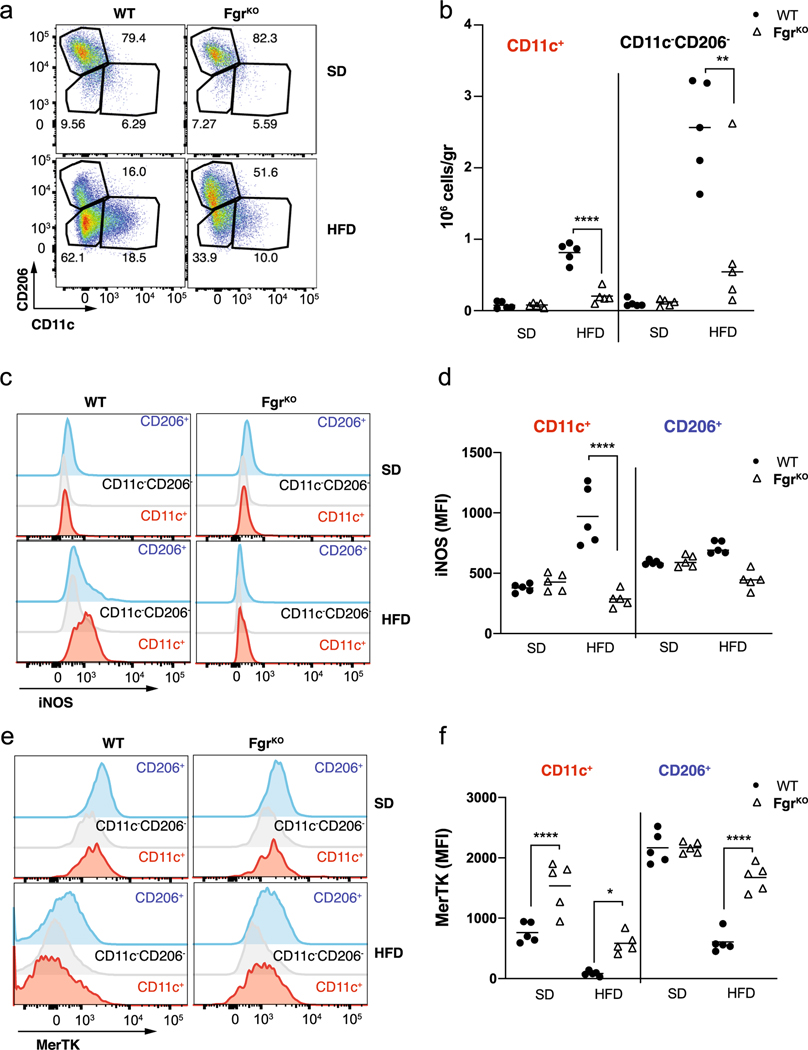
HFD-induced obesity is associated with adipose tissue inflammation that results from the cross-talk among adipocytes and infiltrating immune cells, which contributes to the development of insulin resistance29. We next studied macrophage recruitment and polarization in WAT in SD- or HFD-fed WT and Fgr-deficient mice. Fgr did not influence the relative proportion of M1 and M2 macrophages in the SD-fed mice. On the other hand, the HFD-induced increase in M1-like ATM (CD11c+) was less pronounced in Fgr-deficient mice, in both frequency and numbers (Fig. 6a–c and Extended Data Fig. 6a,b). Conversely, the frequency and numbers of M2-like ATM (CD206+) in the adipose tissue of WT mice were reduced following HFD feeding, but the frequency of CD206+ macrophages remained significantly higher in the full Fgr deficiency (Fig. 6a–c). We also found an Fgr-dependent increase in iNOS expression upon HFD feeding in CD11c+ ATM (Extended Data Fig. 6b,c). In contrast, MerTK, a hallmark receptor highly expressed by tissue-resident alternatively activated CD206+ ATM in the SD group, was downregulated upon HFD treatment, particularly in WT mice (Extended Data Fig. 6e,f). BM transplantation experiments, like those in Fig. 5a, showed that Fgr-deficient BM-derived monocytes preferentially differentiated into CD206+ M2 macrophages in the WAT of WT recipient mice (Fig. 6d–e), while WT BM-derived monocytes in Fgr−/− hosts showed reduced M1 polarization but lower M2 polarization, similarly to WT controls. In agreement with our previous study in which macrophages lacking Fgr showed impaired responses to bacterial infection7, lack of Fgr is thus associated with reduced proinflammatory M1-like macrophages and increased M2-like macrophages in the adipose tissue of HFD-fed mice. We have shown that the absence of Fgr blunts the adaptive mitochondrial metabolic switch in response to fuel and environment challenges9. Respirometry assays on WT ATM showed a flat response profile characteristic from M1-like proinflammatory macrophages30 driven by either glucose (GO) or palmitoyl-CoA (FAO; Fig. 6f and Extended Data Fig. 5b). Conversely, Fgr−/− WAT macrophages showed increased spare respiratory capacity in response to these substrates. This result suggests that lack of Fgr prevents HFD-induced metabolic adaptation responses of WAT macrophages.
Fig. 6 |. Loss of Fgr in immune cells prevents proinflammatory WAt macrophage infiltration.
a, Flow cytometry dot plots are representative of WAT-infiltrated CD11c+ (M1-like, left) and CD206+ (M2-like, right) macrophages (CD64+F4/80+) fed a SD or a HFD in WT and FgrKO mice. b,c, Analysis of the total amount (b) and percentage (c) of WAT-infiltrated CD11c+ and CD206+ macrophages in SD- and HFD-fed WT and FgrKO mice. d,e, Representative flow cytometry dot plots (d) and quantification (e) of WAT-infiltrated CD11c+ and CD206+ macrophages in BM-transplanted mice on a HFD. f, Analysis of OCR in WAT-infiltrated macrophages isolated from mice fed a HFD, using glucose oxidation (GO: glucose + pyruvate + glutamine) or FAO (FAO: palmitoyl-CoA + carnitine) as substrates in the assay medium (n = 3). OCR was normalized by cell number. Port injections are indicated. In c: SD, n = 3; HFD, n = 16. In e and f: n = 6. Significance was assessed using one-way ANOVA with Sidak’s correction for multiple comparisons (b, c and e). *, P < 0.05; **, P < 0.01; ***, P < 0.001; ****, P < 0.0001. Each point represents a biological replicate. Data are shown as the mean ± s.e.m.
ROS scavenging recapitulates Fgr ablation-induced phenotype.
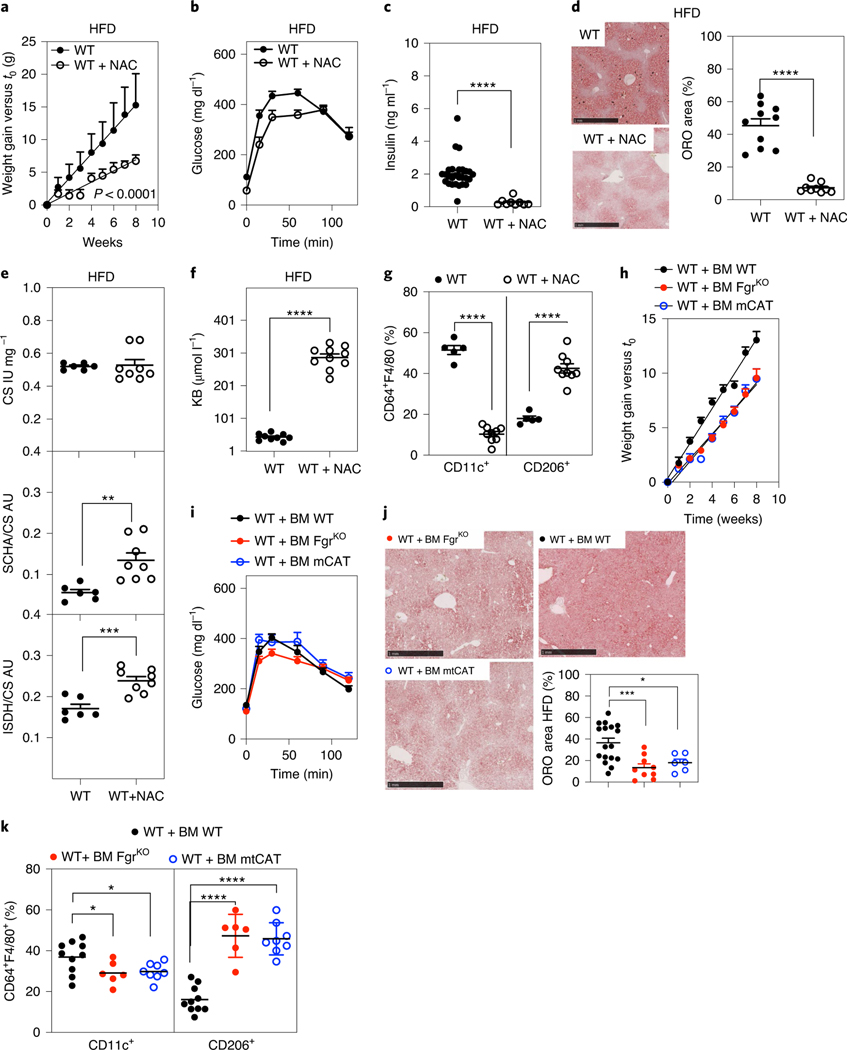
Since H2O2 is the main known signalling molecule that triggers Fgr activation9, we inquired if H2O2 signalling played any role in HFD-induced obesity. Supplementation of a HFD with the ROS scavenger NAC induced a metabolic phenotype similar to that caused by the ablation of Fgr in WT mice. This included lower weight gain, better glucose tolerance and reduced insulin levels (Fig. 7a–c and Extended Data Fig. 5c). Moreover, liver steatosis induced by a HFD was prevented following NAC treatment (Fig. 7d), with a concomitant elevation in liver FAO (Fig. 7e) and higher levels of ketone bodies in urine (Fig. 7f). Moreover, NAC increased the percentage of M2-like macrophages within WAT, whereas the proportion of M1-like macrophages was drastically decreased and the proportion of M2-like macrophages was augmented (Fig. 7g). These results show that general ROS scavenging phenocopies the protective effect of the depletion of the ROS-induced kinase Fgr.
Fig. 7 |. ROS scavenging in the immune cells recapitulates Fgr KO phenotype.
a, Weight gain over time in WT mice fed a HFD with and without NAC supplementation in the drinking water (n = 10). b,c, In vivo glucose metabolism measured by GTT (b) and basal insulin levels (c) in WT HFD-fed mice untreated or treated with NAC as indicated (n = 9). d, Representative ORO staining (left) and quantification of ORO-positive area versus total liver area (right) in OCT liver sections of the indicated treatments in the HFD group (n = 9). Scale bars: 1 mm. e, Enzymatic activities of CS (upper), SCHA versus CS (middle) and ISDH versus CS (bottom) of WT HFD-fed mice untreated or treated with NAC as indicated (n = 6). f, Ketone body analysis in the urine of WT mice in the indicated conditions (n = 9). g, Analysis of WAT-infiltrated CD11c+ and CD206+ macrophages (CD64+F4/80+) in WT mice under different conditions (n = 5). h–k, mCAT BM-grafted mice were analysed on a HFD. h, Weight gain (n = 9). i, Glucose levels in serum after GTT (n = 13). j, Representative ORO staining (scale bars: 1 mm) and quantification of positive-stained area versus total liver area in OCT liver sections (n = 6). Since mCAT BM-grafted mice were analysed on a HFD in the same experiment along with the indicated BM-grafted mice described above, the data in Fig. 5 are displayed for reference. k, Analysis of WAT-infiltrated CD11c+ and CD206+ in HFD treatment in the indicated BM-transplanted mice (n = 6). Significance was assessed using linear regression in a and h and a t-test in c–g. One-way ANOVA with Sidak’s correction for multiple comparisons was used in j and k. *, P < 0.05; ***, P < 0.001; and ****, P < 0.0001. Each point represents a biological replicate. Data are shown as the mean ± s.e.m.
To distinguish if the effect of ROS scavenging was specific for mitochondrial ROS, we took advantage of mice constitutively expressing catalase in the mitochondrial matrix31. BM transplantation of mice overexpressing catalase in the mitochondrial matrix (mtCAT) led to scavenging of H2O2 restricted to the mitochondria in BM-derived cells. Compared with WT mice grafted with WT BM, mCAT in BM-derived cells significantly reduced HFD-driven weight gain to the same extent as WT mice with Fgr-deficient BM (Fig. 7h and Extended Data Fig. 5d), without preventing glucose intolerance (Fig. 7i). Of note, expression of mCAT in BM-derived cells phenocopies the effect of Fgr absence in BM and is sufficient to reduce liver steatosis compared WT mice grafted with WT BM (Fig. 7j). Moreover, mCAT BM-grafted mice recapitulate the modulation of macrophage polarization found in Fgr constitutive ablation, BM restricted loss of Fgr or NAC-treated mice (Fig. 7k). In summary, these results suggest that the mitochondrial H2O2–Fgr axis is essential for the immune cell-mediated inflammatory response to a HFD, thus modulating the development of obesity.
Fgr correlation with M1 macrophage signatures and obesity in population-based approaches.
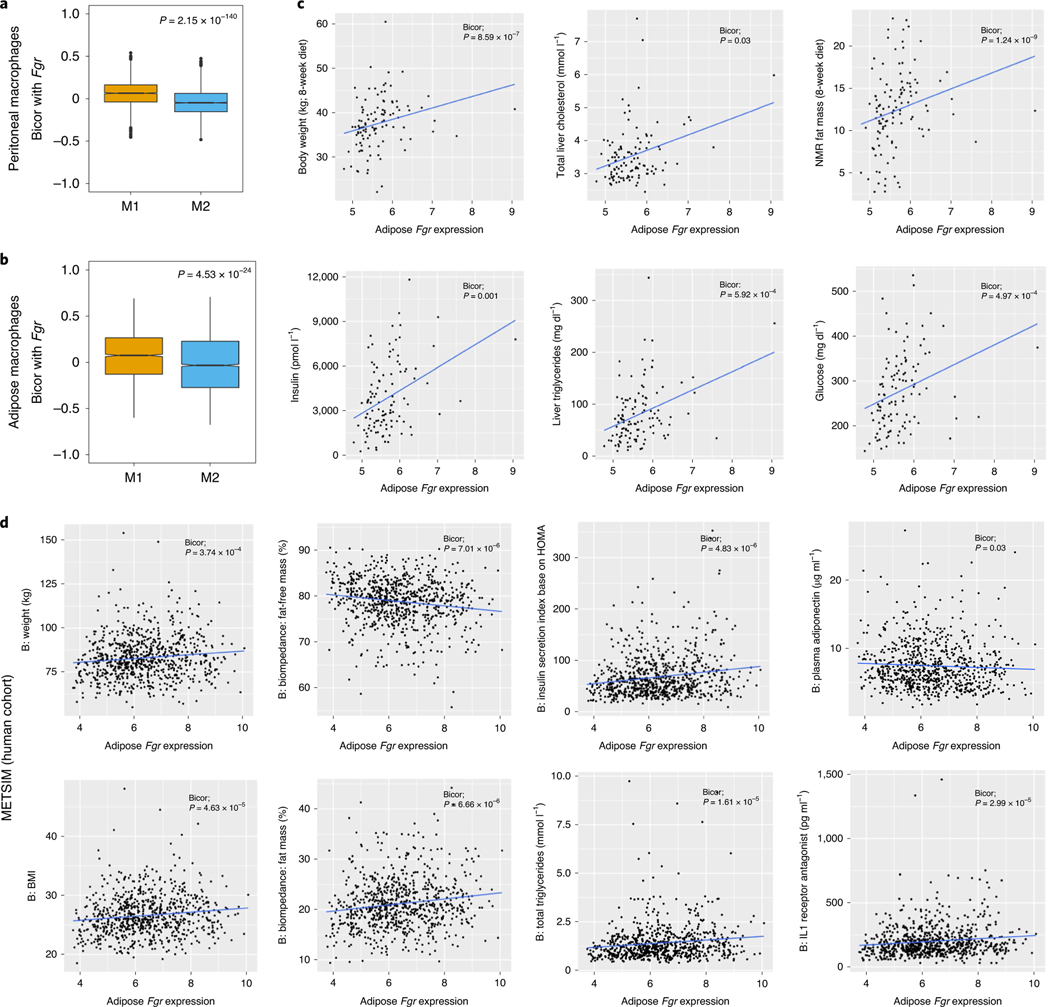
We previously identified macrophage gene signatures associated with M1 versus M2 macrophages using macrophages obtained from 92 diverse mouse population (hybrid mouse diversity panel; HMDP)32,33. Using this data, we observed that Fgr expression in these peritoneal macrophages was significantly enriched for M1 gene signatures in both peritoneal macrophages treated with LPS (Fig. 8a) and adipose tissue macrophages (Fig. 8b). Next, we inspected our HMDP mouse population to check for any strong gene-by-trait correlations between metabolically relevant clinical traits and adipose Fgr expression, which is mainly found in infiltrating macrophages, as adipocytes do not express Fgr. As shown in Fig. 8c, we observed that adipose Fgr expression shows significant positive correlation with traits related to obesity (body weight and fat mass), steatosis (liver triglyceride and cholesterol levels) and insulin resistance (fasting glucose and insulin levels). To test whether this association was relevant in humans, we analysed a human dataset of the Finnish population called the Metabolic Syndrome in Men (METSIM) study (n = ~10,000)34. We observed similar trends between adipose Fgr expression and metabolic traits in humans as well (Fig. 8d). Specifically, adipose Fgr expression showed a significant positive correlation with obesity-related traits, including body mass index (BMI), percentage fat mass and body weight. Taken together, our data support the idea that Fgr influences an inflammatory milieu via M1-type macrophage polarization, and this in turn leads to inflammation and obesity by rewiring adipose tissue metabolism.
Fig. 8 |. Fgr expression in obese mice and humans.
a,b, Biweight midcorrelation (bicor) comparing the expression of Fgr between peritoneal (a) or adipose (b) M1 and M2 macrophages. c, Analysis of Fgr expression evolution in the HMDP with respect to the indicated parameters. NMR, nuclear magnetic resonance. d, Analysis of Fgr expression evolution in the METSIM cohort with respect to the indicated obesity-related traits (BMI, percentage fat mass and body weight). HOMA, homeostasis model assessment.
Discussion
The decision of an organism to store or burn nutrients relies on correct sensing of the balance between energy demands and energy available as nutrients. The switch between anabolism and catabolism involves the integrated response of different organs. In particular, attention is growing around the role of immune cells in surveilling the organismal metabolism to orchestrate an integrated response. The cross-talk between immune cells and WAT reveals that the latter is not acting simply as a storage depository for nutrients but it is producing signals that modulate metabolism in surrounding cells and driving inflammation. Similarly, insulin resistance has been associated with ATM infiltration in WAT. Nutrient overload causes pathological expansion of the adipose tissue, resulting in tissue hypoxia, adipocyte cell death and oxidative and endoplasmic reticulum stress that may initiate insulin resistance and dysregulated secretion of adipokines, which promote ATM infiltration35. ATM production of proinflammatory cytokines and chemokines further aggravates insulin resistance and initiates inflammation in other tissues involved in glucose metabolism, thus contributing to metabolic syndrome1–3.
Here, we found that depletion of Fgr tyrosine kinase impairs proinflammatory macrophage polarization in vitro and in vivo. In particular, macrophage polarization induced by overnutrition in mice is prevented by Fgr whole-body ablation, which is associated with reduced obesity, prevention of liver steatosis and insulin resistance. Notably, Fgr ablation restricted to BM-derived cells is sufficient to prevent HFD-induced steatosis and to dampen the levels of insulin in WT grafted mice. Consistently, Fgr expression in BM reverts the protective phenotype in Fgr-deficient hosts. Moreover, preventing Fgr activation by scavenging mitochondrial H2O2 in BM-derived cells is sufficient to substantially mimic the metabolic phenotype caused by Fgr ablation. Our results demonstrate that proinflammatory polarization of macrophages in response to innate stimuli requires the activity of mitochondrial H2O2, Fgr kinase and complex II activity; they also showed that Fgr controls macrophage metabolism and their response to WAT-conditioned medium, and that Fgr-deficient mice are protected against HFD-induced obesity, insulin resistance and liver steatosis.
Thus, the metabolic shift required to induce the polarization of M1-like proinflammatory macrophages depends on the activation of complex II through Fgr-dependent phosphorylation upon activation by H2O2 (ref. 9). Fgr-deficient macrophages do not increase complex II activity early after exposure to a polarization stimulus and do not exhibit a switch from oxidation to glycolytic metabolism, as observed in their WT counterparts. Thus, the absence of Fgr causes an increase in FAO and impairs the accumulation of lipid droplets following exposure to pathogen-associated molecular patterns such as LPS, but also in response to WAT-conditioned medium.
Our data indicate that Fgr deficiency in mice increases energy expenditure and reduces liver steatosis while promoting the elimination of fat as ketone bodies. This increased lipolysis in the liver explains why, despite the intake of a high proportion of nutrients in the form of lipids, Fgr-deficient animals did not gain weight or become glucose intolerant and were protected against other HFD-induced obesity features. It is known that TLR4-mediated signalling and classical M1-like proinflammatory activation of macrophages is critical to induce WAT inflammation and obesity36. Our results showing that Fgr deficiency protects against HFD-induced obesity in mice is consistent with the implication of complex II tyrosine phosphorylation in glucose homeostasis in zebrafish37. The effect of Fgr in the regulation of macrophage polarization is connected with the HFD-associated phenotype.
Supporting this notion, Fgr-deficient BM transplantation in lethally irradiated WT mice was sufficient to recapitulate the phenotype of full Fgr deficiency, with reduced HFD-induced obesity, improved glucose tolerance and reduced liver steatosis. Consistent with this, expression of Fgr in BM cells reverted the majority of the protective effects in Fgr-deficient hosts, resulting in increased glucose intolerance and reduced FAO, but lower weight gain was retained. This result also suggests that radio-resistant Fgr-deficient M2 macrophages resident in WAT38, or other Fgr-deficient stromal cells, are able to induce an anti-inflammatory milieu that prevents weight gain. Notwithstanding, the absence of Fgr in BM-derived cells is associated with an anti-inflammatory M2-like phenotype (CD206+MerTKhiCD11c−) in WAT macrophages, which partly retained their mitochondrial respiratory function, similarly to our results obtained in vitro.
Since Fgr is a Src-type tyrosine kinase that is located both inside and outside mitochondria9, its effect may have mitochondrial and/or non-mitochondrial components. Our results showing that complex II activity regulates macrophage polarization connect with the potential role of Fgr in complex II phosphorylation and regulation by mitochondrial ROS. These results concur with the finding that the mitochondrial exclusive tyrosine phosphatase PTPMT1 controls complex II phosphorylation and, through this, glucose homeostasis in zebrafish37. Consistent with this notion, HFD-induced obesity in mice is prevented by enhancing ROS scavenging using NAC and more precisely by the overexpression of catalase exclusively in the mitochondria of BM-derived cells when adoptively transferred to lethally irradiated WT recipients. Since mito-catalase (mCAT) specifically eliminates H2O2 in the mitochondria, and H2O2 is the natural activator of the mitochondrial Fgr tyrosine kinase9, these results demonstrate that it is the mitochondrial effect of Fgr tyrosine kinase that drives the observed phenotype in obesity.
Low-grade inflammation in obesity is linked to an increase in the production of ROS. This oxidative stress can, in turn, trigger mitochondrial dysfunction and overwhelm the Krebs cycle and the mitochondrial respiratory chain, which leads to a positive feedback loop resulting in higher ROS formation. This increase in ROS production by the respiratory chain may also cause further oxidative stress, exacerbating the inflammatory process in obesity39. In contrast, increased ROS production, either by elevation of circulating succinate40 or by deletion of manganese superoxidase dismutase in adipose tissue41, has been shown to promote brown adipose tissue-induced thermogenesis dependent on UCP1. While these observations might seem contradictory in depicting the role of ROS in the diet-induced obesity phenotype, the ROS species generated, where they are generated and the mechanism for their generation, determine the signalling cascade by which ROS are acting42. More precisely, Fgr kinase is activated by H2O2, but not by superoxide; therefore, deletion of manganese superoxidase dismutase41 will necessarily involve a reduction in the levels of H2O2 in the mitochondrial matrix that would prevent the activation of Fgr, coherent with a protective effect in obesity. The phenomenon of succinate accumulation is dependent on specific uptake of extracellular succinate, a salient feature of brown fat adipocytes. In these cells, ROS is generated by a mechanism that depends on succinate oxidation but is independent of complexes I and III40. However, this phenomenon is described neither in WAT nor in macrophages. In this study, we have evaluated the role of ROS both in a systemic versus tissue-specific way. We have used a whole-body effect context by providing antioxidants (NAC) in the drinking water where we targeted ROS production everywhere in the body. In addition, we have targeted the expression of the antioxidant enzyme catalase to mitochondria and to the immune cells by using the mCAT mice and BM transplantation. With both approaches, we show a protective effect in a diet-induced obesity phenotype. Our data indicate that mitochondrial ROS-dependent activation of Fgr regulates complex II activation and is critical to induce a metabolic rewiring in macrophages that correlates with proinflammatory activation in vitro and during HFD-induced obesity in mice. Thus, we identify the mitochondrial ROS–Fgr–complex II axis as a potential target for the modulation of proinflammatory macrophage activation, which could alleviate the inflammation driving obesity and other detrimental processes.
Methods
Lead contact and materials availability.
Experimental procedures.
Further information and requests for resources and reagents should be directed to and will be fulfilled by José Antonio Enríquez. This study did not generate new unique reagents.
Method details.
Animal handling and procedures.
This study was designed to determine the role of Fgr in macrophages in diet-induced obesity. The study was designed for experimental groups of at least six mice per condition. In some cases, experimental sets were repeated under the same conditions but at different time of the year to exclude seasonal variations. Experimental groups were randomly assigned.
C57BL/6JOlaHsd were purchased from Harlan and B6SJL CD45.1 from Charles River. Fgr−/− mice, on the C57BL/6J (NNTKO) background, were a kind gift from C. Lowell43. Mice expressing mCAT were described previously31. To generate Fgr−/− mice in C57BL/6JOlaHsd (NNTWT), Fgr−/− (NNTKO) mice were crossed with C57BL/6JOlaHsd. B6.SJL CD45.1 mice were used for BM transplantation experiments as described previously44 using two irradiation doses of 5.5 Gy with a 4-h interval. Mice were bled 3 weeks after transplantation, and mononuclear cells were analysed for transplantation efficiency by flow cytometry for CD45.1 (recipient) and CD45.2 (BM donor). NAC (1% in drinking water) pretreatment was initiated 4 weeks before putting the mice on a HFD to ensure proper drinking adaptation before the study. All the mice used in this study were males. Mice were fed with chow (standard) or a HFD when they were 8–12 weeks old and monitored over 8–10 additional weeks before conducting metabolic studies and the end-of-experiment dissection. Additional information can be found in the Reporting Summary. The local ethics committee approved all animal studies. All animal procedures conformed to EU Directive 86/609/EEC and Recommendation 2007/526/EC regarding the protection of animals used for experimental and other scientific purposes, enforced in Spanish law under Real Decreto 1201/2005. Control and treated groups were assessed at the same time during experiments. Groups were randomly established, where control mice were housed with untreated mice. Mice were never segregated by treatment group.
Population-based investigation of Fgr.
Mouse population data were obtained from ~100 diverse inbred mouse strains fed either a SD (for peritoneal macrophages) or a HFD or high-sucrose diet (for metabolic traits) for 8 weeks as described previously32,33,45,46. Mouse peritoneal macrophages and adipose tissue gene expression were analysed with Affymetrix HT MG-430A arrays and correlated with the metabolically relevant clinical traits. Human adipose expression data analysed using Affymetrix U219 microarray and metabolically relevant clinical traits were obtained from the METSIM study34. Midweight bicorrelation coefficient (bicor) were computed for all possible pairwise comparisons between FGR expression and metabolic traits in both mouse and human data using the R package WGCNA47.
Differentiation, culture, stimulation and imaging of BMDMs.
Murine BMDMs were generated as previously described7. BM cells from Fgr−/− and WT C57BL/6J equivalent mice were cultured in RPMI 1640 supplemented with 20 ng ml−1 rM-CSF (Preprotech) and 10% FBS, 100 μg ml−1 penicillin, 100 μg ml−1 streptomycin, 10 mM HEPES, 1 nM sodium pyruvate and 50 mM 2-mercaptoethanol (all from Gibco) during 6 d in sterile, but not tissue-culture treated, 10-cm Petri dishes. Cells were further stimulated with 20 ng ml−1 Ultrapure LPS-EB (InvivoGen) and 50 ng ml−1 recombinant IFN-γ (BD), or different concentrations (1,000 to 1 μU) of xanthine oxidase and xanthine (100 μg ml−1; Sigma) with or without LPS, or different percentages (12.5%, 25% or 50%) of AT-CM generated as described previously20. Briefly, visceral fat from five mice that were fed a HFD for 8 weeks was collected, minced into 2–3 mm3 fragments and cultured in complete 10% FBS RPMI 1640 medium for 16 h. Later, explants were washed and reincubated in DMEM containing 0.1% FBS for an additional 24 h. The resulting AT-CM were collected and used immediately or stored at −80 °C until use. For visualization of neutral lipid bodies, macrophages were seeded in coverslips, stimulated as previously described, washed, fixed and stained with BODIPY 493/503 and Hoechst 33342 (Thermo Fisher, Invitrogen) for 30 min. Images were acquired on a Zeiss LSM700 with an ×40 objective (NA = 1.4).
BMDM image analysis.
Fluorescence images of lipid droplet (BODIPY 493/503) and nuclear (DAPI) staining in BMDMs were analysed using CellProfiler v2.2.0 (ref. 48). DAPI and BODIPY 493/503 foreground staining was recognized after background subtraction using a top-hat filter to yield nuclei and lipid droplet structures. Cell size was calculated based on a propagation algorithm recognition of median filtered cellular background BODIPY 493/503 staining using nuclei as seed areas. Lipid content was expressed as the percentage of cell area occupied by lipid droplets. Data from four independent experiments are expressed as the mean ± s.e.m.
Determination of mature IL-1β production.
For IL-1β determination, after 16 h of culture with the different stimuli, 5 mM ATP was added to cells 30 min before harvesting supernatants. IL-1β was quantified with a mouse IL-1β/IL-1F2 DuoSet ELISA (R&D Systems).
For treatment with metabolic inhibitors, 0.5 mM NPA, 0.10 mM dMM or 0.5 mM TTFA, 1 mM NAC or 2 μM mitoQ was added to the cells 30 min to 1 h before the challenge.
Isolation of adipose tissue immune cells and macrophage purification by magnetic beads.
Immune cells infiltrated in the adipose tissue were isolated as described previously49. Briefly, mice were perfused and epididymal WAT was harvested, minced and digested in DPBS supplemented with 0.5% BSA and 4 mg ml−1 type II collagenase. Isolated cells of the adipose stromal vascular fraction were counted and prepared for flow cytometry or for magnetic separation of macrophages. For that, cells were first incubated with biotinylated F4/80 and CD64, and Streptavidin-microbeads (Miltenyi Biotec) were used thereafter.
Flow cytometry.
Samples for flow cytometry were stained in ice-cold PBS supplemented with 2mM EDTA, 1% FCS and 0.2% sodium azide. Cells were preincubated for 10 min at 4 °C with anti-mouse CD16/CD32 (clone 2.4G2, Tonbo Bioscience) before staining with the appropriate antibody cocktails. Events were acquired using a FACS Canto or FACS Fortessa flow cytometer (Becton Dickinson), and data were analysed using FlowJo software (Tree Star; see Supplementary Fig. 1 for an example of the gating strategy). Anti-mouse antibodies to CD45 efluor 450, anti-mouse IL-1 beta pro-form PE, anti-mouse MERTK monoclonal antibody (DS5MMER) and Alexa Fluor 700 were purchased from eBioscience (Thermo Fisher). Anti-mouse CD64 PE, anti-mouse F4/80 Alexa Fluor 647/biotinylated and APC/Fire 750, anti-mouse CD11c and FITC anti-mouse CD206 PE were from BioLegend. Anti-mouse I-A/I-E (MHC II) FITC, anti-mouse CD40 APC, anti-mouse CD86 PE and anti-mouse iNOS/NOS Type II FITC were purchased from BD Biosciences. Macrophages in epididymal WAT were identified as CD45+CD64+F4/80+, and CD11c+ macrophages were considered as proinflammatory M1, while those expressing CD206 (Mannose Receptor) were considered as M2 macrophages. Additional information can be found in the Reporting Summary. The percentage of positive cells was calculated and indicated within dot plots. Each experiment contained a minimum of three biological replicates, and a minimum of three independent experiments were performed. Percentage and MFI data from sets of experiments are graphed as the mean ± s.e.m.
For identification of neutral lipids by FACs, live cells were washed with PBS and cultured in medium containing 800 ng ml−1 BODIPY 493/503 (Thermo Fisher, Invitrogen) for 60 min at 37 °C.
Liver mitochondria isolation.
Isolation of liver mitochondria was performed as previously described12.
Seahorse analysis in isolated mitochondria and intact cells.
Oxygen consumption in isolated mitochondria was performed as previously described12. Oxygen consumption in BMDMs and in WAT infiltrating macrophages (20,000 cells per well) was measured using the XF96 MitoStress Test (Seahorse Bioscience). Cells were washed and placed in assay medium containing either glucose oxidation substrates (10 mM glucose, 1 mM pyruvate and 2 mM glutamine) or FAO substrates (50 μM palmitoyl-CoA + 2 mM L-carnitine) for OCR recording traces. OCRs were normalized to cell number using CyQuant (Molecular Probes). Drug injection was conducted sequentially as follows: oligomycin (1 μM final); carbonyl cyanide 4-(trifluoromethoxy)phenylhydrazone (FCCP, 1 μM final) and antimycin A and rotenone (1 μM final, each).
Serum and urine analysis.
Blood samples were obtained from cardiac puncture. Serum was obtained after blood centrifugation at 1,000g for 10 min and then frozen at −80 °C. Serum biochemistry was determined with a Dimension RxL Max automated analyser the day after the extraction. Urine was collected from mice in the morning. Each urine sample represented a pool of three independent mice. Glucose and protein content were measured with a Dimension RxL Max automated analyser. Total ketone body content was assessed using Wako Diagnostics in vitro assay following the manufacturer’s instructions.
Glucose metabolism assessment.
Mice were fed a HFD (Research Diets; 60% kcal fat and 1.5% kcal cholesterol) for 8–10 weeks and weighed every week. For GTTs and ITTs, mice were fasted for 16 h or 2 h, respectively, with free access to water. For intraperitoneal GTT, the mice received glucose injections of 1 mg kg−1. For intraperitoneal ITT, the mice received insulin injections of 0.75 U kg−1. Mice were bled from a tail clip and blood glucose was measured with a handheld glucometer before injection (time 0) and at the indicated times after injection. For the insulin resistance (IR) test, mice were injected with 2 g kg−1 of glucose and blood was collected by submaxillary puncture at 0, 10 and 30 min after injection. Insulin (Millipore) and C-peptide (ALPCO) in serum were quantified using ELISA following the manufacturer’s instructions.
Metabolic cages.
EE, consumed O2 volume (VO2), expired CO2 volume (VCO2), respiratory exchange coefficient and food and water intake were quantified using the indirect calorimetry system (TSE LabMaster) for 2 d.
Histopathological staining.
Tissue samples were fixed in 4% paraformaldehyde (24 h), processed and embedded in paraffin. Sections (5 μm) were prepared and mounted on slides for staining with H&E or Masson’s trichrome. Alternatively, liver tissue samples were included in OCT compound (Tissue-Tek). Sections (8 μm) were stained with ORO (0.7% in propylene glycol) for lipid staining. For lipid content quantification, liver slides were digitalized and analysed with NDP.view2 viewing (Hamamatsu) as ORO-positive area versus the total area.
Mitochondrial isolation and function.
Mitochondria were isolated from mouse liver samples as described previously50. Activities of CS, complex II and FAO enzymes were measured in mitochondria isolated from mouse liver at 30 °C as described previously50. Succinate dehydrogenase activity (complex II activity) was measured at 600 nm (ε = 19.2 mM−1cm−1) in a mix containing buffer CI/CII (25 mM K2HPO4 (pH 7.2), 5 mM MgCl2, 3 mM KCN and 2.5 mg ml−1 BSA), 0.03 mM DCPIP (dichlorophenol indophenol), 10 mM succinate, 2 μg ml−1 antimycin A and 5 μM rotenone. CS activity was measured at 412 nm (ε = 13.6 mM−1cm−1) in a mix containing 10 mM Tris–HCl (pH 8), 0.023 mg ml−1 acetyl CoA, 0.1 mM DTNB (5,5-ditio-bis-2-nitrobenzoic acid), 0.25 mM oxaloacetate (OAA) and 0.1% Triton X-100. SCHA was measured at 340 nm (ε = 6.22 mM−1cm−1) in a mix containing 100 mM potassium phosphate, 50 mM MOPS buffer, 0.1 mM dithiothreitol, 0.1% (wt/vol) Triton X-100, 0.15 mM NADH (pH 6.16) and 50 μM acetoacetyl-CoA. Isocitrate dehydrogenase activity was measured at 340 nm (ε = 6.22 mM−1 cm−1) in a mix containing 0.2 M Tris–HCl (pH 8.5), 1 mM MgCl2, 0.25 mM isocitrate and 0.15 mM NADP.
Magnetic resonance imaging.
Whole-body and fat imaging of mice was performed by magnetic resonance scanner. Spectroscopy examinations of WAT were performed in vivo on a 7T preclinical system (Agilent Varian) equipped with a DD2 console and an active shielded 205/120 gradient insert coil with 130 mT/m maximum strength. Double-tuned circular transmit/receive coils were used for phosphorus/proton (20 mm) and placed over the epididymal fat and BAT (Rapid Biomedical). Images were analysed with Image J software.
Statistical analysis.
Comparisons between groups were made by one-way or two-way ANOVA. Post hoc correction for multiple comparisons was made using Tukey’s or Sidak’s tests when appropriate. Pairwise comparisons were made by two-sided Student t-tests. Differences were considered statistically significant at P < 0.05. In the figures, asterisks denote statistical significance (*, P < 0.05; **, P < 0.01; ***, P < 0.001; and ****, P < 0.0001). Data were analysed with GraphPad Prism 7. In the figures, each point represents a biological replicate and, if no other indication is made, data are expressed as the mean ± s.e.m.
Reporting Summary.
Further information on research design is available in the Nature Research Reporting Summary linked to this article.
Data availability
The data that support the findings of this study are available from the corresponding author upon request. Accession codes to public repositories are GSE64770 for HMDP HF/HS adipose tissue, GSE38705 for HMDP macrophages and GSE70353 for human METSIM study. HMDP and METSIM data are also available at https://systems.genetics.ucla.edu/. Source data are provided with this paper.
Extended Data
Extended Data Fig. 1 |. Activation of Fgr is necessary for M1-like macrophage polarization.
a, BMDM from WT and FgrKO mice untreated or treated with LPS + IFNγ were analyzed by flow cytometry for NO2, IL12p40, TNFα, CD86 and CD40 (n = 6). b-c, Measure of H2O2 (b) and superoxide (c) in WT BMDM treated under the conditions indicated (n = 11). d, Pyruvate-malate and (e) succinate driven respiration in isolated liver mitochondria in the indicated treatments (n = 6). f, Maximal respiratory capacity of mitochondrial complex I, II and IV in isolated liver mitochondria in the indicated treatments (n = 6). g, BMDM from WT and FgrKO mice untreated or treated with xanthine/xanthine oxidase (X/XO), LPS, the combination of both or adipose conditioned media (AT) were analyzed by flow cytometry for NOS2, MHC-II, NOS2 and CD86. WT, n = 6 for all conditions but 33% AT where n = 3, FgrKO, n = 3. Representative unnormalized seahorse profile of oxygen consumption of BMDM from WT and FgrKO mice treated with LPS+ IFNγ for 16 h (overnight, o/n, h) or 4 h (i) (n = 7 for untreated or n = 4 for treated). Representative unnormalized oxygen consumption analysis of IFNγ primed (pIFNγ) BMDM from WT (left panels) and FgrKO (right panels) treated with (j) LPS, (k) LPS plus NPA and (l) LPS plus NAC at the start of the SeaHorse assay (n = 3). m, Complex II immunocapture and phosphorylation analysis by western blot of SDHA in WT BMDM untreated or treated with LPS+ IFNγ for 4hrs. (a,g) *, P <0.05; **, P <0.01; ***, P <0.001; ****, P <0.0001. 2-way ANOVA and Tukey post-hoc test was used. Each point represents a biological replicate. Data are the mean ± SEM.
Extended Data Fig. 2 |. Fgr-deficient mice are protected against high fat diet induced obesity.
a, Absolute weight of WT and Fgr KO mice in NNT WT or KO background fed in high fat diet (HFD) for 8 weeks (in NNTWT background, n = 11; in NNTKO background n = 26). b, Insulin (upper panel) and c-peptide (bottom panel) levels after glucose injection (insulin release assay) in WT (solid circles) and FgrKO (open triangles) mice in NNTWT or NNTKO background fed high fat diet. (In b for insulin levels: in NNT WT background, n = 7; in NNTKO background n≥18: for c-peptide levels, n = 7). c-d, Water (c) and food (d) intake by mice assessed in metabolic cages for 48 hours. e, O2 consumption (VO2), (f) CO2 production (VCO2), and (g) energy expenditure (EE) measured in mice in metabolic cages for 48 hours (n = 6). Each point represents a biological replicate. Data are the mean ± SEM.
Extended Data Fig. 3 |. Fgr-deficient mice have normal glucose metabolism in standard diet.
a, Weight gain (left panel) and absolute weight (right panel) of WT and Fgr KO mice in NNT WT or KO background fed in standard diet (SD) for 8 weeks (in NNT WT background, n≥12; in NNT KO background n≥8). b-c, Glucose (GTT, b) and insulin tolerance test (ITT, c) in mice fed in SD for 10 weeks (in NNT WT background, n≥14; in NNT KO background n≥8). d, Basal insulin (upper panel) and c-peptide (bottom panel) levels in WT and FgrKO mice in NNTWT or NNTKO background fed HFD for 8–10 weeks. e-f, Fold induction (e) and absolute levels (f) of insulin (upper panel) and c-peptide (bottom panel) amount compared to basal level after glucose injection (insulin release assay) in WT (solid circles) and FgrKO (open triangles) mice in NNTWT or NNTKO background fed high fat diet. (In e-f for insulin levels: in NNT WT background, n≥12; in NNT KO background n≥13: for c-peptide levels, n≥7). g-i, Food and water intake (g), O2 consumption (VO2) and CO2 production (VCO2) (h), and respiratory quotient (RQ) and energy expenditure (EE) (i) measured in mice in SD after being in metabolic cage analysis for 48 hours. g-i, Top panels represent values normalized by body weight. Bottom panels represent values unnormalized (n≥7). Signification assessed by unpaired t-test. *, P <0.05; **, P <0.01; ***, P <0.001; ****, P <0.0001. Each point represents a biological replicate. Data are the mean ± SEM.
Extended Data Fig. 4 |. Lipid profile and liver fatty acid oxidation is normal in mice lacking Fgr.
a, Representative H&E staining of WAT paraffin sections of the indicated genotypes in SD. Scale bars corresponds to 500 μm. b, Representative ORO staining of OCT liver sections of the indicated genotypes in SD. Scale bars corresponds to 100 μm. c, Quantification of ORO staining performed as in b). d, Serum lipid profile for triglycerides (upper panel), HDL (middle panel) and total cholesterol (bottom panel) in WT and Fgr KO mice in NNT WT or KO background fed in SD for 8 weeks (in NNT WT background, n≥12; in NNT KO background n≥9). e, Enzymatic activities of citrate synthase (CS, upper panel), short chain 3-hydroxyacyl CoA dehydrogenase (SCHA) versus CS (middle panel) and isocitrate dehydrogenase (ISDH) versus CS (bottom panel) in the different mouse genotypes in SD measured by spectrophotometry (n≥10). f, Ketone bodies (KB, upper panel), Glucose (middle panel), and protein (bottom panel) concentration in urine in the indicated mouse genotypes in SD (for glucose and protein, n≥8, for KB, n≥14). Signification assessed by t-test *, P <0.05; **, P <0.01; ***; P <0.001. Each point represents a biological replicate. Data are the mean ± SEM.
Extended Data Fig. 5 |. BM transplantation weight under high fat diet.
a, Weight over time in mice under high fat diet after BM transplantation of the indicated genotypes (n = 16). b, Analysis of OCR non normalized by cell counts in WAT infiltrated macrophages isolated from mice fed high fat diet, using glucose oxidation (GO: glucose plus pyruvate plus glutamine) or fatty acid oxidation or (FAO: palmitoyl-CoA + carnitine) as substrates in the assay media (n = 3). c, Weight over time in WT mice under high fat diet with and without NAC supplementation in the drinking water (n = 10). d, Weight over time in mito-catalase (mCAT) BM grafted mice under high fat diet (n = 9). One-way ANOVA with Sidak correction for multiple comparisons. *, P <0.05; **, P <0.01; ***, P <0.001; ****, P <0.0001. Each point represents a biological replicate. Data are the mean ± SEM.
Extended Data Fig. 6 |. Loss of Fgr prevents proinflammatory WAt macrophage infiltration induced by HFD.
a, Representative flow cytometry dot plots of WAT-infiltrated CD11c+ (M1-like, left panel), CD206+ (M2-like) and inflammatory double negative (right panel) macrophages form WT and Fgr-deficient (NNTKO in both cases) mice fed with standard diet (SD) or high-fat diet (HFD). b, Analysis of total amount of WAT-infiltrated inflammatory CD11c+ and double negative macrophages on HFD fed mice in WT and FgrKO mice. c, d, Representative flow cytometry histograms (c) and quantification (d) of iNOS expression in the indicated ATM populations. e, f, Representative flow cytometry histograms (c) and quantification (d) of MerTK expression in the indicated ATM populations. One-way ANOVA with Sidak correction for multiple comparisons. **, P <0.01; ****, P <0.0001. Each point represents a biological replicate. Data are the mean ± SEM.
Supplementary Material
Acknowledgements
We thank C. Lowell for the kind gift of the Fgr−/− mice; M. Murphy for the kind gift of MitoQ; M. Cueva and R. Álvarez for mouse work; A. Molina-Iracheta and R. Doohan for histology; and A.J. Brownstein, A. Divakaruni and A. Jones for macrophage work. We thank the individuals who participated in the METSIM study. The METSIM study was supported by grants from the Academy of Finland (no. 321428), Sigrid Juselius Foundation, Finnish Foundation for Cardiovascular Research, Centre of Excellence of Cardiovascular and Metabolic Diseases and the Academy of Finland (to M.L.). Work in the laboratory of J.A.E. is funded by the CNIC and a grant by Ministerio de Ciencia, Innovación e Universidades (MICINN), Agencia Estatal de Investigación (AEI) and Fondo Europeo de Desarrollo Regional (FEDER; SAF2015-65633-R and RTI2018-099357-B-I00), the EU (UE0/MCA317433), the Biomedical Research Networking Center on Frailty and Healthy Ageing (CIBERFES-ISCiii) and the HFSP agency (RGP0016/2018). Work in the laboratory of D.S. is funded by the CNIC; the European Research Council (ERC-2016-Consolidator Grant 725091); the European Commission (635122-PROCROP H2020); MICINN, AEI and FEDER (SAF2016-79040-R and PID2019-108157RB); Comunidad de Madrid (B2017/BMD-3733 Immunothercan-CM); FIS-Instituto de Salud Carlos III, MICINN and FEDER (RD16/0015/0018-REEM); the Acteria Foundation; Atresmedia (Constantes y Vitales prize); and Fundació La Marató de TV3 (201723). Work in the laboratory of O.S.S. is funded by National Institutes of Health (NIH; R01 DK099618-05, R01 CA232056-01, R21AG060456-01 and R21 AG063373-01) and the American Diabetes Association (1-19-IBS-049). Work in laboratory of A.J.L. was supported by NIH-PO1HL028481 and NIH-R01DK117850 (A.J.L.). Work in the laboratory of M.L. was funded by the Academy of Finland. Work in the laboratory of J.P.B. was funded by Spanish Ministry of Science, Innovation and Universities (MCINU/FEDER; grants SAF2016-78114-R and RED2018-102576-T), Instituto de Salud Carlos III (CB16/10/00282), Junta de Castilla y León (Escalera de Excelencia CLU-2017-03), Ayudas Equipos Investigación Biomedicina 2017 Fundación BBVA and Fundación Ramón Areces. The CNIC is supported by the Instituto de Salud Carlos III (ISCIII), MICINN and the Pro CNIC Foundation and is a Severo Ochoa Center of Excellence (SEV-2015-0505). K.C.K. is funded by NIH-K99 DK120875 and AHA Fellowship 18POST33990256. S.I. is funded by RYC-2016-19463 and RTI2018-094484-B-I00. The funders had no role in the study design, data collection and interpretation, nor the decision to submit the work for publication.
Footnotes
Competing interests
The authors declare no competing interests.
Additional information
Extended data is available for this paper at https://doi.org/10.1038/s42255-020-00273-8.
Supplementary information is available for this paper at https://doi.org/10.1038/s42255-020-00273-8.
Peer review information Primary Handling Editor: George Caputa.
References
- 1.Xu H. et al. Chronic inflammation in fat plays a crucial role in the development of obesity-related insulin resistance. J. Clin. Invest 112, 1821–1830 (2003). [DOI] [PMC free article] [PubMed] [Google Scholar]
- 2.Weisberg SP et al. Obesity is associated with macrophage accumulation in adipose tissue. J. Clin. Invest 112, 1796–1808 (2003). [DOI] [PMC free article] [PubMed] [Google Scholar]
- 3.Osborn O. & Olefsky JM The cellular and signaling networks linking the immune system and metabolism in disease. Nat. Med 18, 363–374 (2012). [DOI] [PubMed] [Google Scholar]
- 4.Virtue S. & Vidal-Puig A. It’s not how fat you are, it’s what you do with it that counts. PLoS Biol. 6, e237 (2008). [DOI] [PMC free article] [PubMed] [Google Scholar]
- 5.Curat CA et al. From blood monocytes to adipose tissue-resident macrophages: induction of diapedesis by human mature adipocytes. Diabetes 53, 1285–1292 (2004). [DOI] [PubMed] [Google Scholar]
- 6.McArdle MA, Finucane OM, Connaughton RM, McMorrow AM & Roche HM Mechanisms of obesity-induced inflammation and insulin resistance: insights into the emerging role of nutritional strategies. Front. Endocrinol 4, 52 (2013). [DOI] [PMC free article] [PubMed] [Google Scholar]
- 7.Garaude J. et al. Mitochondrial respiratory-chain adaptations in macrophages contribute to antibacterial host defense. Nat. Immunol 17, 1037–1045 (2016). [DOI] [PMC free article] [PubMed] [Google Scholar]
- 8.Guarás A. et al. The CoQH2/CoQ ratio serves as a sensor of respiratory chain efficiency. Cell Rep. 15, 197–209 (2016). [DOI] [PubMed] [Google Scholar]
- 9.Acin-Peréz R. et al. ROS-triggered phosphorylation of complex II by Fgr kinase regulates cellular adaptation to fuel use. Cell Metab. 19, 1020–1033 (2014). [DOI] [PMC free article] [PubMed] [Google Scholar]
- 10.Enríquez JA Supramolecular organization of respiratory complexes. Annu. Rev. Physiol 78, 1–29 (2016). [DOI] [PubMed] [Google Scholar]
- 11.Mills EL et al. Succinate dehydrogenase supports metabolic repurposing of mitochondria to drive inflammatory macrophages. Cell 167, 457–470 (2016). [DOI] [PMC free article] [PubMed] [Google Scholar]
- 12.Acin-Perez R. et al. A novel approach to measure mitochondrial respiration in previously frozen biological samples. EMBO J. 39, e104073 (2020). [DOI] [PMC free article] [PubMed] [Google Scholar]
- 13.Wang F. et al. Interferon gamma induces reversible metabolic reprogramming of M1 macrophages to sustain cell viability and pro-inflammatory activity. EBioMedicine 30, 303–316 (2018). [DOI] [PMC free article] [PubMed] [Google Scholar]
- 14.Lauterbach MA et al. Toll-like receptor signaling rewires macrophage metabolism and promotes histone acetylation via ATP-citrate lyase. Immunity 51, 997–1011 (2019). [DOI] [PubMed] [Google Scholar]
- 15.Ghazarian M, Luck H, Revelo XS, Winer S. & Winer DA Immunopathology of adipose tissue during metabolic syndrome. Türk. Patoloji. Derg 31, 172–180 (2015). [DOI] [PubMed] [Google Scholar]
- 16.Aouadi M. et al. Lipid storage by adipose tissue macrophages regulates systemic glucose tolerance. Am. J. Physiol. Endocrinol. Metab 307, E374–E383 (2014). [DOI] [PMC free article] [PubMed] [Google Scholar]
- 17.Prieur X. et al. Differential lipid partitioning between adipocytes and tissue macrophages modulates macrophage lipotoxicity and M2/M1 polarization in obese mice. Diabetes 60, 797–809 (2011). [DOI] [PMC free article] [PubMed] [Google Scholar]
- 18.Kosteli A. et al. Weight loss and lipolysis promote a dynamic immune response in murine adipose tissue. J. Clin. Invest 120, 3466–3479 (2010). [DOI] [PMC free article] [PubMed] [Google Scholar]
- 19.Jaitin DA et al. Lipid-associated macrophages control metabolic homeostasis in a Trem2-dependent manner. Cell 178, 686–698 (2019). [DOI] [PMC free article] [PubMed] [Google Scholar]
- 20.Bechor S. et al. Adipose tissue conditioned media support macrophage lipid-droplet biogenesis by interfering with autophagic flux. Biochim. Biophys. Acta Mol. Cell Biol. Lipids 1862, 1001–1012 (2017). [DOI] [PubMed] [Google Scholar]
- 21.Huang Y. et al. Toll-like receptor agonists promote prolonged triglyceride storage in macrophages. J. Biol. Chem 289, 3001–3012 (2013). [DOI] [PMC free article] [PubMed] [Google Scholar]
- 22.Huang SC-C et al. Cell-intrinsic lysosomal lipolysis is essential for alternative activation of macrophages. Nat. Immunol 15, 846–855 (2014). [DOI] [PMC free article] [PubMed] [Google Scholar]
- 23.Castoldi A. et al. Triacylglycerol synthesis enhances macrophage inflammatory function. Nat. Commun 11, 4107 (2020). [DOI] [PMC free article] [PubMed] [Google Scholar]
- 24.Russo L. & Lumeng CN Properties and functions of adipose tissue macrophages in obesity. Immunology 155, 407–417 (2018). [DOI] [PMC free article] [PubMed] [Google Scholar]
- 25.Navarro CDC et al. Redox imbalance due to the loss of mitochondrial NAD(P)-transhydrogenase markedly aggravates high fat diet-induced fatty liver disease in mice. Free Radic. Biol. Med 113, 190–202 (2017). [DOI] [PubMed] [Google Scholar]
- 26.Joo N-S et al. Ketonuria after fasting may be related to the metabolic superiority. J. Korean Med. Sci 25, 1771–1776 (2010). [DOI] [PMC free article] [PubMed] [Google Scholar]
- 27.Covarrubias AJ, Aksoylar HI & Horng T. Control of macrophage metabolism and activation by mTOR and Akt signaling. Semin. Immunol 27, 286–296 (2015). [DOI] [PMC free article] [PubMed] [Google Scholar]
- 28.Klöting N. et al. Insulin-sensitive obesity. Am. J. Physiol. Endocrinol. Metab 299, E506–E515 (2010). [DOI] [PubMed] [Google Scholar]
- 29.Sell H, Habich C. & Eckel J. Adaptive immunity in obesity and insulin resistance. Nat. Rev. Endocrinol 8, 709–716 (2012). [DOI] [PubMed] [Google Scholar]
- 30.Jha AK et al. Network integration of parallel metabolic and transcriptional data reveals metabolic modules that regulate macrophage polarization. Immunity 42, 419–430 (2015). [DOI] [PubMed] [Google Scholar]
- 31.Vicente-Gutierrez C, Bonora N, Bobo-Jimenez V, Josephine C. & Almeida A. Astrocytic mitochondrial ROS modulate brain metabolism and mouse behaviour. Nat. Metab 1, 201–211 (2019). [DOI] [PubMed] [Google Scholar]
- 32.Buscher K. et al. Natural variation of macrophage activation as disease-relevant phenotype predictive of inflammation and cancer survival. Nat. Commun 8, 16041 (2017). [DOI] [PMC free article] [PubMed] [Google Scholar]
- 33.Orozco LD et al. Unraveling inflammatory responses using systems genetics and gene-environment interactions in macrophages. Cell 151, 658–670 (2012). [DOI] [PMC free article] [PubMed] [Google Scholar]
- 34.Laakso M. et al. The Metabolic Syndrome in Men study: a resource for studies of metabolic and cardiovascular diseases. J. Lipid Res 58, 481–493 (2017). [DOI] [PMC free article] [PubMed] [Google Scholar]
- 35.Lee CH & Lam KSL Obesity-induced insulin resistance and macrophage infiltration of the adipose tissue: a vicious cycle. J. Diabetes Invest 10, 29–31 (2018). [DOI] [PMC free article] [PubMed] [Google Scholar]
- 36.Orr JS et al. Toll-like receptor 4 deficiency promotes the alternative activation of adipose tissue macrophages. Diabetes 61, 2718–2727 (2012). [DOI] [PMC free article] [PubMed] [Google Scholar]
- 37.Nath AK et al. PTPMT1 inhibition lowers glucose through succinate dehydrogenase phosphorylation. Cell Rep. 10, 694–701 (2015). [DOI] [PMC free article] [PubMed] [Google Scholar]
- 38.Waqas SFH et al. Adipose tissue macrophages develop from bone marrow-independent progenitors in Xenopus laevis and mouse. J. Leukoc. Biol 102, 845–855 (2017). [DOI] [PMC free article] [PubMed] [Google Scholar]
- 39.Mello AH, de, Costa AB, Engel JDG & Rezin GT. Mitochondrial dysfunction in obesity. Life Sci. 192, 26–32 (2018). [DOI] [PubMed] [Google Scholar]
- 40.Mills EL et al. Accumulation of succinate controls activation of adipose tissue thermogenesis. Nature 560, 102–106 (2018). [DOI] [PMC free article] [PubMed] [Google Scholar]
- 41.Han YH et al. Adipocyte-specific deletion of manganese superoxide dismutase protects from diet-induced obesity through increased mitochondrial uncoupling and biogenesis. Diabetes 65, 2639–2651 (2016). [DOI] [PMC free article] [PubMed] [Google Scholar]
- 42.Scialò F. et al. Mitochondrial ROS produced via reverse electron transport extend animal lifespan. Cell Metab. 23, 725–734 (2016). [DOI] [PMC free article] [PubMed] [Google Scholar]
- 43.Lowell CA, Soriano P. & Varmus HE Functional overlap in the Src gene family: inactivation of Hck and Fgr impairs natural immunity. Gene Dev. 8, 387–398 (1994). [DOI] [PubMed] [Google Scholar]
- 44.Cui Y-Z et al. Optimal protocol for total body irradiation for allogeneic bone marrow transplantation in mice. Bone Marrow Transplant. 30, 843–849 (2002). [DOI] [PubMed] [Google Scholar]
- 45.Parks BW et al. Genetic control of obesity and gut microbiota composition in response to high-fat, high-sucrose diet in mice. Cell Metab. 17, 141–152 (2013). [DOI] [PMC free article] [PubMed] [Google Scholar]
- 46.Parks BW et al. Genetic architecture of insulin resistance in the mouse. Cell Metab. 21, 334–346 (2015). [DOI] [PMC free article] [PubMed] [Google Scholar]
- 47.Langfelder P. & Horvath S. WGCNA: an R package for weighted correlation network analysis. BMC Bioinformatics 9, 559 (2008). [DOI] [PMC free article] [PubMed] [Google Scholar]
- 48.Carpenter AE et al. CellProfiler: image analysis software for identifying and quantifying cell phenotypes. Genome Biol. 7, R100 (2006). [DOI] [PMC free article] [PubMed] [Google Scholar]
- 49.Orr JS, Kennedy AJ & Hasty AH Isolation of adipose tissue immune cells. J. Vis. Exp e50707 10.3791/50707 (2013) [DOI] [PMC free article] [PubMed] [Google Scholar]
- 50.Lapuente-Brun E. et al. Supercomplex assembly determines electron flux in the mitochondrial electron transport chain. Science 340, 1567–1570 (2013). [DOI] [PubMed] [Google Scholar]
Associated Data
This section collects any data citations, data availability statements, or supplementary materials included in this article.
Supplementary Materials
Data Availability Statement
The data that support the findings of this study are available from the corresponding author upon request. Accession codes to public repositories are GSE64770 for HMDP HF/HS adipose tissue, GSE38705 for HMDP macrophages and GSE70353 for human METSIM study. HMDP and METSIM data are also available at https://systems.genetics.ucla.edu/. Source data are provided with this paper.


