. 2021 Jun 14;10:e62927. doi: 10.7554/eLife.62927

Figure 7. Immunohistochemical characterization of LAIR-1+ cells and LAIR-2 Fc binding in primary human tumors.

(A) Schematic representation of the immunohistochemical stainings performed. (B) Representative hematoxylin and eosin (H&E), Masson Trichrome, NC410 and LAIR-1 staining in a stomach tumor specimen. (C) Representative NC410 and LAIR-1 analysis. The percentage of NC410 binding to tissue within a tumor was calculated by dividing the NC410+ stained area by the total tumor area. The number of LAIR-1+ cells was calculated by dividing the total number of positive cells within five regions of interest (ROIs) by the total surface in mm2 of these ROIs. (D) Quantification of LAIR-1 and NC410 staining of 9–10 patients per tumor type across six different tumor types (head and neck squamous cell carcinoma [HNSC], skin cutaneous melanoma [SKCM], non-small cell lung carcinoma [NSCLC], high-grade serous ovarian carcinoma [HGSC], pancreatic adenocarcinoma [PDAC] and stomach adenocarcinoma [STAD]). (E) Higher magnification pictures of stomach cancer specimens show LAIR-1+ cells (depicted in red, right side) co-localizing with NC410-positive areas (depicted in red, left side).

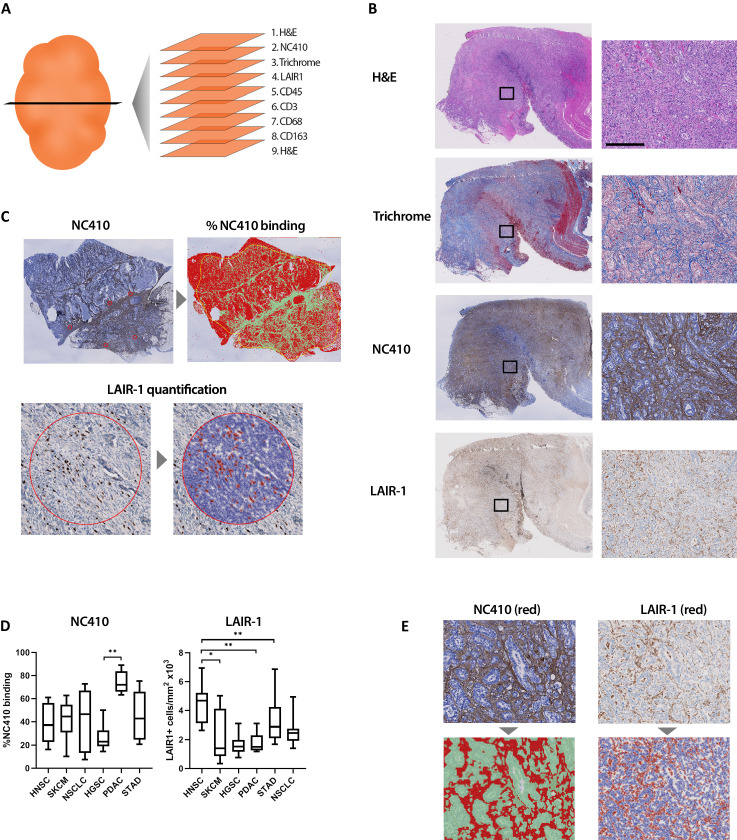
Figure 7.

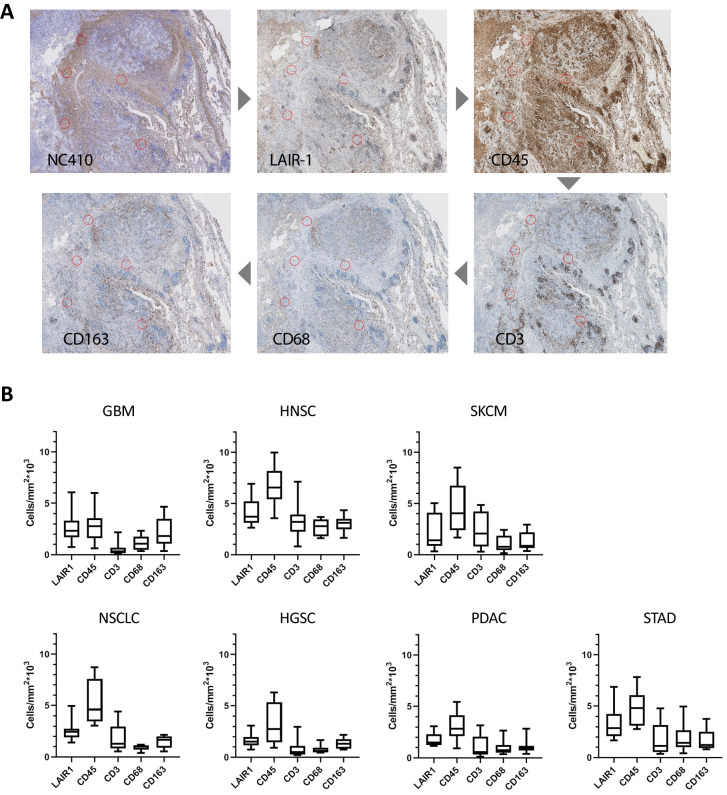
Figure 7—figure supplement 1. Characterization of LAIR-1+ cells in primary human tumors.

Figure 7—figure supplement 1.

(A) Representative NC410, LAIR-1, CD45, CD3, CD68 and CD163 staining in a stomach tumor specimen. For quantification of the immune cell counts, regions of interest (ROIs) were annotated on the tissue slides by drawing circles with a diameter of 600 µm at five random spots within the NC410-positive part of the tumor. Positive cells were quantified using the Positive Cell Detection tool. (B) Number of positive LAIR-1 mAb, CD45, CD3, CD68 and CD163 cells is shown across seven different tumor types (glioblastoma [GBM], head and neck squamous cell carcinoma [HNSC], skin cutaneous melanoma [SKCM], non-small cell lung carcinoma [NSCLC], high-grade serous ovarian carcinoma [HGSC], pancreatic adenocarcinoma [PDAC] and stomach adenocarcinoma [STAD]).
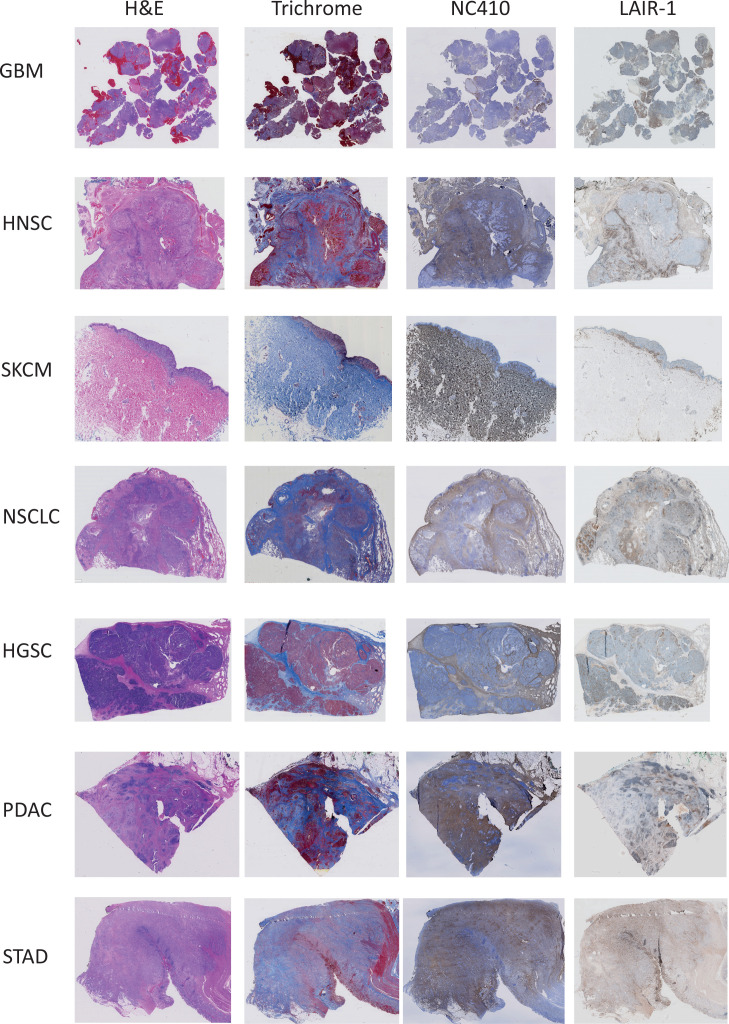
Figure 7—figure supplement 2. Immunohistochemical analysis of primary human tumors.

Figure 7—figure supplement 2.

Representative hematoxylin and eosin (H&E), Masson Trichrome, NC410 and LAIR-1 staining for seven different tumor types (glioblastoma [GBM], head and neck squamous cell carcinoma [HNSC], skin cutaneous melanoma [SKCM], non-small cell lung carcinoma [NSCLC], high-grade serous ovarian carcinoma [HGSC], pancreatic adenocarcinoma [PDAC] and stomach adenocarcinoma [STAD]).
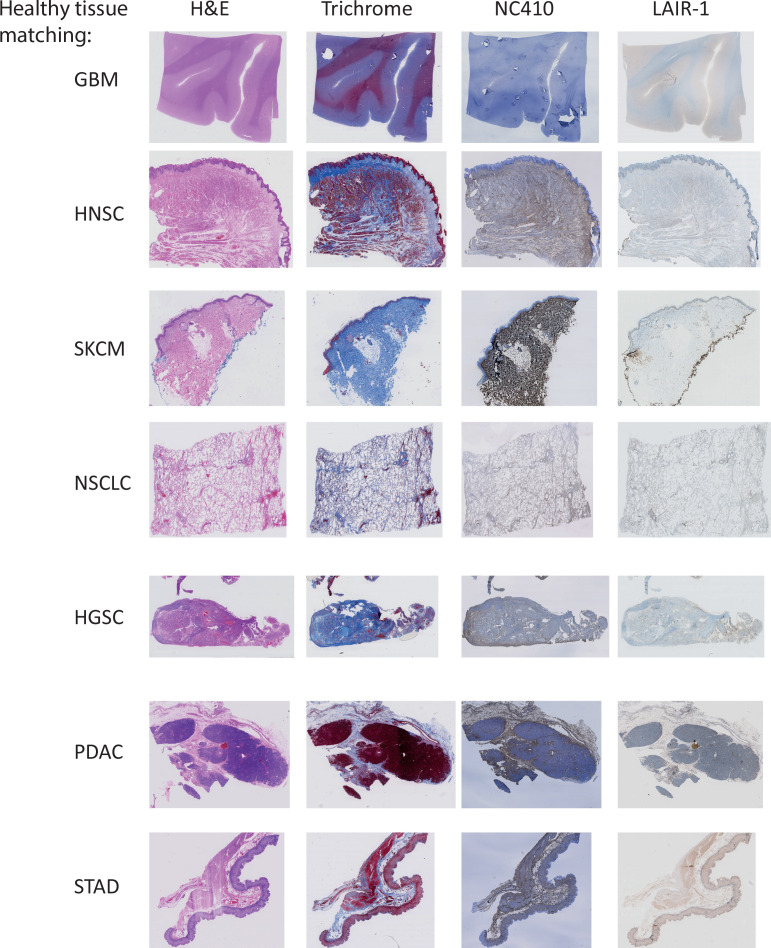
Figure 7—figure supplement 3. Immunohistochemical analysis of healthy tissues.

Figure 7—figure supplement 3.

Representative hematoxylin and eosin (H&E), Masson Trichrome, NC410 and LAIR-1 staining for healthy tissue matching the tumors used in Figure 7—figure supplement 2.
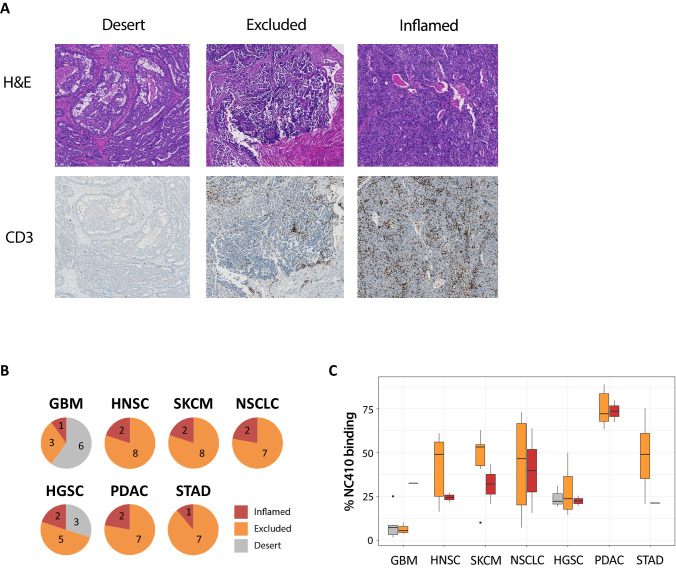
Figure 7—figure supplement 4. NC410 preferentially binds to tumors with an immune-excluded phenotype.

Figure 7—figure supplement 4.

(A) Representative image of the three different immune phenotypes, immune-desert, immune-excluded and immune-inflamed, in a high-grade serous ovarian carcinoma (HGSC) specimen. (B) Patients within each tumor type as shown were characterized into immune-desert, immune-excluded and immune-inflamed based on CD3+ T cell presence and localization. (C) Quantification of NC410 staining across the different immune phenotypes in the seven different tumor types analyzed.