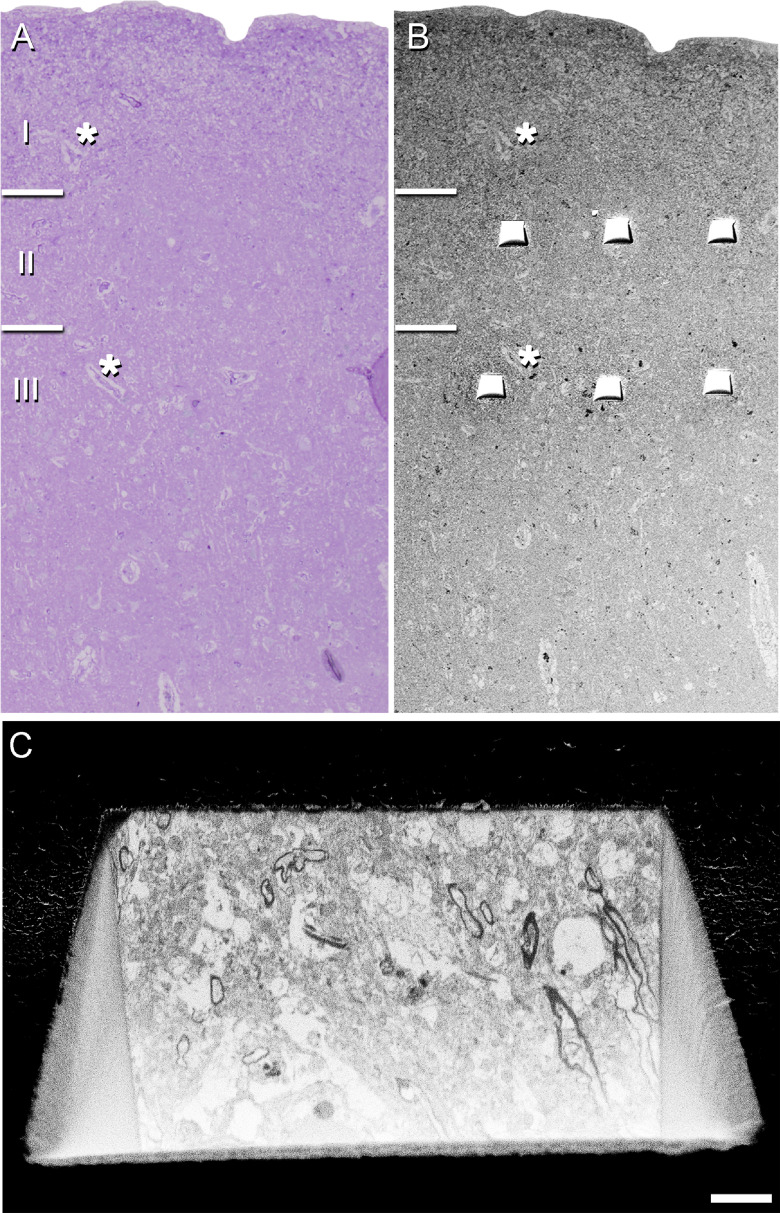
Figure 2.
Correlative light/EM of Layers II and III of the EC. Delimitation of layers is based on the staining pattern of 1-μm-thick semithin section, stained with toluidine blue (A), which is adjacent to the block for FIB/SEM imaging (B). B, SEM image illustrating the block surface with trenches made in the neuropil (three per layer). Asterisks in A, B point to the same blood vessels, showing that the exact location of the region of interest was accurately determined. C, SEM image showing the front of a trench made to expose the tissue and to acquire the FIB/SEM stack of images at the final magnification. Scale bar in C: 70 μm (A), 85 μm (B), and 3 μm (C).

