

Abstract
Objective:
Asthma carries a high burden of disease for residents of Puerto Rico. We conducted this study to better understand asthma-related healthcare use and to examine potential asthma triggers.
Methods:
We characterized asthma-related healthcare use in 2013 by demographics, region, and date using outpatient, hospital, and emergency department (ED) insurance claims with a primary diagnostic ICD-9-CM code of 493.XX. We examined environmental asthma triggers, including outdoor allergens (i.e., mold and pollen), particulate pollution, and influenza-like illness. Analyses included descriptive statistics and Poisson time-series regression.
Results:
During 2013, there were 550,655 medical asthma claims reported to the Puerto Rico Healthcare Utilization database, representing 148 asthma claims/1,000 persons; 71% of asthma claims were outpatient visits, 19% were hospitalizations, and 10% were ED visits. Females (63%), children aged ≤9 years (77% among children), and adults aged ≥45 years (80% among adults) had the majority of asthma claims. Among health regions, Caguas had the highest asthma claim-rate at 142/1,000 persons (overall health region claim-rate = 108). Environmental exposures varied across the year and demonstrated seasonal patterns. Metro health region regression models showed positive associations between increases in mold and particulate matter <10 microns in diameter (PM10) and outpatient asthma claims.
Conclusions:
This study provides information about patterns of asthma-related healthcare use across Puerto Rico. Increases in mold and PM10 were associated with increases in asthma claims. Targeting educational interventions on exposure awareness and reduction techniques, especially to persons with higher asthma-related healthcare use, can support asthma control activities in public health and clinical settings.
Keywords: Epidemiology, management/control, prevention
Introduction
Asthma carries a high burden of disease for residents of Puerto Rico. For both children and adults, the prevalence of asthma is higher in Puerto Rico than in the rest of the United States (1,2). Although one in 13 people in the United States has a current diagnosis of asthma, two in 13 people in Puerto Rico currently have asthma (1,2). In addition, one in three people in Puerto Rico with current asthma reports visiting an emergency department (ED) in the past 12 months for urgent treatment of worsening asthma symptoms (3).
Identification and avoidance of asthma triggers are essential components of asthma management (4). Puerto Rico is a tropical territory with a diverse landscape. The types of environmental exposures that trigger asthma in Puerto Rico may vary from other regions of the United States. For example, exposures in Puerto Rico include molds and pollens from the tropical rain forest and particulate matter (PM) from African dust storms (5,6) that travel across the island. Viral respiratory illnesses, such as respiratory syncytial virus and influenza, are also of special interest as asthma triggers because their infectious seasons are often longer in Puerto Rico than in other regions of the United States (7,8).
Studies examining asthma-related healthcare use in Puerto Rico are limited in scope and number (9–14). Improving our understanding of the reasons for higher asthma morbidity is important for addressing asthma disparities. We conducted this study to better understand asthma morbidity in Puerto Rico by examining environmental asthma triggers and characterizing asthma-related healthcare use via examination of insurance claims. Similar to other public health, environmental, and air pollution studies (15–20), we used an ecological study design, linking health and environmental data, coupled with a time-series statistical regression approach to gain insights into causal associations.
This study was developed in conjunction with a 2016 Epi-Aid request from the Puerto Rico Department of Health to the Centers for Disease Control and Prevention (CDC). The aim of the Epi-Aid was to establish a recent baseline assessment of asthma and its triggers in Puerto Rico. Data sources and study objectives were identified in collaboration with partners from the Puerto Rico Department of Health, the University of Puerto Rico, and CDC. As many factors may impact asthma morbidity and asthma disparities including outdoor pollutants, allergens, respiratory illness, healthcare access and delivery, socioeconomic status, and sociocultural factors, multiple data sources relevant to characterizing asthma burden were identified for analysis in this study.
Methods
Study area and demographics
Insurance claims and environmental exposures occurring in Puerto Rico were examined. Study demographics included sex, age (classified as children aged 0–19 years, adults aged 20 years and older, and six age groups: 0–4, 5–9, 10–14, 15–19, 20–44, 45–64, and ≥65 years), and location of residence (classified as health region, outside of Puerto Rico, and unknown). To conform to predetermined census groupings for population estimates, the age category for children includes persons aged 19 years. The territory is divided into 78 municipalities, which are categorized into eight health regions: Aguadilla, Arecibo, Bayamón, Metro, Fajardo, Caguas, Ponce, and Mayagüez. The Metro health region includes the capital city of San Juan and the six Puerto Rican municipalities of Canóvanas, Carolina, Guaynabo, Loíza, San Juan, and Trujillo Alto.
Asthma-related healthcare use
We examined asthma-related healthcare use patterns using insurance claims from the 2013 Puerto Rico Healthcare Utilization database. This database is managed by the Auxiliary Secretariat of Planning and Development at the Puerto Rico Department of Health. For 2013, it contained claims for 75% of Puerto Rico’s insured population (2,524,069 insurance subscribers) and included the major insurance carriers for Puerto Rican residents. We defined asthma claims as any insurance claim with a primary diagnostic ICD-9-CM code including 493.XX. We categorized claims by healthcare setting (i.e., outpatient visits, hospitalizations, and ED visits). Outpatient visits included physician offices and urgent care facilities. In cases where the municipality of residence was known for a subscriber (i.e., insured person), asthma claims were categorized into one of the eight health regions of Puerto Rico.
In 2013, there were 715,694 asthma claims. Duplicate claims were defined as multiple visits in the same healthcare setting on the same day by a unique subscriber. After removal of duplicate claims and the exclusion of a single dental claim, 550,655 claims, including 449 claims from Puerto Rican insurance subscribers residing outside of the territory, remained. Figure 1 shows inclusion and exclusion criteria for asthma claims used in our final analysis. Maps were constructed for the 73% of claims (n = 402,425/550,655) for which health region was known.
Figure 1.
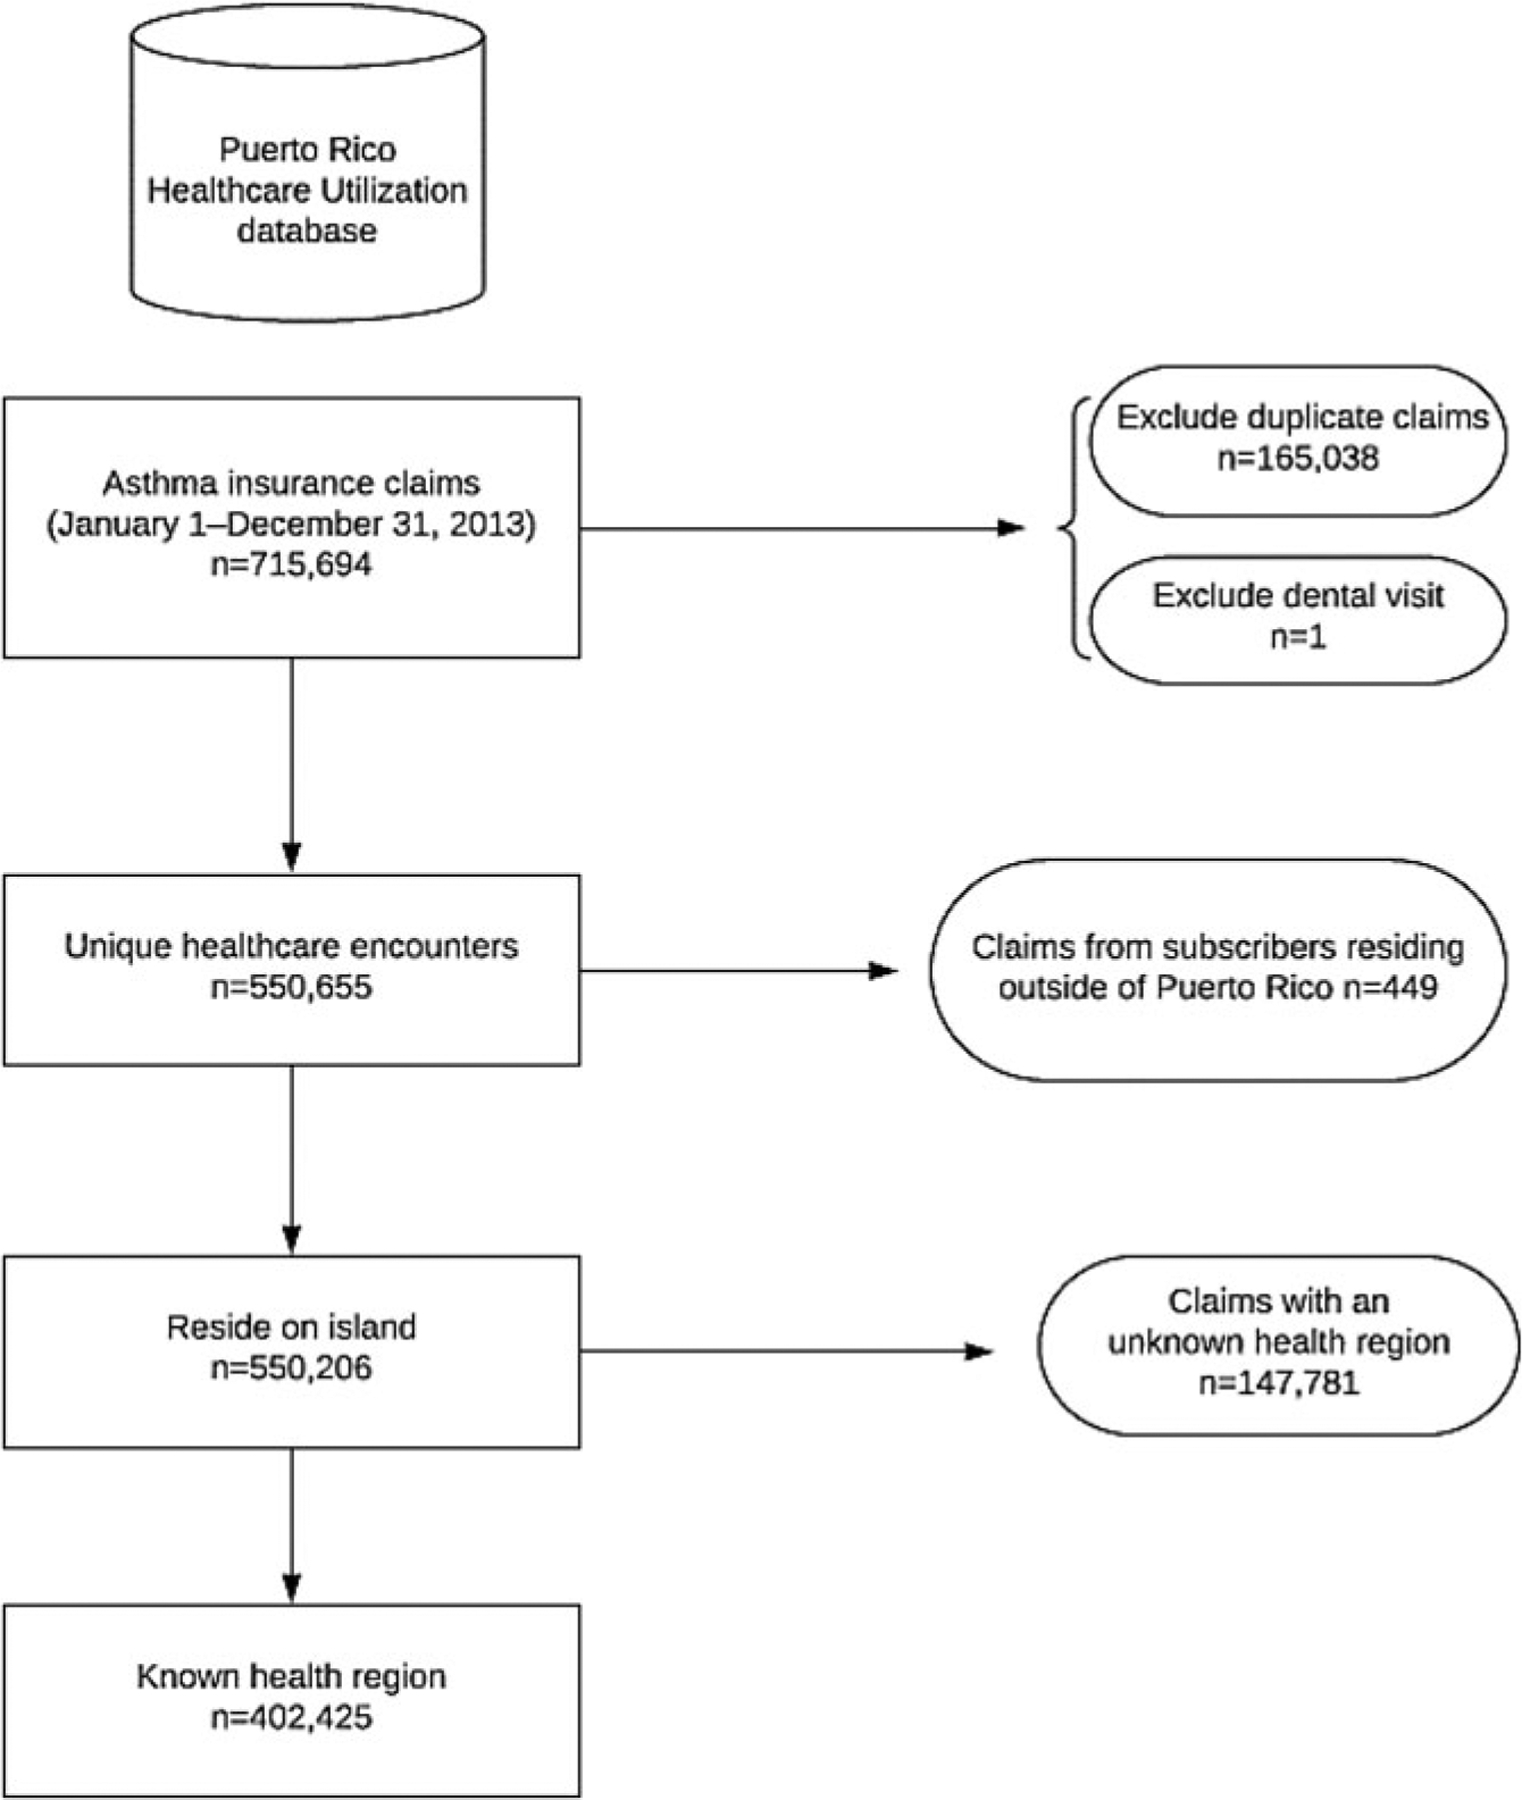
Inclusion criteria flowchart for asthma-related healthcare use.
Environmental exposures
Particle air pollution: dust storms
Puerto Rico’s local air quality monitoring stations measure air pollutants such as carbon monoxide, ozone, and particle pollution. Measurements of PM less than 10 microns in diameter (PM10) and less than 2.5 micron in diameter (PM2.5) were obtained from two air quality monitors in the Metro health region (21). Figure 2 shows the municipalities of the health region and the monitor locations, which are approximately 1 mile apart. At air quality monitoring Site A, PM10 and PM2.5 measurements were taken approximately every 3 days. At Site B, PM10 measurements were recorded daily. PM10 and PM2.5 are measured in units of micrograms per cubic meter (μg/m3). Mean PM10 was calculated for days when measurements were collected at both monitors.
Figure 2.
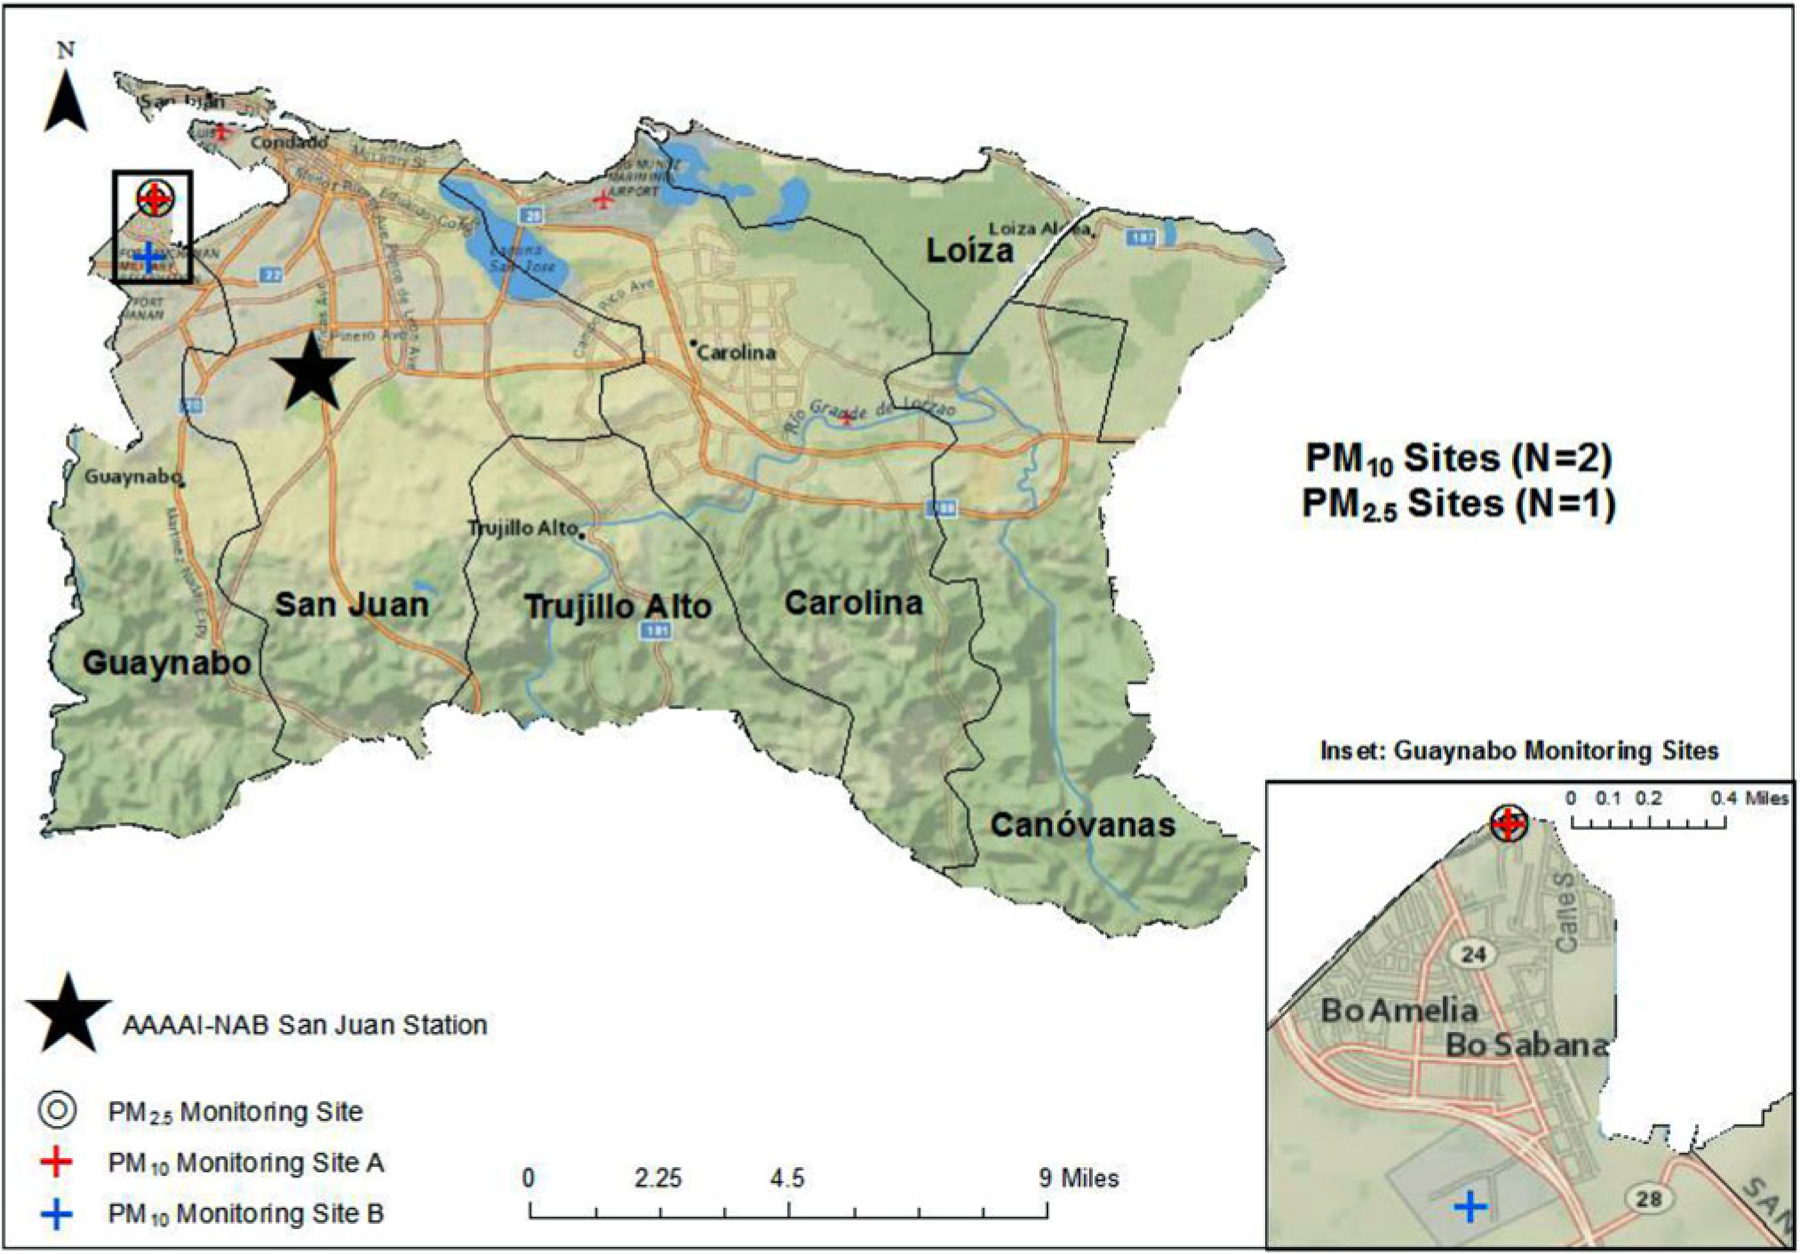
Environmental monitoring stations and the municipalities of the Metro Health Region, Puerto Rico, 2013.
Abbreviations: AAAAI-NAB = American Academy of Allergy, Asthma, and Immunology National Allergen Bureau; PM = Particulate Matter.
Outdoor allergens: mold and pollen
Outdoor allergen monitoring occurs in the Metro health region at the American Academy of Allergy, Asthma, and Immunology National Allergy Bureau (AAAAI-NAB) San Juan station at the University of Puerto Rico (Figure 2). We obtained daily mold and pollen counts from the AAAAI-NAB San Juan station. A Burkard volumetric air sampler was used to collect daily samples. Mold (fungal spores per cubic meter) and pollen (grains per cubic meter) were measured and categorized. Although tree pollen is routinely identified at the San Juan NAB station, weed and grass pollens are less common and rarely recovered. Hence, this study only includes tree pollen concentrations. The AAAAI-NAB San Juan station provides publicly available updates on its website (22).
Syndromic surveillance: influenza-like illness
Counts of influenza-like illness (ILI) were obtained from hospitals and EDs in each municipality in Puerto Rico. Weekly counts of suspected and confirmed ILI were submitted to the Office of Epidemiology and Investigation at the Puerto Rico Department of Health using a case investigation form. In this local syndromic surveillance system (Sistema de Vigilancia de Influenza de Puerto Rico), the case definition for suspected ILI is characterized as a fever ≥37.8 °C with cough and one or more of the following symptoms: difficulty breathing, diarrhea, chills, vomiting or nausea, sore throat, stuffy nose, muscle pain, headache, or fatigue. For our study, pooled weekly counts of cases by municipality were provided for analysis.
Statistical analyses
Based on the 2010 Puerto Rico census (population = 3,725,789), we calculated rates of asthma claims (i.e., claim-rate) and ILI counts per 1,000 persons (23). By healthcare setting, claims-rates (# of claims per 1,000 persons) and percentages (based on total claims within the database) were generated. We also mapped rates of asthma claims by health region (based on regional census estimates). For ILI-counts, we calculated and mapped rates of ILI counts per 1000 persons by health region (based on regional census estimates). All rate denominators for demographic categories (i.e., age, sex, region) were derived from 2010 census populations. We created an asthma claims composite variable that was the sum of the daily count of ED and outpatient visits. We calculated means with ranges of PM10, PM2.5, mold, pollen, and ILI. Because environmental data were limited to specific monitors, we restricted regression analyses to claims from the Metro health region.
We conducted statistical analyses using SAS®, version 9.3 (SAS Institute Inc., Cary, NC, USA). Risk ratios (RRs) and 95% confidence intervals (CIs) were calculated using Poisson regression models for the daily counts of asthma claims, with cubic splines for time, and adjusted for daily mean temperature, daily relative humidity, calendar quarter, and holidays. As ILI and PM2.5 were not measured daily, these variables were excluded from the time-series analyses. Daily outpatient and ED claims were analyzed separately in these models. Hospital claims were excluded from temporal analyses (i.e., descriptive and time-series) as the date of service for claims were unable to be identified as admission or discharge dates.
The following variables were included as cubic splines with two knots at the 25th and 75th percentiles: mean temperature (range = 75.5 °F–88.0 °F; knots: 79.5 °F, 83.0 °F) and mean relative humidity (range = 52.7–91.6%; knots: 71.8%, 78.6%). Calendar quarters were defined as January 1–March 31, April 1–June 30, July 1–September 30, and October 1–December 31 (referent category). National and local holidays during which schools and businesses are typically closed (24) were included in the model. We allowed for an AR(1) error structure to account for potential autocorrelation and model-based standard errors. That is, because the dependent and independent variables at any one particular time, t, are related to the measurement of the variables at time t–1, an autocorrelation is possible. Hence, we specified the time-series models with an autoregressive error structure, AR(1), to account for potential dependency between errors. Sensitivity analyses using seven-knot, time-splines were also performed.
Results
Asthma-related healthcare use: territory-wide
Of the 715,694 asthma-related insurance claims for 2013 included in the Puerto Rico Healthcare Utilization database, 550,655 (77%) claims were included in our study. Table 1 shows number, percentage, and claim-rate of asthma-related healthcare use by healthcare setting and demographic characteristics. There were 389,273 (71%) outpatient visits, 104,668 (19%) hospitalizations, and 56,714 (10%) ED visits. Across all healthcare settings, the highest percentages of asthma claims occurred among females (63%) and adults aged ≥20 years (75%).
Table 1.
Demographic characteristics and incidence rates by health encounter type for insurance claims with a primary diagnosis of asthma, 2013.
| Population No. | Health encounter type | ||||||||
|---|---|---|---|---|---|---|---|---|---|
| Total | Outpatient visit | Hospitalization | ED visit | ||||||
| No. claims (%)a | Rateb | No. claims (%)a | Rateb | No. claims (%)a | Rateb | No. claims (%)a | Rateb | ||
| Total (all claims) | 3,725,789 | 550,655 (100) | 147.8 | 389,273 (71)c | 104.5 | 104,668 (19)c | 28.1 | 56,714 (10)c | 15.2 |
| Sex | |||||||||
| Male | 1,785,171 | 204,508 (37) | 114.6 | 140,371 (36) | 78.6 | 41,555 (40) | 23.3 | 22,582 (40) | 12.6 |
| Female | 1,940,618 | 346,147 (63) | 178.4 | 248,902 (64) | 128.3 | 63,113 (60) | 32.5 | 34,132 (60) | 17.6 |
| Age (years) | |||||||||
| Children (0–19) | 1,017,590 | 136,569 (25) | 134.2 | 71,553 (18) | 70.3 | 46,600 (45) | 45.8 | 18,416 (32) | 18.1 |
| Adults (≥20) | 2,708,199 | 414,086 (75) | 152.9 | 317,720 (82) | 117.3 | 58,068 (55) | 21.4 | 38,298 (68) | 14.1 |
| Age group (years) | |||||||||
| 0–4 | 224,756 | 57,289 (10) | 254.9 | 30,087 (8) | 133.9 | 19,855 (19) | 88.3 | 7,347 (13) | 32.7 |
| 5–9 | 240,004 | 44,993 (8) | 187.5 | 23,776 (6) | 99.1 | 15,394 (15) | 64.1 | 5,823 (10) | 24.3 |
| 10–14 | 268,571 | 21,705 (4) | 80.8 | 11,378 (3) | 42.4 | 7,302 (7) | 27.2 | 3,025 (5) | 11.3 |
| 15–19 | 284,259 | 12,582 (2) | 44.3 | 6,312 (2) | 22.2 | 4,049 (4) | 14.2 | 2,221 (4) | 7.8 |
| 20–44 | 1,236,710 | 80,151 (15) | 64.8 | 45,722 (12) | 37.0 | 20,623 (20) | 16.7 | 13,806 (24) | 11.2 |
| 45–64 | 929,491 | 153,603 (28) | 165.3 | 113,141 (29) | 121.7 | 25,677 (25) | 27.6 | 14,785 (26) | 15.9 |
| ≥65 | 541,998 | 180,332 (33) | 332.7 | 158,857 (41) | 293.1 | 11,768 (11) | 21.7 | 9,707 (17) | 17.9 |
| Health region | |||||||||
| Aguadilla | 231,078 | 28,122 (5) | 121.7 | 25,011 (6) | 108.2 | 2,014 (2) | 8.7 | 1,097 (2) | 4.7 |
| Arecibo | 456,036 | 54,483 (10) | 119.5 | 49,149 (13) | 107.8 | 2,939 (3) | 6.4 | 2,395 (4) | 5.3 |
| Bayamón | 620,110 | 76,690 (14) | 123.7 | 68,148 (18) | 109.9 | 5,138 (5) | 8.3 | 3,404 (6) | 5.5 |
| Caguas | 589,795 | 83,774 (15) | 142.0 | 71,394 (18) | 121.0 | 6,952 (7) | 11.8 | 5,428 (10) | 9.2 |
| Fajardo | 136,115 | 12,279 (2) | 90.2 | 10,742 (3) | 78.9 | 895 (1) | 6.6 | 642 (1) | 4.7 |
| Mayagüez | 304,410 | 30,872 (6) | 101.4 | 26,181 (7) | 86.0 | 2,646 (3) | 8.7 | 2,045 (4) | 6.7 |
| Metro | 822,562 | 75,552 (14) | 91.8 | 66,671 (17) | 81.1 | 5,918 (6) | 7.2 | 2,963 (5) | 3.6 |
| Ponce | 565,683 | 40,653 (7) | 71.9 | 33,055 (8) | 58.4 | 3,826 (4) | 6.8 | 3,772 (7) | 6.7 |
| Total (known region) | 3,725,789 | 402,425 | 108.0 | 350,351 | 94.0 | 30,328 | 8.1 | 21,746 | 5.8 |
| Outside of Puerto Ricod | – | 449 (0.08) | – | 398 (0.1) | – | 47 (0.04) | – | 4 (0.01) | – |
| Unknownd | – | 147,781 (26.8) | – | 38,524 (10) | – | 74,293 (71) | – | 34,964 (62) | – |
Note.
Column %, unless otherwise specified.
Number of claims per 1,000 persons.
Row %.
Claim-rate calculations omitted (–) when population estimates are unavailable.
The 2010 Puerto Rico Census populations used to calculate rates for sex, age, and health region are shown in Table 1. The overall claim-rate was 147.8 asthma claims per 1,000 persons. By healthcare setting, the claim-rates were 104.5, 28.1, and 15.2 claims per 1,000 persons for outpatient, hospital, and ED visits, respectively. The claim-rate for outpatient visits was highest for adults at 117 asthma claims per 1,000 persons. The asthma claim-rates for hospitalizations and ED visits were highest for children at 46 and 18 claims per 1,000 persons, respectively.
Among children aged 0–19 years, across all healthcare settings, children aged ≤9 years had the highest rates of asthma claims per 1,000 persons (220.1 claims/1000 persons). Among adults, persons aged 45–64 years had the highest hospitalization claim-rate at 27.6 claims per 1,000 persons. Adults ≥ 65 years had the highest asthma claim-rates for ED and outpatient visits at 17.9 and 293.1 claims per 1,000 persons, respectively.
Figure 3 shows regional differences in asthma claim-rates. Asthma-related outpatient visits rates ranged from 58 in Ponce to 121 per 1,000 persons in Caguas. Asthma-related hospitalization rates ranged from 6.4 per 1,000 persons in Arecibo to 11.8 per 1,000 persons in Caguas and asthma-related ED rates ranged from 3.6 per 1,000 persons in Metro to 9.2 per 1,000 persons in Caguas. Asthma claims were lower during the months of June–July.
Figure 3.
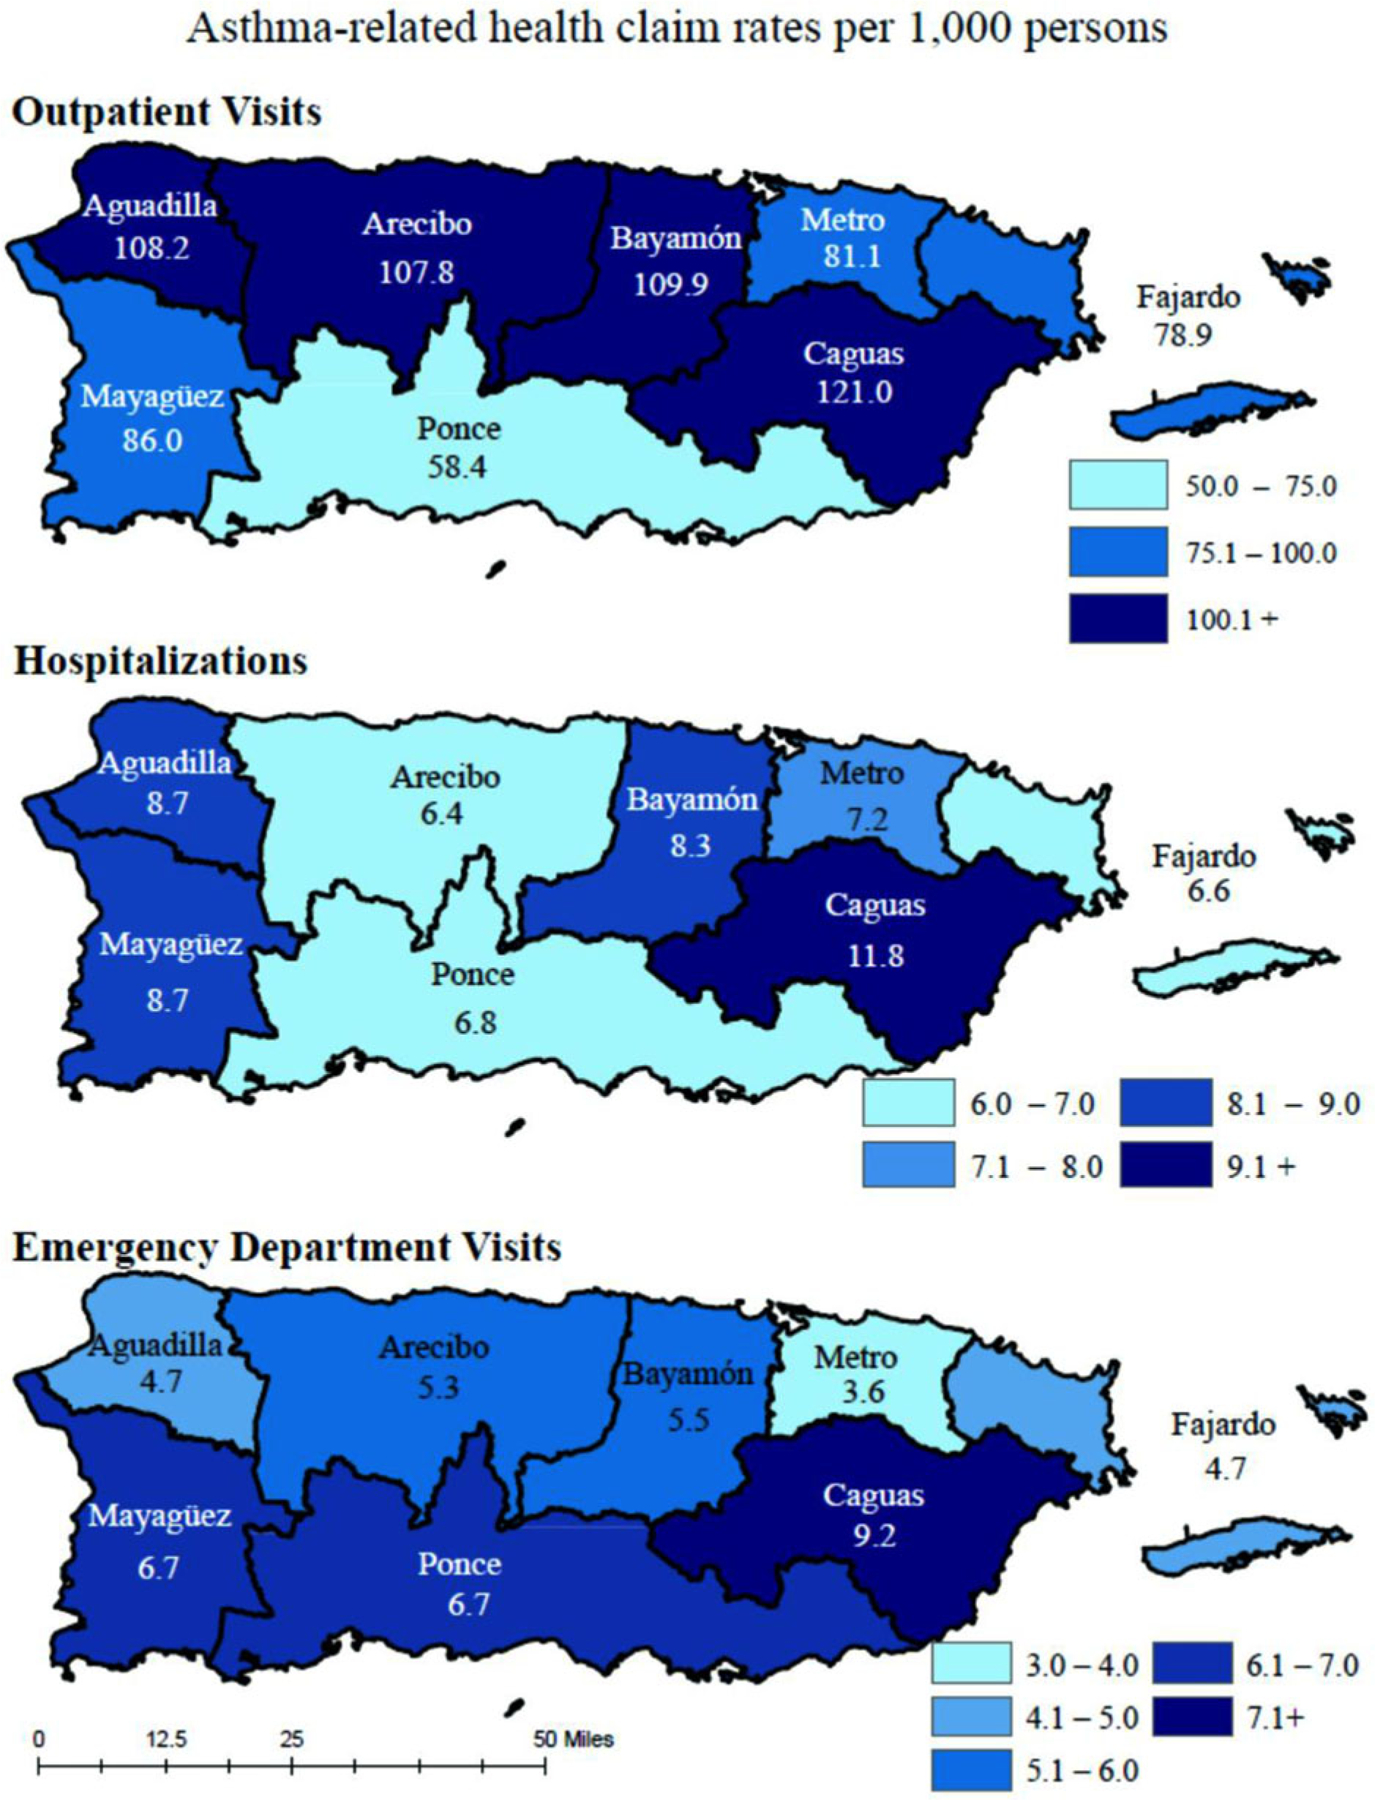
Regional variations in asthma claim-rates by healthcare setting, Puerto Rico, 2013.
Influenza-like illness: territory-wide
Figure 4 shows rates of ILI counts per 1,000 persons by health region. Rates ranged from 30 counts per 1,000 persons in Fajardo to 192 counts per 1,000 persons in Aguadilla. In 2013, ILI counts decreased in April, reached a nadir in July, and began to increase in August.
Figure 4.
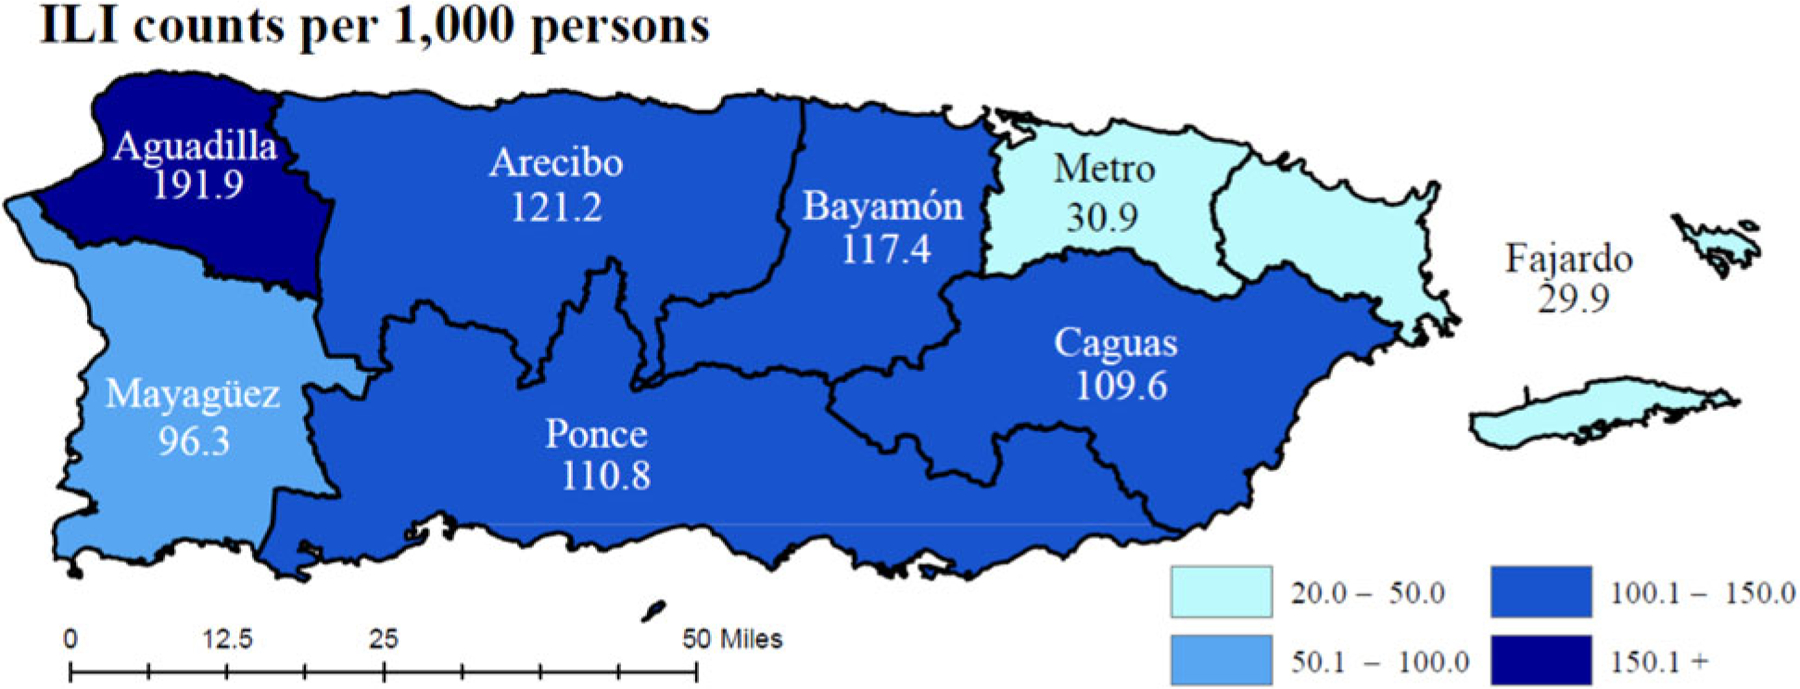
Influenza-like illness rates by Health Region, Puerto Rico, 2013.
Environmental exposures: metro health region
In 2013, mold levels ranged from 1,016 to 148,281 fungal spores/m3. Mold levels rose in May and during the months of September–December. Tree pollen levels ranged from 0 to 616 grains/m3 and were lower during the summer months of June–August. The highest levels of PM10 occurred from June to August. Mirroring PM10 elevations, 2013 dust storms were most frequent during the months of June–August (not shown, dust storm event dates confirmed by triangulated satellite, visual, and aerosol data reported by the Puerto Rico Environmental Quality Board). For PM2.5, the mean particle count was 7 μg/m3 (range = 2–18 μg/m3) over the approximately 3-day sampling period.
Monthly means: metro health region
Figure 5 shows monthly means of asthma claims over-laid on monthly means of environmental exposures and ILI counts in the Metro health region. Peaks in claims, pollen, and ILI counts occurred in February. The lowest levels in numbers of claims, pollen levels, and ILI counts occurred during the summer months.
Figure 5.
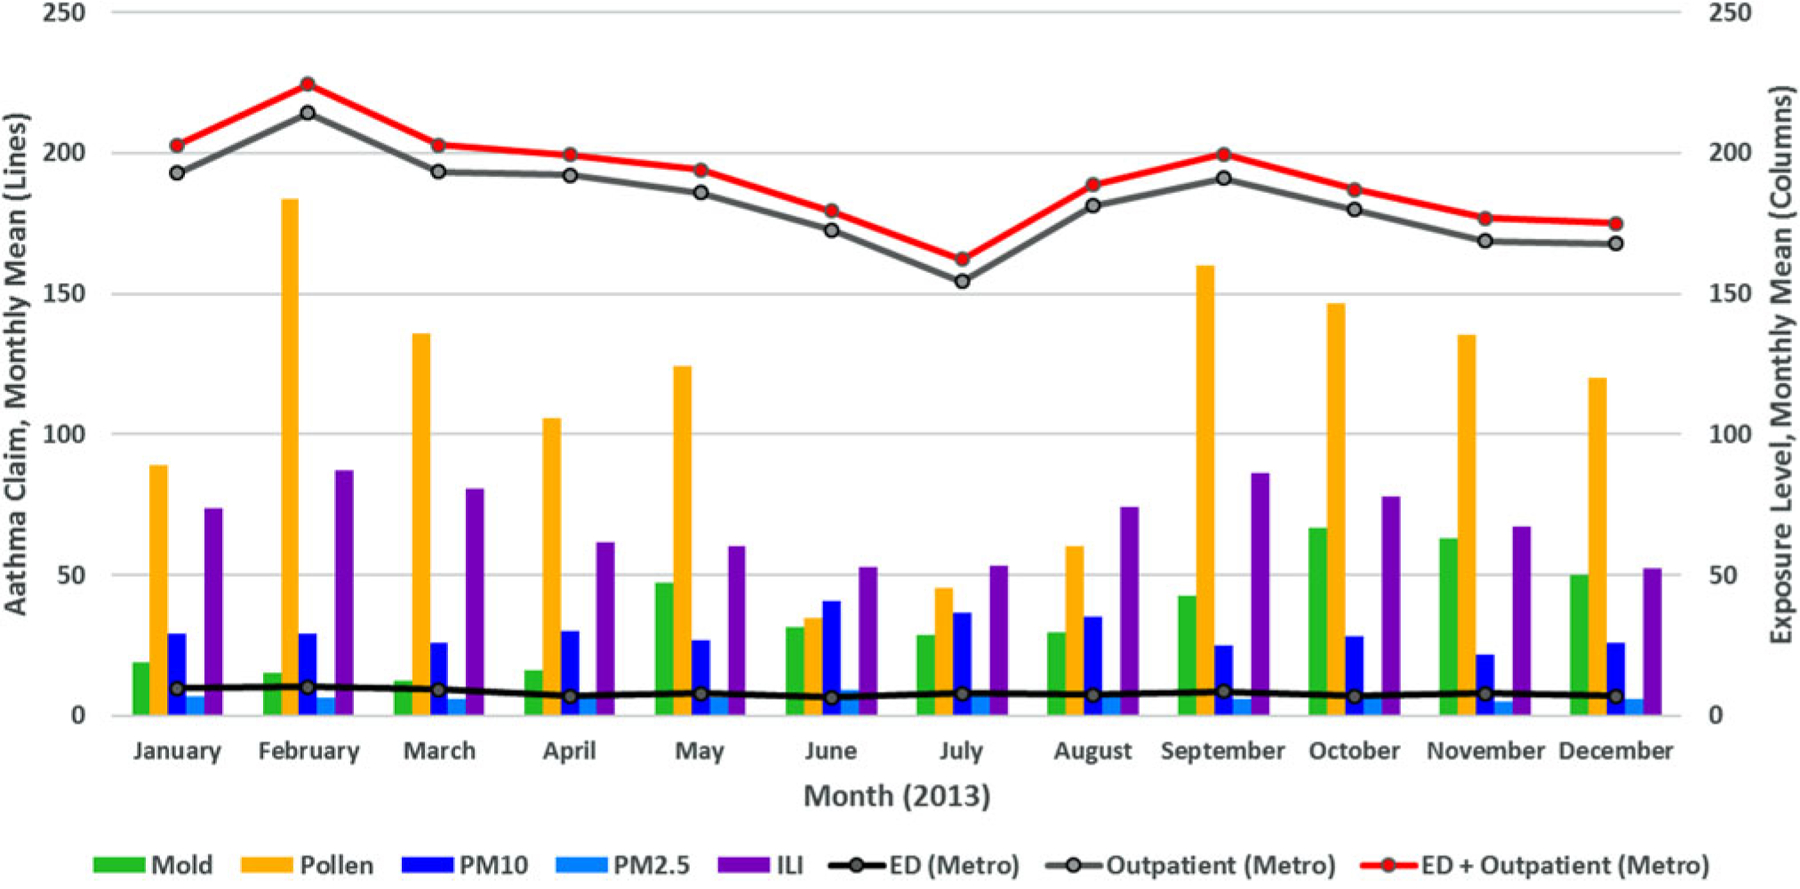
Environmental exposures and asthma claims by healthcare setting, Puerto Rico, 2013*.
Abbreviations: PM = Particulate Matter; ED = Emergency Department.
* Mold levels are represented in thousands, ILI counts are represented in hundreds.
Poisson regression
Adjusting for temperature, relative humidity, calendar quarters, and Puerto Rican holidays, we found a positive association between mold and PM10 levels with asthma claims in the outpatient healthcare setting (Table 2). Every 1,000-unit increase in fungal spores/m3 was associated with a 0.28% increase in asthma-related outpatient claims (RR = 1.0028; 95% CI: 1.0002–1.0053). Every 1 μg/m3 increase in PM10 was associated with a 1.4% increase in asthma-related outpatient claims (RR = 1.0140; 95% CI: 1.0095–1.0185). For the composite total (ED + outpatient visits), every 1,000-unit increase in mold (fungal spores/m3) was associated with a 0.27% increase in asthma claims (RR = 1.0027; 95% CI: 1.0003–1.0052). Similarly, every 1 μg/m3 increase in PM10 was associated with a 1.35% increase in the asthma-related claims composite (RR = 1.0135; 95% CI: 1.0092–1.0178). Sensitivity analyses showed similar results.
Table 2.
Associations between environmental exposures and asthma claims by healthcare setting — Metro health region, Puerto Rico, 2013.
| Healthcare setting | Mold RR (95% CI) | Environmental exposures Pollen RR (95% CI) | PM10 RR (95% CI) |
|---|---|---|---|
| ED | 1.0012 (0.9991–1.0034) | 1.0001 (0.9997–1.0005) | 1.0013 (0.9975–1.0051) |
| Outpatient | 1.0028 (1.0002–1.0053) | 0.9998 (0.9993–1.0004) | 1.014 (1.0095–1.0185) |
| ED + Outpatient | 1.0027 (1.0003–1.0052) | 0.9998 (0.9993–1.0003) | 1.0135 (1.0092–1.0178) |
Note. ED: emergency department; PM: particulate matter; RR: risk ratio; CI: confidence interval. Model adjusted for temperature, relative humidity, calendar quarters, and Puerto Rican holidays.
Discussion
Our study highlights asthma-related healthcare use in Puerto Rico by demographics, region, and date during 2013. Environmental exposures (i.e., mold and PM) were positively associated with increases in asthma claims. Implications of our study findings are broad and reflect an array of opportunities for clinical and public health practitioners.
In 2013, females, children aged ≤9 years, and adults aged ≥45 years had the highest asthma-related healthcare use. This pattern is consistent with age-specific patterns of healthcare use in other regions of the United States (25,26). National studies found that asthma-related healthcare use tends to be comparable between the sexes (25–27). Similar to our findings, a territory-specific study found higher asthma-related healthcare use among females (28). Additionally, studies have commonly reported higher rates of healthcare use (nonasthma-related) among women than men (29,30).
Regionally, across all healthcare settings, the highest rates of asthma-related healthcare use occurred in the Caguas health region. As claim-rate calculations are based upon the number of claims in a specific population, as Caguas has the highest number of claims (of known regions), yet has the third highest population of those regions, it results in a proportionately higher claim-rate. The city of Caguas is approximately 20 miles from the city of San Juan, and the health region of Caguas is located in the largest valley in the Puerto Rican territory. The populations of Caguas and San Juan are similar in distribution of sex, age, and socioeconomic status (i.e., median household income, % educational attainment, % of persons below poverty level) (17). Although the cause for high asthma prevalence and asthma-related healthcare use in the Caguas health region is unknown, environmental exposures related to geography may contribute. Caguas is located in a valley, sits in the path of dust storms, and is downwind of the El Yunque rainforest’s dissemination of tropical molds and pollens. Air sampling case studies in Caguas identified the presence of asthma-related airborne fungi in the area (31). If Caguas’s location affects the type, frequency, and concentration of environmental exposures in the area, the elevated rates of asthma-related healthcare use observed in Caguas would not be unexpected.
Across the year, our study showed changes in concentrations of mold, pollen, and PM in the Metro health region. Specifically, mold counts were higher in May and September–December, and tree pollen counts were lower in June–August. The pattern of mold elevation mirrors peaks in the Puerto Rico rainy season (32). Conversely, the pollen counts decreased during the rainy season (32). The 2013 mold and pollen seasons mirror patterns in the allergen seasons observed in 2014 and 2015 at the San Juan station. Data on seasonal changes of outdoor allergens can be used to reduce asthma exacerbations by reducing exposure to seasonal triggers.
Mold levels are high throughout the year in San Juan, Puerto Rico compared to other regions of the United States (33). At the San Juan station, the most commonly observed types of fungi were Basidiospores (60%) and Ascospores (34%) (1,6), typically dispersed from the El Yunque rainforest. Prior studies investigating the impacts of common fungal species in Puerto Rico have suggested possible roles for these species in exacerbating respiratory conditions and increasing sensitization to allergies (34,35). Diagnostic panels are not routinely available for these commonly observed allergens, though studies in Puerto Rico have shown high serological reactivity to these fungal spores (36). Clinical assessment and management of both allergies and asthma could be enhanced by the availability of relevant, standardized tropical fungal antigens on diagnostic allergen panels, specifically for tropical settings such as Puerto Rico. Additional information about the role that fungal species in Puerto Rico play on asthma exacerbations and management could be used to support identification of susceptible persons and to target educational interventions around exposure reduction. Additionally, as the San Juan station is currently the only AAAAI-certified pollen and mold counting station on the island, the establishment of allergen counting stations at other locations in Puerto Rico would allow further characterization of outdoor environmental allergen exposures across the territory. Such counting stations could drive identification and quantification of other relevant outdoor environmental allergen species to include on tropical allergen panels.
We also observed patterns in timing of exposures. Periods with lower levels of pollen and mold coincided with periods during which asthma claims were lower. Across the year, elevations and reductions in pollen and ILI levels mirrored elevations and reductions in outpatient asthma claims. The study observations and findings factor into the theories that pollen and mold allergens as well as PM and ILI, and perhaps interactions between them, might act as potential drivers of asthma-related healthcare use. For example, investigators in Japan reported an association between ambient desert dust levels and increased risk of allergic symptoms in pollen-sensitive pregnant women (37). In Puerto Rico, bacterial, endotoxin-induced bronchial inflammation is increased by African dust events (ADE), and there is likely synergism between ADE-associated PM10 and non-ADE PM10 exposures, triggering adverse respiratory responses (38,39). Additionally, there is some evidence that allergens and respiratory viral infections contribute synergistically to asthma exacerbations (40). Although such interactions were not investigated in this study, further examination of patterns and interactions between exposures would be helpful in characterizing the relationship between asthma and environmental exposures in the territory.
Overall, in our study, we found increases in mold and PM exposures were associated with increases in asthma claims. In outpatient settings, daily asthma claims increased by 0.28% when mold levels increased; daily claims increased by 1.4% when PM10 levels increased. At the population level, these small percentage changes may reflect substantial numbers of claims in terms of asthma-related healthcare use. For instance, if 1.4% of the approximately 400,000 persons with current asthma in Puerto Rico sought care, it would correspond to 5,600 asthma claims (or 5,600 instances of asthma-related healthcare use). Other studies have shown similar findings for African dust or particulate pollution on asthma-related healthcare use (5,20,41).
In both clinical and public health settings, targeting asthma control interventions and messaging towards demographic subgroups with higher morbidity benefits those persons with the highest burden of asthma (4,42). To address demographic groups with higher asthma prevalence and asthma-related healthcare use, the Puerto Rico Asthma Program began several interventions in the community, including a home visit program for families with children aged 4–17 years who have uncontrolled asthma and the development and distribution of school-based asthma education materials targeting students and educators. The Puerto Rico Asthma Program also provides educational seminars and trainings to students, teachers, health educators, and healthcare professionals. Colleagues at the University of Puerto Rico and the AAAAI-NAB San Juan station have also sought to educate communities on environmental allergens. The San Juan station has its own Facebook page (43) entitled “Alergia a Hongos [Allergy to Fungi]” where visitors can find information on the most recent pollen and mold counts in San Juan and learn about how allergens impact asthma. They also work with local news stations to include mold and pollen levels in daily weather reports. Additionally, students in Puerto Rico are developing a mobile application to share warnings of red alert levels for outdoor molds and PM.
Preventive measures that minimize environmental exposures, such as self-management educational techniques that support awareness, avoidance, and mitigation of asthma triggers, could optimize asthma control, reduce asthma attacks, and, ultimately, decrease asthma morbidity and asthma-related healthcare use. In conjunction with medical and environmental assessments, education on simple interventions such as watching the forecast for high-risk exposure days and then limiting outdoor activities, keeping windows closed, using an air conditioner (when possible), and/or wearing a mask to reduce exposures can be helpful.
Strengths of this study are the substantial coverage of the territory’s population in the health insurance claims database and the daily measurements of mold and pollen at the San Juan Allergen station. This study provides information about numerous environmental exposures in the Metro health region that may serve as asthma triggers in Puerto Rico. It also provides previously unavailable analysis on asthma healthcare use in multiple settings across all health regions of the territory during 2013.
Our study also has limitations. First, as the study is limited to a 1-year period, we are unable to examine multi-year trend patterns in asthma-related healthcare use. Second, as it was not possible to identify whether the dates of hospital claims reported were admission or discharge dates or to separate claims for outpatient visits into urgent care settings and routine visits, analyses specifically examining urgent healthcare use were limited. Additionally, while the 2013 rates are generated from census data available at the time of the study, the 2010 census counts may not precisely mirror the demographic make-up of the 2013 population. This may limit the accuracy of the descriptive rates.
In the wake of multiple public health emergencies including the Zika epidemic and 2017 hurricanes (instances where potential asthma triggers may be newly introduced), examination of urgent healthcare use (i.e. urgent care visits, ED visits, and hospital stays) would be helpful for future preparedness efforts. Additionally, identifying ways to rapidly obtain urgent healthcare use data would be useful for surveillance and preparedness in such emergencies. While our study is a recent assessment of asthma healthcare use in Puerto Rico, it is limited as the data were collected in 2013, prior to the 2015 Zika epidemic and the 2017 hurricane season. In the wake of natural disasters and public health emergencies, such data might help guide response and recovery efforts.
Conclusions
This study provides a recent assessment of asthma-related healthcare use patterns in outpatient, hospital, and ED settings across the island of Puerto Rico. We provide descriptive information on diverse environmental asthma triggers including outdoor molds, pollens, PM (including dust storms), and respiratory illness. We identified positive associations between increases in outdoor mold and PM exposures and outpatient asthma-related healthcare use. Comprehensive efforts to optimize asthma control through education on environmental exposures and avoidance of asthma triggers remain central to asthma management in clinical and public health settings (4,42). Interventions targeting persons with higher asthma-related healthcare use with education on exposure reduction can support asthma control activities and may be integrated into acute and long-term emergency preparedness planning.
Acknowledgements
The authors appreciate the support, contributions, and expertise of Drs. Ginger Chew and Fuyuen Yip in initiating this project and facilitating key collaborations. We thank the Epidemic Intelligence Service Program for facilitating training opportunities contributing to the development of this project. Special thanks to Mr. John Adames and Ms. Myribel Santiago at Puerto Rico Department of Health, Dr. Jeremy Sarnat at Emory University, and Drs. Wences Arvelo, Paul Garbe, Joy Hsu, Hatice Zahran, and Ms. Candi Cloud at the Centers of Disease Control and Prevention (CDC) for providing their insights, expertise, and support to this investigation. Many thanks to Mr. David Sánchez at the National Weather Service in San Juan, PR for contributing relative humidity and temperature data. We thank Mr. Randall Young and Ms. Laura Wright of the Geospatial Research, Analysis and Services Program (GRASP) at CDC for their guidance and contributions to geospatial data and resources. Additionally, we appreciate the insights of the Puerto Rico Environmental Quality Board regarding particulate matter and dust storms. The findings and conclusions in this report are those of the authors and do not necessarily represent the official positions of the Centers for Disease Control and Prevention, the National Institutes of Health, or the American Academy of Allergy, Asthma & Immunology.
Funding
The image capture equipment of the San Juan, AAAAI Station is supported in part by the National Institute on Minority Health and Health Disparities of the National Institutes of Health (NIH) under award number U54MD007600 and the Puerto Rico Clinical and Translational Research Consortium under NIH award No. 2U54MD007587-04.
Footnotes
Declaration of interest
The authors report no conflicts of interest. The authors alone are responsible for the content and writing of the paper.
References
- 1.Centers for Disease Control and Prevention. 2014. Adult Asthma Data: Prevalence tables and maps. Available from: https://www.cdc.gov/asthma/brfss/2014/tableC1.htm. Published 13 July 2016 [last accessed 14 March 2018].
- 2.Centers for Disease Control and Prevention. 2014. Child Asthma Data: Prevalence tables. Available from: https://www.cdc.gov/asthma/brfss/2014/child/tablec1.htm. Published 4 November 2016 [last accessed 14 March 2018].
- 3.PUERTO RICO ASTHMA CONTROL PROGRAM. 2016. WORLD ASTHMA DAY INFOGRAPHIC: BRFSS 2011–2014 AGGREGATE. Published 3 May 2016.
- 4.National Heart, Lung, and Blood Institute (NHLBI). National Asthma Education and Prevention Program Expert Panel Report 3 (EPR3): Guidelines for the diagnosis and management of asthma. Bethesda MD: NHLBI, 2007. Available from:www.nhlbi.nih.gov/guidelines/asthma/asthgdln.htm [Google Scholar]
- 5.Prospero JM, Blades E, Naidu R, Mathison G, Thani H, Lavoie MC. Relationship between African dust carried in the Atlantic trade winds and surges in pediatric asthma attendances in the Caribbean. Int J Biometeorol. 2008;52:823–832. Epub 2008/09/06. doi: 10.1007/s00484-008-0176-1. [DOI] [PubMed] [Google Scholar]
- 6.Kanatani KT, Ito I, Al-Delaimy WK, Adachi Y, Mathews WC, Ramsdell JW. Desert dust exposure is associated with increased risk of asthma hospitalization in children. Am J Respir Crit Care Med. 2010;182: 1475–1481. Epub 2010/07/27. doi: 10.1164/rccm.201002-0296OC. [DOI] [PMC free article] [PubMed] [Google Scholar]
- 7.McGuiness CB, Boron ML, Saunders B, Edelman L, Kumar VR, Rabon-Stith KM. Respiratory syncytial virus surveillance in the United States, 2007–2012: results from a national surveillance system. Pediatr Infect Dis J. 2014;33:589–594. doi: 10.1097/INF.0000000000000257. [DOI] [PMC free article] [PubMed] [Google Scholar]
- 8.Influenza epidemic declared in Puerto Rico. Caribbean Business Available from: http://caribbeanbusiness.com/influenza-epidemic-declared-in-puerto-rico/. Published 23 February 2016 [last accessed 14 March 2018].
- 9.Mayol PM, Rodriguez Santana JR, Sinfontes JE, Mirabal M, Beltran N. Profile of pediatric admissions with diagnosis of asthma at the San Pablo Hospital. Bol Asoc Méd P R. 1991;83:426–429. Epub 1991/10/01. [PubMed] [Google Scholar]
- 10.Marin-Centeno HA, Ramos-Valencia G, Rodriguez-Sanchez M, Gonzalez-Gavillan J, Diaz-Toro EC, Torres-Cintron M. Association between health care utilization with asthma control levels among a sample of adult patients in Puerto Rico. Puerto Rico Health Sci J. 2016;35:81–87. Epub 2016/05/28. [PubMed] [Google Scholar]
- 11.Montealegre F, Chardon D, Vargas W, Bayona M, Zavala D. Measuring asthma disparities in Hispanics: adherence to the national guidelines for asthma treatment in emergency departments in Puerto Rico. Ann Allergy Asthma Immunol. 2004;93:472–477. Epub 2004/11/26. doi: 10.1016/s1081-1206(10)61415-9. [DOI] [PubMed] [Google Scholar]
- 12.Jandasek B, Ortega AN, McQuaid EL, Koinis-Mitchell D, Fritz GK, Kopel SJ, Seifer R, et al. Access to and use of asthma health services among Latino children: the Rhode Island-Puerto Rico asthma center study. Med Care Res Rev. 2011;68:683–698. Epub 2011/05/04. doi: 10.1177/1077558711404434. [DOI] [PMC free article] [PubMed] [Google Scholar]
- 13.Canino G, Garro A, Alvarez MM, Colón-Semidey A, Esteban C, Fritz G, et al. Factors associated with disparities in emergency department use among Latino children with asthma. Ann Allergy Asthma Immunol. 2012;108:266–270. doi: doi: 10.1016/j.anai.2012.02.002. [DOI] [PMC free article] [PubMed] [Google Scholar]
- 14.Vila D, Rand CS, Cabana MD, Quiñones A, Otero M, Gamache C, Ramírez R, et al. Disparities in asthma medication dispensing patterns: the case of pediatric asthma in Puerto Rico. J Asthma. 2010;47:1136–1141. Epub 2010/11/03. doi: 10.3109/02770903.2010.517338. [DOI] [PMC free article] [PubMed] [Google Scholar]
- 15.Dockery DW. Epidemiologic study design for investigating respiratory health effects of complex air pollution mixtures. Environ Health Perspect. 1993;101: 187–191. doi: 10.1289/ehp.93101s4187. [DOI] [PMC free article] [PubMed] [Google Scholar]
- 16.National Research Council (US) Committee on Environmental Epidemiology; National Research Council (US) Commission on Life Sciences. Chapter 2, Environmental-epidemiology studies: their design and conduct. In: Environmental epidemiology: volume 2: use of the gray literature and other data in environmental epidemiology. Washington, DC: National Academies Press (US); 1997. Available from: https://www.ncbi.nlm.nih.gov/books/NBK233644/ [PubMed] [Google Scholar]
- 17.Wakefield J Ecologic studies revisited. Annu Rev Public Health. 2008;29:75–90. doi: 10.1146/annurev.publhealth.29.020907.090821. [DOI] [PubMed] [Google Scholar]
- 18.Lu Y, Zeger S. On the equivalence of case-crossover and time series methods in environmental epidemiology. Biostatistics. 2007;8:337–344. Available from: doi: 10.1093/biostatistics/kxl013. [DOI] [PubMed] [Google Scholar]
- 19.Peel JL, Tolbert PE, Klein M, Metzger KB, Flanders WD, Todd K, Mulholland JA, et al. Ambient air pollution and respiratory emergency department visits. Epidemiology. 2005;16:164–174. [DOI] [PubMed] [Google Scholar]
- 20.Elliott CT, Henderson SB, Vet W. Time series analysis of fine particulate matter and asthma reliever dispensations in populations affected by forest fires. Environ Health. 2013;12:11. Available from: http://www.ehjournal.net/content/12/1/11 [DOI] [PMC free article] [PubMed] [Google Scholar]
- 21.US Environmental Protection Agency. Air quality system data mart. Available from: https://www.epa.gov/airdata [last accessed 15 December 2016].
- 22.American Academy of Allergy Asthma and Immunology. National Allergy Bureau Pollen and Mold report. Available from: http://pollen.aaaai.org/nab/index.cfm?p=allergenreport&stationed=168 [last accessed 12 March 2018].
- 23.United States Census Bureau. 2010. US Census. Available from: https://www.census.gov/ [last accessed 15 January 2017].
- 24.Puerto Rico public holidays 2013. Puerto Rican national holidays. Available from: http://holidayyear.com/holidays/Puerto-Rico/2013 [last accessed 17 March 2017].
- 25.Zahran HS, Bailey CM, Damon SA, Garbe PL, Breysse PN. Vital signs: asthma in children - United States, 2001–2016. Morbidity Mortality Weekly Rep. 2018;67: 149–155. Epub 2018/02/09. doi: 10.15585/mmwr.mm6705e1. [DOI] [PMC free article] [PubMed] [Google Scholar]
- 26.Akinbami LJ, Moorman JE, Bailey C, Zahran HS, King M, Johnson CA, et al. Trends in asthma prevalence, health care use, and mortality in the United States; 2012 May 24. NCHS Data Brief 2012:1–8. [PubMed] [Google Scholar]
- 27.Akinbami LJ, Moorman JE, Liu X. Asthma prevalence, health care use, and mortality: United States; 2011 Jan 12. National Health Stat Rep. 2011:1–14. [PubMed] [Google Scholar]
- 28.Montealegre F, Chardon D, Tarrats H. Environmental factors precipitating bronchial asthma exacerbations in southern Puerto Rico: a pilot study. J Asthma. 1993;30:219–227. doi: 10.3109/02770909309054520. [DOI] [PubMed] [Google Scholar]
- 29.Bertakis KD, Azari R, Helms LJ, Callahan EJ, Robbins JA. Gender differences in the utilization of health care services. J Fam Pract. 2000;49:147–152. Epub 2000/03/16. [PubMed] [Google Scholar]
- 30.Schappert SM, Burt CW. Ambulatory care visits to physician offices, hospital outpatient departments, and emergency departments: United States; 2006 Feb. Vital Health Stat Ser 13, Data National Health Survey. 2006: 1–66. Epub 2006/02/14. [PubMed] [Google Scholar]
- 31.Velez C, Gonzalez A, Rentas AR. Isolation and identification of airborne fungi that can cause asthma: a case study from eastern Puerto Rico. Int J Environ Technol Manage. 2009;10:243–259. doi: 10.1504/IJETM.2009.023732. [DOI] [Google Scholar]
- 32.Quintero E, Rivera-Mariani F, Bolaños-Rosero B. Analysis of environmental factors and their effects on fungal spores in the atmosphere of a tropical urban area (San Juan, Puerto Rico). Aerobiologia. 2010;26: 113–124. doi: 10.1007/s10453-009-9148-0. [DOI] [Google Scholar]
- 33.American Academy of Allergy Asthma and Immunology. Reading the Charts. Available from: http://pollen.aaaai.org/nab/index.cfm?p=reading_charts3&statid=168 [last accessed 27 April 2018].
- 34.Rivera-Mariani FE, Nazario JS, Lopez-Malpica F, Bolanos-Rosero B. Sensitization to airborne ascospores, basidiospores, and fungal fragments in allergic rhinitis and asthmatic subjects in San Juan, Puerto Rico. Int Arch Allergy Immunol. 2011;155:322–334. Epub 2011/ 02/25. doi: 10.1159/000321610. [DOI] [PMC free article] [PubMed] [Google Scholar]
- 35.Rivera-Mariani FE, Bolaños-Rosero B. Allergenicity of airborne basidiospores and ascospores: need for further studies. Aerobiologia. 2012;28:83–97. doi: 10.1007/s10453-011-9234-y. [DOI] [Google Scholar]
- 36.Vila-Hereter F, Rivera-Mariani FE, Bolanos-Rosero B. Serological reactivity and identification of immunoglobulin E-binding polypeptides of Ganoderma applanatum crude spore cytoplasmic extract in Puerto Rican subjects. Int Arch Allergy Immunol. 2017;172: 139–149. doi: 10.1159/000455254. [DOI] [PMC free article] [PubMed] [Google Scholar]
- 37.Kanatani KT, Hamazaki K, Inadera H, et al. Effect of desert dust exposure on allergic symptoms: a natural experiment in Japan. Ann Allergy Asthma Immunol. 2016;116:425–430. e427. doi: 10.1016/j.anai.2016.02.002. [DOI] [PubMed] [Google Scholar]
- 38.Ortiz-Martinez MG, Rodriguez-Cotto RI, Ortiz-Rivera MA, Pluguez-Turull CW, Jimenez-Velez BD. Linking endotoxins, African dust PM10 and asthma in an urban and rural environment of Puerto Rico. Mediators Inflammation. 2015;2015:784212. Epub 2015/12/19. doi: 10.1155/2015/784212. [DOI] [PMC free article] [PubMed] [Google Scholar]
- 39.Rodriguez-Cotto RI, Ortiz-Martinez MG, Rivera-Ramirez E, Mendez LB, Davila JC, Jimenez-Velez BD. African dust storms reaching Puerto Rican coast stimulate the secretion of IL-6 and IL-8 and cause cytotoxicity to human bronchial epithelial cells (BEAS-2B). Health. 2013;5:14–28. Epub 2014/07/09. doi: 10.4236/health.2013.510A2003. [DOI] [PMC free article] [PubMed] [Google Scholar]
- 40.Rowe RK, Gill MA. Asthma: the interplay between viral infections and allergic diseases. Immunol Allergy Clin North Am. 2015;35:115–127. doi: 10.1016/j.iac.2014.09.012. [DOI] [PubMed] [Google Scholar]
- 41.Bouazza N, Foissac F, Urien S, Guedj R, Carbajal R, Treluyer JM, et al. Fine particulate pollution and asthma exacerbations. Arch Dis Childhood. 2017: 103(9):828–831. doi: 10.1136/archdischild-2017-312826. [DOI] [PubMed] [Google Scholar]
- 42.National Heart, Lung, and Blood Institute (NHLBI). National Asthma Education and Prevention Program. Guidelines Implementation Panel Report for: Expert Panel Report 3—Guidelines for the diagnosis and management of asthma. Partners putting guidelines into action; Bethesda, MD: NHLBI; 2008. Available from: https://www.nhlbi.nih.gov/files/docs/guidelines/gip_rpt.pdf [Google Scholar]
- 43.San Juan Pollen and Fungal Spore Counts Station. Alergia a Hongos. Available from: https://www.facebook.com/Alergia-a-Hongos-358948227553568/ [last accessed 12 April 2018].