

Abstract
Agglomeration of nanoplastics in waters can alter their transport and fate in the environment. Agglomeration behavior of 4 nanoplastics differing in core composition (red‐ or blue‐dyed polystyrene) and surface chemistry (plain or carboxylated poly[methyl methacrylate] [PMMA]) was investigated across a salinity gradient. No agglomeration was observed for carboxylated PMMA at any salinity, whereas the plain PMMA agglomerated at only 1 g/L. Both the red and the blue polystyrene agglomerated at 25 g/L. Results indicate that both composition and surface chemistry can impact how environmental salinity affects plastic nanoparticle agglomeration. Environ Toxicol Chem 2021;40:1820–1826. © 2021 The Authors. Environmental Toxicology and Chemistry published by Wiley Periodicals LLC on behalf of SETAC.
Keywords: Nanoparticle, Plastic, Agglomeration, Salinity, Fate, Transport
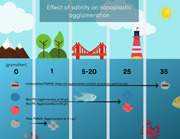
Nanoplastic agglomeration behavior across experimental salinity gradients varies depending on plastic type and surface chemistry. PMMA = poly(methyl methacrylate); PS = polystyrene.
INTRODUCTION
Nanoplastics, which refer to plastic particles with diameters <1000 nm (US Food and Drug Administration 2014; Joint Group of Experts on the Scientific Aspects of Marine Environmental Protection 2020), encompass a relatively new field of plastic pollution investigation. Nanoplastics entering the environment, either directly as components of waste streams or resulting from the breakdown of larger plastic particles in riverine and marine environments, represent a growing area of water quality concern because of the unique, size‐specific characteristics of nanomaterials (Klaine et al. 2012; Hernandez et al. 2017; Song et al. 2017). These distinct characteristics affect their fate and uptake; thus, bulk plastic behavior cannot be used as a proxy for determining nanoplastic behavior in the environment. Indeed, one study further provides evidence that nanoplastic fate and transport differ from those of microplastics (Sun et al. 2020). In particular, the large surface area to volume ratio of nanomaterials increases the reactivity of the surface, which can increase adsorption capabilities, thus altering their toxicity when compared to a particular material's bulk counterpart (Velzeboer et al. 2014). In addition, it is known that toxicity and organism uptake are dependent on the surface area and size of available particles. For instance, smaller microplastics (≤5 μm) can translocate to edible tissues such as fish fillets (Zeytin et al. 2020) and nanoplastics (≤50 nm) are demonstrated to translocate intracellularly and interfere with cell function (Gatoo et al. 2014).
Nanoplastics have been difficult to quantify in the environment because of the difficulty of separating and identifying the particles (see Brander et al. 2020), but their existence is undisputed (Besseling et al. 2019). Evidence has shown that nanoplastics can develop through the breakdown of larger bulk and micro‐sized plastics through a process called “nano‐fragmentation” (Koelmans et al. 2015). Because it is highly probable that nanoplastics are abundant, the physicochemical characterization of nanoplastics is essential in understanding their behavior in natural systems. Agglomeration, a physicochemical phenomenon where nanoparticles (NPs; including nanoplastics) associate into clusters of 2 or more particles, also impacts their behavior in waterways. Formation of nanoplastic agglomerates can impact the buoyant density of the plastics in the water column, changing their rate of deposition (Summers et al. 2018). In addition, if nanoplastics form heteroaggregates (combination of polymer types or binding with other naturally occurring particles), they may be more likely to deposit in river systems than reach the sea (Koelmans et al. 2015). Finally, as noted, organism uptake is a function of particle size, which is directly impacted by agglomeration behavior. Agglomeration is highly dependent on factors such as temperature, dissolved organic matter, and dissolved ions, which includes salinity (Summers et al. 2018; Singh et al. 2019).
Often, the fate and transport of particulates in water systems have been modeled using Derjaguin‐Landau‐Verwey‐Overbeak (DLVO) theory to predict agglomeration state. Extended DLVO theory considers many forces that influence colloids, including van der Waals attraction, electrostatic repulsion, steric repulsion, and magnetic attraction (Hotze et al. 2010). However, the application of this model to nanoplastics is unclear. Because of the complex nature of nanomaterials, including nanoplastics, the model may not always accurately describe their behavior. Surface charge and electrostatic activity in nano‐sized particles are often different from those in the bulk material as a result of several factors such as modified surface composition, the high proportion of surface molecules, crystal structure formation, and lack of spherical shape (Hotze et al. 2010). In addition, DLVO theory does not describe what happens to agglomerates, which, for plastics, may sink or float to the surface depending on polymer type or heteroaggregation. In some literature, the deposition of metal NPs occurs following agglomeration to form a mass great enough for gravity to have an impact (Besseling et al. 2017). This behavior may not apply to all nanoplastics because some have a lower density than water, leading to downstream transport rather than deposition (Nizzetto et al. 2016). Thus, to understand and predict agglomeration tendencies of nanoplastics as well as their modes of fate and transport, the effects of each of their unique physicochemical properties need to be explored.
Currently, little is known about the agglomeration of nanoplastics in natural systems. Some studies have demonstrated polystyrene nanoplastic agglomeration kinetics in water of both high and low ionic strength (Shams et al. 2020; Sun et al. 2020). However, no literature currently exists which investigates how particle composition impacts agglomeration behavior incrementally through a salinity gradient. The present study aimed to begin to close that gap in knowledge by investigating the agglomeration of 4 different commercially available nanoplastics, Polyspherex™ 50‐nm carboxylated poly(methyl methacrylate) (PMMA‐COOH) nanospheres, Polyspherex 50‐nm plain PMMA nanospheres, Visiblex™ 50‐nm red‐dyed polystyrene nanospheres, and Visiblex 50‐nm blue‐dyed polystyrene nanospheres in a salinity gradient that mimics transport from freshwater to ocean. Comparing the 2 PMMA types allowed us to investigate the effects of surface functionalization, whereas comparing the polystyrene types revealed effects of core chemical composition due to dye color. In addition, investigating both polystyrene and PMMA allowed us to compare the behavior of 2 commonly used plastics. Dynamic light scattering (DLS) was used to determine the hydrodynamic diameter of the nanoplastics in solution and is a valid technique for detecting agglomeration state, as employed by Wegner et al. (2012) and Singh et al. (2019). With the use of DLS, we chose to test nanospheres in the present study because they fit the assumptions of DLS theory.
METHODS
Both the Visiblex 50‐nm blue‐ and red‐dyed polystyrene nanospheres and Polyspherex 50‐nm carboxylated and plain PMMA nanospheres were purchased as 1% suspensions in 2 mM NaN3 and 0.1% Tween 20 in deionized water (Phosphorex). Table 1 shows the density, particle concentration, and primary particle diameter of each particle type from the manufacturer's lot analysis. Particle diameters are reported with a standard deviation (SD), demonstrating the homogeneity of the particle suspensions (Table 1). Scanning electron microscopic (SEM) images, captured on a Helios 650 Ultra Resolution Dual Beam FEG SEM, are presented in Supplemental Data, Figure S1.
Table 1.
Nanoplastic suspension properties provided by the manufacturer
| Material | Mean diameter ± SD (nm) | Density (g/cm3) | Particles/mL |
|---|---|---|---|
| Blue polystyrene | 55 ± 20 | 1.05 | 1.09E+14 |
| Red polystyrene | 62 ± 16 | 1.05 | 7.69E+13 |
| PMMA | 60 ± 13 | 1.19 | 7.53E+13 |
| PMMA‐COOH | 55 ± 9 | 1.19 | 9.65E+13 |
SD = standard variation; PMMA = poly(methyl methacrylate); PMMA‐COOH = carboxylated PMMA.
The plastic NP suspensions received from the manufacturer were dialyzed using 10‐kDa molecular weight cutoff SnakeSkin dialysis tubing (Fisher Scientific, catalog no. 68100) to remove the surfactants and preservatives from the solution. The initial volume of the suspension was recorded, and then the suspension was placed in the dialysis tubing. Tubing was placed in 5 L of reverse‐osmosis water and gently stirred for 7 d, with the water being replaced daily. At the end of the 7‐d period, the final volume was recorded and the final percentage weight of nanoplastics calculated.
Eight stock salinity solutions (250 mL each) ranging from 0 to 35 g/L (0–35 ppt) salinity in increments of 5 g/L were prepared in media bottles using Imagitarium Pacific Ocean Water and Milli‐Q water. The pH and conductivity were measured using a VWR sympHony B30PCI Benchtop Meter. Conductivities were converted to salinities via the equation 0.64 × C (in milli‐Siemens per centimeter) = salinity (in grams per liter). Before testing, dialyzed NP suspensions were bath sonicated for 5 min. The Pacific Ocean Water stock saline solutions were filtered through a 0.22‐μm cellulose acetate filter prior to use. Plastic NPs were then added to the solutions to achieve a particle concentration of 10 mg/L in 8 mL of solution. Two replicates were prepared by pipetting 2.5 mL of solution into each of 2 disposable cuvettes for immediate analysis of hydrodynamic diameter by DLS using a Malvern Zetasizer Nano ZS. Zeta potential was measured by preparing 4 mL of 1 g/L salinity NP solution using the steps described, then adding 1 mL via syringe to a folded capillary zeta cell. Zeta potential was taken at this single salinity for all plastics to determine any inherent charge differences between them. One experimental replicate was analyzed for each plastic.
Initially, plastics were tested at a broad range of salinities to loosely gauge their agglomeration points. The PMMA plastics were tested in each prepared stock solution, and the polystyrene plastics were tested in stocks ranging from 0 to 25 g/L. At and above 25 g/L, large polystyrene aggregates (shown as multiple peaks in Supplemental Data, Figure S2) exceeded the detection range of the DLS. The observance of multiple peaks on DLS significantly decreases the confidence in the agglomerate size readings because of the artificial cutting off of data. This means that both the red and blue polystyrene NPs undergo significant agglomeration in ocean water (≥25 g/L), beyond the detection capabilities of the DLS. To ensure reliable data collection, the experimental salinity range of the polystyrene nanospheres was capped at 25 g/L, where significant peaks were captured within the instrument's range, rather than 35 g/L like the PMMA counterparts. When a key transition point was identified, dilutions were performed using the stock solutions to test the particles in between the stock salinities to illuminate the salinity at which the nanoplastics transition from single particles to agglomerates in suspension.
Data were fit to regression curves and analyzed using SigmaPlot, Ver 13.0 (Systat Software). A 2‐way analysis of variance (ANOVA) was performed on both the pair of PMMA plastics and the pair of polystyrene plastics across salinities. Statistical significance was set at p ≤ 0.05 for all analyses. Because only 2 replicates were performed, the raw data were plotted in lieu of an average with an SD.
RESULTS
Stock solutions and plastic particles
The results from the conductivity and pH tests to characterize the stock solutions used in experiments are shown in Tables 2 and 3. Initial pH and post‐24‐h pH values were recorded to verify the stability of the solutions.
Table 2.
Measured salinity and conductivity data for the stock solutions
| Target salinity (g/L) | Conductivity (mS/cm) | Calculated salinity (g/L) |
|---|---|---|
| 1 | 1.734 | 1.11 |
| 5 | 8.61 | 5.51 |
| 10 | 14.52 | 9.29 |
| 15 | 20.6 | 13.18 |
| 20 | 27.4 | 17.54 |
| 25 | 32.6 | 20.86 |
| 30 | 39.2 | 25.09 |
| 35 | 44.6 | 28.54 |
Table 3.
Measured pH of stock solutions initially and after 24 ha
| Salinity (g/L) | Initial pH | SD | pH after 24 h | SD |
|---|---|---|---|---|
| 5 | 8.34 | 0.07 | 7.63 | 0.02 |
| 10 | 8.45 | 0.01 | 8.37 | 0.01 |
| 15 | 8.42 | 0.00 | 8.32 | 0.04 |
| 20 | 8.43 | 0.01 | 8.35 | 0.01 |
| 25 | 8.33 | 0.01 | 8.32 | 0.04 |
| 30 | 8.29 | 0.01 | 8.28 | 0.01 |
| 35 | 8.23 | 0.00 | 8.29 | 0.01 |
Each pH measurement was duplicated.
SD = standard deviation.
Results from zeta‐potential characterization of each nanoplastic are shown in Figure 1. The zeta potentials of both the red polystyrene and COOH PMMA were each significantly different from the other 3 plastics. The blue polystyrene and plain PMMA had zeta potentials significantly different from the red polystyrene and COOH PMMA but not significantly different from each other.
Figure 1.
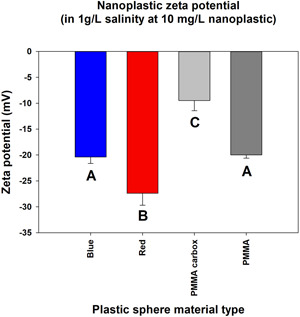
Mean zeta‐potential values for each nanoplastic in 1 g/L salinity. Distinct letters indicate a significant difference. PMMA = poly(methyl methacrylate).
Polystyrene agglomeration
The agglomeration behavior (Figure 2) of the polystyrene nanospheres increased for both materials as salinity increased. Because of the increased agglomeration, often large aggregates that represented relatively small proportions of the suspended particles exceeded the range of DLS, resulting in inaccurate calculations of Z‐average as a result of the lack of sample monodispersity. As such, we performed our analysis based on the average size of the primary peak distribution identified by the DLS. Plots including both primary and secondary peak distributions are included in Supplemental Data, Figure S2. We found that the agglomeration behavior of the red polystyrene nanospheres compared to blue polystyrene nanospheres was not significantly different when comparing primary peak size across salinity (p = 0.283 and 0.817, 2‐way ANOVA). The point of significant agglomeration for both the red‐ and blue‐dyed polystyrene nanospheres was at a salinity of 25 g/L. Both sets of primary peak data were fit to a 3‐component sigmoidal model, with all data points falling within the 95% prediction band (Figure 2).
Figure 2.
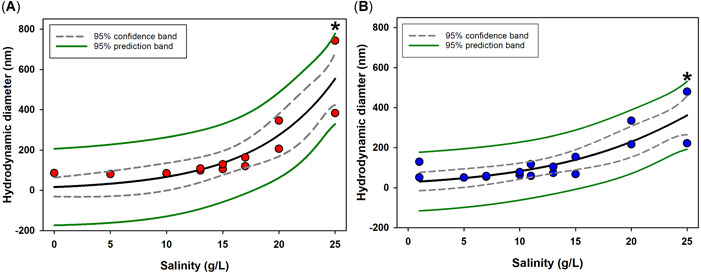
Hydrodynamic diameter comparison of 50 nm Visiblex blue‐ and red‐dyed polystyrene nanospheres in 0 to 25 g/L salinity gradient. Gray dashed and solid green lines indicate 95% confidence and prediction bands, respectively, for regression fit, shown as a solid black line. *Significant change in hydrodynamic diameter.
PMMA agglomeration
To maintain consistency between the polystyrene and PMMA methodologies, the average size of the primary peak distributions was used for PMMA analysis. Plots including both primary and secondary peak distributions are included in Supplemental Data, Figure S3. As opposed to the results found for polystyrene, Figure 3A shows the plain PMMA significantly agglomerated as soon as the solution contained even a slight amount of Pacific Ocean Water (1 g/L salinity or greater) when compared to the agglomeration in the absence of salinity (p < 0.05 for each). This indicates an agglomeration point between 0 and 1 g/L salinity for this type of nanoplastic. These data also fit relatively well to a 3‐component sigmoidal model, with all points falling within the 95% prediction band and supporting the use of the sigmoidal model, which assumes some upper boundary of agglomeration, as is seen in the data for these particles (Figure 2A). In contrast, the carboxylated PMMA does not have a clear agglomeration point, and the particles remained stable and near their primary particle size throughout the salinity gradient (Figure 2B). Hydrodynamic diameter (HDD) did not significantly differ across the tested salinities (p = 1.00); thus, a simple linear polynomial model best fit the data. As such, in the presence of any salinity, the agglomeration behavior of plain and carboxylated PMMA surface chemistries resulted in significantly different HDDs. No significant agglomeration was observed for carboxylated PMMA at any salinity.
Figure 3.
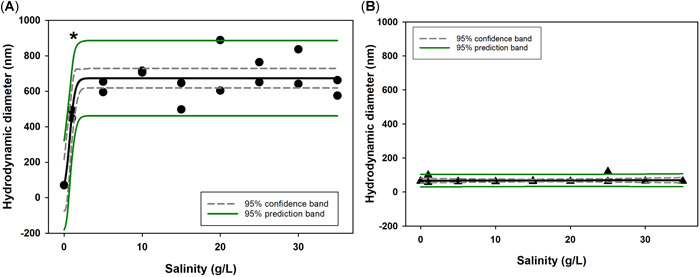
Hydrodynamic diameter comparison of 50 nm Polyspherex plain and carboxylated poly(methyl methacrylate) nanospheres in 0 to 35 g/L salinity gradient. Gray dashed and solid green lines indicate 95% confidence and prediction bands, respectively, for regression fit, shown as a solid black line. *Significant change in hydrodynamic diameter.
DISCUSSION
Interestingly, COOH PMMA had the closest zeta potential to zero despite its lack of agglomeration across the salinity gradient. Furthermore, plain PMMA is the only plastic that agglomerated severely at the lowest salinity despite having a zeta potential similar to blue polystyrene and higher than COOH PMMA. One explanation for these results is that the COOH group has been shown to stabilize particles even when zeta potential is near zero (Surette and Nason 2019). In addition, the nanoplastics we studied using DLS have not clearly followed the trends we observe for metal NPs. The discrepancy between zeta potential and agglomeration behavior in plain PMMA versus polystyrene could be due to density differences or overall lack of inherent charge on the plastic particles. The zeta‐potential results reveal the inherent charge differences between the nanoplastics studied but cannot necessarily be used to compare or predict stability. The fact that plain PMMA and polystyrene plastics agglomerate in the salinity range between freshwater and ocean water means that their fates, modes of transport, and organism uptake in saline aquatic systems likely differ from their behavior in freshwater systems. Nanoparticle agglomerates have been shown to settle out of suspension, leading to deposition out of the water column as a result of gravitational forces (Hotze et al. 2010; Besseling et al. 2017). If this is the case for these polystyrene and plain PMMA agglomerates, they may settle in the sediment within estuarine zones and never reach the ocean (Sun et al. 2020). However, nanoplastic agglomerates will not necessarily sink because their density could be low enough that they remain suspended in the water column or even float to the surface and form mats. Unlike other NPs, like metals, which are significantly denser than water, many nanoplastics have densities similar to water, which may allow nanoplastic agglomerates to be transported to the ocean despite significant agglomeration. The densities of polystyrene (1.05 g/cm3) and PMMA (1.19 g/cm3) are both greater than that of water (~1 g/cm3), but polystyrene has the potential to remain suspended considering how near it is to the density of water. For example, polyvinyl chloride nanoplastics with a density of 1.4 g/cm3 have been found to disperse in a water column, rather than settle out of solution like their macro counterparts (Ter Halle et al. 2017). However, the fate of the agglomerates remains uncertain because detection over time is required to determine whether they sink or float, particularly because the physical and chemical properties of plastics also change with aging (Luo et al. 2020).
It is also important to note that because of the distinct change in plastic particle size, both the polystyrene nanoplastics and plain PMMA will likely affect freshwater and estuarine organisms differently from marine organisms of a similar size class. Some research has shown that large agglomerates are not taken up by cells as readily as primary particles and may not be able to translocate into the tissues of an organism (Limbach et al. 2005; Gatoo et al. 2014). If this is the case, polystyrene and plain PMMA may be less harmful to organisms in the estuary/ocean than in freshwater. However, large particles can be dangerous to organisms as well. One concern is blockage of the gastrointestinal tract in some species. For example, plankton such as Daphnia use their appendages to ingest particles ranging from approximately 100 to 5000 nm in diameter as adults, with a preference for particles of approximately 500 nm (Gophen and Geller 1984). In addition, in other research, polymer particles of approximately 500 nm were found to be more toxic to the freshwater organism Ceriodaphnia dubia than similar particles of larger size, likely a result of higher rates of ingestion (Slattery et al. 2019). A recent meta‐analysis on the effects of virgin micro‐ and nanoplastics in fishes concluded that particles up to a size of 20 µm or 20 000 nm were most likely to be toxic because of their ability to interact with cells or to pass through an epithelial barrier (Jacob et al. 2020). These findings suggest that if agglomerates stabilize at a certain size, they could become even more toxic to some organisms than at their primary particle size. This could be the case for plain PMMA because these particles seem to remain near the 500 to 1000 nm range once agglomerated (Figure 3).
Regarding carboxylated PMMA, it is evident from comparison of the 2 PMMA types that the carboxyl group's presence plays a role in limiting agglomeration behavior. Despite having the lowest zeta potential (Table 4), carboxylated PMMA did not agglomerate at any salinity. This distinct behavior could potentially contribute to different modes of transport and biological interaction from what would be observed for plain PMMA. The lack of agglomeration in carboxylated PMMA agrees with other research which showed the carboxylic acid functional group on NPs leading to increased particle stability by countering van der Waals attraction between particles (Ntim et al. 2011; Talaei et al. 2011). In work by Gomes et al. (2020), 50‐nm plain PMMA agglomerated in solution of high salinity, whereas 50‐nm carboxylated PMMA remained at primary particle size. Despite this evident stability, these particles still may agglomerate under other conditions. For instance, the excess of H+ ions at a lower pH can reduce electrostatic repulsion and higher temperature can increase kinetics, resulting in agglomeration (Hotze et al. 2010; Singh et al. 2019). If carboxylated PMMA remains at primary particle size in the environment, it is likely to remain suspended in the water column throughout the salinity gradient and to be transported to the marine environment. Furthermore, stability at primary particle size means that the particles may enter the tissues of some organisms more easily, potentially causing harmful effects. Conversely, the particles may be too small for other organisms to take up, thus making less of an impact than large agglomerates. In contrast to polystyrene and plain PMMA, carboxylated PMMA will likely have consistent biological interactions from freshwater to ocean water because it remains at primary particle size.
Table 4.
Mean zeta‐potential values for each nanoplastic in 1 g/L salinity
| Polystyrene | Poly(methyl methacrylate) | |||
|---|---|---|---|---|
| Red | Blue | Plain | Carboxylated | |
| Zeta (mV) | –27.4 | –20.4 | –20.0 | –9.5 |
Although the present study was able to model nanoplastic agglomeration across a salinity gradient, it does not quantify other factors that may impact agglomeration behavior such as presence of natural organic matter, temperature, or other dissolved substances. It should be noted that naturally occurring dissolved and particulate organic matter can also significantly impact the agglomeration state of NPs (Smith et al. 2015). This organic matter, as well as other chemicals in the environment, can adsorb to the particle surface and alter the stability of particles in suspension. Additional work will be required to characterize and model nanoplastic agglomeration in complex systems where heteroagglomeration between different polymer types is likely to occur. Finally, traditional colloidal models may be able to accurately describe fate and transport once the nanoplastics are agglomerated because the unique properties inherent to their nanoscopic size will no longer be in effect; however, additional research is needed to determine the applicability of these traditional colloid models (de la Fuente et al. 2021). The distinct behavior of agglomerates compared to primary particles also changes their biological impact and toxicity, meaning that organisms that live upstream versus within the estuarine zone could be affected differently by the presence of nanoplastics.
CONCLUSIONS
As nanoplastics become more prevalent in the environment, it is important to develop models that can accurately predict their fate and transport. Because colloidal fate and transport models are primarily driven by particle size and density for larger colloids, understanding the dynamic nature of particle agglomerate sizes across environments should improve the predictability of those models. Our study shows that both the environmental salinity and the physicochemical characteristics of the NP (aside from density and primary particle size) dynamically alter nanoscale agglomeration. Thus, when considering the transport and fate models for nanoplastics and when considering the implications of DLVO theory, the additional impacts of varying environmental salinities should be considered as well as density differentials between the particles and the environmental media.
Supplemental Data
The Supplemental Data are available on the Wiley Online Library at https://doi.org/10.1002/etc.5030.
Disclaimer
The authors have no conflicts of interest to report.
Author Contributions Statement
H.J Shupe and K.M. Boenisch contributed equally to the preparation of the present study and were responsible for conducting the experiments and preparing the manuscript; B.J. Harper provided the materials and the training on the DLS as well as contributing to the experimental design; S.M. Brander helped to develop the project as a co–principal investigator and gave feedback on experimental design; S.L. Harper worked to develop the project and contributed to the development of the manuscript and experimental design.
Supporting information
This article contains online‐only Supplemental Data.
Supporting information.
Acknowledgment
We thank A. Renda for her artistic contributions in the development of the graphical abstract. This material is based on work supported by the National Science Foundation's Growing Convergence Research Big Idea under grants 1935028 and 1935018 to S.L. Harper and the National Institutes of Health's Outstanding New Environmental Scientist program through grant ES017552 to S.L. Harper. We also thank several members of the Pacific Northwest Consortium on Plastics for thoughtful comments during the preparation of this article.
Data Availability Statement
Please contact the corresponding author (stacey.harper@oregonstate.edu) for any meta‐data or calculations not already provided.
REFERENCES
- Besseling E, Quik JTK, Sun M, Koelmans AA. 2017. Fate of nano‐ and microplastic in freshwater systems: A modeling study. Environ Pollut 220:540–548. [DOI] [PubMed] [Google Scholar]
- Besseling E, Redondo‐Hasselerharm P, Foekema EM, Koelmans AA. 2019. Quantifying ecological risks of aquatic micro‐and nanoplastic. Crit Rev Environ Sci Technol 49:32–80. [Google Scholar]
- Brander SM, Renick V, Foley M, Lusher A, Steele C, Carr S, Helm P, Box C, Andrews B, Rochman C. 2020. Sampling and QA/AC: A guide for scientists investigating the occurrence of microplastics across matrices. Appl Spectrosc 74:1099–1125. [DOI] [PubMed] [Google Scholar]
- de la Fuente R, Drótos G, Hernández García E, López C, van Sebille E. 2021. Sinking microplastics in the water column: Simulations in the Mediterranean Sea. Ocean Science 17:431–453. [Google Scholar]
- Gatoo MA, Naseem S, Arfat MY, Dar AM, Qasim K, Zubair S. 2014. Physicochemical properties of nanomaterials: Implication in associated toxic manifestations. Biomed Res Int 2014:498420. [DOI] [PMC free article] [PubMed] [Google Scholar]
- Gomes T, Almeida AC, Georgantzopoulou A. 2020. Characterization of cell responses in Rhodomonas baltica exposed to PMMA nanoplastics. Sci Total Environ 726:138547. [DOI] [PubMed] [Google Scholar]
- Gophen M, Geller W. 1984. Filter mesh size and food particle uptake by Daphnia. Oecologia 64:408–412. [DOI] [PubMed] [Google Scholar]
- Hernandez LM, Yousefi N, Tufenkji N. 2017. Are there nanoplastics in your personal care products? Environ Sci Technol Lett 4:280–285. [Google Scholar]
- Hotze EM, Phenrat T, Lowry GV. 2010. Nanoparticle aggregation: Challenges to understanding transport and reactivity in the environment. J Environ Qual 39:1909–1924. [DOI] [PubMed] [Google Scholar]
- Jacob H, Besson M, Swarzenski PW, Lecchini D, Metian M. 2020. Effects of virgin micro- and nanoplastics on fish: Trends, meta-analysis, and perspectives. Environ Sci Technol 54:4733–4745. [DOI] [PubMed] [Google Scholar]
- Joint Group of Experts on the Scientific Aspects of Marine Environmental Protection . 2020. Proceedings of the GESAMP International Workshop on assessing the risks associated with plastics and microplastics in the marine environment. Report 103. United Nations Environment Programme, Nairobi, Kenya.
- Klaine SJ, Koelmans AA, Horne N, Handy RD, Kapustka L, Nowack B, von der Kammer F. 2012. Paradigms to assess the environmental impact of manufactured nanomaterials. Environ Toxicol Chem 31:3–14. [DOI] [PubMed] [Google Scholar]
- Koelmans AA, Besseling E, Shim WJ. 2015. Nanoplastics in the aquatic environment. Critical review. In Bergmann M, Gutow L, Klages M, eds, Marine Anthropogenic Litter. Springer Nature, Cham, Switzerland, pp 325–340. [Google Scholar]
- Limbach LK, Li Y, Grass RN, Brunner TJ, Hintermann MA, Muller M, Gunther D, Stark WJ. 2005. Oxide nanoparticle uptake in human lung fibroblasts: Effects of particle size, agglomeration, and diffusion at low concentrations. Environ Sci Technol 39:9370–9376. [DOI] [PubMed] [Google Scholar]
- Luo H, Zhao Y, Li Y, Xiang Y, He D, Pan X. 2020. Aging of microplastics affects their surface properties, thermal decomposition, additives leaching and interactions in simulated fluids. Sci Total Environ 714:136862. [DOI] [PubMed] [Google Scholar]
- Nizzetto L, Bussi G, Futter MN, Butterfield D, Whitehead PG. 2016. A theoretical assessment of microplastic transport in river catchments and their retention by soils and river sediments. Environ Sci Process Impacts 18:1050–1059. [DOI] [PubMed] [Google Scholar]
- Ntim SA, Sae‐Khow O, Witzmann FA, Mitra S. 2011. Effects of polymer wrapping and covalent functionalization on the stability of MWCNT in aqueous dispersions. J Colloid Interface Sci 355:383–388. [DOI] [PMC free article] [PubMed] [Google Scholar]
- Shams M, Alam I, Chowdhury I. 2020. Aggregation and stability of nanoscale plastics in aquatic environment. Water Res 171:115401. [DOI] [PubMed] [Google Scholar]
- Singh N, Tiwari E, Khandelwal N, Darbha GK. 2019. Understanding the stability of nanoplastics in aqueous environments: Effect of ionic strength, temperature, dissolved organic matter, clay, and heavy metals. Environ Sci Nano 6:2968–2976. [Google Scholar]
- Slattery M, Harper B, Harper S. 2019. Pesticide encapsulation at the nanoscale drives changes to the hydrophobic partitioning and toxicity of an active ingredient. Nanomaterials (Basel) 9:81. [DOI] [PMC free article] [PubMed] [Google Scholar]
- Smith BM, Pike DJ, Kelly MO, Nason JA. 2015. Quantification of heteroaggregation between citrate‐stabilized gold nanoparticles and hematite colloids. Environ Sci Technol 49:12789–12797. [DOI] [PubMed] [Google Scholar]
- Song YK, Hong SH, Jang M, Han GM, Jung SW, Shim WJ. 2017. Combined effects of UV exposure duration and mechanical abrasion on microplastic fragmentation by polymer type. Environ Sci Technol 51:4368–4376. [DOI] [PubMed] [Google Scholar]
- Summers S, Henry T, Gutierrez T. 2018. Agglomeration of nano‐ and microplastic particles in seawater by autochthonous and de novo–produced sources of exopolymeric substances. Mar Pollut Bull 130:258–267. [DOI] [PubMed] [Google Scholar]
- Sun H, Jiao R, Wang D. 2020. The difference of aggregation mechanism between microplastics and nanoplastics: Role of Brownian motion and structural layer force. Environ Pollut 268:115942. [DOI] [PubMed] [Google Scholar]
- Surette MC, Nason JA. 2019. Nanoparticle aggregation in a freshwater river: The role of engineered surface coatings. Environ Sci Nano 6:540–553. [Google Scholar]
- Talaei Z, Mahjoub AR, Rashidi AM, Amrollahi A, Meibodi ME. 2011. The effect of functionalized group concentration on the stability and thermal conductivity of carbon nanotube fluid as heat transfer media. Int J Heat Mass Transf 38:513–517. [Google Scholar]
- Ter Halle A, Jeanneau L, Martignac M, Jardé E, Pedrono B, Brach L, Gigault J. 2017. Nanoplastic in the North Atlantic Subtropical Gyre. Environ Sci Technol 51:13689–13697. [DOI] [PubMed] [Google Scholar]
- US Food and Drug Administration . 2014. Considering whether an FDA‐regulated product involves the application of nanotechnology. FDA‐2010‐D‐0530. Technical Report. Silver Spring, MD.
- Velzeboer, I, Kwadijk, CJAF, Koelmans AA. 2014. Strong sorption of PCBs to nanoplastics, microplastics, carbon nanotubes and fullerenes. Environ Sci Technol 48:4869–4876. [DOI] [PubMed] [Google Scholar]
- Wegner A, Besseling E, Foekema EM, Kamermans P, Koelmans AA. 2012. Effects of nanopolystyrene on the feeding behaviour of the blue mussel (Mytilus edulis L.). Environ Toxicol Chem 31:2490–2497. [DOI] [PubMed] [Google Scholar]
- Zeytin S, Wagner G, Mackay‐Roberts N, Gerdts G, Schuirmann E, Klockmann S, Slater M. 2020. Quantifying microplastic translocation from feed to the fillet in European sea bass Dicentrarchus labrax . Mar Pollut Bull 156:111210. [DOI] [PubMed] [Google Scholar]
Associated Data
This section collects any data citations, data availability statements, or supplementary materials included in this article.
Supplementary Materials
This article contains online‐only Supplemental Data.
Supporting information.
Data Availability Statement
Please contact the corresponding author (stacey.harper@oregonstate.edu) for any meta‐data or calculations not already provided.