

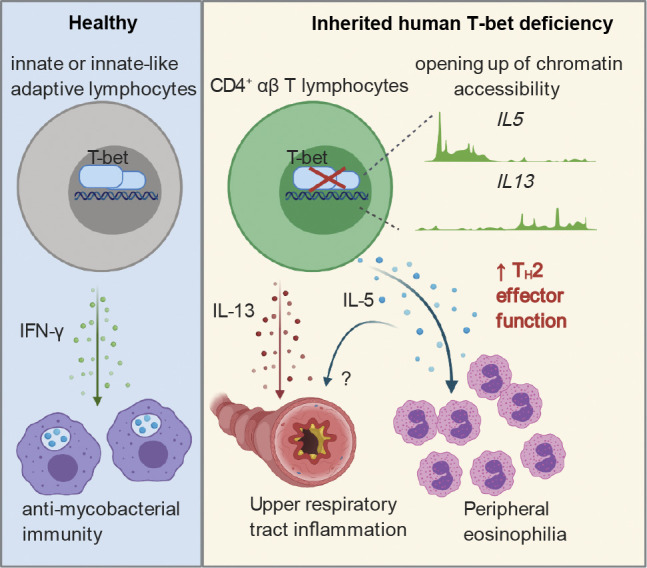
This study describes the multiple facets and molecular basis of excessive Th2 cytokine production by CD4+ αβ T lymphocytes as a possible mechanism underlying persistent upper airway inflammation and blood eosinophilia in a patient with inherited complete T-bet deficiency.
Abstract
We have described a child suffering from Mendelian susceptibility to mycobacterial disease (MSMD) due to autosomal recessive, complete T-bet deficiency, which impairs IFN-γ production by innate and innate-like adaptive, but not mycobacterial-reactive purely adaptive, lymphocytes. Here, we explore the persistent upper airway inflammation (UAI) and blood eosinophilia of this patient. Unlike wild-type (WT) T-bet, the mutant form of T-bet from this patient did not inhibit the production of Th2 cytokines, including IL-4, IL-5, IL-9, and IL-13, when overexpressed in T helper 2 (Th2) cells. Moreover, Herpesvirus saimiri–immortalized T cells from the patient produced abnormally large amounts of Th2 cytokines, and the patient had markedly high plasma IL-5 and IL-13 concentrations. Finally, the patient’s CD4+ αβ T cells produced most of the Th2 cytokines in response to chronic stimulation, regardless of their antigen specificities, a phenotype reversed by the expression of WT T-bet. T-bet deficiency thus underlies the excessive production of Th2 cytokines, particularly IL-5 and IL-13, by CD4+ αβ T cells, causing blood eosinophilia and UAI. The MSMD of this patient results from defective IFN-γ production by innate and innate-like adaptive lymphocytes, whereas the UAI and eosinophilia result from excessive Th2 cytokine production by adaptive CD4+ αβ T lymphocytes.
Graphical Abstract
Introduction
Inherited human T-bet deficiency causes susceptibility to mycobacterial infection by disrupting both the development of innate or innate-like adaptive lymphocytes, including natural killer (NK), invariant NK T (iNKT), mucosal-associated invariant T, and Vδ2+ γδ T cells, and their production of IFN-γ (Yang et al., 2020). By contrast, the patient’s purely adaptive T lymphocytes produce IFN-γ normally in response to mycobacterial antigens. The patient described here also displays persistent upper airway inflammation (UAI) and blood eosinophilia, which were not explored mechanistically in our previous report. Little is known about the genetic and immunological basis of airway inflammation or hyperresponsiveness in humans. Patients with rare loss-of-function or hypomorphic variants of DOCK8, IL6R, TGFBR1, TGFBR2, CARD11, IKBKG, CARD14, and CARML2, or with gain-of-function mutations of JAK1, are prone to asthma (Gruber et al., 2020; Del Bel et al., 2017; Dorjbal et al., 2019; Mark et al., 2012; Peled et al., 2019; Wang et al., 2016; Spencer et al., 2019; Freeman and Holland, 2009; Zhang et al., 2009; Tangye et al., 2017; MacCarrick et al., 2014; Milner, 2020; Lyons and Milner, 2018). These patients typically display other manifestations of hyper–T helper type 2 (Th2) cell diathesis or allergy, including high serum IgE levels, food allergy, urticaria, and atopic dermatitis, collectively known as primary atopic disorders. Genetic deficiencies underlying peripheral eosinophilia overlap considerably with these primary atopic disorders (Williams et al., 2015). However, no clear genetic or immunological mechanism has yet been identified in patients with isolated UAI and blood eosinophilia in the absence of other Th2 cell diatheses.
Interestingly, the T-bet protein is down-regulated in the airways of human patients with asthma (Finotto et al., 2002). Moreover, a common variant of TBX21 is associated with susceptibility to asthma, albeit with only a small effect (Raby et al., 2006). Finally, the H33Q common variant of TBX21 is associated with the improvement of asthma with the use of inhaled corticosteroids (Tantisira et al., 2004). In mice, a lack of T-bet (Tbx21−/−) leads to spontaneous airway hyperresponsiveness (AHR) resembling asthma, but without the need for allergic sensitization (Finotto et al., 2002). Both spontaneous and allergen-induced types of AHR are mediated by at least four known mechanisms: (1) overproduction of a Th2 cytokine, IL-13 (Finotto et al., 2005), which acts as a primary regulator of mucus cell metaplasia and mucus hypersecretion in the airways (Gour and Wills-Karp, 2015; Fujiwara et al., 2007); (2) changes in the calcium homeostasis of airway smooth muscle cells, with an increase in baseline airway tone that may be dependent on or independent of IL-13 (Bergner et al., 2006); (3) a greater responsiveness of airway smooth muscle cells to platelet-derived growth factor, contributing to airway hyperplasia (Singer, 2011); and (4) aberrant neutrophilic airway inflammation mediated by a dysregulation of Th17 cell differentiation (Fujiwara et al., 2007; Durrant et al., 2009). In addition to IL-13, other Th2 cytokines, such as IL-4 and IL-5, are produced in abnormally large amounts in Tbx21−/− mice. However, these cytokines appear to be dispensable for AHR (Finotto et al., 2005, 2002). In addition to regulating AHR, T-bet can also suppress local eosinophil recruitment in mice (Matsuki et al., 2017; Glanville et al., 2016). We therefore tested the hypothesis that human T-bet deficiency underlies UAI and blood eosinophilia by enhancing the production of one or more Th2 cytokines.
Results
Persistent AHR in human T-bet deficiency
As previously reported, the patient (P; Fig. 1 A), who is now 5 yr old, has autosomal recessive complete T-bet deficiency (Yang et al., 2020). He developed disseminated Bacillus Calmette–Guérin (BCG) infection at the age of 3 mo, which was cured by antimycobacterial antibiotic therapy. P was hospitalized for 5 d for upper AHR at the age of 11 mo, requiring treatment with inhaled corticosteroids and albuterol. He was also found to have blood eosinophilia (1,460/mm3; normal range: 100–600/mm3). The clinical manifestations in the upper respiratory tract of rhinorrhea, breathing difficulties, wheezing, and coughing have persisted ever since. These symptoms appear to be independent of environmental triggers, such as exercise, cold air, change of season, food, or parasitic infections. Food allergy, atopic dermatitis, high serum IgE concentration, and urticaria have never been documented in P. Bronchial provocation tests with direct or indirect stimuli have not been performed in P due to his young age. He requires twice-daily treatment with inhaled fluticasone and frequent visits (∼10 visits/yr) to the emergency room, with hospitalization for 2–3 d, about once monthly, for acute exacerbations of UAI requiring treatment with oral or intravenous corticosteroids and inhaled salbutamol. P’s symptoms seem to have improved recently, and he was not hospitalized during the last year. His peripheral eosinophil count has remained high (2,849/mm3; normal range: 100–600/mm3), but counts of neutrophils, basophils, lymphocytes, and monocytes were found to be normal during a regular check-up at the age of 4 yr. However, P suffered two wheezing episodes requiring 5 d of treatment with oral prednisolone at a dose of 2 mg/kg/d. P has had no episodes of severe bronchiolitis caused by respiratory syncytial virus or rhinovirus infection, which have been linked to an increased risk of asthma or reactive airway disease later in life (Lotz et al., 2013; Sigurs et al., 2010; Stein et al., 1999; Carroll et al., 2009; Jackson et al., 2008). P’s plasma tested negative for these viruses with VirScan (Yang et al., 2020). His parents are healthy, with no history of smoking or asthma. P’s brother has a history of allergic rhinitis only. We investigated whether the upper respiratory tract inflammation of P was due to an unrecognized allergy. We used the Allergy Explorer to map the plasma IgE profiles of P and controls against 282 potential allergens. Plasma IgE specific for grass pollen, tree pollen, and house dust mite was found in individuals with known allergies (Fig. 1 B). The plasma of P’s brother, who has allergic rhinitis, gave a positive reaction for mites, and contained seafood-specific IgE. However, no IgE specific for any of the 282 allergens tested, other than wasp venom, was detected in P’s plasma (Fig. 1 B). Thus, like Tbx21−/− C57BL/6 mice (Finotto et al., 2005, 2002), this patient with inherited T-bet deficiency suffers from an uncommon form of persistent, spontaneous, and apparently nonallergic hyperresponsiveness of the upper respiratory tract with blood eosinophilia.
Figure 1.

Neither overproduced nor endogenous Mut T-bet can suppress Th2-cytokines. (A) Pedigree of the previously reported kindred including a patient (P) with human T-bet deficiency. (B) Results of screening for IgE against 282 allergens with the ALEX Allergy Explorer. One healthy control (CTRL), positive controls (patients with known allergy and atopy), P (M/M), P’s brother (WT/WT), and his heterozygous parents (WT/M). (C) Naive CD4+ T cells from CTRLs were expanded under Th0 cell–, Th1 cell–, and Th2 cell–polarizing conditions. Cells were transduced with EV, WT, or Mut TBX21 cDNA expressed with a bicistronic CD271 surface reporter sequence. ICS for IL-13 and T-bet in response to P/I stimulation in nontransduced (NT) or CD271+ transduced cells is shown. (D–F) Percentage of cells, either CD271− or CD271+, producing IL-13 (D), IL-9 (E), and IL-5 (F), as in C. (G) Transduced cells were identified on the basis of their surface expression of the bicistronic reporter CD271, isolated by MACS, stimulated with P/I, and subjected to RT-qPCR analysis of IL5 expression. (H–L) Th2 cells isolated as in G were stimulated by incubation with anti-CD3/CD28 mAbs for 3 d. Culture supernatants were analyzed for IL-4 (H), IL-5 (I), IL-13 (J), IL-10 (K), and TNF-α (L) with LEGENDplex. (M–O) The spontaneous production of IL-5 (M), IL-10 (N), and IL-22 by HVS-T cells from CTRL and M/M individuals was assessed with the LEGENDplex assay. In D–F, bars represent the mean and the SEM. In G–O, bars represent the mean and the SD. Dots represent individual samples and technical replicates. Two-way ANOVA was used in D–F. One-way ANOVA was used in G–O. In D–O, *, P < 0.05; **, P < 0.01; ***, P < 0.001; ****, P < 0.0001. All experimental data, except for the ALEX allergy screen, were verified in at least two independent experiments.
The pathogenic TBX21 variant fails to suppress Th2 cytokine production by human CD4+ T cells
T-bet represses Th2 cell lineage commitment by preventing the transcription factor GATA-3 from binding to its target DNA and suppressing GATA-3 expression (Hwang et al., 2005; Usui et al., 2006; Zhu et al., 2012). Through these mechanisms, T-bet suppresses the production of Th2 cytokines, such as IL-4, IL-5, IL-9, and IL-13. We investigated the suppression of Th2 cytokines by T-bet, by the retroviral transduction of naive CD4+ T cells from healthy donors that had been expanded under Th0-, Th1-, and Th2-polarizing conditions with empty vector (EV), WT, or mutant (Mut) T-bet. The transduced cells also expressed a bicistronic CD271 surface reporter for magnetic-activated cell sorting (MACS) and surface staining (Fig. S1 A). Consistent with a previous report that Mut T-bet is less stable than WT T-bet (Yang et al., 2020), cells overexpressing Mut T-bet had smaller amounts of intracellular T-bet (Fig. S1 A). Th1 cell polarization induced higher levels of T-bet, while Th2 cell polarization increased the expression of GATA-3 (Fig. 1 C; and Fig. S1, B and C). The overexpression of WT, but not Mut, T-bet slightly reduced the expression of GATA-3 in healthy donors’ CD4+ T cells expanded under Th0, Th1, and Th2 conditions (Fig. S1, B and C). As expected, the intracellular production of Th2 cytokines, including IL-5, IL-9, and IL-13, was enhanced by Th2 cell polarization but suppressed by Th1 cell polarization (Fig. 1, C–F; and Fig. S1, D and E). The overexpression of WT, but not Mut, T-bet induced high levels of intracellular IFN-γ production (data not shown) and repressed the production of IL-13 by Th0 and Th2 cells (Fig. 1, C and D; and Fig. S1 D). Similarly, the production of IL-5 and IL-9 by Th2 cells was suppressed by the overexpression of WT, but not Mut, T-bet (Fig. 1, E and F; and Fig. S1 E). The suppression of Th2 cytokines was probably not due to the increase in IFN-γ production, as high levels of IFN-γ did not suppress the production of Th2 cytokines by CD271− Th2 cells not successfully transduced by WT T-bet (Fig. 1, D–F; and Fig. S1 D). Enriched Th2 cells transduced with EV, WT, or Mut T-bet, and nontransduced cells were stimulated with PMA and Ionomycin (P/I) or with mAbs directed against CD3 and CD28. The expression of IL5 (Fig. 1 G) and the secretion of IL-4, IL-5, IL-13, and IL-10, but not TNF-α, by Th2 cells was suppressed by WT T-bet (Fig. 1, H–L). However, when overexpressed, Mut T-bet did not repress the production of these cytokines by Th2 cells (Fig. 1, H–L). Thus, Mut T-bet, when overexpressed, is unable to inhibit the production of Th2 cytokines.
Figure S1.

Overproduced or endogenous Mut T-bet fails to suppress Th2 cytokines. (A) Naive CD4+ T cells from controls (CTRLs) were expanded under Th0 cell–, Th1 cell–, and Th2 cell–polarizing conditions. Cells were transduced with EV, WT, or Mut TBX21 cDNA expressed with a bicistronic CD271 surface reporter sequence. Surface CD271 staining and ICS for T-bet in response to P/I stimulation are shown. Gating strategy and plots showing the expression of T-bet and CD271 in nontransduced or transduced Th0 cells from a CTRL. (B) Levels of CD271 and GATA-3 expression in nontransduced cells or cells transduced with EV, WT, or Mut TBX21 cDNA as in A. Mean fluorescent intensities (MFIs) of GATA-3 in CD271− and CD271+ cells are highlighted. (C) MFI of GATA-3 in CD271− and CD271+ cells as in B. (D) ICS for IL-13 and T-bet in response to P/I stimulation in cells not successfully transduced (CD271−) is shown. (E) ICS for IL-9, IL-5, and T-bet in response to P/I stimulation in cells successfully transduced (CD271+) is shown. (F) ICS for IL-5, IL-9, and GATA-3 in HVS-T cells from CTRLs and the patient (P) in response to P/I. Percentages of IL-5– and IL-9– producing cells are indicated. The MFI for GATA-3 is also marked. (G) Frequencies of IL-5– or IL-9–producing cells as in F. (H) ICS for IL-10 and GATA-3 in HVS-T cells from CTRLs and P in response to P/I. (I) Frequency of IL-10–producing cells as in H. (J) ICS for IL-22 and IFN-γ in HVS-T cells from CTRLs and P in response to P/I. (K) Frequency of IL-22–producing cells as in J. (L) Immunoblotting of GATA-3, T-bet, and GAPDH in HVS-T cells from CTRLs or P. (M and N) mRNA level of TBX21 and GATA3 in HVS-T cells from CTRLs or P determined by RT-qPCR. (O and P) mRNA level of TBX21 and GATA3 in expanding CD4+ T cell blasts from CTRLs or P determined by RT-qPCR. In G, I, K, and M–P, bars represent the mean and the SEM. Dots represent individual samples. All experimental data were verified in at least two independent experiments. FSC-A, forward scatter area; FSC-H, forward scatter height; lympho, lymphocyte; SSC-A, side scatter area.
High Th2 cytokine production by patient-derived T cell lines
We also investigated the function of endogenous Mut T-bet in Herpesvirus saimiri–transformed T cells (HVS-T) from P. By contrast with the abolition of IFN-γ production by P’s HVS-T cells (Yang et al., 2020), intracellular production of IL-5 and IL-9, response to stimulation with P/I, was markedly increased in P’s HVS-T cells compared with that in the corresponding cells from healthy donors (Fig. S1, F and G). Almost all IL-5– and IL-9–producing cells expressed high levels of GATA-3 (Fig. S1 F), suggesting that disinhibition of GATA-3 in inherited T-bet deficiency might account for the increased production of Th2 cytokines. However, intracellular GATA-3 protein levels were normal in P’s HVS-T cells (Fig. S1 F). Moreover, intracellular production of IL-10, an immunosuppressive cytokine, and IL-22, a Th17-dependent cytokine, by HVS-T cells from P was up-regulated in response to stimulation with P/I (Fig. S1, H–K). In the absence of stimulation, HVS-T cells from P also produced markedly higher levels of IL-5, IL-10, and IL-22 (Fig. 1, M–O). To examine whether endogenous Mut T-bet also inhibits the expression of GATA-3, like the Mut T-bet in an overexpression system (Fig. S1, B and C), we also tested the expression of GATA-3 by immunoblotting and the mRNA level of GATA3 by RT-quantitative PCR (RT-qPCR). The protein level of GATA-3 was comparable between HVS-T cells from P and healthy donors, while T-bet was reduced in HVS-T cells from P (Fig. S1 L). Both TBX21 and GATA3 were expressed normally in HVS-T cells from P (Fig. S1, M and N). We further compared the expression of GATA3 in expanding CD4+ T blasts from healthy donors and P. Similarly, the expression of both GATA3 and TBX21 was normal in expanding CD4+ T blasts from P (Fig. S1, O and P). Thus, when constitutively or overexpressed, Mut T-bet fails to suppress the production of Th2 cytokines, while endogenous Mut T-bet, unlike when it is overexpressed, does not suppress GATA-3 expression.
High plasma levels of IL-5 and IL-13 in human T-bet deficiency
The frequencies of peripheral Th2 and Th17 cells were normal in P (Yang et al., 2020). We then assessed P’s plasma IFN-γ, IL-4, IL-5, IL-13, IL-10, and IL-22 concentrations with an ultrasensitive cytokine profiling assay. P’s basal plasma IFN-γ concentration was similar to that of healthy controls (Fig. 2 A). However, his plasma concentrations for Th2 cytokines, including IL-5 and IL-13, but not IL-4, were much higher than those of controls (Fig. 2 B). Consistent with data from HVS-T cells, his plasma IL-10 and IL-22 concentrations were also high (Fig. 2, C and D). IL-5 mediates airway hyperreactivity and blood eosinophilia in mouse models of asthma (Foster et al., 1996), and is targeted by mepolizumab, reslizumab, and benralizumab in the treatment of severe eosinophilic asthma in humans (Pelaia et al., 2019). It also controls eosinophil production and peripheral eosinophil numbers in humans (Rothenberg and Hogan, 2006; Roufosse, 2018). IL-13 has pathogenic effects during the development of bronchial asthma in mice. Indeed, Tbx21−/− mice develop AHR due to the overproduction of IL-13 (Wills-Karp et al., 1998; Zhu et al., 1999; Grünig et al., 1998; Hershey, 2003; Finotto et al., 2002, 2005). However, the role of IL-22 in the development of AHR in murine models remains unclear. Some studies have suggested that IL-22 suppresses airway inflammation, whereas others have suggested a pathogenic effect in AHR (Hirose et al., 2013). We therefore hypothesize that the pathogenesis of the UAI and blood eosinophilia observed in P may involve an overproduction of Th2 cytokines, including IL-5 and IL-13 in particular.
Figure 2.

The overproduction of Th2 cytokines in response to chronic stimulation is governed by CD4+ αβ T cells.(A–D) Levels of IFN-γ (A), Th2 cytokines (IL-4, IL-5, and IL-13; B), IL-10 (C), and IL-22 (D) in plasma samples from 36 controls (CTRLs) or P (M/M) and P’s relatives (WT/M or WT/WT) were determined with a Simoa analyzer. (E) PBMCs from CTRL, WT/WT, or M/M individuals were left untreated (nonstimulated, NS) or were stimulated with P/I ex vivo. ICS for IL-13 and T-bet is shown. Frequencies of T-betloIL-13+ and T-bethiIL-13+ cells are highlighted. (F and G) Percentages of IL-13– (F) or IL-5–producing (G) cells as in E. (H) Following viSNE dimensionality reduction with IL-13–producing nonstimulated cells from CTRL, WT/WT, and M/M individuals, cells from WT/WT and M/M individuals were mapped onto a tSNE graph for visualization. (I–N) PBMCs from CTRL, age-matched controls (Age-CTRL), WT/WT, WT/M, or M/M individuals were stimulated by incubation with BCG-lysate (BCG-L) in the presence of IL-2 for 2 wk. The levels of IL-4 (I), IL-5 (J), IL-13 (K), IL-9 (L), IL-17A (M), and IL-22 (N) in culture supernatants were determined with the LEGENDplex assays. (O) PBMCs from CTRL, WT/WT, WT/M, or M/M individuals were stimulated with BCG-L in the absence of IL-2 for 16 d. Cells were restimulated with P/I for the ICS of Th2 cytokines. ICS for IL-13 is shown. (P) The percentage of IL-13–producing cells as in O is shown. (Q) viSNE dimensionality reduction for IL-13–producing cells as in O and P was applied to all samples. A tSNE map showing IL-13–producing cells from the P (M/M) is shown. In A–D, F, G, I–N, and P, bars represent the mean and the SEM. Dots represent individual samples and technical replicates. One-way ANOVA was used in A–D. In A–D, *, P < 0.05; **, P < 0.01; ***, P < 0.001; ****, P < 0.0001. Data in A–D were from a single experiment using plasma sampled on different dates or from different individuals as biological replicates to secure enough replications. All experimental data in E–Q were verified in at least two independent experiments. MAIT, mucosal-associated variant T.
Overproduction of Th2 cytokines in response to chronic stimulation in human T-bet deficiency
We investigated the lymphocyte subsets responsible for producing Th2 cytokines by stimulating peripheral blood mononuclear cells (PBMCs) from P and healthy donors with P/I for 8 h. We analyzed the intracellular production of Th2 cytokines, including IL-4, IL-5, IL-9, and IL-13, and the expression of surface lineage-specific markers, by intracellular and surface staining with a 21-color panel and spectral flow cytometry (Fig. S2 A). Intracellular IL-13 levels were high in T-bet–deficient cells in the absence of stimulation (Fig. 2, E and F). Most of these IL-13–producing cells, in the absence of stimulation, were negative for T-bet expression (Fig. 2 E). As reported before (Solomou et al., 2006), brief P/I stimulation significantly increased the expression of TBX21 mRNA and its intracellular protein level (Fig. S2, B and C). Similar to a previous report (Yang et al., 2020), P/I stimulation drastically increased intracellular levels of T-bet even in P’s PBMCs, which seemingly outweighed the protein deficit caused by mutation-mediated instability (Fig. 2 E). This resulted in saturating intracellular T-bet levels in PBMCs from both healthy donors and P. However, P/I stimulation did not significantly increase IL-13 production, and the increase in the level of IL-13–producing cells in P did not persist (Fig. 2, E and F). No increase in the intracellular levels of other Th2 cytokines or IL-10 was observed in PBMCs from P (Fig. S2, D–F; and Fig. 2 G). IL-13–producing cells were clustered using an unsupervised dimensionality reduction for lineage-determining surface markers with viSNE (Amir et al., 2013). More than 80% of the IL-13–producing cells in the basal state were TCR αβ+ T cells (Fig. 2 H and Fig. S2 A). Innate lymphoid cells (ILCs), including IL-13–producing ILC2, are an exceedingly rare population in peripheral blood in humans. ILC2 responses, including the production of IL-13, are enhanced in Tbx21−/− mice (Garrido-Mesa et al., 2019). Using a stringent gating strategy (Lim et al., 2017), ILC progenitor (ILCP) and ILC2s were found in normal frequencies in P (Yang et al., 2020). However, ILC2s, but not ILCP, seemed to express slightly higher levels of intracellular GATA-3 (Fig. S2 G). Thus, it remains possible that a minor proportion of the increased plasma IL-5 and IL-13 in P originates from ILC2s. Th2 cytokines are produced after Th1 cytokines (Duechting et al., 2017). We therefore investigated cytokine production during prolonged T cell activation. PBMCs from P or healthy donors were stimulated with lysates of Mycobacterium bovis BCG (BCG-lysates), a mixture of protein and small-molecule antigens capable of activating both adaptive and innate lymphocytes. After the prolonged expansion of antigen-specific T cells for a period of 2 wk, we determined the levels of Th2 cytokines in culture supernatants. Levels of IL-4, IL-5, and IL-13, but not IL-9, were remarkably higher than those for controls or for P’s relatives (Fig. 2, I–L). The levels of the Th17 cytokines investigated, including IL-17A and IL-22, were also high in P’s cells (Fig. 2, M and N). The level of production of Th2 cytokines was, therefore, markedly higher in response to prolonged antigenic stimulation.
Figure S2.

Production of Th2 cytokines in response to chronic stimulation. (A) PBMCs from CTRL, WT/WT, or M/M individuals were left untreated (nonstimulated, NS) or were stimulated with P/I ex vivo. The gating strategy for ICS of IL-13–producing cells from PBMCs of P in the absence of stimulation is shown. (B) PBMCs from controls (CTRLs) were either untreated or stimulated with P/I. ICS of IL-13 along with T-bet or isotype-control for T-bet was shown. (C) mRNA levels of TBX21 in PBMCs with or without P/I stimulation as in B. (D–F) Percentages of IL-4– (D), IL-9– (E), or IL-10–producing (F) cells as in A are shown. (G) ILCP and ILC2 from CTRL, WT/WT, WT/M, or M/M were plotted for their intracellular GATA-3 expression. Mean fluorescent intensity (MFI) of GATA-3 is highlighted. (H) PBMCs from CTRL, age-matched controls (Age-CTRL), WT/WT, WT/M, or M/M individuals were stimulated with BCG-lysates (BCG-L) in the absence of IL-2 for 16 d. Cells were restimulated with P/I for the ICS of Th2 cytokines. Live single lymphocytes from each sample were selected for viSNE dimensionality reduction analysis. The viSNE data were plotted on a tSNE map. Clusters of different lymphocyte subsets, including CD56+ NK, CD19+ B, Vδ2 γδ T (Vd2 gdT), Vδ1 γδ T (Vd1 gdT), Vδ1−Vδ2− γδ T (Vd1-Vd2- gdT), MAIT, iNKT, CD4+ αβ T (CD4 abT), and CD8+ αβ T (CD8 abT) cells, are shown. (I) ICS for TNF-α, IL-4, IL-5, IL-9, and IL-22 as in H is shown. (J–M) Percentages of cells producing IL-4 (J), IL-5 (K), IL-9 (L), and IL-22 (M) as in I are shown. In C–F and J–M, bars represent the mean and the SEM. Dots represent individual samples. Unpaired Student’s t test was used in C. *, P < 0.05. All experimental data were verified in at least two independent experiments. FSC-A, forward scatter area; MAIT, mucosal-associated variant T; SSC-A, side scatter area.
CD4+ αβ T cells probably govern the overproduction of Th2 cytokines
We investigated the cellular basis of Th2 cytokine overproduction during chronic stimulation by stimulating cells with BCG-lysates for 16 d and then restimulating them with P/I and performing surface and intracellular staining (ICS) and spectral flow cytometry. After this prolonged expansion, cellular composition was similar between controls and P, except that P had a lower proportion of Vδ2+ γδ T cells (Fig. S2 H). However, the frequency of IL-13–producing lymphocytes was higher among cells from P than among cells from healthy donors (Fig. 2, O and P). We analyzed the cellular composition of this population by clustering IL-13–producing cells from all individuals on the basis of the expression ofrelevant surface markers. We used viSNE to reduce dimensionality, and the clusters were mapped onto t-distributed stochastic neighbor embedding (tSNE) plots (Amir et al., 2013). Strikingly, almost 80% of IL-13–producing cells were TCRαβ+CD4+ T cells (Fig. 2 Q). By contrast, in response to P/I stimulation, IL-4– and IL-5–producing lymphocytes were produced at similar saturating frequencies in both healthy controls and P (Fig. S2, I–K). IL-9 production was no greater than that of healthy donors (Fig. S2, I and L). Intracellular IL-22 production was markedly higher for P than for any of the controls (Fig. S2, I and M), suggesting that T-bet deficiency also unleashed the production of Th17 cytokines. Importantly, the overproduction of Th2 cytokines in response to prolonged antigenic stimulation was dominated by CD4+ αβ T cells.
Single-cell RNA sequencing (scRNA-seq) reveals a larger number of IL5-expressing CD4+ T cells
We thus focused on CD4+ T cells from P with T-bet deficiency, as they played a dominant role in the production of Th2 cytokines (Fig. 2). We used MACS to sort CD4+ T cells from the PBMCs of P, and we then activated these cells with anti-CD3/CD28 mAbs and performed scRNA-seq analysis. As expected, IFNG was one of the most strongly expressed genes in control CD4+ T cells. Interestingly, IL5 and IL13 expression levels were very high in CD4+ T cells from P (Fig. 3 A). In particular, IL5-expressing CD4+ T cells were strongly up-regulated in human T-bet deficiency, to levels >10 times higher than those in healthy donors (Fig. 3 B). IL5high cells from P had a unique transcriptomic profile, different from that of those from healthy donors, with significantly lower levels of COMMD7, NEFL, CIZ1, SULF2, EIF2S3B, LDOC1, SEPT8, R3HCC1, ERCC1, MNAT1, BOLA3, MRPL40, and RORA expression (Fig. 3 C). In the T-bet–deficient patient, IL5high CD4+ T cells also presented higher levels of expression for other Th2 cytokine genes, including IL4, IL9, and IL13, than IL5low cells (Fig. 3 D). IL13 expression was also up-regulated in T-bet–deficient CD4+ T cells (Fig. 3 E). GATA3 expression was normal in CD4+ T cells from P (Fig. 3 F). However, the expression of GATA3-AS1, a long noncoding RNA, which functions as a positive regulator of GATA3 expression and the coding gene of which is proximal to GATA3 within the same genetic locus (Gibbons et al., 2018), was increased in T-bet–deficient CD4+ T cells (Fig. 3 G). Thus, a Th2 cell bias, with, in particular, a skew to higher levels of IL13 and IL5 expression, in CD4+ T cells is accompanied by changes in the expression of other sets of genes.
Figure 3.

Overproduction of IL-5 and IL-13 by CD4+ T cells from a patient with T-bet deficiency.(A) Total CD4+ T cells from P (M/M indicated in red) or a healthy donor (CTRL, in black) were stimulated by incubation with anti-CD3/CD28 mAbs for 14 h. Cells were subjected to scRNA-seq. A volcano plot of differentially expressed genes (DEG) is shown. (B) Level of IL5 expression as in A. (C) Plot showing DEGs between CTRL and M/M cells expressing high levels of IL5. (D) Plot showing DEGs between cells expressing (IL5 pos) or not expressing IL5 (IL5 neg). (E–G) Level of IL13 (E), GATA3 (F), and GATA3-AS1 (G) expression as in A. (H) Total CD4+ T cells from CTRL or M/M individuals were activated or expanded with anti-CD3/CD28 mAbs under Th0 cell– or Th1 cell–polarizing conditions. M/M cells were transduced with EV or WT TBX21 cDNA (WT) for complementation. ICS for IFN-γ and IL-5 is shown. (I) ICS for IL-5, IL-4, IL-13, and IL-17A is shown as in H. (J–L) Percentages of IL-5–producing (J), IL-4+ IFN-γ− (K), and IL-13+ IFN-γ− (L) cells as in H and I are shown. In J–L, bars represent the mean and SD. Dots represent individual samples. Data from A–G were summarized from a single scRNA-seq experiment containing >2,000 single-cell datasets, which secures enough replications. Data from H–L were verified in at least two independent experiments.
T-bet–deficient CD4+ T cells overproduce Th2 cytokines
We investigated whether the overproduction of Th2 cytokines was dependent on a lack of T-bet. CD4+ T cells from healthy donors or P were isolated by MACS and subjected to polyclonal expansion with anti-CD3/CD28 mAbs under Th0 or Th1 cell polarization. Cells from P were also subjected to retroviral transduction with EV or WT T-bet to rescue T-bet deficiency. Nontransduced and transduced cells were restimulated with P/I. As reported previously (Yang et al., 2020), the intracellular production of IFN-γ by P was markedly reduced (Fig. 3 H) but IL-17A expression was increased in Th0 cells from P (Fig. 3 I). The intracellular expression of IL-5 was found to be higher in T-bet–deficient CD4+ Th0 cells and was mostly found in the IFN-γ–negative cells (Fig. 3 H). By contrast, IL-17A–producing Th0 cells were still able to produce Th2 cytokines, in particular IL-4 and IL-13 (Fig. 3 I). The increase in IL-5 production by Th0 cells from P was abolished by complementation with WT T-bet but not EV (Fig. 3, H–J). Moreover, frequencies of IFN-γ−IL-4+ and IFN-γ−IL-13+ cells were increased in Th0 cells from P but reversed by complementation with WT T-bet (Fig. 3, I–L). Tbx21−/− CD4+ T cells in mice are capable of producing modest amounts of Th2 cytokines even in response to Th1 cell polarization (Szabo et al., 2000). Frequencies of IL-5–producing IFN-γ−IL-4+ and IFN-γ−IL-13+ cells were reduced during Th1 cell polarization (Fig. 3, H and J–L). Similar to findings from mice, they were still higher than those of Th1 cells from healthy donors, and the increases were reversed by complementation with WT T-bet (Fig. 3, H and J–L). Therefore, T-bet–deficient CD4+ T cells overproduce Th2 cytokines in a T-bet–dependent manner.
T-bet–deficient CD4+ T cells are epigenetically poised to promote Th2 skew
We then investigated the molecular mechanism by which T-bet suppresses the expression of Th2 cytokines. Datasets from an omni-ATAC-seq experiment probing expanded CD4+ Th0 cells from healthy donors and from P, and P’s cells complemented with EV or WT T-bet, were reanalyzed focusing on Th2 cell–specific difference (Yang et al., 2020). As T-bet deficiency unleashes Th2 cell production by disinhibition of GATA-3 (Hwang et al., 2005), we first focused on loci that were both differentially regulated in P in a T-bet–dependent manner and occupied by GATA-3 binding (Yang et al., 2020; Kanhere et al., 2012). Chromatin accessibilities of 1,262 loci, which are capable of binding GATA-3 in Th2 cells of healthy donors, were up- or down-regulated in P, and the differences were reversed by complementation of WT T-bet but not EV (Fig. S3 A). A majority of loci, the chromatin accessibilities of which were closed in P and were opened by T-bet complementation, were also co-occupied by T-bet, while most of others that were opened up by the lack of T-bet were not bound by T-bet (Fig. S3 A). We next focused on Th2 cell–related genes. At three distal loci downstream from the IL5 locus, including two loci adjacent to IRF1, chromatin accessibility was higher in the absence of T-bet, but abolished by WT T-bet complementation (Fig. 4 A). The chromatin accessibility of a locus upstream from IL5, within the intron between exons 13 and 14 of RAD50, which is also 60 kb upstream from IL5, was also increased by the lack of T-bet, but this greater accessibility was reversed by WT T-bet (Fig. S3 B). Similarly, the chromatin accessibilities of promoter regions of IL4R and STAT6, two crucial components of IL-4 signaling, were opened up in T-bet deficiency in a T-bet–dependent manner (Fig. 4, B and C). All these loci enabled GATA-3 to bind in Th2 cells (Fig. 4, A–C). Chromatin accessibilities of two loci within the MAF locus, which encodes c-MAF, a key transcription factor determining the terminal differentiation of Th2 cells in mice (Ho et al., 1998), were also opened up in T-bet–deficient CD4+ T cells in a T-bet–dependent manner (Fig. 4 D). Chromatin accessibility of transcriptional start site of GATA3 was also slightly increased by the lack of T-bet, while chromatin accessibilities of two intronic loci within GATA3 were regulated oppositely (Fig. S3 C). The TCE-7.1 region or T cell–specific GATA3 enhancer (Tce1), a 7.1-kb cis element located 280 kb 3′ to Gata3 in mice, was found to enhance Gata3 expression in mice (Ohmura et al., 2016; Hosoya-Ohmura et al., 2011). Interestingly, a region with high chromatin accessibility was found within the corresponding TCE-7.1 region in humans (Fig. S3 D). Although the chromatin accessibility of this peak was suppressed by the overexpression of WT T-bet, its chromatin accessibility was comparable between Th0 cells from healthy donors and P (Fig. S3 D). In addition to IL5, IL4R, STAT6, GATA3, and MAF, chromatin accessibilities of other loci related to lineage determination of Th2 cells, including those within ICOS, MYD88, IKZF1, CYLD, and ITK (Reuter et al., 2016; Quirion et al., 2009; Piggott et al., 2005; Miller et al., 2004; Au-Yeung et al., 2006; Hwang et al., 2005; Tesciuba et al., 2008), were also opened up in T-bet deficiency, but their greater accessibilities were reversed by WT T-bet complementation (Fig. 4 E). Thus, T-bet deficiency controls a series of Th2 cell–dependent genes by de-repression of GATA-3, thereby probably facilitating GATA-3–dependent induction of Th2 cell genes.
Figure S3.

Epigenetic regulation of Th2 genes and antigen specificity of memory CD4+ T cells producing Th2 cytokines from inherited T-bet deficiency.(A) Heat map showing 1,262 loci that are bound by GATA-3 and the chromatin accessibilities of which are differentially regulated in M/M, with the difference reversed by complementation of WT T-bet. (B) Chromatin accessibility of a locus spanning IL5, RAD50, and IL13. (C and D) Chromatin accessibilities of GATA3-AS1 and GATA3 loci (C) as well as a cis-regulatory region, named TCE-7.1 (D). (E–K) Libraries of memory CD4+ T cells from a healthy donor (CTRL) and the patient (M/M) were screened for antigen reactivity by culturing T cells with autologous antigen-presenting cells, with or without peptide pools derived from the microbes indicated. T cell clones from memory CD4+ T cell libraries responding to peptide pools from indicated pathogens were subjected to Luminex assays to determine the levels of IL-4 (E), IL-9 (F), IL-13 (G–J), and IL-5 (K). In E–K, the bars represent the mean and SD. Dots represent individual T cell clones. Unpaired Student’s t tests were used in E–K. In E–K, *, P < 0.05; **, P < 0.01; ****, P < 0.0001. Data from A–D were summarized from a single experiment with library preparations from three CTRLs and independent repeats of library preparations from M/M and M/M complemented with EV or WT. Data from E–K summarized from a single experiment that contained hundreds of single-cell clones that were independently measured to secure enough replications.
Figure 4.

Epigenetic regulation of Th2 genes and antigen specificity of IL-5– and IL-13–producing memory CD4+ T cells from inherited T-bet deficiency. (A) Chromatin accessibility of IL5 and its adjacent IRF1 loci. (B–D) Chromatin accessibilities of IL4R (B), STAT6 (C), and MAF (D) loci. (E) A selection of loci, the chromatin accessibilities of which are differentially regulated in M/M with the difference reversed by WT T-bet complementation, is shown in the heat map. (F–J) T cell clones from memory CD4+ T cell libraries responding to peptide pools derived from BCG (F), C. albicans (G), EBV (H), influenza A virus (I), or tetanus toxoid (J) were subjected to Luminex assays to assess the levels of IL-5. (K and L) T cell clones from memory CD4+ T cell libraries responding to peptide pools from BCG (K) and HCMV (L) were subjected to Luminex assays to assess the levels of IL-13. (M–Q) T cell clones from memory CD4+ T cell libraries responsive to peptide pools from BCG (M), C. albicans (N), EBV (O), influenza A virus (P), or tetanus toxoid (Q) were subjected to Luminex assays to assess the levels of IL-17A. (R) T cell clones from memory CD4+ T cell libraries responsive to peptide pools from the pathogens indicated were subjected to Luminex assays to assess the levels of IL-22. (S) High levels of Th2 cytokines, UAI, and peripheral eosinophilia in the patient with inherited human T-bet deficiency. In F–R, bars represent the mean and SD. Dots represent individual T cell clones. Unpaired Student’s t test was used in F–R. In F–R, *, P < 0.05; **, P < 0.01; ***, P < 0.001; ****, P < 0.0001. Data from A–E were summarized from a single experiment with library preparations from three controls (CTRLs) and independent repeats of libraries preparation from M/M and M/M complemented with EV or WT. Data from F–R summarized from a single experiment that contained hundreds of single-cell clones that were independently measured to secure enough replications.
IL-5 is produced by memory CD4+ T cells of various specificities
We recently reported a normal response of the memory CD4+ T cells of P to antigenic peptides derived from influenza A virus, human cytomegalovirus (HCMV), EBV, tetanus toxoid, BCG, and Candida albicans (Yang et al., 2020). The production of IL-4 and IL-9 by memory CD4+ T cells in response to various antigens was similar for P and controls, with the exception of subtle differences in production by EBV-, C. albicans–, or tetanus toxoid–responsive T cells (Fig. S3, E and F). By contrast, P’s CD4+ T cells produced significantly higher levels of IL-5 and IL-13 in response to various pathogens (Fig. 4, F–L). Influenza A–, C. albicans–, EBV-, and tetanus toxoid–reactive memory CD4+ T cells produced IL-13, and HCMV-reactive memory CD4+ T cells produced IL-5, in amounts similar to those produced by controls (Fig. S3, G–K). BCG-, C. albicans–, EBV-, influenza A virus–, and tetanus toxoid–reactive memory CD4+ T cells from P also produced higher levels of IL-17A and IL-22 than their counterparts from controls (Fig. 4, M–R), suggesting a phenotypic skew toward Th17 cells, in addition to Th2 cell skew. Inherited human T-bet deficiency thus disinhibits the production of pro-asthmatic Th2 cytokines, in particular IL-5 and IL-13, by memory CD4+ T cells, regardless of their antigen specificities (Fig. 4 S).
Discussion
We report here the clinical, immunological, and molecular study of UAI and eosinophilia in a patient with inherited, complete T-bet deficiency. Despite the normal development of Th2 CD4+ T cells in vivo (Yang et al., 2020), the lack of T-bet resulted in the production of larger amounts of IL-5 and IL-13 by CD4+ αβ T cells. The lack of T-bet prevented the inhibition of GATA3-dependent epigenetic regulation of the IL5, STAT6, IL4R, MAF, ITK, and other loci related to Th2 cell skew. This mechanism probably drives the pathogenesis of persistent nonallergic UAI and peripheral eosinophilia in this patient. Key observations in Tbx21−/− mice support this conclusion: (1) the development of spontaneous, nonallergic AHR in Tbx21−/− mice is caused by the dysregulation of IL-13 (Finotto et al., 2002, 2005); (2) T-bet deficiency in mice results in aberrant eosinophil regulation (Fujiwara et al., 2007); (3) T-bet suppresses Th2 cytokines by inhibiting GATA3 (Hwang et al., 2005); (4) consistent with early studies of human T cell differentiation, studies of T-bet– and GATA3-deficient mice have suggested that there may be mutual antagonism between the Th1 and Th2 cell pathways (Hwang et al., 2005; Kidd, 2003; Usui et al., 2003; Yagi et al., 2010; Amsen et al., 2009). This conclusion is also supported by studies of other human inborn errors of immunity, as patients with IL-12Rβ1 or IFN-γR1 deficiency have been shown to be more likely to develop asthma and atopic disease (Wood et al., 2005). Interestingly, by contrast to the antimycobacterial function of T-bet, which is restricted to innate (NK) and innate-like adaptive T cells (MAIT, iNKT, and Vδ2+ γδ T cells; Yang et al., 2020), the unleashing of Th2 cell skewing by T-bet occurs predominantly in purely adaptive CD4+ αβ T cells. Our study fulfills the criteria for genetic studies of single patients (Casanova et al., 2014), with complete clinical penetrance, defective function of the Mut T-bet, and the overproduction of Th2 cytokines as a mechanism of disease, thereby establishing a causal relationship between T-bet deficiency and nonallergic UAI with eosinophilia. Nevertheless, other T-bet–deficient patients will need to be identified to corroborate our findings, as the TBX21 genotype is rare (<5 × 10⁻⁸), whereas the UAI with blood eosinophilia phenotype is more common (prevalence of eosinophilic asthma: ∼4 × 10⁻³; de Groot et al., 2015). Interestingly, heterozygous Tbx21+/− mice also develop UAI, but the heterozygous parents of P have never developed this condition (Finotto et al., 2002). Moreover, consistent with findings for mice (Lazarevic et al., 2011), the patient also displays an apparent Th17 cell skewing of CD4+ T cells, which does not seem to have conferred any distinctive clinical phenotype by the age of 5 yr. Careful follow-up of this patient will be required. Inherited human T-bet deficiency unleashes Th2 cytokines, including IL-5 and IL-13 in particular, in CD4+ αβ T cells, resulting in nonallergic UAI and eosinophilia. Together with our previous study of Mendelian susceptibility to mycobacterial disease in this patient, these findings suggest that human T-bet acts more as a regulator of Th2 cytokines than as an inducer of the Th1 cytokine IFN-γ in CD4+ αβ T cells.
Materials and methods
Sample collection
The study was approved by and performed in accordance with the requirements of the institutional ethics committee of Necker Hospital for Sick Children and Rockefeller University. Informed consent was obtained for the patient, his relatives, and healthy control volunteers enrolled in the study. Experiments using samples from human subjects were conducted in the United States, France, and Switzerland, in accordance with local regulations and with the approval of the institutional review boards of the corresponding institutions.
ALEX allergen screen
Allergy Explorer version 2.0 (ALEX2; Macro Array Diagnostics) was used to determine the levels of IgE against 282 allergens (156 extracts and 126 molecular allergens) according to the manufacturer’s instructions. Briefly, plasma samples from P and controls were diluted 1:5 with a cross-reactive carbohydrate determinant inhibitor-containing diluent and incubated on the chip. Detection was performed by adding an alkaline phosphatase-conjugated anti-human IgE antibody (Ab). Raptor software (Macro Array Diagnostics) was used to quantify plasma IgE within a range of 0.3–40 kU/liter. Values ≥0.30 kU/liter were considered to be positive.
Th2 cytokine determinations in TBX21-transduced primary CD4+ T cells
This experiment was performed as previously described (Yang et al., 2020). In brief, PBMCs from two healthy donors were stained with Fcblock, anti-CD45RA-Alexa 488, anti-CD4-APC-Cy7, anti-CCR7-Alexa 647, anti-CD127-BV650, and anti-CD25-PE Abs. Live naive CD4+ T cells (CD4+CCR7+CD45RA+) after excluding regulatory T cells (CD4+CD25+CD127−) were isolated by FACS. Cells were stimulated with anti-CD3/CD28 Ab Dynabeads (Thermo Fisher Scientific) at a 1:1 cell:bead ratio under Th0, Th1 (recombinant human IL-12; 2.5 ng/ml; R&D), and Th2 (recombinant human IL-4; 12.5 ng/ml; R&D) cell–polarizing conditions, in the presence of 100 IU/ml proleukin IL-2 (PROMETHEUS). 7 d later, the cells were restimulated with Dynabeads at a 1:2 (bead:cell) ratio and transduced with retroviruses generated from pLZRS-ires-ΔCD271 plasmids containing EV, WT, or Mut TBX21 cDNA, as previously described, the following day (Martínez-Barricarte et al., 2016; Yang et al., 2020). After culture for another 6 and 7 d, aliquots of cells were restimulated with 25 ng/ml PMA and 0.5 µM Ionomycin for 6 h in the presence of Protein Transport Inhibitor (eBioscience). Cells were stained with Zombie-NIR live-dead exclusion dye (BioLegend), FcBlock (Miltenyi Biotec), and FITC-conjugated anti-CD271 Ab (BioLegend). Cells were then fixed, permeabilized with FOXP3/perm kit (Thermo Fisher Scientific), and subjected to overnight ICS with anti-GATA3-BV421 (BD Biosciences), anti-IL-13-BV711 (BD Biosciences), anti-IFN-γ-eFluor450 (eBioscience), anti-IL-9-PERCP/Cy5.5 (BioLegend), anti-IL-5-PE (BioLegend), anti-T-bet-PE/Cy7 (BioLegend), anti-IL-10-PE/Dazzle594 (BioLegend), anti-IL-22-APC/Fire750 (BioLegend), anti-TNF-BV510 (BioLegend), anti-RORγ/RORγT-BV650 (BD Bioscience), anti-IL-17A-BV785 (BioLegend), and anti-IL-4-Alexa 647 (BioLegend), followed by flow cytometry analysis with an Aurora cytometer (Cytek).
Alternatively, transduced cells were isolated with anti-CD271 Ab-coated beads (Miltenyi Biotec) 14 d after stimulation. Along with nontransduced cells, they were restimulated with P/I. Cells were subjected to RT-qPCR analysis of IL5 expression. Cells were also restimulated with anti-CD3/CD28 Dynabeads (Thermo Fisher Scientific) for 3 d. The levels of cytokines, including TNF-α, IL-4, IL-5, IL-13, and IL-10, in culture supernatants were determined with LEGENDplex (BioLegend).
Spontaneous cytokine production by HVS-T cells
We plated 100,000 HVS-T cells from healthy donors or P in a 96-well U-bottomed plate at a density of 106 cells/ml in the presence of recombinant human IL-2 (Roche) at 20 IU/ml. The plate was incubated for 2 d, and the culture supernatants and cells were harvested for LEGENDplex determinations of Th cytokines, including IL-5, IL-13, IL-2, IL-6, IL-9, IL-10, IFN-γ, TNF-α, IL-17A, IL-17F, IL-4, IL-21, and IL-22.
Detection of intracellular production of cytokines by HVS-T cells
HVS-T cells from six healthy donors and P were cultured in the presence of IL-2 at 20 IU/ml (Roche). HVS-T cells were harvested, counted, and topped up to 106 cells/ml without recombinant IL-2. 200 µl cells per well were plated to 96-well round bottom tissue-culture plates. After 24 h culture, cells were stimulated with 25 ng/ml PMA and 0.5 µM Ionomycin for 3 h. Protein transport inhibitor (eBioscience) was added to each well. After another 3 h, cells were harvested for surface staining with FcBlock, anti-CD271-FITC Abs, and Zombie-NIR live-dead exclusion dye (BioLegend). Cells were then fixed, permeabilized with FOXP3/perm kit (Thermo Fisher Scientific), and subjected to overnight ICS with anti-GATA3-BV421 (BD Biosciences), anti-IL-13-BV711 (BD Biosciences), anti-IFN-γ-eFluor450 (eBioscience), anti-IL-9-PERCP/Cy5.5 (BioLegend), anti-IL-5-PE (BioLegend), anti-T-bet-PE/Cy7 (BioLegend), anti-IL-10-PE/Dazzle594 (BioLegend), anti-IL-22-APC/Fire750 (BioLegend), anti-TNF-BV510 (BioLegend), anti-RORγ/RORγT-BV650 (BD Bioscience), anti-IL-17A-BV785 (BioLegend), and anti-IL-4-Alexa 647 (BioLegend), followed by flow cytometry analysis with an Aurora cytometer (Cytek).
Cytokine determinations in plasma
Plasma samples were collected from 36 healthy donors and from P with T-bet deficiency and his relatives, and were stored at −80°C until use. Concentrations of IL12p70, IL-1β, IL-4, IL-5, IFN-γ, IL-6, IL-8, IL-22, TNF-α, and IL-10 were determined with a 10-plex planar array immunoassay on the Quanterix SP-X imaging and analysis platform, with reagents and procedures obtained from Quanterix Corporation (Quanterix Human CorPlex Cytokine Panel Array). Calibrators were run in duplicate, and five-parameter logistic regression was used for fitting.
The Simoa (single molecule array) HD-1 analyzer (Quanterix) was used for the ultrasensitive immunodetection (digital ELISA) of IL-13, in a single-plex bead-based assay, according to the manufacturer’s instructions. Calibrators were run in duplicate, and a four-parameter logistic regression was used for fitting.
The concentration of each cytokine in the samples tested was determined by interpolation from the calibration curve, with multiplication by the dilution factor. Cytokine concentrations are expressed in picograms per milliliter or nanograms per milliliter. If a cytokine was not detectable in the sample, the limit of detection value was used. For cytokines present at concentrations higher than the upper limit of the detection range, we used the upper limit of quantification.
Ex vivo production of Th2 cytokines
PBMCs from six healthy donors, P’s WT/WT brother, and P (mutant/mutant; M/M) were plated in 96-well round-bottomed wells at a density of 300,000 cells per well, in 200 µl of medium per well. Each sample was plated in duplicate. Cells were cultured in an incubator overnight. We then left one set of wells untreated, and stimulated the other wells with 50 ng/ml PMA and 1 µM Ionomycin. After 4 h of stimulation, GolgiPlug was added to all three sets of wells. After incubation for another 4 h, the cells were harvested for ICS. In brief, cells were harvested and stained with Zombie-NIR (BioLegend) for 15 min. The cells were then stained for surface markers with FcBlock (Miltenyi Biotec), anti-γδTCR-Alexa 647 (BioLegend), anti-CD3-V450 (BD Biosciences), anti-CD56-BUV563 (BD Biosciences), anti-CD4-BV750 (BD Biosciences), anti-Vδ1TCR-FITC (Miltenyi Biotec), anti-CD8-BUV7373 (BD Biosciences), anti-Vδ2TCR-BUV805 (BD Biosciences), anti-CD19-Spark-NIR685 (BioLegend), anti-Vα7.2-Alexa 700 (BioLegend), MR1-tetramer-BV421 (National Institutes of Health tetramer center), anti-Vβ11-APC (Miltenyi Biotec), and anti-iNKT-BV480 (BD Biosciences) Abs (Corbett et al., 2014). Cells were stained by incubation on ice with the labeled Abs for 30 min. Cells were fixed by incubation with fixatives from the FOXP3 staining kit (Thermo Fisher Scientific) for 30 min. Cells were washed and permeabilized, and ICS was performed with anti-IL-13-BV711 (BD Biosciences), anti-IL-9-PERCP/Cy5.5 (BioLegend), anti-IL-4-BV786 (BioLegend), anti-IL-5-PE (BioLegend), anti-T-bet-PE/Cy7 (BioLegend), anti-IL-10-PE/Dazzle594 (BioLegend), anti-IL-22-APC/Fire750 (BioLegend), and anti-TNF-BV510 (BioLegend) Abs. After overnight staining, the cells were washed, resuspended, and subjected to spectral flow cytometry on an Aurora flow cytometer (Cytek).
To examine the expression of T-bet in response to stimulation with P/I, PBMCs from three healthy donors were plated in 96-well round-bottomed wells at a density of 300,000 cells per well in 200 µl of medium per well. Each sample was plated in triplicate. Cells were cultured in an incubator overnight. We then left one set of wells untreated, and stimulated the other two wells with 50 ng/ml PMA and 1 µM Ionomycin. After 4 h of stimulation, GolgiPlug was added to all three sets of wells. After incubation for another 4 h, the cells from untreated wells and one of the two P/I-stimulated wells were harvested for ICS as above. The other P/I-stimulated wells were used for isotype control staining. In brief, cells were stained with isotype-PE/Cy7-IgG Ab (BD Bioscience), instead of anti-T-bet-PE/Cy7 Ab, while all other staining Abs and staining procedures remained the same. After staining overnight, cells were subjected to flow cytometry analysis with an Aurora cytometer (Cytek).
To examine the expression of TBX21 mRNA in response to stimulation of P/I, PBMCs from three healthy donors were plated in 48-well round-bottomed wells at a density of 500,000 cells per well in 500 µl per well. A duplicate set of wells was plated for each PBMC sample. After overnight culture, 50 ng/ml PMA and 1 µM Ionomycin were added to one set of wells, while the other set of wells was left untreated. After 8 h, all cells were harvested for RNA extraction with the Quick-RNA 96 Kit (Zymo Research). cDNA synthesis was done with oligo-dT using SuperScript III (Thermo Fisher Scientific). RT-qPCR was performed using the Taqman system, and GUSB was used as an endogenous control (Applied Biosystems).
Examination of ILCs from peripheral blood of inherited T-bet deficiency
Immunophenotyping of ILCs was performed in a recent publication, in which the staining and experimental procedures were described (Yang et al., 2020). Datasets from this published work were reanalyzed focusing on GATA-3 expression in ILCs, which was not done in the last publication. ILCP and ILC2, based on their surface markers described previously (Yang et al., 2020), were gated, and intracellular expression of GATA-3-BUV395 was analyzed using FlowJo.
Cytokine production by and ICS of PBMCs in response to prolonged stimulation with BCG-lysates
BCG-lysates were prepared and provided by Dr. Carl F. Nathan (Weill Cornell Medicine, New York, NY). PBMCs from adult donors, the T-bet M/M P, and his relatives were resuspended at a density of 106 cells/ml. We plated 200 µl cells per well for each treatment in a 96-well U-bottomed plate. We added BCG-lysate to each well at a final concentration of 5 µg/ml. Recombinant IL-2 (Roche) was added to a final concentration of 10 IU/ml. Fresh medium and IL-2 were added to the culture every 3–4 d. After 14 d, culture supernatants were used for cytokine determinations with LEGENDplex.
PBMCs from 20 adult donors, 4 age-matched controls, the T-bet M/M P, and his relatives (WT/M mother and WT/WT brother) were resuspended at a density of 106 cells/ml. Cells were stimulated with BCG-lysates and added to each well at a final concentration of 5 µg/ml, without recombinant IL-2. After 16 d, Golgiplug (BD Biosciences) was added to the wells, together with 50 ng/ml PMA and 1 µM Ionomycin. The cells were incubated for 5 h and then harvested for ICS for cytokines. In brief, cells were harvested and stained with Zombie-NIR (BioLegend) for 15 min. Cells were then stained for surface markers with FcBlock (Miltenyi), anti-γδTCR-Alexa 647 (BioLegend), anti-CD3-V450 (BD Biosciences), anti-CD56-BUV563 (BD Biosciences), anti-CD4-BV750 (BD Biosciences), anti-Vδ1TCR-FITC (Miltenyi Biotec), anti-CD8-BUV7373 (BD Biosciences), anti-Vδ2TCR-BUV805 (BD Biosciences), anti-CD19-Spark-NIR685 (BioLegend), anti-Vα7.2-Alexa 700 (BioLegend), MR1-tetramer-BV421 (National Institutes of Health tetramer center), anti-Vβ11-APC (Miltenyi Biotec), and anti-iNKT-BV480 (BD Biosciences) Abs (Corbett et al., 2014). Cells were stained by incubation with the Abs on ice for 30 min. Cells were fixed by incubation with fixatives from the FOXP3 staining kit (Thermo Fisher Scientific) for 30 min. Cells were washed and permeabilized, and ICS was performed with anti-IL-13-BV711 (BD Biosciences), anti-IL-9-PERCP/Cy5.5 (BioLegend), anti-IL-4-BV786 (BioLegend), anti-IL-5-PE (BioLegend), anti-T-bet-PE/Cy7 (BioLegend), anti-IL-10-PE/Dazzle594 (BioLegend), anti-IL-22-APC/Fire750 (BioLegend), and anti-TNF-BV510 (BioLegend) Abs. After overnight staining, the cells were washed, resuspended, and subjected to spectral flow cytometry on an Aurora flow cytometer (Cytek).
scRNA-seq of CD4+ T cells
Frozen PBMCs from a healthy donor and TBX21 M/M P were thawed and cultured for 9 h in medium containing 5% human serum. CD4+ T cells were isolated with anti-CD4 Ab-coated beads (Miltenyi Biotec) and activated by incubation with plate-bound anti-CD3 mAb (5 µg/ml; clone TR66) and anti-CD28 mAb (1 µg/ml; clone CD28.2; BD Biosciences) for 14 h. The cells were collected, centrifuged at 300 ×g for 10 min, and washed with PBS + 0.04% BSA. Cells were counted, and viability was assessed by Trypan blue (VWR) staining. The cell concentration was adjusted to 1,000 cells/µl in PBS + 0.04% BSA, and the cells were loaded onto a 10x Genomics Chromium Single Cell A chip. The Chromium Single Cell 3′ Reagent kit (v2) was used for RT and library preparation, according to the manufacturer’s instructions. Library quality was analyzed with a Bioanalyzer High Sensitivity DNA chip (Agilent). Sequencing was performed with Illumina NextSeq 500 in a 26-bp Read 1, 98-bp Read 2, and 8-bp Index 1 configuration. We obtained a mean of 23,283 reads per cell for the healthy donor and 89,076 reads per cell for P (TBX21 M/M). Reads were mapped onto the hg38 human reference genome assembly, and barcodes and UMIs were filtered and counted with CellRanger (v3.0.1). For each gene and cell, a list of UMI counts was obtained. The data were further analyzed with the Seurat v3 R package (Stuart et al., 2019). Cells with >10% mitochondrial genes or outside the [200, 5,000] interval of detected genes per cell were excluded. Normalization was performed by regularized negative binomial regression, with mitochondrial percentage included as an additional covariate (Hafemeister and Satija, 2019). CD4+ monocytes were identified on the basis of their transcriptional profile and excluded from further analysis. Wilcoxon rank-sum tests were performed for analysis of differential expression between two groups. The Gene Expression Omnibus accession no. for the scRNA-seq dataset reported in this paper is GSE174804.
Omni-ATAC-seq on CD4+ T cells and analysis
The omni-ATAC-seq experiment was previously performed in a recent publication (Yang et al., 2020). Datasets were previously deposited at National Center for Biotechnology Information–Bioproject under accession no. PRJNA641463. Datasets were revisited in this study focusing on Th2 cell targets, which were not investigated in the previous report. Similar to a previous study (Yang et al., 2020), T-bet chromatin immunoprecipitation sequencing (ChIP-seq) data in human Th1 cells (Sequence Read Archive accession no. SRR332104) and GATA-3 ChIP-seq data in human Th2 cells (Sequence Read Archive accession no. SRR332106), and their input controls were retrieved as unaligned sequences from the European Nucleotide Archive (Kanhere et al., 2012). Sequences were aligned with the hg38 genome from the Bsgenome.Hsapiens.UCSC.hg38 Bioconductor package (version 1.4.1), with Rsubread’s alignment method, and predicted fragment lengths calculated with the ChIPQC package (Carroll et al., 2014; Liao et al., 2014; de Santiago and Carroll, 2018). Normalized, fragment-extended bigWigs signals were created with the rtracklayer package as previously reported (Yang et al., 2020).
We focused on analyzing chromatin accessibility regions that were differentially regulated in the patient’s CD4+ T cells (M/M) relative to controls but reversed by WT T-bet complementation (M/M + WT versus M/M + EV). For differential accessibility analysis, we imported raw ATAC-seq read counts into DESeq2 (version 1.20.0) and used a multifactorial generalized linear model to identify differential sites while accounting for cell type. Loci with statistically significant changes (Benjamini–Hochberg adjusted P value <0.05) in chromatin accessibility were checked for whether they overlap with T-bet ChIP-seq peaks in Th1 cells or GATA-3 ChIP-seq peaks in Th2 cells. Among all loci that overlapped with GATA-3 ChIP-seq peaks, 413 loci, the chromatin accessibilities of which were increased in T-bet–deficient CD4+ T cells but reversed by WT T-bet complementation, and 849 loci, the chromatin accessibilities of which were decreased in a T-bet–dependent manner, were visualized within a heatmap using the pheatmap R package (version 1.0.12). ChIP-seq and omni-ATAC-seq peaks were reviewed using the Broad’s Integrative Genomics Viewer (Robinson et al., 2011).
ICS of Th2 cytokines in T-bet–deficient CD4+ T cells in vitro
This experiment was performed as previously described (Yang et al., 2020). Briefly, CD4+ T cells were isolated from PBMCs from five healthy donors (controls), the T-bet WT/M heterozygous father (TBX21 WT/M), and the T-bet M/M P (TBX21 M/M), with anti-CD4 Ab-coated beads (Miltenyi Biotec). This population of cells was then expanded with anti-CD3/CD28 Ab-coated Dynabeads (Thermo Fisher Scientific) at a 1:1 (cell:bead) ratio under Th0 cell–polarizing conditions, in the presence of 100 IU/ml proleukin IL-2 (PROMETHEUS) and anti-human IL-10 neutralizing Ab (Thermo Fisher Scientific). Cells were restimulated with anti-CD3/CD28 Ab-coated Dynabeads every 7–8 d. P’s CD4+ T cells were transduced with retroviruses obtained from pLZRS-ires-ΔCD271 plasmids with or without WT TBX21 or EV cDNA, as previously described (Martínez-Barricarte et al., 2016; Yang et al., 2020). Cells were stained with Zombie NIR Live-Dead exclusion dye (BioLegend) and anti-CD271-FITC Ab (BioLegend) and were then fixed and permeabilized. They were stained with anti-TNF-α-BV510, anti-IL-13-APC, anti-IL-4-PE, anti-IL-17A-BV785, anti-IL-10-PE-Dazzle594, anti-IL-5-BV421, and anti-IFN-γ-PerCp-Cy5.5 Abs and subjected to flow cytometry in an Aurora cytometer (Cytek).
Production of Th2 cytokines by pathogen-specific T cell clones
This experiment was performed as previously described (Yang et al., 2020). T cell libraries generated from memory CD4+ T cells were stimulated with autologous irradiated B cells and the BCG peptide pool (0.5 µg/ml/peptide, comprising 211 15-mer peptides), the HCMV peptide pool (0.5 µg/ml/peptide, comprising 76 15–20-mer peptides), the EBV peptide pool (0.5 µg/ml/peptide, comprising 46 15–20-mer peptides), the influenza virus HA peptide pool (2 µg/ml/peptide, comprising 351 15-mer peptides), the C. albicans peptide pool (0.5 µg ml/peptide, comprising 252 15-mer peptides) or the tetanus toxoid peptide pool (1 µg/ml/peptide, comprising 125 15–20-mer peptides; peptide pools kindly provided by C. Lindestam Arlehamn and A. Sette, La Jolla Institute for Immunology, La Jolla, CA; Geiger et al., 2009). Cytokine levels in the supernatant were determined in Luminex bead-based assays (Life Technologies) according to the manufacturer’s instructions.
Statistical analysis
Statistical analysis was performed with PRISM software (Graphpad). All values are expressed as the mean ± SD or SEM, as indicated in the figure legends. Student’s t tests, one-way ANOVA, two-way ANOVA, or nonparametric tests were performed, depending on the hypotheses tested, as explained in the figure legends. An α < 0.05 was considered statistically significant.
Online supplemental material
Fig. S1 supplements Fig. 1 and shows that overproduced or endogenous Mut T-bet fails to suppress Th2 cytokines. Fig. S2 supplements Fig. 2 and shows the production of Th2 cytokines in response to chronic stimulation. Fig. S3 supplements Fig. 4 and shows the epigenetic regulation of Th2 genes and antigen specificity of memory CD4+ T cells producing Th2 cytokines from inherited T-bet deficiency.
Acknowledgments
We thank the patients and their families; the members of the laboratory; Cecilia Lindestam Arlehamn and Alessandro Sette; David Jarrossay, Mathilde Foglierini, Ivo Kwee, and Murodzhon Akhmedov; Jean-Pierre Lantin; and the Genomics and the Flow Cytometry Resource Center of Rockefeller University. The MR1 tetramer technology was developed jointly by Dr. James McCluskey, Dr. Jamie Rossjohn, and Dr. David Fairlie, and the material was produced by the National Institutes of Health Tetramer Core Facility, with permission for distribution from the University of Melbourne. One figure panel was created with BioRender.com under proper subscription.
We thank the National Center for Advancing Translational Sciences of the National Institutes of Health (UL1TR001866 to Rockefeller University); the National Institute of Allergy and Infectious Diseases, National Institutes of Health (R37AI095983 to J.-L. Casanova and J. Bustamante); the Sackler Center for Biomedicine and Nutrition at the Center for Clinical and Translational Science; the Shapiro-Silverberg Fund for the Advancement of Translational Research at the Center for Clinical and Translational Science, Rockefeller University (to R. Yang); the Research Grant Program of the Immune Deficiency Foundation (to R. Yang); the Integrative Biology of Emerging Infectious Diseases Laboratory of Excellence (ANR-10-LABX-62-IBEID); the French National Research Agency under the “Investments for the Future” program (ANR-10-IAHU-01); ANR-GENMSMD (ANR-16-CE17-0005-01 to J. Bustamante); ANR-LTh-MSMD-CMCD (ANR-18-CE93-0008-01 to A. Puel and F. Sallusto); Fonds de Recherche en Santé Respiratoire (SRC2017 to J. Bustamante); the French Foundation for Medical Research (EQU201903007798); the SCOR Corporate Foundation for Science; and the Swiss National Science Foundation (310030L_182728 to F. Sallusto). J. Rosain was supported by an Institut national de la santé et de la recherche médicale Poste d’accueil; J. Rosain and P. Bastard were supported by the M.D.-Ph.D. program of the Imagine Institute (with the support of the Fondation Bettencourt Schueller); C.S. Ma is supported by an Early-Mid Career Research Fellowship from the Department of Health of the New South Wales Government of Australia; S.G. Tangye was supported by the National Health and Medical Research Council of Australia with a program grant (1113904), Principal Research Fellowship (1042925), and Leadership 3 Investigator grant (1176665); F. Sallusto and the Institute for Research in Biomedicine are supported by the Helmut Horten Foundation; and R. Yang was supported by the Stony Wold-Herbert Fund.
Author contributions: R. Yang, L.H. Glimcher, L. Abel, S.G. Tangye, F. Sallusto, J. Bustamante, and J.-L. Casanova conceptualized the study, designed the experiments, interpreted the data, and wrote the manuscript. R. Yang, M. Weisshaar, F. Mele, K. Dorgham, J. Han, C.A. Croft, S. Notarbartolo, B. Fleckenstein, J. Rosain, P. Bastard, A. Puel, J.P. Di Santo, C.S. Ma, G. Gorochov, and F. Sallusto conducted experiments and analyzed data. M. Weisshaar and F. Sallusto analyzed high-throughput sequencing data. I. Benhsaien, A. Bousfiha, and J. Bustamante took care of the patient. J. Bustamante, F. Sallusto, and J.-L. Casanova supervised the study. All authors provided input on the final manuscript.
References
- Amir, A.D., Davis K.L., Tadmor M.D., Simonds E.F., Levine J.H., Bendall S.C., Shenfeld D.K., Krishnaswamy S., Nolan G.P., and Pe’er D.. 2013. viSNE enables visualization of high dimensional single-cell data and reveals phenotypic heterogeneity of leukemia. Nat. Biotechnol. 31:545–552. 10.1038/nbt.2594 [DOI] [PMC free article] [PubMed] [Google Scholar]
- Amsen, D., Spilianakis C.G., and Flavell R.A.. 2009. How are T(H)1 and T(H)2 effector cells made? Curr. Opin. Immunol. 21:153–160. 10.1016/j.coi.2009.03.010 [DOI] [PMC free article] [PubMed] [Google Scholar]
- Au-Yeung, B.B., Katzman S.D., and Fowell D.J.. 2006. Cutting edge: Itk-dependent signals required for CD4+ T cells to exert, but not gain, Th2 effector function. J. Immunol. 176:3895–3899. 10.4049/jimmunol.176.7.3895 [DOI] [PubMed] [Google Scholar]
- Bergner, A., Kellner J., Silva A.K., Gamarra F., and Huber R.M.. 2006. Ca2+-signaling in airway smooth muscle cells is altered in T-bet knock-out mice. Respir. Res. 7:33. 10.1186/1465-9921-7-33 [DOI] [PMC free article] [PubMed] [Google Scholar]
- Carroll, K.N., Wu P., Gebretsadik T., Griffin M.R., Dupont W.D., Mitchel E.F., and Hartert T.V.. 2009. Season of infant bronchiolitis and estimates of subsequent risk and burden of early childhood asthma. J. Allergy Clin. Immunol. 123:964–966. 10.1016/j.jaci.2008.12.011 [DOI] [PMC free article] [PubMed] [Google Scholar]
- Carroll, T.S., Liang Z., Salama R., Stark R., and de Santiago I.. 2014. Impact of artifact removal on ChIP quality metrics in ChIP-seq and ChIP-exo data. Front. Genet. 5:75. 10.3389/fgene.2014.00075 [DOI] [PMC free article] [PubMed] [Google Scholar]
- Casanova, J.-L., Conley M.E., Seligman S.J., Abel L., and Notarangelo L.D.. 2014. Guidelines for genetic studies in single patients: lessons from primary immunodeficiencies. J. Exp. Med. 211:2137–2149. 10.1084/jem.20140520 [DOI] [PMC free article] [PubMed] [Google Scholar]
- Corbett, A.J., Eckle S.B.G., Birkinshaw R.W., Liu L., Patel O., Mahony J., Chen Z., Reantragoon R., Meehan B., Cao H., et al. 2014. T-cell activation by transitory neo-antigens derived from distinct microbial pathways. Nature. 509:361–365. 10.1038/nature13160 [DOI] [PubMed] [Google Scholar]
- de Groot, J.C., Ten Brinke A., and Bel E.H.D.. 2015. Management of the patient with eosinophilic asthma: a new era begins. ERJ Open Res. 1:00024-2015. 10.1183/23120541.00024-2015 [DOI] [PMC free article] [PubMed] [Google Scholar]
- de Santiago, I., and Carroll T.. 2018. Analysis of ChIP-seq Data in R/Bioconductor. Methods Mol. Biol. 1689:195–226. 10.1007/978-1-4939-7380-4_17 [DOI] [PubMed] [Google Scholar]
- Del Bel, K.L., Ragotte R.J., Saferali A., Lee S., Vercauteren S.M., Mostafavi S.A., Schreiber R.A., Prendiville J.S., Phang M.S., Halparin J., et al. 2017. JAK1 gain-of-function causes an autosomal dominant immune dysregulatory and hypereosinophilic syndrome. J. Allergy Clin. Immunol. 139:2016–2020.e5. 10.1016/j.jaci.2016.12.957 [DOI] [PubMed] [Google Scholar]
- Dorjbal, B., Stinson J.R., Ma C.A., Weinreich M.A., Miraghazadeh B., Hartberger J.M., Frey-Jakobs S., Weidinger S., Moebus L., Franke A., et al. 2019. Hypomorphic caspase activation and recruitment domain 11 (CARD11) mutations associated with diverse immunologic phenotypes with or without atopic disease. J. Allergy Clin. Immunol. 143:1482–1495. 10.1016/j.jaci.2018.08.013 [DOI] [PMC free article] [PubMed] [Google Scholar]
- Duechting, A., Przybyla A., Kuerten S., and Lehmann P.V.. 2017. Delayed Activation Kinetics of Th2- and Th17 Cells Compared to Th1 Cells. Cells. 6:29. 10.3390/cells6030029 [DOI] [PMC free article] [PubMed] [Google Scholar]
- Durrant, D.M., Gaffen S.L., Riesenfeld E.P., Irvin C.G., and Metzger D.W.. 2009. Development of allergen-induced airway inflammation in the absence of T-bet regulation is dependent on IL-17. J. Immunol. 183:5293–5300. 10.4049/jimmunol.0803109 [DOI] [PMC free article] [PubMed] [Google Scholar]
- Finotto, S., Neurath M.F., Glickman J.N., Qin S., Lehr H.A., Green F.H., Ackerman K., Haley K., Galle P.R., Szabo S.J., et al. 2002. Development of spontaneous airway changes consistent with human asthma in mice lacking T-bet. Science. 295:336–338. 10.1126/science.1065544 [DOI] [PubMed] [Google Scholar]
- Finotto, S., Hausding M., Doganci A., Maxeiner J.H., Lehr H.A., Luft C., Galle P.R., and Glimcher L.H.. 2005. Asthmatic changes in mice lacking T-bet are mediated by IL-13. Int. Immunol. 17:993–1007. 10.1093/intimm/dxh281 [DOI] [PubMed] [Google Scholar]
- Foster, P.S., Hogan S.P., Ramsay A.J., Matthaei K.I., and Young I.G.. 1996. Interleukin 5 deficiency abolishes eosinophilia, airways hyperreactivity, and lung damage in a mouse asthma model. J. Exp. Med. 183:195–201. 10.1084/jem.183.1.195 [DOI] [PMC free article] [PubMed] [Google Scholar]
- Freeman, A.F., and Holland S.M.. 2009. Clinical manifestations, etiology, and pathogenesis of the hyper-IgE syndromes. Pediatr. Res. 65:32R–37R. 10.1203/PDR.0b013e31819dc8c5 [DOI] [PMC free article] [PubMed] [Google Scholar]
- Fujiwara, M., Hirose K., Kagami S., Takatori H., Wakashin H., Tamachi T., Watanabe N., Saito Y., Iwamoto I., and Nakajima H.. 2007. T-bet inhibits both TH2 cell-mediated eosinophil recruitment and TH17 cell-mediated neutrophil recruitment into the airways. J. Allergy Clin. Immunol. 119:662–670. 10.1016/j.jaci.2006.12.643 [DOI] [PubMed] [Google Scholar]
- Garrido-Mesa, N., Schroeder J.-H., Stolarczyk E., Gallagher A.L., Lo J.W., Bailey C., Campbell L., Sexl V., MacDonald T.T., Howard J.K., et al. 2019. T-bet controls intestinal mucosa immune responses via repression of type 2 innate lymphoid cell function. Mucosal Immunol. 12:51–63. 10.1038/s41385-018-0092-6 [DOI] [PMC free article] [PubMed] [Google Scholar]
- Geiger, R., Duhen T., Lanzavecchia A., and Sallusto F.. 2009. Human naive and memory CD4+ T cell repertoires specific for naturally processed antigens analyzed using libraries of amplified T cells. J. Exp. Med. 206:1525–1534. 10.1084/jem.20090504 [DOI] [PMC free article] [PubMed] [Google Scholar]
- Gibbons, H.R., Shaginurova G., Kim L.C., Chapman N., Spurlock C.F. III, and Aune T.M.. 2018. Divergent lncRNA GATA3-AS1 Regulates GATA3 Transcription in T-Helper 2 Cells. Front. Immunol. 9:2512. 10.3389/fimmu.2018.02512 [DOI] [PMC free article] [PubMed] [Google Scholar]
- Glanville, N., Peel T.J., Schröder A., Aniscenko J., Walton R.P., Finotto S., and Johnston S.L.. 2016. Tbet Deficiency Causes T Helper Cell Dependent Airways Eosinophilia and Mucus Hypersecretion in Response to Rhinovirus Infection. PLoS Pathog. 12:e1005913. 10.1371/journal.ppat.1005913 [DOI] [PMC free article] [PubMed] [Google Scholar]
- Gour, N., and Wills-Karp M.. 2015. IL-4 and IL-13 signaling in allergic airway disease. Cytokine. 75:68–78. 10.1016/j.cyto.2015.05.014 [DOI] [PMC free article] [PubMed] [Google Scholar]
- Gruber, C.N., Calis J.J.A., Buta S., Evrony G., Martin J.C., Uhl S.A., Caron R., Jarchin L., Dunkin D., Phelps R., et al. 2020. Complex Autoinflammatory Syndrome Unveils Fundamental Principles of JAK1 Kinase Transcriptional and Biochemical Function. Immunity. 53:672–684.e11. 10.1016/j.immuni.2020.07.006 [DOI] [PMC free article] [PubMed] [Google Scholar]
- Grünig, G., Warnock M., Wakil A.E., Venkayya R., Brombacher F., Rennick D.M., Sheppard D., Mohrs M., Donaldson D.D., Locksley R.M., and Corry D.B.. 1998. Requirement for IL-13 independently of IL-4 in experimental asthma. Science. 282:2261–2263. 10.1126/science.282.5397.2261 [DOI] [PMC free article] [PubMed] [Google Scholar]
- Hafemeister, C., and Satija R.. 2019. Normalization and variance stabilization of single-cell RNA-seq data using regularized negative binomial regression. Genome Biol. 20:296. 10.1186/s13059-019-1874-1 [DOI] [PMC free article] [PubMed] [Google Scholar]
- Hershey, G.K.2003. IL-13 receptors and signaling pathways: an evolving web. J. Allergy Clin. Immunol. 111:677–690, quiz: 691. 10.1067/mai.2003.1333 [DOI] [PubMed] [Google Scholar]
- Hirose, K., Takahashi K., and Nakajima H.. 2013. Roles of IL-22 in Allergic Airway Inflammation. J. Allergy (Cairo). 2013:260518. 10.1155/2013/260518 [DOI] [PMC free article] [PubMed] [Google Scholar]
- Ho, I.C., Lo D., and Glimcher L.H.. 1998. c-maf promotes T helper cell type 2 (Th2) and attenuates Th1 differentiation by both interleukin 4-dependent and -independent mechanisms. J. Exp. Med. 188:1859–1866. 10.1084/jem.188.10.1859 [DOI] [PMC free article] [PubMed] [Google Scholar]
- Hosoya-Ohmura, S., Lin Y.-H., Herrmann M., Kuroha T., Rao A., Moriguchi T., Lim K.-C., Hosoya T., and Engel J.D.. 2011. An NK and T cell enhancer lies 280 kilobase pairs 3′ to the gata3 structural gene. Mol. Cell. Biol. 31:1894–1904. 10.1128/MCB.05065-11 [DOI] [PMC free article] [PubMed] [Google Scholar]
- Hwang, E.S., Szabo S.J., Schwartzberg P.L., and Glimcher L.H.. 2005. T helper cell fate specified by kinase-mediated interaction of T-bet with GATA-3. Science. 307:430–433. 10.1126/science.1103336 [DOI] [PubMed] [Google Scholar]
- Jackson, D.J., Gangnon R.E., Evans M.D., Roberg K.A., Anderson E.L., Pappas T.E., Printz M.C., Lee W.M., Shult P.A., Reisdorf E., et al. 2008. Wheezing rhinovirus illnesses in early life predict asthma development in high-risk children. Am. J. Respir. Crit. Care Med. 178:667–672. 10.1164/rccm.200802-309OC [DOI] [PMC free article] [PubMed] [Google Scholar]
- Kanhere, A., Hertweck A., Bhatia U., Gökmen M.R., Perucha E., Jackson I., Lord G.M., and Jenner R.G.. 2012. T-bet and GATA3 orchestrate Th1 and Th2 differentiation through lineage-specific targeting of distal regulatory elements. Nat. Commun. 3:1268. 10.1038/ncomms2260 [DOI] [PMC free article] [PubMed] [Google Scholar]
- Kidd, P.2003. Th1/Th2 balance: the hypothesis, its limitations, and implications for health and disease. Altern. Med. Rev. 8:223–246. [PubMed] [Google Scholar]
- Lazarevic, V., Chen X., Shim J.H., Hwang E.S., Jang E., Bolm A.N., Oukka M., Kuchroo V.K., and Glimcher L.H.. 2011. T-bet represses T(H)17 differentiation by preventing Runx1-mediated activation of the gene encoding RORγt. Nat. Immunol. 12:96–104. 10.1038/ni.1969 [DOI] [PMC free article] [PubMed] [Google Scholar]
- Liao, Y., Smyth G.K., and Shi W.. 2014. featureCounts: an efficient general purpose program for assigning sequence reads to genomic features. Bioinformatics. 30:923–930. 10.1093/bioinformatics/btt656 [DOI] [PubMed] [Google Scholar]
- Lim, A.I., Li Y., Lopez-Lastra S., Stadhouders R., Paul F., Casrouge A., Serafini N., Puel A., Bustamante J., Surace L., et al. 2017. Systemic Human ILC Precursors Provide a Substrate for Tissue ILC Differentiation. Cell. 168:1086–1100.e10. 10.1016/j.cell.2017.02.021 [DOI] [PubMed] [Google Scholar]
- Lotz, M.T., Moore M.L., and Peebles R.S. Jr. 2013. Respiratory syncytial virus and reactive airway disease. Curr. Top. Microbiol. Immunol. 372:105–118. 10.1007/978-3-642-38919-1_5 [DOI] [PMC free article] [PubMed] [Google Scholar]
- Lyons, J.J., and Milner J.D.. 2018. Primary atopic disorders. J. Exp. Med. 215:1009–1022. 10.1084/jem.20172306 [DOI] [PMC free article] [PubMed] [Google Scholar]
- MacCarrick, G., Black J.H. III, Bowdin S., El-Hamamsy I., Frischmeyer-Guerrerio P.A., Guerrerio A.L., Sponseller P.D., Loeys B., and Dietz H.C. III. 2014. Loeys-Dietz syndrome: a primer for diagnosis and management. Genet. Med. 16:576–587. 10.1038/gim.2014.11 [DOI] [PMC free article] [PubMed] [Google Scholar]
- Mark, B.J., Becker B.A., Halloran D.R., Bree A.F., Sindwani R., Fete M.D., Motil K.J., Srun S.W., and Fete T.J.. 2012. Prevalence of atopic disorders and immunodeficiency in patients with ectodermal dysplasia syndromes. Ann. Allergy Asthma Immunol. 108:435–438. 10.1016/j.anai.2012.04.010 [DOI] [PMC free article] [PubMed] [Google Scholar]
- Martínez-Barricarte, R., de Jong S.J., Markle J., de Paus R., Boisson-Dupuis S., Bustamante J., van de Vosse E., Fleckenstein B., and Casanova J.-L.. 2016. Transduction of Herpesvirus saimiri-Transformed T Cells with Exogenous Genes of Interest. Curr. Protoc. Immunol. 115:1–: 12.. 10.1002/cpim.15 [DOI] [PubMed] [Google Scholar]
- Matsuki, A., Takatori H., Makita S., Yokota M., Tamachi T., Suto A., Suzuki K., Hirose K., and Nakajima H.. 2017. T-bet inhibits innate lymphoid cell-mediated eosinophilic airway inflammation by suppressing IL-9 production. J. Allergy Clin. Immunol. 139:1355–1367.e6. 10.1016/j.jaci.2016.08.022 [DOI] [PubMed] [Google Scholar]
- Miller, A.T., Wilcox H.M., Lai Z., and Berg L.J.. 2004. Signaling through Itk promotes T helper 2 differentiation via negative regulation of T-bet. Immunity. 21:67–80. 10.1016/j.immuni.2004.06.009 [DOI] [PubMed] [Google Scholar]
- Milner, J.D.2020. Primary Atopic Disorders. Annu. Rev. Immunol. 38:785–808. 10.1146/annurev-immunol-042718-041553 [DOI] [PubMed] [Google Scholar]
- Ohmura, S., Mizuno S., Oishi H., Ku C.J., Hermann M., Hosoya T., Takahashi S., and Engel J.D.. 2016. Lineage-affiliated transcription factors bind the Gata3 Tce1 enhancer to mediate lineage-specific programs. J. Clin. Invest. 126:865–878. 10.1172/JCI83894 [DOI] [PMC free article] [PubMed] [Google Scholar]
- Pelaia, C., Paoletti G., Puggioni F., Racca F., Pelaia G., Canonica G.W., and Heffler E.. 2019. Interleukin-5 in the Pathophysiology of Severe Asthma. Front. Physiol. 10:1514. 10.3389/fphys.2019.01514 [DOI] [PMC free article] [PubMed] [Google Scholar]
- Peled, A., Sarig O., Sun G., Samuelov L., Ma C.A., Zhang Y., Dimaggio T., Nelson C.G., Stone K.D., Freeman A.F., et al. 2019. Loss-of-function mutations in caspase recruitment domain-containing protein 14 (CARD14) are associated with a severe variant of atopic dermatitis. J. Allergy Clin. Immunol. 143:173–181.e10. 10.1016/j.jaci.2018.09.002 [DOI] [PubMed] [Google Scholar]
- Piggott, D.A., Eisenbarth S.C., Xu L., Constant S.L., Huleatt J.W., Herrick C.A., and Bottomly K.. 2005. MyD88-dependent induction of allergic Th2 responses to intranasal antigen. J. Clin. Invest. 115:459–467. 10.1172/JCI200522462 [DOI] [PMC free article] [PubMed] [Google Scholar]
- Quirion, M.R., Gregory G.D., Umetsu S.E., Winandy S., and Brown M.A.. 2009. Cutting edge: Ikaros is a regulator of Th2 cell differentiation. J. Immunol. 182:741–745. 10.4049/jimmunol.182.2.741 [DOI] [PMC free article] [PubMed] [Google Scholar]
- Raby, B.A., Hwang E.S., Van Steen K., Tantisira K., Peng S., Litonjua A., Lazarus R., Giallourakis C., Rioux J.D., Sparrow D., et al. 2006. T-bet polymorphisms are associated with asthma and airway hyperresponsiveness. Am. J. Respir. Crit. Care Med. 173:64–70. 10.1164/rccm.200503-505OC [DOI] [PMC free article] [PubMed] [Google Scholar]
- Reuter, S., Maxeiner J., Meyer-Martin H., Michel A., Baars P., Bopp T., Waisman A., Reissig S., Wehler T.C., Schild H., et al. 2016. Cylindromatosis (Cyld) gene mutation in T cells promotes the development of an IL-9-dependent allergic phenotype in experimental asthma. Cell. Immunol. 308:27–34. 10.1016/j.cellimm.2016.06.003 [DOI] [PubMed] [Google Scholar]
- Robinson, J.T., Thorvaldsdóttir H., Winckler W., Guttman M., Lander E.S., Getz G., and Mesirov J.P.. 2011. Integrative genomics viewer. Nat. Biotechnol. 29:24–26. 10.1038/nbt.1754 [DOI] [PMC free article] [PubMed] [Google Scholar]
- Rothenberg, M.E., and Hogan S.P.. 2006. The eosinophil. Annu. Rev. Immunol. 24:147–174. 10.1146/annurev.immunol.24.021605.090720 [DOI] [PubMed] [Google Scholar]
- Roufosse, F.2018. Targeting the interleukin-5 pathway for treatment of eosinophilic conditions other than asthma. Front. Med. (Lausanne). 5:49. 10.3389/fmed.2018.00049 [DOI] [PMC free article] [PubMed] [Google Scholar]
- Sigurs, N., Aljassim F., Kjellman B., Robinson P.D., Sigurbergsson F., Bjarnason R., and Gustafsson P.M.. 2010. Asthma and allergy patterns over 18 years after severe RSV bronchiolitis in the first year of life. Thorax. 65:1045–1052. 10.1136/thx.2009.121582 [DOI] [PubMed] [Google Scholar]
- Singer, C.A.2011. T-bet is induced by interferon-γ to mediate chemokine secretion and migration in human airway smooth muscle cells. Am. J. Physiol. Lung Cell. Mol. Physiol. 300:L633–L641. 10.1152/ajplung.00163.2010 [DOI] [PMC free article] [PubMed] [Google Scholar]
- Solomou, E.E., Keyvanfar K., and Young N.S.. 2006. T-bet, a Th1 transcription factor, is up-regulated in T cells from patients with aplastic anemia. Blood. 107:3983–3991. 10.1182/blood-2005-10-4201 [DOI] [PMC free article] [PubMed] [Google Scholar]
- Spencer, S., Köstel Bal S., Egner W., Lango Allen H., Raza S.I., Ma C.A., Gürel M., Zhang Y., Sun G., Sabroe R.A., et al. 2019. Loss of the interleukin-6 receptor causes immunodeficiency, atopy, and abnormal inflammatory responses. J. Exp. Med. 216:1986–1998. 10.1084/jem.20190344 [DOI] [PMC free article] [PubMed] [Google Scholar]
- Stein, R.T., Sherrill D., Morgan W.J., Holberg C.J., Halonen M., Taussig L.M., Wright A.L., and Martinez F.D.. 1999. Respiratory syncytial virus in early life and risk of wheeze and allergy by age 13 years. Lancet. 354:541–545. 10.1016/S0140-6736(98)10321-5 [DOI] [PubMed] [Google Scholar]
- Stuart, T., Butler A., Hoffman P., Hafemeister C., Papalexi E., Mauck W.M. III, Hao Y., Stoeckius M., Smibert P., and Satija R.. 2019. Comprehensive Integration of Single-Cell Data. Cell. 177:1888–1902.e21. 10.1016/j.cell.2019.05.031 [DOI] [PMC free article] [PubMed] [Google Scholar]
- Szabo, S.J., Kim S.T., Costa G.L., Zhang X., Fathman C.G., and Glimcher L.H.. 2000. A novel transcription factor, T-bet, directs Th1 lineage commitment. Cell. 100:655–669. 10.1016/S0092-8674(00)80702-3 [DOI] [PubMed] [Google Scholar]
- Tangye, S.G., Pillay B., Randall K.L., Avery D.T., Phan T.G., Gray P., Ziegler J.B., Smart J.M., Peake J., Arkwright P.D., et al. 2017. Dedicator of cytokinesis 8-deficient CD4+ T cells are biased to a TH2 effector fate at the expense of TH1 and TH17 cells. J. Allergy Clin. Immunol. 139:933–949. 10.1016/j.jaci.2016.07.016 [DOI] [PMC free article] [PubMed] [Google Scholar]
- Tantisira, K.G., Hwang E.S., Raby B.A., Silverman E.S., Lake S.L., Richter B.G., Peng S.L., Drazen J.M., Glimcher L.H., and Weiss S.T.. 2004. TBX21: a functional variant predicts improvement in asthma with the use of inhaled corticosteroids. Proc. Natl. Acad. Sci. USA. 101:18099–18104. 10.1073/pnas.0408532102 [DOI] [PMC free article] [PubMed] [Google Scholar]
- Tesciuba, A.G., Shilling R.A., Agarwal M.D., Bandukwala H.S., Clay B.S., Moore T.V., Weinstock J.V., Welcher A.A., and Sperling A.I.. 2008. ICOS costimulation expands Th2 immunity by augmenting migration of lymphocytes to draining lymph nodes. J. Immunol. 181:1019–1024. 10.4049/jimmunol.181.2.1019 [DOI] [PMC free article] [PubMed] [Google Scholar]
- Usui, T., Nishikomori R., Kitani A., and Strober W.. 2003. GATA-3 suppresses Th1 development by downregulation of Stat4 and not through effects on IL-12Rbeta2 chain or T-bet. Immunity. 18:415–428. 10.1016/S1074-7613(03)00057-8 [DOI] [PubMed] [Google Scholar]
- Usui, T., Preiss J.C., Kanno Y., Zheng J.Y., Bream J.H., O’Shea J.J., and Strober W.. 2006. T-bet regulates Th1 responses through essential effects on GATA-3 function rather than on IFNG gene acetylation and transcription. J. Exp. Med. 203:755–766. 10.1084/jem.20052165 [DOI] [PMC free article] [PubMed] [Google Scholar]
- Wang, Y., Ma C.S., Ling Y., Bousfiha A., Camcioglu Y., Jacquot S., Payne K., Crestani E., Roncagalli R., Belkadi A., et al. 2016. Dual T cell- and B cell-intrinsic deficiency in humans with biallelic RLTPR mutations. J. Exp. Med. 213:2413–2435. 10.1084/jem.20160576 [DOI] [PMC free article] [PubMed] [Google Scholar]
- Williams, K.W., Milner J.D., and Freeman A.F.. 2015. Eosinophilia Associated with Disorders of Immune Deficiency or Immune Dysregulation. Immunol. Allergy Clin. North Am. 35:523–544. 10.1016/j.iac.2015.05.004 [DOI] [PMC free article] [PubMed] [Google Scholar]
- Wills-Karp, M., Luyimbazi J., Xu X., Schofield B., Neben T.Y., Karp C.L., and Donaldson D.D.. 1998. Interleukin-13: central mediator of allergic asthma. Science. 282:2258–2261. 10.1126/science.282.5397.2258 [DOI] [PubMed] [Google Scholar]
- Wood, P.M.D., Fieschi C., Picard C., Ottenhoff T.H.M., Casanova J.L., and Kumararatne D.S.. 2005. Inherited defects in the interferon-gamma receptor or interleukin-12 signalling pathways are not sufficient to cause allergic disease in children. Eur. J. Pediatr. 164:741–747. 10.1007/s00431-005-1745-5 [DOI] [PubMed] [Google Scholar]
- Yagi, R., Junttila I.S., Wei G., Urban J.F. Jr., Zhao K., Paul W.E., and Zhu J.. 2010. The transcription factor GATA3 actively represses RUNX3 protein-regulated production of interferon-γ. Immunity. 32:507–517. 10.1016/j.immuni.2010.04.004 [DOI] [PMC free article] [PubMed] [Google Scholar]
- Yang, R., Mele F., Worley L., Langlais D., Rosain J., Benhsaien I., Elarabi H., Croft C.A., Doisne J.-M., Zhang P., et al. 2020. Human T-bet Governs Innate and Innate-like Adaptive IFN-γ Immunity against Mycobacteria. Cell. 183:1826–1847.e31. 10.1016/j.cell.2020.10.046 [DOI] [PMC free article] [PubMed] [Google Scholar]
- Zhang, Q., Davis J.C., Lamborn I.T., Freeman A.F., Jing H., Favreau A.J., Matthews H.F., Davis J., Turner M.L., Uzel G., et al. 2009. Combined immunodeficiency associated with DOCK8 mutations. N. Engl. J. Med. 361:2046–2055. 10.1056/NEJMoa0905506 [DOI] [PMC free article] [PubMed] [Google Scholar]
- Zhu, Z., Homer R.J., Wang Z., Chen Q., Geba G.P., Wang J., Zhang Y., and Elias J.A.. 1999. Pulmonary expression of interleukin-13 causes inflammation, mucus hypersecretion, subepithelial fibrosis, physiologic abnormalities, and eotaxin production. J. Clin. Invest. 103:779–788. 10.1172/JCI5909 [DOI] [PMC free article] [PubMed] [Google Scholar]
- Zhu, J., Jankovic D., Oler A.J., Wei G., Sharma S., Hu G., Guo L., Yagi R., Yamane H., Punkosdy G., et al. 2012. The transcription factor T-bet is induced by multiple pathways and prevents an endogenous Th2 cell program during Th1 cell responses. Immunity. 37:660–673. 10.1016/j.immuni.2012.09.007 [DOI] [PMC free article] [PubMed] [Google Scholar]