

Objective:
Focused ultrasound (FUS) has emerged as a non-invasive technique to locally and reversibly disrupt the blood-brain barrier (BBB). Here, we investigate the use of diffusion tensor imaging (DTI) as a means of detecting FUS-induced BBB opening at the absence of an MRI contrast agent. A non-human primate (NHP) was repeatedly treated with FUS and preformed circulating microbubbles to transiently disrupt the BBB (n = 4). T1- and diffusion-weighted MRI scans were acquired after the ultrasound treatment, with and without gadolinium-based contrast agent, respectively. Both scans were registered with a high-resolution T1-weighted scan of the NHP to investigate signal correlations. DTI detected an increase in the fractional anisotropy from 0.21 ± 0.02 to 0.38 ± 0.03 (82.6 ± 5.2% change) within the targeted area one hour after BBB opening. Enhanced DTI contrast overlapped by 77.22 ± 9.2% with hyper-intense areas of gadolinium-enhanced T1-weighted scans, indicating diffusion anisotropy enhancement only within the BBB opening volume. Diffusion was highly anisotropic and unidirectional within the treated brain region, as indicated by the direction of the principal diffusion eigenvectors. Polar and azimuthal angle ranges decreased by 35.6% and 82.4%, respectively, following BBB opening. Evaluation of the detection methodology on a second NHP (n=1) confirmed the across-animal feasibility of the technique. In conclusion, DTI may be used as a contrast-free MR imaging modality in place of contrast-enhanced T1 mapping for detecting BBB opening during focused-ultrasound treatment or evaluating BBB integrity in brain-related pathologies.
Keywords: diffusion tensor imaging, blood-brain barrier, focused ultrasound, microbubbles
I. Introduction
BRAIN tumors and neurodegenerative diseases, such as Alzheimer’s or Parkinson’s disease, remain undertreated largely due to the presence of the blood-brain barrier (BBB). The BBB surrounds cerebral microvessels and tightly regulates the influx and efflux of molecules circulating in the bloodstream, hindering the delivery of pharmacological agents larger than 400 Da [1]–[3]. Bypassing the BBB has been attempted by numerous invasive or non-localized techniques, including direct injection into the brain parenchyma and intra-arterial injection of hyperosmolar solutions (mannitol or lactamide) among others [4]–[6]. The only non-invasive, targeted, and reversible method to transiently and safely open the BBB is the synergistic application of focused ultrasound (FUS) and circulating microbubbles (MBs) [7], [8].
FUS in conjunction with pre-formed MBs has been studied for decades as a means to facilitate the delivery of a wide range of therapeutic agents, such as antibodies [9], neurotrophic factors [10], proteins [11], viral vectors [12], stem cells [13], nanoparticles [14], and chemotherapeutics [15], through the BBB. Following a large body of promising pre-clinical work, a number of clinical trials are currently in progress, aiming to efficiently and safely open the BBB in patients with Alzheimer’s disease [16], glioblastoma [17], and amyotrophic lateral sclerosis [18]. The gold standard for the detection of FUS-induced BBB opening, as measured by its widespread use, is contrast-enhanced T1-weighted MRI [16], [19]–[21]. Gadolinium (Gd)-based contrast agents (GBCAs) typically have a molecular weight of approximately 600 Da and are naturally impermeable to the intact BBB. Given their size, GBCAs can delineate even moderate BBB openings and also provide spatiotemporal information of vascular permeability variation via dynamic contrast-enhanced (DCE) MRI [20]–[23].
Although GBCAs have an established safety profile, there are emerging concerns regarding their toxicity and tissue retention. Linear GBCAs have been correlated with hypersensitivity reactions and nephrogenic systemic fibrosis [24], [25]. There has been evidence that Gd is retained within certain areas of the brain (e.g., the dentate nucleus) following repeated administration of linear GBCAs [26]–[29], an effect which is exacerbated in subjects with renal impairment [30], [31] and in pediatric patients [32], [33]. Regulatory authorities have therefore recommended the gradual replacement of linear GBCAs with macrocyclic GBCAs that have a lower retention rate and limited deposition into the brain [34], [35]. However, the long-term effects of Gd retention in the brain are currently still unknown.
The growing safety concerns over GBCAs necessitate the exploration of non-Gd alternatives. The carboxymethyldextran coated-iron oxide nanoparticle, Ferumoxytol, has been investigated as a potential candidate [36]. However, lacking the molecular characteristics and pharmacokinetic properties of GBCAs, it provides only complementary information and has been deemed unsuitable for BBB disruption detection [36]. To overcome the shortfalls of iron oxide nanoparticles, complexes of manganese-based contrast agents have been developed [37], [38]. Manganese, a trace element essential for physiological body functions, possesses the strong paramagnetic properties essential for MRI contrast agents [37], [38]. Engineering effective and stable manganese-based contrast agents has been challenging, but development of the Mn-PyC3A compound shows promise [37]. Arterial spin labeling (ASL) has also been introduced as a substitute to contrast-enhanced imaging techniques, primarily focusing on the quantitative measurement of tissue perfusion [39]. Despite the alternatives, further investigation is needed to completely replace contrast-enhanced MRI with contrast-free MRI as the gold standard for evaluating spatial variations in BBB integrity and, in particular, FUS-induced BBB opening.
Herein, we explore and evaluate the potential of diffusion-weighted imaging (DWI) as a promising candidate to replace contrast-enhanced T1-weighted imaging in detecting BBB permeability. DWI has been used extensively in brain applications including the diagnosis of stroke [40]–[42], edema formation [43], subarachnoid hemorrhage [44] and multiple sclerosis [45], [46]. In this context, diffusion refers to the random translational motion of molecules (i.e., Brownian motion) driven by the thermal energy carried by the molecules [1], [47]. During displacement, molecules probe the surrounding tissue at a microscopic scale. The resulting displacement distribution with respect to the tissue organization, is captured in the DWI image contrast [48]. The capabilities of this technique expand further to the detection of the displacement directionality (isotropic or anisotropic) associated with gradient pulses driven at different directions sensitizing displacements along that direction [49]–[51], namely the diffusion tensor imaging (DTI) [47], [52], [53]. In DTI, diffusion-weighted images are acquired along multiple directions (i.e. at least 6 directions) along with an image acquired without weighting (b = 0 s/mm2) in order to populate the diffusion tensor, which is a three-by-three, symmetric, positive definite matrix [54]. The diffusion tensor D is connected with the diffusion-weighted signal intensity Sk and the b = 0 s/mm2 signal S0 via the Stejskal and Tanner equation [55], [56]:
| (1) |
where gk is the kth gradient direction, γ is the gyromagnetic ratio, G is the amplitude of the diffusion gradients, δ is the diffusion gradient duration, and Δ is the interval between two successive diffusion gradients on either side of the refocusing pulse [54].
The eigenvectors (v1, v2, v3) and eigenvalues (λ1, λ2, λ3 with λ1 ≥ λ2 ≥ λ3) of the diffusion tensor can be computed to characterize the diffusion ellipsoid in each voxel. Spherical ellipsoids (λ1 ≈ λ2 ≈ λ3) indicate symmetric and isotropic water diffusion, while planar (λ1 ≈ λ2 > λ3) and tubular (λ1 > λ2 ≈ λ3) ellipsoids indicate asymmetric and anisotropic water diffusion. Anisotropic water diffusion is routinely employed to identify white matter tracts at high resolution in MR tractography applications [56]–[58]. A frequently used metric of diffusion anisotropy in the interval [0,1] is fractional anisotropy (FA), a non-linear dimensionless combination of the eigenvalues expressing their normalized variance [50], [59]:
| (2) |
FA maps have been previously used to identify the causes of epilepsy [60], schizophrenia [61], amyotrophic lateral sclerosis [62], and dyslexia [63]. Additionally, FA mapping can identify morphological changes in axons following traumatic brain injury [64]. Interestingly, FA values change following repeated BBB disruption induced by traumatic brain injury in football players [65]. In the context of FUS-mediated BBB opening, DTI reveals normal microstructure and tissue integrity in repeatedly treated rodents over a period of months [66].
In this study, we hypothesize that a localized FUS-induced BBB opening will induce a change in the diffusion tensor within the targeted area. The direction of the principal diffusion vector v1 and the FA values are both expected to change locally following FUS treatment due to the anisotropic stresses exerted by asymmetric microbubble oscillations within the microvasculature [67]. Diffusion from and towards the brain parenchyma is expected to be altered following the FUS treatment, since a BBB disruption would enhance small molecule diffusion compared to the intact BBB. Such change in diffusion properties is expected to be more pronounced within gray matter, due to its intrinsic isotropic structure and increased vascular density relative to white matter tracts [20]. This hypothesis was investigated in a non-human primate (NHP) model, which closely resembles the human brain and skull. The correspondence of the contrast-enhanced T1-weighted and DTI observations was examined in terms of accurately detecting and quantifying the FUS-induced and MB-mediated BBB opening. Across-animal feasibility of the developed technique was validated by employing a second NHP. The overall aim is to provide a Gd-free alternative to potentially toxic GBCA enhanced T1-weighted MRI for detecting BBB opening.
II. MATERIALS AND METHODS
All animal procedures were approved by the local Institutional Animal Care and Use Committee (IACUC). One NHP (rhesus macaque, weight: 11 kg, age: 20 years old) was repeatedly sonicated in the Caudate nucleus region for six treatment sessions in total, four successfully completed and two interrupted. One month prior to the initiation of the experimental procedure, the baseline sequences were acquired, including DTI (Supplementary Figure 1) followed by Gadolinium injection and T1-weighted imaging. The baseline scans provided reference images necessary for registration and normalization purposes, described in the next section. Following every sonication, Susceptibility Weighted Imaging (SWI) and DTI were performed prior to the injection of Gadolinium that preceded T1-weighted imaging (Figure 1A). The animal was allowed to rest for four weeks before repeating the experimental procedure to minimize the repeated exposure to anesthetics, hence the animal’s age. Within the aforementioned time course the BBB can be safely considered as reinstated based on the closure timeline provided in previous studies [68], [69]. Following the repeated sonications and the initial evaluation of the DTI-detection methodology, a second NHP (rhesus macaque, weight: 13 kg, age: 22 years old) was sonicated once in the Caudate nucleus adhering to the aforementioned steps.
Fig. 1.
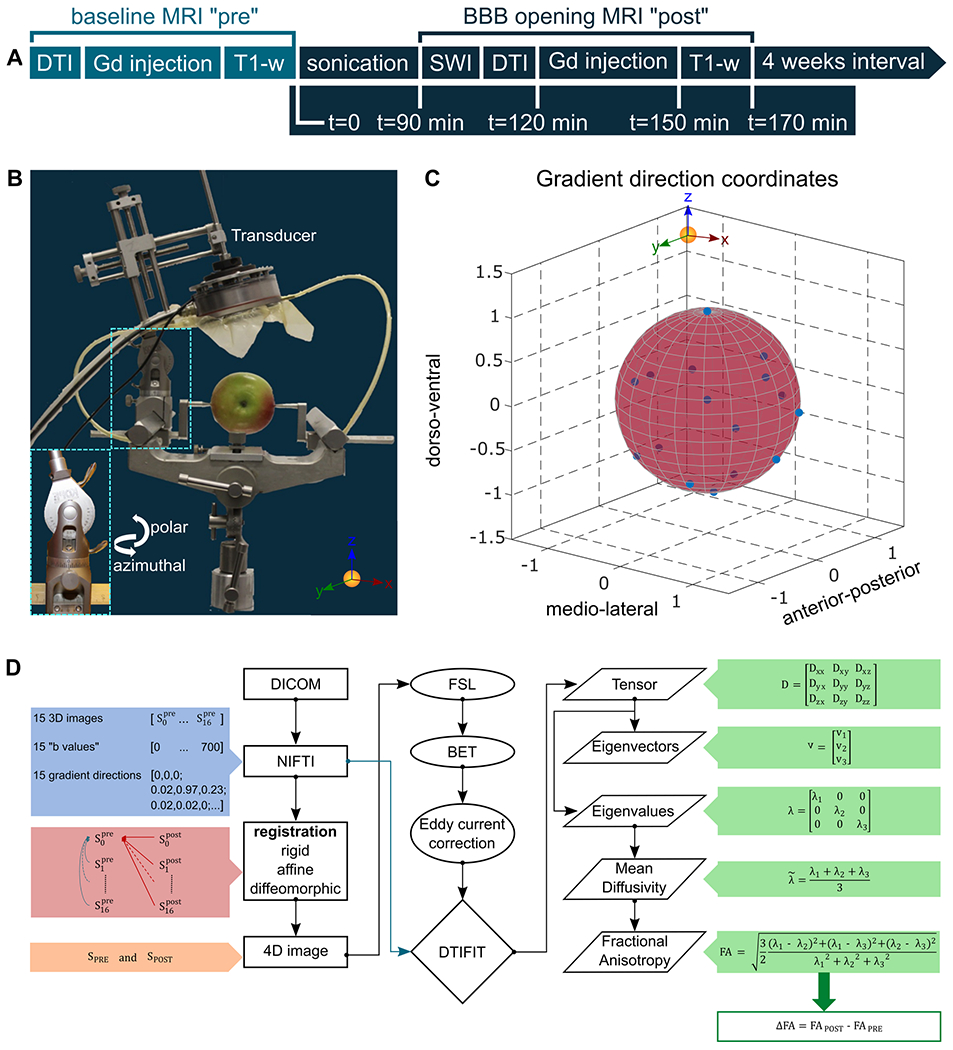
A. Timeline of the experimental procedure. The baseline scans were acquired once one month before the initiation of the sonications. SWI and DTI precede Gadolinium injection followed by T1-weighted imaging. The procedure was repeated once per month for six treatments in total, yet only four were successfully completed. B. Transducer orientation relative to the brain fixed on the stereotactic frame. C. Gradient direction coordinates are presented to confirm that diffusion sampling occurred in the entire sphere, a requirement imposed by the eddy current correction accuracy. D. Flowchart of the DTI processing pipeline. The raw data were transformed from DICOM to NIFTI format and all the directions were registered to the weight- and gradient-free image of the scan acquired before the sonications. The registered images were combined in a 4D format that was isolated from the surrounding brain tissue and corrected for eddy current artifacts. Then, the calculation of the tensor and the corresponding eigenvalues and eigenvectors resulted from the DTIFIT. The mean diffusivity and the fractional anisotropy maps were quantified by employing the appropriate equations. The difference in the FA values is reported herein, denoted as ΔFA, and resulted from the subtraction of the FA map obtained before the sonication from the FA map acquired following the sonication.
In every experimental session, the NHP was immobilized by intramuscular administration of a cocktail containing ketamine (10 mg/kg) and atropine (0.02–0.04 mg/kg) allowing sufficient time for endotracheal tube placement, catheterization and positioning on the stereotaxic frame (Figure 1B). While in the operation room, anesthesia was maintained with 1–3% isoflurane mixed with O2 (2 L/min) throughout the treatment session. Once the animal was in place, the transducer was attached to the Kopf stereotaxic manipulator following a previously described targeting procedure based on stereotaxic frame coordinates (Figure 1B) [20]. Pulse sequences that have been proven to induce both efficient and safe BBB disruption in this NHP (peak-negative pressure: 0.45 MPa, incidence angle 85 ± 2°, pulse length: 10 ms, pulse repetition frequency: 2 Hz, total sonication time: 2 min) were selected for the sonication [20], [68]. The angle is defined with respect to the tangential surface at the ultrasound beam incidence with the skull curvature [20]. Size-isolated (diameter 4–5 μm), lipid-shelled microbubbles were manufactured in-house [70] and were injected through the saphenous vein 10 s after the sonication onset at a dosage of 2.5 × 10⁸ microbubbles/kg.
FUS-induced BBB opening in NHPs has been previously described in detail [20], [68], [71], [72]. Briefly, a 500 kHz spherical-segment single-element FUS transducer (part number H-207, diameter: 64 mm, focal depth: 62.6 mm, -3dB focal length: 34 mm, -3dB focal width: 5.85 mm; Sonic Concepts, Bothell, WA, USA) was used to transcranially apply FUS aimed at the Caudate nucleus region of the NHP brain. The FUS transducer was driven by an arbitrary waveform generator (part number 33220A; Agilent Technologies, CA, USA) through a 50-dB RF power amplifier (A075, E&I, NY, USA). The microbubble response was continuously monitored in real-time through a broadband, spherically-focused hydrophone (part number: Y107, focal depth: 60 mm; radius 19.75 mm; Sonic Concepts, WA, USA), which was confocally aligned with the FUS transducer and operated in passive cavitation detection mode. The microbubble acoustic emissions were passively recorded with the hydrophone, amplified with a pulser-receiver (Olympus, Waltham, MA, USA), and saved to a PC through a digital oscilloscope (GaGe Applied Technologies, Montreal, QC, Canada). Cavitation data confirmed microbubble activity in real-time, however no further processing was conducted for this study.
Following the FUS procedure, the animal was transferred to the MRI scanner (3T Philips Achieva) for contrast-free DWI and contrast-enhanced T1-weighted imaging. As previously described [20], high-resolution structural contrast-enhanced T1-weighted images were acquired (Gradient Echo, TR/TE= 11.16 ms / 5.14 ms, flip angle= 8°, FOV= 120 x 120 mm2, matrix size: 176 x 176, NSA=1, slice thickness 0.7 mm, 171 slices) at two time-points. The pre-sonication scan (baseline T1wPRE) was acquired 30 minutes after intravenous administration of 0.2 ml/kg GBCA (gadodiamide) preceding any sonication while the post-sonication scan (T1wPOST) was acquired after every sonication (Figure 1A). T1-weighted imaging was employed as the most commonly employed sequence in BBB opening detection to compare with the new imaging modality. DWI always preceded any contrast injection to avoid signal distortion due to the Gd presence.
The DTI protocol consisted of a single-shot spin-echo echo planar DTI sequence with TR/TE= 3475 ms / 72 ms, flip angle = 90°, FOV = 120 × 120 mm2, matrix size: 128 × 128, NSA= 1, slice thickness 2 mm, 28 slices, 15 different weighted gradient directions covering the entire brain volume (Figure 1C) and a b-value equal to 700 s/mm2. An accelerated DTI scan with SENSE (Sensitivity encoding) factor 2 was acquired (scan time < 10 min) prior to the initiation of the experiments (baseline DTIPRE) and one immediately after every sonication (DTIPOST) to enable intra-brain comparison of the diffusion metrics before and after the BBB opening (Figure 1A).
The raw data collected from the MRI scanner were converted from DICOM format to NIFTI format prior to the analysis (Figure 1D). The susceptibility of the EPI sequence to distortion artifacts and the necessity of single voxel precision dictated the need for a nonlinear registration algorithm. The Advanced Normalization Tools (ANTS) library was employed to register all directions of the DTI scans (DTIPRE and DTIPOST) to the reference baseline scan, which in this case was the diffusion gradient-free (b = 0 s/mm2), weight-free direction of the DTIPRE scan, (Figure 1D). ANTs is an ITK-built software package, comprised of powerful tools for image registration and segmentation [73] classified among the highest-ranking registration methods [74]. The default executable implements a symmetric, geodesic diffeomorphic transformation. Following the principles of an extended Lagrangian diffeomorphic technique [75], the optimization of the displacement map results in the alignment of two images. Symmetric mapping guarantees that the map from the “moving” image to the “reference” image is the same as the path from the “reference” to the “moving” image regardless of the similarity metric and the optimization parameters [75]. In this deformation space, the shortest paths between elements are termed geodesic while diffeomorphism refers to a differentiable map with a differentiable inverse [75].
The registration was initialized with rigid and affine mapping (Figure 1D) to linearly transform the “moving” image to the orientation of the “reference” image. Linear transformation is necessary to meet the symmetric diffeomorphisms’ assumption of homogeneous boundary conditions (image borders map to themselves) for solutions restricted to the diffeomorphic space [75]. Hence, ANTs assumes that a diffeomorphism “φ” defined on the image domain “Ω” maintains an affine transform at the boundaries. Over time, the map “φ” parametrizes a group of diffeomorphisms by integrating a time-dependent, smooth velocity field described largely by:
| (3) |
| (4) |
| (5) |
where u denotes the velocity, L the smoothing operator, t the time, λ controls the matching exactness, x is the spatial position, Π~ is the similarity metric and I is the moving image to be transformed to the reference image J.
In the registration schema employed herein, geodesic transformation with Gaussian regularization was the transformation model of choice along with the Mutual Information metric as the similarity measure and Gradient Descent accounting as the optimization method [73].
Following the registration, the 4D matrix along with the corresponding gradient directions and the weighting factors was used by FMRIB’s Diffusion Toolbox (FDT) in FSL as input [76]. Prior to further processing, the brain tissue was isolated from the skull and the muscle by employing FSL’s Brain Extraction Tool (BET) with the default fractional intensity threshold, 0.5 [77]. Eddy current correction followed by FSL “eddy”, simulating the diffusion signal using a Gaussian process assuming that: i) the signal from two acquisitions acquired with diffusion weighting along two vectors with a small angle between them is more similar than for two acquisitions with a large angle between them and, ii) the signal from two acquisitions along vectors v and -v is identical. The diffusion encoding directions have been chosen to span the entire sphere (Figure 1C) facilitating the distinction between signal variation caused by diffusion and that caused by eddy currents/movements [71]. Finally, estimation of the tensor matrix was accomplished by utilizing FSL’s DTIFIT command resulting in the calculation of the associated eigenvectors/eigenvalues (V1, V2, V3, L1, L2 and L3) and the corresponding maps (MO, MD, FA).
BBB opening was expected to induce a local change in the water diffusion directionality. To detect such a change in the local diffusivity pattern, the difference in the FA maps (ΔFA) between pre-FUS and post-FUS was calculated. The resulting maps were smoothed using a two-dimensional median finite impulse response (FIR) filter (2 x 1 pixels), in order to eliminate the noisy background. To visualize the local changes and their correlation to the BBB opening and the underlying anatomy, the ΔFA images were superimposed onto the anatomical images and the BBB opening. These T1-weighted high-resolution anatomical images were registered to the diffusion reference scan in MATLAB (The Mathworks, Natick, MA, USA) using a multimodal, three-dimensional, intensity-based, affine registration with linear interpolation.
Quantification of the BBB opening was performed in MATLAB for both imaging sequences. To detect the BBB o opening, the ratio RGd-T1w = Gd-T1wPOST / Gd-T1wPRE was calculated following reference-intensity scaling (average muscle tissue intensity) between each T1wPRE and T1wPOST pair [20]. The BBB opening volume was calculated as the sum of the voxels with intensity surpassing the threshold of 1.1 for three consecutive planes [20]. A similar approach was employed for the FA maps by calculating the difference ΔFA = FAPOST –FAPRE following reference-intensity normalization. Integration of the voxels surpassing 0.1 resulted in the estimation of the single-plane BBB opening volume. Although the entire volume of the BBB opening could be estimated from the anatomical images, that was not the case for the DTI. To minimize the acquisition time while increasing the number of gradient directions during DWI acquisition, the number of slices was decreased resulting in the observation of the BBB opening in primarily a single plane. Given the thickness of a single DTI plane (2 mm), we report on the single ΔFA plane that is being compared to the Gd-enhanced T1-weighted volume resulting from three consecutive images matching the respective resolutions. The BBB opening volume in DTI was calculated by multiplying the total area in one slice by the DTI slice thickness (i.e., 2 mm). Respectively, the BBB opening volume was calculated by multiplying the total area in three slices by the T1 slice thickness (i.e., 0.7 mm).
To quantify the overlap between the BBB opening observed with the two modalities, ΔFA maps and RGd-T1w contrast enhancement, we measured the voxel-to-voxel correspondence. For this analysis, the BBB openings were binarized and their product yielded three clusters; only ΔFA voxels, only RGd-T1w voxels, and voxels that correspond to both modalities. The percent of the voxels that belong to the intersection over the union of the modalities is reported herein.
To assess any changes in the diffusion pattern following BBB opening, the average FA value within the BBB opening region has been quantified. To report on the directionality of the molecules, the polar and azimuthal angles of the primary eigenvectors that fall within the BBB opening region have been summarized in polar plots with an angle bin of 5°. Finally, the polar and azimuthal angle ranges have been quantified for both ipsilateral and contralateral hemispheres. To define the region of interest (ROI) in the contralateral side, the coordinates of the BBB opening were projected using the midline as the reflection axis.
Data shown here are presented as mean ± standard deviation (n = 5 FUS treatments). Comparisons between FAPRE and FAPOST values and angle ranges were analyzed using a two-tailed paired Student’s t-test while comparison of the BBB opening size between modalities was conducted with two-tailed unpaired Student’s t-test. In all analyses, the null hypothesis was rejected at the 0.05 level. All statistical analyses were performed using Prism 8 (GraphPad Software, San Diego, CA, USA).
III. Results
Diffusion tensor imaging and the corresponding metrics were investigated in detecting the site of blood-brain barrier leakage but more importantly, and providing valuable insight for the direction of the diffusion gradient. Figure 2 summarizes the results from four consecutive experiments conducted in a NHP with the targeting trajectory aiming at the Caudate nucleus region. The FAPOST maps (jet colormap) are shown in Figure 2A for four experiments. Despite the signal detected from other anisotropic structures (white matter tracts), the site of BBB opening is evident. To enhance the BBB opening region, the ΔFA, the difference in the fractional anisotropy maps (jet colormap), is presented in Figure 2B, overlaid on the anatomical scan (gray colormap). The third row (Figure 2C) corresponds to the RGd-T1w of the BBB opening (jet colormap), resulting from the analysis of the T1-weighted imaging, overlaid onto the same anatomical scan in the axial plane. Strong signal is detected at the site of the BBB opening in the ΔFA maps, similar to the T1-weighted images. Quantification of the BBB opening volume from the axial orientation showed comparable sizes across experiments for both sequences. The opening size was measured to be on the order of 64.28 ± 16.7 mm3 and 57.13 ± 15.2 mm3 for the Gd-T1-weighted sequence and the ΔFA map, respectively (Figure 2 and Supplementary Table I) while the volumes of the two modalities were found to overlap by 74.22 ± 9.2%, on average. The mean FA was also quantified from the FA maps (FAPRE and FAPOST) and found to significantly increase by 82% from 0.21 ± 0.02 to 0.38 ± 0.03 following the application of ultrasound (t[3]=27.73; P=0.0001). The increase of FA was reversible, e.g. the region with opened BBB in the first FUS treatment was not enhanced in subsequent scans. This suggests that the detected FA increase is due to the reversible BBB opening and not to a permanent change within the gray matter, such as persisting edema or scar tissue.
Fig. 2.
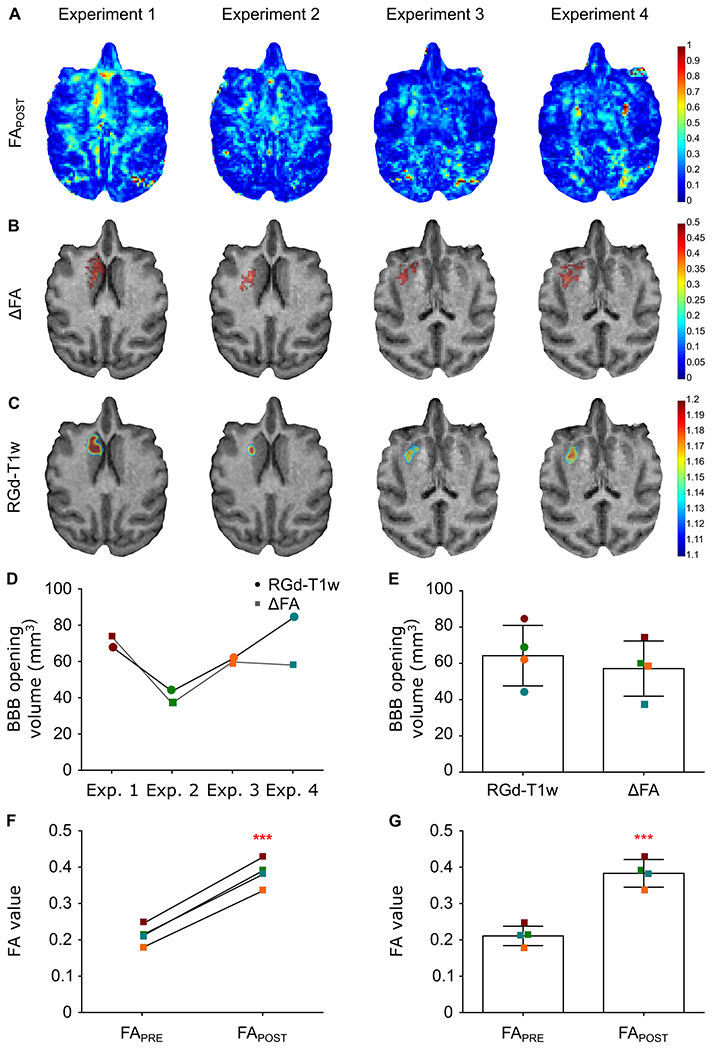
BBB opening detection with FA map, ΔFA and Gadolinium-Enhanced T1-weighted imaging for the four successfully completed experiments targeting a similar structure (Caudate nucleus region) in the same NHP. A. FAPOST maps reveal the BBB opening site despite the signal coming from other anisotropic structures. B. Normalization of the FAPOST maps (jet colormap) with the FAPRE map resulted in the pronounced BBB opening site shown in the ΔFA maps (jet colormap) overlayed on the anatomical scan (grayscale) for reference. C. The T1-weighted images’ ratio, RGd-T1, is presented herein overlayed on the same anatomical scan for comparison with the developing modality. D. Longitudinal assessment of the BBB opening volume shows comparability of the two modalities both qualitatively and quantitatively. E. Accordingly, the average BBB opening volume is similar between modalities. F,G. The FA value increased in all four cases following the sonication while increased on average by 82% from 0.21 ± 0.02 to 0.38 ± 0.03 (t[3]=27.73; P=0.0001).
The local change in diffusivity that co-localizes with the BBB opening was found to follow a preferred direction, hence the positive change in the FA value. This finding was confirmed by the vector field that depicts the vectors of the voxels corresponding to the BBB opening pointing towards one direction, with a high degree of anisotropy. In Figure 3A, the BBB opening is overlaid on the primary vector field (v1 POST) and the magnified part of the brain shows the directionality of the vectors in the ipsilateral and contralateral caudate. Moreover, the primary diffusion eigenvectors had consistent polar and azimuthal angles within the disrupted ipsilateral region (v1POST-IPSI), in contrast to the same region prior to the opening (v1PRE-IPSI) as well as the contralateral region (v1POST-CONTRA), where in both latter cases the v1 experienced a more isotropic and uniform angle distribution as shown by the angle plots in Figure 3B. Polar and azimuthal angles were defined with respect to the z-axis of the MRI scans, the axis orthogonal to the plane. Quantification of the polar and azimuthal angles spanning range at the BBB opening site (Figure 3B black square) was estimated as the difference in the most distant angles (polar and azimuthal) for the three cases (v1POST-IPSI, v1PRE-IPSI, v1POST-CONTRA) revealing a significantly narrower range only in the BBB opening cases. Angle distributions in the ipsilateral side were compared against the post-FUS contralateral side and the pre-FUS ipsilateral side, serving herein as controls (Figure 3C). The contralateral region of interest (ROI) was estimated by projection of the BBB opening coordinates with the midline as the reflection axis. Given the lack of substantial difference between the pre- and post-FUS contralateral sides, the former has been omitted to aid visualization. Cumulative results showed a decrease in the polar angle range of the v1POST-IPSI on the order of 35.58% (t[3]=3.921; P=0.0295) compared to the pre-sonication scan, v1PRE-IPSI, and 53.86% (t[3]=4.887; P=0.0164) compared to the post-sonication contralateral side, v1POST-CONTRA. Similarly, the azimuthal angle range of the v1POST-IPSI decreased by 82.44% (t[3]=3.699; P=0.0343) compared to v1PRE-IPSI, and 84.55% (t[3]=7.462; P=0.005) compared v1POST-CONTRA.
Fig. 3.
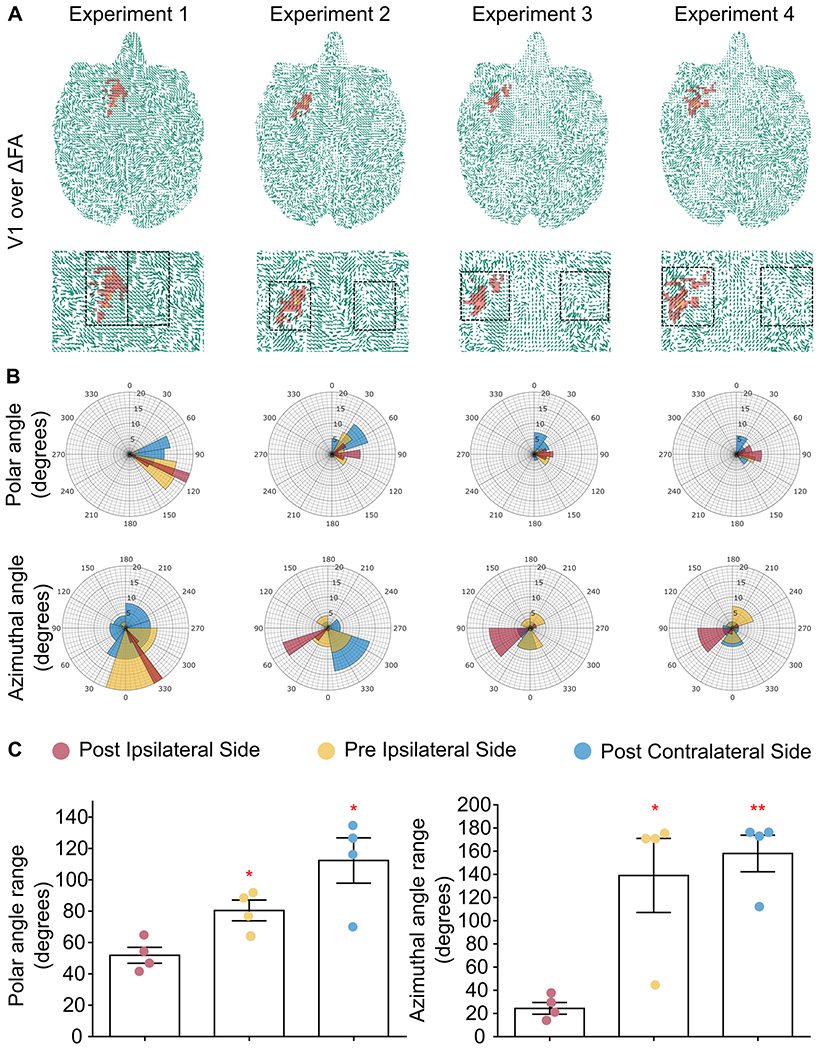
A. DTI eigenvectors overlaid onto the ΔFA map for the entire axial brain plane and the magnified striatal region. BBB opening initiates an increase in the directionality of the water molecule diffusion compared to the intact barrier shown by the consistent direction of the arrows in the sonicated area compared to the contralateral side within the ROI (black square). B. Polar and azimuthal angle distributions in the ipsilateral and contralateral hemispheres within the ROI are presented showing the narrow range of polar and azimuthal angles of the principal eigenvector only at the site of sonication (v1POST-IPSI). C. Cumulative results showed a decrease in the polar angle range on the order of 35.58% (t[3]=3.921; P=0.0295) compared to the ipsilateral side, v1PRE-IPSI, and 53.86% (t[3]=4.887; P=0.0164) compared to the contralateral side, v1POST-CONTRA. Similarly, the azimuthal angle range of the v1POST-IPSI decreased by 82.44% (t[3]=3.699; P=0.0343) compared to v1PRE-IPSI, and 84.55% (t[3]=7.462; P=0.005) compared v1POST-CONTRA.
The individual values of the BBB opening volumes, overlap percentage, FAPRE, FAPOST, ΔFA as well as the polar and azimuthal angle ranges for v1POST-IPSI, v1PRE-IPSI, and v1POST-CONTRA are summarized in Supplementary Table I. The corresponding S0, MD and L1 maps are presented in Supplementary Figure 2.
Across animal feasibility of this methodology was deemed necessary to confirm reproducibility. Therefore, a second NHP was sonicated targeting the Caudate nucleus and the results are shown in Figure 4. The FAPOST map was normalized with the corresponding FAPRE map to produce the ΔFA map that revealed a BBB opening volume about 75.14 mm3 similar to the 81.29 mm3 volume obtained from the RGd-T1w quantification (Figure 4A) with a 62.3% overlap between imaging modalities. The FA value at the BBB opening site increased by 77.26%, from 0.26 to 0.46. Superposition of the ΔFA map onto the principal eigenvector confirmed the preferred directionality at the BBB opening site observed previously, with the v1POST-IPSI polar angle range decreasing by 32.18% and 31.18% compared to the v1PRE-IPSI and v1POST-CONTRA respectively. Along the same lines, the azimuthal angle range of the v1POST-IPSI decreased by 5% and 7.95% compared to v1PRE-IPSI and to v1POST-CONTRA respectively (Figure 4B). The raw data and additional maps shown in Figure 4C confirm the proper quality of the images.
Fig. 4.
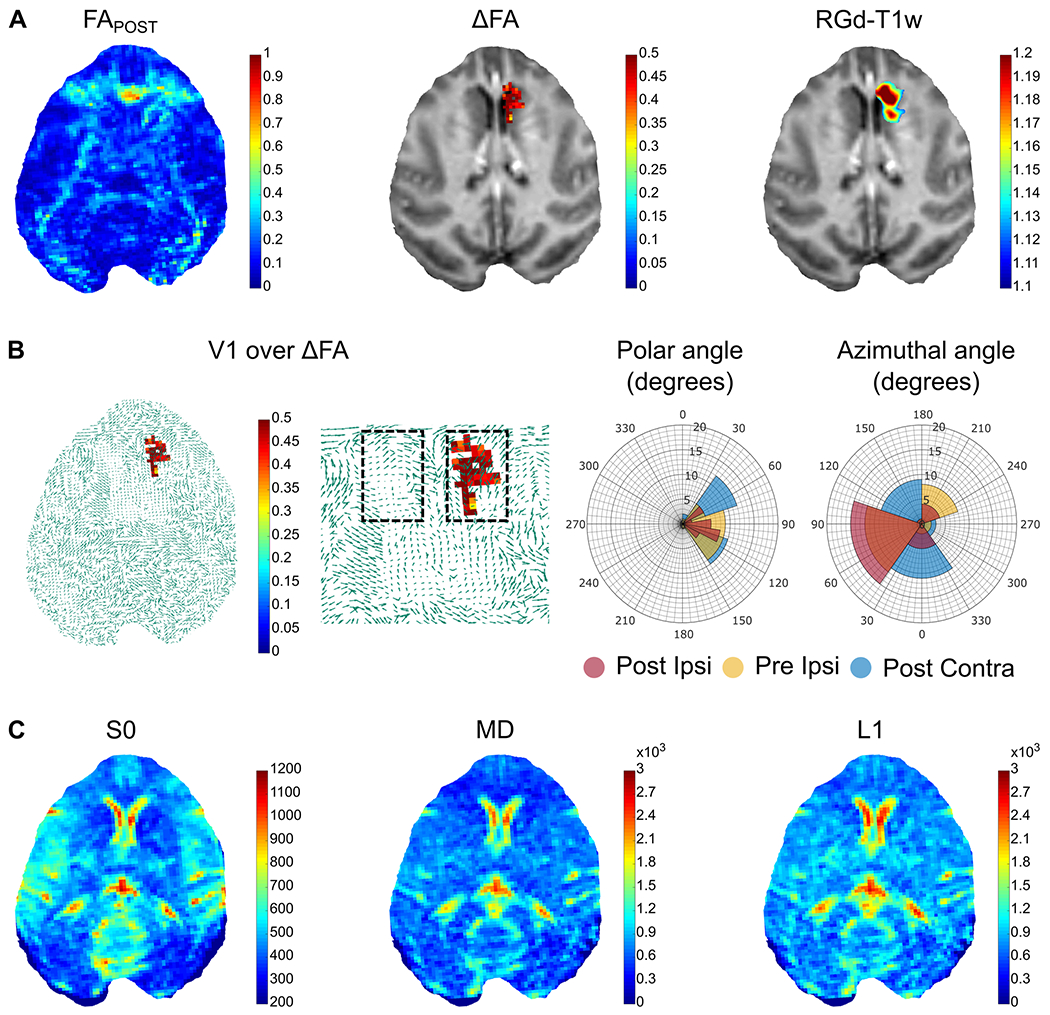
Evaluation of the developed methodology in a second NHP. A. The FAPOST map was normalized with the corresponding FAPRE map to produce the ΔFA map that revealed a BBB opening volume about 75.14 mm3 similar to the 81.29 mm3 volume obtained from the RGd-T1w quantification. B. Polar and azimuthal angle distributions in the ipsilateral and contralateral hemispheres within the ROI are presented showing a decrease by 32.18% and 31.18% of the v1POST-IPSI polar angle range compared to the v1PRE-IPSI and v1POST-CONTRA, respectively. Along the same lines, the azimuthal angle range of the v1POST-IPSI decreased by 5% and 7.95% compared to v1PRE-IPSI and to v1POST-CONTRA respectively. C. The S0 image along with the L1 and MD maps are presented for image quality assurance.
Taking into account all 5 FUS treatments and assuming CE-T1w scans as the gold standard, the DTI sensitivity was 74.1 ± 9.4% and specificity was 91.5 ± 2.1%. For this calculation, true negative pixels were counted only within the tested ROIs and not throughout the slice.
IV. Discussion
FUS in conjunction with the intravenous administration of microbubbles currently constitutes the only non-invasive technique to transiently and locally open the BBB. In this study, not only we investigate the efficacy of detecting the BBB opening without requiring contrast agent administration but also elaborated on the findings to understand the underlying changes in the flow directionality in the brain upon BBB opening occurrence.
Diffusion weighted images processed with non-linear registration and tensor analysis revealed the sites of BBB leakage that correlated well with the BBB-opened regions detected by Gd-T1-weighted imaging (Figures 2 and 4A). Moreover, the FA maps showed an increase in the anisotropy in the area of BBB opening indicated by a positive increase in the FA amplitude, also confirmed by vector analysis and the respective angles (Figures 3 and 4B). Mean diffusivity maps were also computed but no significant change was observed following the sonications (Figure 4C and Supplementary Figure 2). Based on prior findings, this observation could be attributed to the equivalence of averaging similar eigenvalues (λ1≈ λ2≈ λ3) to averaging eigenvalues whereas the primary is distantly large compared to the remaining two (λ1 ≫ λ2≈ λ3) (see mean diffusivity equation, Figure 1D). Radial diffusivity was found to decrease following sonication, yet not significantly, while changes in the axial diffusivity could not be observed. The transducer’s longitudinal direction was not aligned with the acquired DTI slices, as the focus was at an oblique angle with the imaging plane. Consequently, the focal volume covered multiple DTI slices. Nevertheless, the BBB opening volume was considerably smaller than the focal volume itself, and FA changes were constrained within a single slice. We also detected moderate FA changes in the two neighboring slices, however they were not found to be significant.
The highly anisotropic nature of v1 within the targeted area (Figures 3,4) was the underlying cause to the increased FA value. We hypothesize that increased anisotropy stems from the non-uniform stresses exerted by the oscillating microbubbles in the vicinity of cerebral blood vessels [67], [78]. Sonication at pulse lengths on the order of milliseconds can promote primary acoustic radiation forces [79], [80] microbubble cluster formation [81]–[83], and microbubble coalescence [84], [85], thus producing inhomogeneous stimuli and non-uniform BBB opening [86]. Therapeutic FUS exposure forces microbubbles to move in the direction of ultrasound propagation at velocities on the order of m/s [83], [87], [88], which is expected to lead in BBB opening sites primarily at the vessel walls distal to the FUS transducer. This hypothesis is supported by the comparable directionality observed in both polar and azimuthal angles in all BBB openings (Figures 3B,C and 4B). The alignment of the primary eigenvectors was consistent across treatments, with the exception of azimuthal angles in the first treatment, which was targeted within the gray matter. We hypothesize that this alignment was related to the incidence angle of the FUS beam, which would affect the microbubble movement [79], [83] and the directionality of the induced mechanical stress. Although capillaries would not allow for substantial microbubble motion and would be subject to uniform radial stresses, larger vessels could be subject to unidirectional stresses due to preferential microbubble movement. In previous work, we have seen that large vessels contribute considerably in the BBB opening intensity [86], [89].
Primary radiation forces push the brain tissue itself, therefore another potential effect following BBB opening is a change in the cerebrospinal fluid (CSF) circulation pattern [90], [91]. Pressure gradients leading to increased water diffusion anisotropy or changes in the pattern of perivascular flow in the glymphatic pathway following FUS-induced BBB opening in humans may temporarily affect the local CSF flow [92]. Our sequences were able to detect the bulk FA increase, but other sequences such as phase-based amplified MRI [93], [94] may be needed to resolve sub-voxel CSF motion patterns. Another similar study conducted in rodents confirmed the increase in FA values following repeated sonications although using a different timeline. In that study the increased directionality was attributed to increased myelin integrity [66]. Interestingly, DTI-based detection of BBB opening in our study was more sensitive in gray matter (i.e., up to 90% sensitivity in experiment 1). We hypothesize that when the opening occurs within the highly anisotropic white matter, the ΔFA contrast due to BBB opening is effectively masked from the underlying tissue structure.
The ultrasound parameters used herein have been repeatedly shown to be safe and efficient in the non-human primates, without inducing irreversible trauma in the targeted regions [20], [68]. SWI as well as the gradient- and weight-free DWI images were evaluated in terms of induced brain damage but yielded negative results as no hypo- or hyper- intense regions were observed within the treated area, respectively. Furthermore, FA increase was fully reversible and was no longer detected following the time interval after each FUS treatment.
Regardless of the underpinning mechanism, the increase of FA is transient and is restored upon BBB closing. The FA change was evaluated immediately after the FUS procedure. However, the persistence of these changes is currently unknown. We hypothesize that FA increase is attenuated upon BBB restoration. In future rodent studies, we will evaluate the timeline of this effect, by performing serial DTI scans until BBB closing has been confirmed. Numerical modeling of interstitial pressure gradients and CSF flow following BBB opening may elucidate the mechanism driving the anisotropic water diffusion. We will compare ms-long pulse sequences against μs-long pulse sequences, which were shown to produce more homogeneous microbubble activity in vitro [95], [96] and more uniform BBB opening in vivo [86], [97]. We anticipate that the diffusion anisotropy will be less pronounced following FUS treatment with μs-long pulses. We also aim to correlate the BBB opening volume derived through DTI with passive cavitation mapping of microbubble activity within the NHP brain [98]–[102]. Finally, the DTI quality can be further improved by adjusting the gradient tables and eliminating potential imaging artifacts due to subject motion [103].
This study was limited by the relatively low number of animals (n = 2 NHPs) and number of experiments (n = 5 treatments). Given the complexity of NHP experiments, more data points were not necessary, since a statistically significant FA difference between ipsilateral and contralateral hemispheres was achieved with n = 4 experiments in one NHP. Additionally, the same methodology was confirmed in a second NHP, showing that the observations were valid across animals. Future rodent studies with larger n numbers should confirm the results reported in NHPs here. Machine learning techniques such as leave-one-out cross-validation can be used in such studies, in order to calculate optimal thresholds in training datasets and apply them to testing datasets. This approach was not feasible here due to the low sample number in this NHP study. Finally, apart from the single-shot, contrast-enhanced T1-weighted scan, dynamic contrast enhancement (DCE) scans have been extensively used for BBB opening confirmation [21], [104]–[106]. The advantage of DCE is that it provides a quantitative estimate of the permeability increase, by evaluating the permeability coefficient Ktrans. In future work, we will perform DCE in both rodents and NHPs, to correlate ΔFA with Ktrans.
V. Conclusion
In conclusion, a non-contrast MR-based imaging approach for BBB opening was hereby described. The FA maps were shown to vary as a result of FUS-mediated BBB opening, and that change co-localizes with the GBCA extravasation area in contrast-enhanced, T1-weighted MRI. Therefore, DTI is proposed as a feasible contrast-free alternative, which may be proven safer by avoiding MRI contrast to permeate into the brain parenchyma. DTI may be used in the clinic for detecting BBB opening following FUS treatment or evaluate BBB integrity in brain-related pathologies.
Supplementary Material
Acknowledgments
The authors wish to thank Chad Samaroo for assistance during MRI acquisitions and the members of the Ultrasound Elasticity Imaging Laboratory (UEIL) for constructive input during the study development.
This work was supported by the National Institutes of Health under the under Grants R01EB009041 and R01G038961.
Contributor Information
Maria Eleni Karakatsani, Department of Biomedical Engineering, Columbia University, New York, NY 10032, USA.
Antonios N. Pouliopoulos, Department of Biomedical Engineering, Columbia University, New York, NY 10032, USA
Michael Liu, Department of Radiology, Columbia University, New York, NY 10032, USA.
Sachin R. Jambawalikar, Department of Radiology, Columbia University, New York, NY 10032, USA
Elisa E. Konofagou, Departments of Biomedical Engineering and Radiology, Columbia University, New York, NY 10032, USA
References
- [1].Abbott NJ, Patabendige AAK, Dolman DEM, Yusof SR, and Begley DJ, “Structure and function of the blood-brain barrier.,” Neurobiol. Dis, vol. 37, no. 1, pp. 13–25, Jan. 2010. [DOI] [PubMed] [Google Scholar]
- [2].Pardridge WM, “The blood-brain barrier: Bottleneck in brain drug development,” NeuroRX, vol. 2, no. 1, pp. 3–14, Jan. 2005. [DOI] [PMC free article] [PubMed] [Google Scholar]
- [3].Zlokovic BV, “The blood-brain barrier in health and chronic neurodegenerative disorders.,” Neuron, vol. 57, no. 2, pp. 178–201, Jan. 2008. [DOI] [PubMed] [Google Scholar]
- [4].Doolittle ND et al. , “Safety and efficacy of a multicenter study using intraarterial chemotherapy in conjunction with osmotic opening of the blood-brain barrier for the treatment of patients with malignant brain tumors.,” Cancer, vol. 88, no. 3, pp. 637–47, Feb. 2000. [DOI] [PubMed] [Google Scholar]
- [5].Kroll RA and Neuwelt EA, “Outwitting the blood-brain barrier for therapeutic purposes: Osmotic opening and other means,” Neurosurgery, vol. 42, no. 5. pp. 1083–1100, May-1998. [DOI] [PubMed] [Google Scholar]
- [6].Rapoport SI, “Osmotic Opening of the Blood–Brain Barrier: Principles, Mechanism, and Therapeutic Applications,” Cell. Mol. Neurobiol, vol. 20, no. 2, pp. 217–230, 2000. [DOI] [PMC free article] [PubMed] [Google Scholar]
- [7].Hynynen K, McDannold N, Vykhodtseva N, and Jolesz FA, “Noninvasive MR imaging-guided focal opening of the blood-brain barrier in rabbits.,” Radiology, vol. 220, no. 3, pp. 640–646, 2001. [DOI] [PubMed] [Google Scholar]
- [8].Konofagou EE, “Optimization of the ultrasound-induced blood-brain barrier opening.,” Theranostics, vol. 2, no. 12, pp. 1223–37, Jan. 2012. [DOI] [PMC free article] [PubMed] [Google Scholar]
- [9].Kinoshita M, McDannold N, Jolesz FA, and Hynynen K, “Targeted delivery of antibodies through the blood–brain barrier by MRI-guided focused ultrasound,” Biochem. Biophys. Res. Commun, vol. 340, no. 4, pp. 1085–1090, 2006. [DOI] [PubMed] [Google Scholar]
- [10].Samiotaki G, Acosta C, Wang S, and Konofagou EE, “Enhanced delivery and bioactivity of the neurturin neurotrophic factor through focused ultrasound-mediated blood-brain barrier opening in vivo.,” J. Cereb. Blood Flow Metab, vol. 35, no. October 2014, pp. 611–22, 2015. [DOI] [PMC free article] [PubMed] [Google Scholar]
- [11].Galan-Acosta L et al. , “Recombinant BRICHOS chaperone domains delivered to mouse brain parenchyma by focused ultrasound and microbubbles are internalized by hippocampal and cortical neurons,” Mol. Cell. Neurosci, vol. 105, p. 103498, May 2020. [DOI] [PubMed] [Google Scholar]
- [12].Alonso A et al. , “Focal delivery of AAV2/1-transgenes into the rat brain by localized ultrasound-induced BBB Opening.,” Ann. Neurosci, vol. 21, no. 1, p. 22, Jan. 2014. [DOI] [PMC free article] [PubMed] [Google Scholar]
- [13].Burgess A, Ayala-Grosso CA, Ganguly M, Jordão JF, Aubert I, and Hynynen K, “Targeted Delivery of Neural Stem Cells to the Brain Using MRI-Guided Focused Ultrasound to Disrupt the Blood-Brain Barrier,” PLoS One, vol. 6, no. 11, p. e27877, Nov. 2011. [DOI] [PMC free article] [PubMed] [Google Scholar]
- [14].Liu H-L et al. , “Magnetic resonance monitoring of focused ultrasound/magnetic nanoparticle targeting delivery of therapeutic agents to the brain.,” Proc. Natl. Acad. Sci. U. S. A, vol. 107, no. 34, pp. 15205–10, Aug. 2010. [DOI] [PMC free article] [PubMed] [Google Scholar]
- [15].Sun T et al. , “Closed-loop control of targeted ultrasound drug delivery across the blood-brain/tumor barriers in a rat glioma model,” PNAS, vol. 114, no. 48, pp. E10281–E10290, Nov. 2017. [DOI] [PMC free article] [PubMed] [Google Scholar]
- [16].Lipsman N et al. , “Blood–brain barrier opening in Alzheimer’s disease using MR-guided focused ultrasound,” Nat. Commun, vol. 9, no. 1, p. 2336, Dec. 2018. [DOI] [PMC free article] [PubMed] [Google Scholar]
- [17].Mainprize T et al. , “Blood-Brain Barrier Opening in Primary Brain Tumors with Non-invasive MR-Guided Focused Ultrasound: A Clinical Safety and Feasibility Study,” Sci. Rep, vol. 9, no. 1, p. 321, Dec. 2019. [DOI] [PMC free article] [PubMed] [Google Scholar]
- [18].Abrahao A et al. , “First-in-human trial of blood–brain barrier opening in amyotrophic lateral sclerosis using MR-guided focused ultrasound,” Nat. Commun, vol. 10, no. 1, p. 4373, Dec. 2019. [DOI] [PMC free article] [PubMed] [Google Scholar]
- [19].Carpentier A et al. , “Clinical trial of blood-brain barrier disruption by pulsed ultrasound,” Sci. Transl. Med, vol. 8, no. 343, pp. 343re2–343re2, Jun. 2016. [DOI] [PubMed] [Google Scholar]
- [20].Karakatsani MEM, Samiotaki GM, Downs ME, Ferrera VP, and Konofagou EE, “Targeting Effects on the Volume of the Focused Ultrasound-Induced Blood-Brain Barrier Opening in Nonhuman Primates in Vivo,” IEEE Trans. Ultrason. Ferroelectr. Freq. Control, vol. 64, no. 5, pp. 798–810, 2017. [DOI] [PMC free article] [PubMed] [Google Scholar]
- [21].Vlachos F, Tung YS, and Konofagou E, “Permeability dependence study of the focused ultrasound-induced blood-brain barrier opening at distinct pressures and microbubble diameters using DCE-MRI,” Magn. Reson. Med, vol. 66, no. 3, pp. 821–830, 2011. [DOI] [PMC free article] [PubMed] [Google Scholar]
- [22].Pellerin M, Yankeelov TE, and Lepage M, “Incorporating contrast agent diffusion into the analysis of DCE-MRI data,” Magn. Reson. Med, vol. 58, no. 6, pp. 1124–1134, Dec. 2007. [DOI] [PubMed] [Google Scholar]
- [23].Wu L et al. , “Dynamic contrast-enhanced (DCE) MRI assessment of microvascular characteristics in the murine orthotopic pancreatic cancer model,” Magn. Reson. Imaging, vol. 33, no. 6, pp. 737–760, 2015. [DOI] [PubMed] [Google Scholar]
- [24].Grobner T, “Gadolinium – a specific trigger for the development of nephrogenic fibrosing dermopathy and nephrogenic systemic fibrosis?,” Nephrol. Dial. Transplant, vol. 21, no. 4, pp. 1104–1108, Apr. 2006. [DOI] [PubMed] [Google Scholar]
- [25].Yang L et al. , “Nephrogenic Systemic Fibrosis and Class Labeling of Gadolinium-based Contrast Agents by the Food and Drug Administration,” Radiology, vol. 265, no. 1, pp. 248–253, Oct. 2012. [DOI] [PubMed] [Google Scholar]
- [26].Kanda T, Ishii K, Kawaguchi H, Kitajima K, and Takenaka D, “High Signal Intensity in the Dentate Nucleus and Globus Pallidus on Unenhanced T1-weighted MR Images: Relationship with Increasing Cumulative Dose of a Gadolinium-based Contrast Material,” Radiology, vol. 270, no. 3, pp. 834–841, Mar. 2014. [DOI] [PubMed] [Google Scholar]
- [27].McDonald RJ et al. , “Intracranial Gadolinium Deposition after Contrast-enhanced MR Imaging,” Radiology, vol. 275, no. 3, pp. 772–782, Jun. 2015. [DOI] [PubMed] [Google Scholar]
- [28].Robert P et al. , “Methodological Aspects for Preclinical Evaluation of Gadolinium Presence in Brain Tissue: Critical Appraisal and Suggestions for Harmonization - A Joint Initiative,” Invest. Radiol, vol. 53, no. 9, pp. 499–517, 2018. [DOI] [PMC free article] [PubMed] [Google Scholar]
- [29].Runge VM, “Safety of the Gadolinium-based Contrast Agents for Magnetic Resonance Imaging, Focusing in Part on Their Accumulation in the Brain and Especially the Dentate Nucleus,” Invest. Radiol, vol. 51, no. 5, pp. 273–279, May 2016. [DOI] [PubMed] [Google Scholar]
- [30].Cao Y, Zhang Y, Shih G, Bohmart A, Hecht EM, and Prince MR, “Effect of Renal Function on Gadolinium-Related Signal Increases on Unenhanced T1-Weighted Brain Magnetic Resonance Imaging,” Invest. Radiol, vol. 51, no. 11, pp. 677–682, 2016. [DOI] [PubMed] [Google Scholar]
- [31].Rasschaert M et al. , “Moderate Renal Failure Accentuates T1 Signal Enhancement in the Deep Cerebellar Nuclei of Gadodiamide-Treated Rats,” Invest. Radiol, vol. 52, no. 5, pp. 255–264, May 2017. [DOI] [PMC free article] [PubMed] [Google Scholar]
- [32].Renz DM et al. , “Comparison of Unenhanced T1-Weighted Signal Intensities Within the Dentate Nucleus and the Globus Pallidus After Serial Applications of Gadopentetate Dimeglumine Versus Gadobutrol in a Pediatric Population,” Invest. Radiol, vol. 53, no. 2, pp. 119–127, Feb. 2018. [DOI] [PubMed] [Google Scholar]
- [33].Tamrazi B et al. , “Changes in Signal Intensity of the Dentate Nucleus and Globus Pallidus in Pediatric Patients: Impact of Brain Irradiation and Presence of Primary Brain Tumors Independent of Linear Gadolinium-based Contrast Agent Administration,” Radiology, vol. 287, no. 2, pp. 452–460, May 2018. [DOI] [PMC free article] [PubMed] [Google Scholar]
- [34].Fretellier N et al. , “Does age interfere with gadolinium toxicity and presence in brain and bone tissues?: A comparative gadoterate versus gadodiamide study in juvenile and adult rats,” Invest. Radiol, vol. 54, no. 2, pp. 61–71, Nov. 2019. [DOI] [PMC free article] [PubMed] [Google Scholar]
- [35].Rasschaert M et al. , “Gadolinium Retention, Brain T1 Hyperintensity, and Endogenous Metals,” Invest. Radiol, vol. 53, no. 6, pp. 328–337, Jun. 2018. [DOI] [PMC free article] [PubMed] [Google Scholar]
- [36].Gale EM and Caravan P, “Gadolinium-Free Contrast Agents for Magnetic Resonance Imaging of the Central Nervous System,” ACS Chem. Neurosci, vol. 9, no. 3, pp. 395–397, Mar. 2018. [DOI] [PMC free article] [PubMed] [Google Scholar]
- [37].Malheiros JM, Paiva FF, Longo BM, Hamani C, and Covolan L, “Manganese-Enhanced MRI: Biological Applications in Neuroscience,” Front. Neurol, vol. 6, p. 161, Jul. 2015. [DOI] [PMC free article] [PubMed] [Google Scholar]
- [38].Massaad CA and Pautler RG, “Manganese-enhanced magnetic resonance imaging (MEMRI),” Methods Mol. Biol, vol. 711, pp. 145–174, 2011. [DOI] [PMC free article] [PubMed] [Google Scholar]
- [39].Petcharunpaisan S, Ramalho J, and Castillo M, “Arterial spin labeling in neuroimaging,” World J. Radiol, vol. 2, no. 10, pp. 384–398, Oct. 2010. [DOI] [PMC free article] [PubMed] [Google Scholar]
- [40].Lansberg MG, Norbash AM, Marks MP, Tong DC, Moseley ME, and Albers GW, “Advantages of adding diffusion-weighted magnetic resonance imaging to conventional magnetic resonance imaging for evaluating acute stroke.,” Arch. Neurol, vol. 57, no. 9, pp. 1311–6, Sep. 2000. [DOI] [PubMed] [Google Scholar]
- [41].Moseley ME et al. , “Diffusion-weighted MR imaging of acute stroke: correlation with T2-weighted and magnetic susceptibility-enhanced MR imaging in cats.,” AJNR. Am. J. Neuroradiol, vol. 11, no. 3, pp. 423–9, May 1990. [PMC free article] [PubMed] [Google Scholar]
- [42].V Tiwari Y, Lu J, Shen Q, Cerqueira B, and Duong TQ, “Magnetic resonance imaging of blood–brain barrier permeability in ischemic stroke using diffusion-weighted arterial spin labeling in rats,” J. Cereb. Blood Flow Metab, vol. 37, no. 8, pp. 2706–2715, Aug. 2017. [DOI] [PMC free article] [PubMed] [Google Scholar]
- [43].Bevers MB et al. , “Apparent Diffusion Coefficient Signal Intensity Ratio Predicts the Effect of Revascularization on Ischemic Cerebral Edema.,” Cerebrovasc. Dis, vol. 45, no. 3–4, pp. 93–100, Mar. 2018. [DOI] [PMC free article] [PubMed] [Google Scholar]
- [44].Fragata I et al. , “Prediction of clinical outcome in subacute subarachnoid hemorrhage using diffusion tensor imaging,” J. Neurosurg, pp. 1–9, Apr. 2018. [DOI] [PubMed] [Google Scholar]
- [45].Filippi M, Cercignani M, Inglese M, Horsfield MA, and Comi G, “Diffusion tensor magnetic resonance imaging in multiple sclerosis.,” Neurology, vol. 56, no. 3, pp. 304–11, Feb. 2001. [DOI] [PubMed] [Google Scholar]
- [46].Inglese M and Bester M, “Diffusion imaging in multiple sclerosis: research and clinical implications.,” NMR Biomed, vol. 23, no. 7, pp. 865–72, Aug. 2010. [DOI] [PMC free article] [PubMed] [Google Scholar]
- [47].Le Bihan D et al. , “Diffusion tensor imaging: concepts and applications.,” J. Magn. Reson. Imaging, vol. 13, no. 4, pp. 534–46, 2001. [DOI] [PubMed] [Google Scholar]
- [48].Bammer R, “Basic principles of diffusion-weighted imaging,” Eur. J. Radiol, vol. 45, no. 3, pp. 169–184, 2003. [DOI] [PubMed] [Google Scholar]
- [49].Basser PJ, “Inferring microstructural features and the physiological state of tissues from diffusion‐weighted images,” NMR Biomed, vol. 8, no. 7, pp. 333–344, 1995. [DOI] [PubMed] [Google Scholar]
- [50].Basser PJ and Pierpaoli C, “Microstructural and physiological features of tissues elucidated by quantitative-diffusion-tensor MRI.,” J. Magn. Reson. B, vol. 111, no. 3, pp. 209–19, Jun. 1996. [DOI] [PubMed] [Google Scholar]
- [51].Le Bihan D, “Melecular Diffsuion and Nuclear Magnetic Resonance,” Diffusion and Perfusion Magnetic Resonance Imaiging. p. Chapter 1, 1995. [Google Scholar]
- [52].Basser PJ, “New histological and physiological stains derived from diffusion-tensor MR images.,” Ann. N. Y. Acad. Sci, vol. 820, pp. 123–138, May 1997. [DOI] [PubMed] [Google Scholar]
- [53].Pierpaoli C, Jezzard P, Basser PJ, Barnett A, and Di Chiro G, “Diffusion tensor MR imaging of the human brain.,” Radiology, vol. 201, no. 3, pp. 637–648, 1996. [DOI] [PubMed] [Google Scholar]
- [54].Mori S and Zhang J, “Diffusion Tensor Imaging (DTI),” Encycl. Neurosci., pp. 531–538, 2009. [Google Scholar]
- [55].Mukherjee P, Berman JI, Chung SW, Hess CP, and Henry RG, “Diffusion Tensor MR Imaging and Fiber Tractography: Theoretic Underpinnings,” Am. J. Neuroradiol, vol. 29, no. 4, pp. 632–641, Apr. 2008. [DOI] [PMC free article] [PubMed] [Google Scholar]
- [56].Westin CF, Maier SE, Mamata H, Nabavi A, Jolesz FA, and Kikinis R, “Processing and visualization for diffusion tensor MRI,” Med. Image Anal, vol. 6, no. 2, pp. 93–108, 2002. [DOI] [PubMed] [Google Scholar]
- [57].Mamata H et al. , “High-resolution line scan diffusion tensor MR imaging of white matter fiber tract anatomy.,” AJNR. Am. J. Neuroradiol, vol. 23, no. 1, pp. 67–75, Jan. 2002. [PMC free article] [PubMed] [Google Scholar]
- [58].Yamada K, Sakai K, Akazawa K, Yuen S, and Nishimura T, “MR tractography: a review of its clinical applications.,” Magn. Reson. Med. Sci., vol. 8, no. 4, pp. 165–74, 2009. [DOI] [PubMed] [Google Scholar]
- [59].Basser PJ and Pajevic S, “Statistical artifacts in diffusion tensor MRI (DT-MRI) caused by background noise.,” Magn. Reson. Med, vol. 44, no. 1, pp. 41–50, Jul. 2000. [DOI] [PubMed] [Google Scholar]
- [60].Focke NK, Yogarajah M, Bonelli SB, Bartlett PA, Symms MR, and Duncan JS, “Voxel-based diffusion tensor imaging in patients with mesial temporal lobe epilepsy and hippocampal sclerosis.,” Neuroimage, vol. 40, no. 2, pp. 728–737, 2008. [DOI] [PubMed] [Google Scholar]
- [61].Moriya J et al. , “Gray and white matter volumetric and diffusion tensor imaging (DTI) analyses in the early stage of first-episode schizophrenia,” Schizophr. Res, vol. 116, no. 2–3, pp. 196–203, 2010. [DOI] [PubMed] [Google Scholar]
- [62].Thivard L et al. , “Diffusion tensor imaging and voxel based morphometry study in amyotrophic lateral sclerosis: Relationships with motor disability,” J. Neurol. Neurosurg. Psychiatry, vol. 78, no. 8, pp. 889–892, 2007. [DOI] [PMC free article] [PubMed] [Google Scholar]
- [63].Steinbrink C et al. , “The contribution of white and gray matter differences to developmental dyslexia: Insights from DTI and VBM at 3.0 T,” Neuropsychologia, vol. 46, no. 13, pp. 3170–3178, 2008. [DOI] [PubMed] [Google Scholar]
- [64].Arfanakis K, Haughton VM, Carew JD, Rogers BP, Dempsey RJ, and Meyerand ME, “Diffusion tensor MR imaging in diffuse axonal injury.,” AJNR. Am. J. Neuroradiol, vol. 23, no. 5, pp. 794–802, May 2002. [PMC free article] [PubMed] [Google Scholar]
- [65].Marchi N et al. , “Blood-brain barrier damage and brain penetration of antiepileptic drugs: Role of serum proteins and brain edema,” Epilepsia, vol. 50, no. 4, pp. 664–677, 2009. [DOI] [PMC free article] [PubMed] [Google Scholar]
- [66].Blackmore DG et al. , “Multimodal analysis of aged wild-type mice exposed to repeated scanning ultrasound treatments demonstrates long-term safety,” Theranostics, vol. 8, no. 22, pp. 6233–6247, 2018. [DOI] [PMC free article] [PubMed] [Google Scholar]
- [67].Chen H, Brayman AA, and Matula TJ, “Characteristic microvessel relaxation timescales associated with ultrasound-activated microbubbles.,” Appl. Phys. Lett, vol. 101, no. 16, p. 163704, Oct. 2012. [DOI] [PMC free article] [PubMed] [Google Scholar]
- [68].Downs ME et al. , “Correction: Long-term safety of repeated blood-brain barrier opening via focused ultrasound with microbubbles in non-human primates performing a cognitive task,” PLoS One, vol. 10, no. 6, 2015. [DOI] [PMC free article] [PubMed] [Google Scholar]
- [69].Samiotaki G and Konofagou EE, “Dependence of the Reversibility of Focused- Length In Vivo,” vol. 60, no. 11, pp. 2257–2265, 2013. [DOI] [PMC free article] [PubMed] [Google Scholar]
- [70].Feshitan JA, Chen CC, Kwan JJ, and Borden MA, “Microbubble size isolation by differential centrifugation,” J. Colloid Interface Sci, vol. 329, no. 2, pp. 316–324, 2009. [DOI] [PubMed] [Google Scholar]
- [71].Andersson JLR and Sotiropoulos SN, “An integrated approach to correction for off-resonance effects and subject movement in diffusion MR imaging.,” Neuroimage, vol. 125, pp. 1063–1078, Jan. 2016. [DOI] [PMC free article] [PubMed] [Google Scholar]
- [72].Wu S-Y et al. , “Transcranial cavitation detection in primates during blood–brain barrier opening — a perfomance assessment study,” IEEE Trans. Ultrason. Ferroelectr. Freq. Control, vol. 61, no. 6, pp. 966–978, 2014. [DOI] [PMC free article] [PubMed] [Google Scholar]
- [73].Avants BB, Tustison NJ, Song G, Cook PA, Klein A, and Gee JC, “A reproducible evaluation of ANTs similarity metric performance in brain image registration,” Neuroimage, vol. 54, no. 3, pp. 2033–2044, Feb. 2011. [DOI] [PMC free article] [PubMed] [Google Scholar]
- [74].Klein A et al. , “Evaluation of 14 nonlinear deformation algorithms applied to human brain MRI registration.,” Neuroimage, vol. 46, no. 3, pp. 786–802, Jul. 2009. [DOI] [PMC free article] [PubMed] [Google Scholar]
- [75].Avants BB, Epstein CL, Grossman M, and Gee JC, “Symmetric diffeomorphic image registration with cross-correlation: evaluating automated labeling of elderly and neurodegenerative brain.,” Med. Image Anal, vol. 12, no. 1, pp. 26–41, Feb. 2008. [DOI] [PMC free article] [PubMed] [Google Scholar]
- [76].Jenkinson M, Beckmann CF, Behrens TEJ, Woolrich MW, and Smith SM, “FSL,” Neuroimage, vol. 62, no. 2, pp. 782–790, Aug. 2012. [DOI] [PubMed] [Google Scholar]
- [77].Smith SM, “Fast robust automated brain extraction.,” Hum. Brain Mapp, vol. 17, no. 3, pp. 143–155, Nov. 2002. [DOI] [PMC free article] [PubMed] [Google Scholar]
- [78].Ilovitsh T et al. , “Enhanced microbubble contrast agent oscillation following 250 kHz insonation,” Sci. Rep, vol. 8, no. 1, p. 16347, Dec. 2018. [DOI] [PMC free article] [PubMed] [Google Scholar]
- [79].Dayton PA, Allen JS, and Ferrara KW, “The magnitude of radiation force on ultrasound contrast agents,” J. Acoust. Soc. Am, vol. 112, no. 5, pp. 2183–2192, 2002. [DOI] [PubMed] [Google Scholar]
- [80].Koruk H, El Ghamrawy A, Pouliopoulos AN, and Choi JJ, “Acoustic Particle Palpation for Measuring Tissue Elasticity,” Appl. Phys. Lett, vol. 107, no. 22, pp. 223701–04, 2015. [DOI] [PMC free article] [PubMed] [Google Scholar]
- [81].Kotopoulis S and Postema M, “Microfoam formation in a capillary.,” Ultrasonics, vol. 50, no. 2, pp. 260–8, Feb. 2010. [DOI] [PubMed] [Google Scholar]
- [82].Lazarus C, Pouliopoulos AN, Tinguely M, Garbin V, and Choi JJ, “Clustering dynamics of microbubbles exposed to low-pressure 1-MHz ultrasound,” J. Acoust. Soc. Am, vol. 142, no. 5, pp. 3135–3146, Nov. 2017. [DOI] [PubMed] [Google Scholar]
- [83].Pouliopoulos AN and Choi JJ, “Superharmonic microbubble Doppler effect in ultrasound therapy,” Phys. Med. Biol, vol. 61, no. 16, pp. 6154–6171, Jul. 2016. [DOI] [PMC free article] [PubMed] [Google Scholar]
- [84].Fan Z, Chen D, and Deng CX, “Characterization of the dynamic activities of a population of microbubbles driven by pulsed ultrasound exposure in sonoporation.,” Ultrasound Med. Biol, vol. 40, no. 6, pp. 1260–72, Jun. 2014. [DOI] [PMC free article] [PubMed] [Google Scholar]
- [85].Postema M, Marmottant P, Lancée CT, Hilgenfeldt S, and de Jong N, “Ultrasound-induced microbubble coalescence.,” Ultrasound Med. Biol, vol. 30, no. 10, pp. 1337–44, Oct. 2004. [DOI] [PubMed] [Google Scholar]
- [86].Choi JJ, Pernot M, Small SA, and Konofagou EE, “Noninvasive, transcranial and localized opening of the blood-brain barrier using focused ultrasound in mice.,” Ultrasound Med. Biol, vol. 33, no. 1, pp. 95–104, Jan. 2007. [DOI] [PubMed] [Google Scholar]
- [87].Palanchon P, Tortoli P, Versluis M, and de Jong N, “Optical observations of acoustical radiation force effects on individual air bubbles,” IEEE Trans. Ultrason. Ferroelectr. Freq. Control, vol. 52, no. 1, pp. 104–110, 2005. [DOI] [PubMed] [Google Scholar]
- [88].Pouliopoulos A, Smith C, El Ghamrawy A, Tang M, and Choi J, “Doppler passive acoustic mapping for monitoring microbubble velocities in ultrasound therapy,” J. Acoust. Soc. Am, vol. 141, no. 5, pp. 3491–3491, May 2017. [Google Scholar]
- [89].Chen H and Konofagou EE, “The size of blood-brain barrier opening induced by focused ultrasound is dictated by the acoustic pressure,” J. Cereb. Blood Flow Metab, vol. 34, no. 7, pp. 1197–1204, 2014. [DOI] [PMC free article] [PubMed] [Google Scholar]
- [90].Feinberg DA and Mark AS, “Human brain motion and cerebrospinal fluid circulation demonstrated with MR velocity imaging.,” Radiology, vol. 163, no. 3, pp. 793–799, Jun. 1987. [DOI] [PubMed] [Google Scholar]
- [91].Maier SE, Hardy CJ, and Jolesz FA, “Brain and cerebrospinal fluid motion: real-time quantification with M-mode MR imaging.,” Radiology, vol. 193, no. 2, pp. 477–483, Nov. 1994. [DOI] [PubMed] [Google Scholar]
- [92].Meng Y et al. , “Glymphatics visualization after focused ultrasound induced blood-brain barrier opening in humans.,” Ann. Neurol, p. ana.25604, Sep. 2019. [DOI] [PubMed] [Google Scholar]
- [93].Holdsworth SJ, Rahimi MS, Ni WW, Zaharchuk G, and Moseley ME, “Amplified magnetic resonance imaging (aMRI),” Magn. Reson. Med, vol. 75, no. 6, pp. 2245–2254, Jun. 2016. [DOI] [PubMed] [Google Scholar]
- [94].Terem I et al. , “Revealing sub-voxel motions of brain tissue using phase-based amplified MRI (aMRI),” Magn. Reson. Med, vol. 80, no. 6, pp. 2549–2559, Dec. 2018. [DOI] [PMC free article] [PubMed] [Google Scholar]
- [95].Pouliopoulos AN, Li C, Tinguely M, Garbin V, Tang M-X, and Choi JJ, “Rapid short-pulse sequences enhance the spatiotemporal uniformity of acoustically driven microbubble activity during flow conditions,” J. Acoust. Soc. Am, vol. 140, no. 4, pp. 2469–2480, 2016. [DOI] [PubMed] [Google Scholar]
- [96].Pouliopoulos AN, Bonaccorsi S, and Choi JJ, “Exploiting flow to control the in vitro spatiotemporal distribution of microbubble-seeded acoustic cavitation activity in ultrasound therapy,” Phys. Med. Biol, vol. 59, no. 22, pp. 6941–6957, 2014. [DOI] [PubMed] [Google Scholar]
- [97].Morse SV et al. , “Rapid short pulse ultrasound delivers drugs uniformly across the murine blood-brain barrier with negligible disruption,” Radiology, vol. 291, no. 2, p. 181625, Mar. 2019. [DOI] [PMC free article] [PubMed] [Google Scholar]
- [98].Burgess MT, Apostolakis I, and Konofagou EE, “Power cavitation-guided blood-brain barrier opening with focused ultrasound,” Phys. Med. Biol, vol. 63, no. 6, p. 065009, 2018. [DOI] [PMC free article] [PubMed] [Google Scholar]
- [99].Gyöngy M and Coussios C-C, “Passive cavitation mapping for localization and tracking of bubble dynamics.,” J. Acoust. Soc. Am, vol. 128, no. 4, pp. EL175–80, Oct. 2010. [DOI] [PubMed] [Google Scholar]
- [100].Haworth KJ, Bader KB, Rich KT, Holland CK, and Mast TD, “Quantitative Frequency-Domain Passive Cavitation Imaging,” IEEE Trans. Ultrason. Ferroelectr. Freq. Control, vol. 64, no. 1, pp. 177–191, Jan. 2017. [DOI] [PMC free article] [PubMed] [Google Scholar]
- [101].Pouliopoulos AN, Burgess MT, and Konofagou EE, “Pulse inversion enhances the passive mapping of microbubble-based ultrasound therapy,” Appl. Phys. Lett, vol. 113, no. 4, p. 044102, 2018. [DOI] [PMC free article] [PubMed] [Google Scholar]
- [102].Kamimura HAS et al. , “Real-time passive acoustic mapping using sparse matrix multiplication,” IEEE Trans. Ultrason. Ferroelectr. Freq. Control, pp. 1–1, Jun. 2020. [DOI] [PMC free article] [PubMed] [Google Scholar]
- [103].Lauzon CB et al. , “Simultaneous analysis and quality assurance for diffusion tensor imaging.,” PLoS One, vol. 8, no. 4, p. e61737, 2013. [DOI] [PMC free article] [PubMed] [Google Scholar]
- [104].Bae J et al. , “Measurement of blood-brain barrier permeability using dynamic contrast-enhanced magnetic resonance imaging with reduced scan time,” Magn. Reson. Med, Mar. 2018. [DOI] [PMC free article] [PubMed] [Google Scholar]
- [105].Vlachos F, Tung Y-S, and Konofagou EE, “Permeability assessment of the focused ultrasound-induced blood-brain barrier opening using dynamic contrast-enhanced MRI,” Phys. Med. Biol, vol. 55, no. 18, pp. 5451–66, 2010. [DOI] [PMC free article] [PubMed] [Google Scholar]
- [106].Wu S-K et al. , “Characterization of Different Microbubbles in Assisting Focused Ultrasound-Induced Blood-Brain Barrier Opening,” Sci. Rep, vol. 7, no. March, p. 46689, 2017. [DOI] [PMC free article] [PubMed] [Google Scholar]
Associated Data
This section collects any data citations, data availability statements, or supplementary materials included in this article.