

Abstract
The aim of our study was to investigate the association of hepatic steatosis derived from quantitative ultrasound and magnetic resonance imaging (MRI) with prediabetes in a large population-based study conducted in Northeast Germany. Hepatic steatosis was assessed through transabdominal ultrasound and quantitative MRI. For analysis we included 1622 subjects with MRI who participated in an oral glucose tolerance test and reported no known type 2 diabetes mellitus (T2DM). We classified participants as proposed by the American Diabetes Association: isolated impaired fasting glucose (i-IFG), isolated impaired glucose tolerance (i-IGT), combined IFG and IGT (IFG + IGT), and undiagnosed T2DM. Regression models were adjusted for age, sex body mass index and alcohol consumption. We observed positive associations of hepatic steatosis with glycated hemoglobin, fasting glucose and insulin, 2-h glucose and insulin, as well as homeostasis model assessment-insulin resistance index. Similarly, individuals having hepatic steatosis as defined by MRI had a higher relative risk ratio (RR) to be in the prediabetes groups i-IFG (RR = 1.6; 95% confidence interval (CI) 1.2; 2.2), i-IGT (RR = 3.3, 95% CI 2.0; 5.6) and IFG + IGT (RR = 2.5, 95% CI 1.6; 3.9) or to have undiagnosed T2DM (RR = 4.8, 95% CI 2.6; 9.0). All associations were attenuated when defining hepatic steatosis by ultrasound. Hepatic steatosis is associated with prediabetes and undiagnosed T2DM in the general population. Quantitative liver MRI revealed stronger associations with prediabetes and undiagnosed T2DM compared to ultrasound, which indicates the higher sensitivity and specificity of MRI to determine hepatic steatosis.
Subject terms: Epidemiology, Outcomes research, Biomarkers, Predictive markers, Magnetic resonance imaging
Introduction
Hepatic steatosis is defined as an excessive fat deposition (> 5%) in the liver in the absence of competing liver disease or hepatocellular carcinoma1. Hepatic steatosis is highly prevalent affecting 25% of the world population2 and up to 70% of patients with type 2 diabetes mellitus3,4. The prevalence of ultrasound-determined hepatic steatosis is highest in the Middle East (32%) and South America (30%), lower in Europe (24%), and lowest in Africa (13%)2.
Hepatic steatosis occurs usually when lipid storage is increased through hepatic uptake and de novo lipogenesis through fatty acid oxidation and export of lipid in very low density lipoprotein5. Hepatic steatosis is strongly associated with insulin resistance6 and postprandial hyperinsulinemia indicating its possible role in the pathogenesis of type 2 diabetes mellitus7. Furthermore, the association between hepatic steatosis and type 2 diabetes mellitus may be bidirectional as suggested from some studies8–10.
Population-based studies defining hepatic steatosis by computed tomography showed significant associations with type 2 diabetes mellitus8,11. Likewise, several previous studies demonstrated associations between sonographically determined hepatic steatosis and type 2 diabetes mellitus9,12–17. Although being easy to use and non-radiation-based and therefore a suitable method for population-based research, ultrasound has a low sensitivity for detecting mild steatosis, and limitations in the examination of obese individuals18,19.
While there is strong evidence that hepatic steatosis is associated with type 2 diabetes mellitus, data regarding the association between hepatic steatosis and prediabetes is inconsistent. Previous cohort studies demonstrated associations between hepatic steatosis defined by ultrasound and prediabetes defined by fasting glucose and 2-h glucose or glycated hemoglobin (HbA1c)20–23. One cross-sectional study found an association between hepatic steatosis defined by fatty liver index and prediabetes categories according to American Diabetes Association (ADA) criteria24, whereas others did not16,21.
To the best of our knowledge there is no population-based study, which investigated the association of hepatic steatosis as defined by quantitative magnetic resonance imaging (MRI) with prediabetes and undiagnosed type 2 diabetes mellitus. From MRI, the proton density fat fraction (PDFF) can be calculated, which is a quantitative marker for liver fat, more accurate than similar markers taken from ultrasound or computed tomography25. In addition, MRI is able to differentiate between liver fat and iron26 as well as between focal, regional and general steatosis in a single procedure.
Against this background, the aim of our study is to clarify the association of hepatic steatosis assessed through ultrasound and MRI with prediabetes and undiagnosed type 2 diabetes mellitus defined the by oral glucose tolerance test (OGTT) in a large population-based sample.
Materials and methods
Study sample
The Study of Health in Pomerania (SHIP) is a population-based project conducted in Northeast Germany. It consists of the two independent cohorts SHIP and SHIP-Trend. For the present study we used baseline data from the second cohort (SHIP-Trend-0). A stratified random sample of 8826 adults aged between 20 and 79 years was drawn, of which 4420 subjects participated between 2008 and 2012 (response 50.1%). Random sample selection into age and sex-strata was facilitated by centralization of local population registries in the German Federal State of Mecklenburg/West Pomerania27.
All participants gave written informed consent. The study conformed to the ethical guidelines of the Declaration of Helsinki as reflected in a priori approval by the local ethics committee of the University of Greifswald.
We excluded individuals without MRI examination (n = 2130), those who reported known liver cirrhosis or hepatitis (n = 46), known type 2 diabetes mellitus (n = 461), and participants with missing data in any of the considered variables (n = 37). The final study population consisted of 1746 (913 women) subjects aged 21 to 82 years. From the analysis regarding prediabetes we further excluded all individuals without OGTT (n = 124) resulting in data from 1,622 (840 women) available for analysis of prediabetes.
General measurements
Sociodemographic characteristics and medical histories were assessed by computer-assisted face-to-face interviews. Height and weight were measured for calculating the body mass index (BMI = weight [kg]/height2 [m2]). Alcohol intake was evaluated as beverage-specific alcohol consumption (beer, wine, distilled spirits) on the last weekend and last weekday preceding the examination. The mean daily alcohol consumption was calculated using beverage-specific pure ethanol volume proportions28.
Ultrasound
Transabdominal ultrasound of the liver was performed by examiners using a transportable B-mode ultrasound device (vivid I; GE-Healthcare, Waukesha, WI, USA) with a 2.5 MHz ultrasonic transducer. The examiners used a 2-point scale to assess the presence of hepatic steatosis: (0) no steatosis and (1) steatosis. Hepatic steatosis was defined as a hyperechogenic liver pattern in comparison to the renal cortex27.
Magnetic resonance imaging (MRI)
MRI was performed by using a 1.5-Tesla MRI system (Magnetom Avanto, software version VB15; Siemens Healthineers Erlangen, Germany) with a 12-channel phased-array surface coil29. Three-dimensional chemical shift encoded gradient-echo data with three echoes and flyback readout gradient were acquired from an axial slab during a single 19-s breath hold. Imaging parameters included repetition time, 11 ms; echo times, 2.4, 4.8, and 9.6 ms; flip angle, 10°; number of signals acquired, one; bandwidth, ± 1065 Hz per pixel; matrix, 224 × 168 × 64; field of view, 410 × 308 mm; parallel imaging effective acceleration factor, 1.8; and section thickness, 3.0 mm.
Offline reconstructions of a PDFF map (including correction for T1 bias and T2* decay) and a transverse relaxation rate (R2*) map (based on T2* decay measurement of PDFF) were performed. Fat and water ambiguities were resolved by using the phase of the acquired data30. Parametric maps of PDFF were used for further analyses.
One trained radiologist reviewed the PDFF. Mean fat fraction values were determined at operator-defined regions of interest placed at the center of the liver by using Osirix (v3.8.1; Pixmec Sarl, Bernex, Switzerland). Regions of interest were placed carefully to avoid blood vessels and regions that were obviously contaminated by partial volume effects and motion artifacts29. Hepatic steatosis was defined as PDFF > 5%30.
Laboratory measurements
We requested the participants not to eat, smoke or consume caffeine-containing drinks and to avoid sports for ≥ 8 h before the examination, which was completed during the morning hours. Blood was collected by a trained examiner following a standardized protocol, refrigerated to 4–8 °C and shipped on refrigerant packaging within 4 to a maximum of 6 h to the laboratory. Measurements of fasting glucose and 2-h glucose were based on plasma samples31. All assays were performed according to the manufacturers’ recommendations by skilled technical personnel. The study laboratory participated in official quarterly German external proficiency testing programs32.
Fasting glucose and 2-h glucose levels were measured using a hexokinase method (Dimension Vista, Siemens Healthcare Diagnostics, Eschborn, Germany)31. HbA1c was determined by high-performance liquid chromatography (Diamat, Bio-Rad Laboratories, Munich, Germany). Insulin serum values were measured by a chemiluminescence immunoassay (Immulite 2000 Xpi, Siemens Healthcare Diagnostics, Eschborn, Germany). Fasting insulin and 2-h insulin are expressed as µU/ml. The homeostasis model assessment-insulin resistance index (HOMA-IR) was calculated as (fasting insulin [μU/ml] x fasting glucose [mmol/l] / 22.5)33. Serum alanine aminotransferase (ALT), aspartate aminotransferase (AST), and γ-glutamyl transpeptidase (GGT) concentrations were measured photometrically (Hitachi 704; Roche, Mannheim, Germany). ALT, AST, and GGT concentrations are expressed as µkatal/l.
Ascertainment of diabetes and prediabetes
Participants were classified as having type 2 diabetes mellitus if they reported physician’s diagnosis of type 2 diabetes mellitus in the interview or took glucose-lowering medication (Anatomical Therapeutic Chemical (ATC) classification system code A10). For the OGTT, fasting glucose was sampled, and 75 g of anhydrous glucose (Dextro OGT, Boehringer Mannheim, Mannheim, Germany) was given to the participants without diabetes and glucose-lowering agents. Following the criteria of the ADA34, we classified individuals as having normal glucose tolerance when they had fasting glucose values < 5.6 mmol/l and 2-h glucose < 7.8 mmol/l. We classified participants as having prediabetes if fasting glucose values were between 5.6 and 6.9 mmol/l (impaired fasting glucose: IFG) and/or 2-h glucose values were between 7.8 and 11.0 mmol/l (impaired glucose tolerance: IGT). We defined three groups of prediabetes: isolated impaired fasting glucose (i-IFG), isolated impaired glucose tolerance (i-IGT), and combined IFG and IGT (IFG + IGT). Undiagnosed type 2 diabetes mellitus was defined as fasting glucose values ≥ 7.0 mmol/l or 2-h glucose ≥ 11.1 mmol/l31,33.
Statistical analysis
Continuous data are reported as median (with 25th and 75th percentiles) and categorical variables as absolute numbers and percentages. Difference between the subjects with and without hepatic steatosis were tested by Wilcoxon rank-sum test for continous data and chi-square test for categorical data. For analyzing the association between hepatic steatosis and continuous markers of glucose metabolism linear regression models were used by calculating β coefficients and 95% confidence intervals (95% CI). For investigating the association between hepatic steatosis and prediabetes groups, multinomial logistic regression was run by calculating relative risk ratios and 95% CI. All models were adjusted for age, sex BMI and alcohol consumption. A value of p < 0.05 was considered statistically significant in all calculations. All statistical analyses were performed by Stata 14.1 (Stata Corporation, College Station, TX, USA).
Results
Among the study population consisting of 1,746 individuals (913 women) aged 21 to 80 years the prevalence of hepatic steatosis was 37% (95% CI 34%; 39%) by using MRI and 36% (95% CI 33%; 38%) by using ultrasound. Four-hundred-sixty-seven individuals (73%) with hepatic steatosis identified by ultrasound also had hepatic steatosis derived from MRI (Table 1).
Table 1.
Characteristics of the study population stratified by hepatic steatosis (MRI).
| Variables | Number of individuals | Hepatic steatosis derived from MRI | P value | |
|---|---|---|---|---|
| No (n = 1,106) | Yes (n = 640) | |||
| Age (years) | 1746 | 46 (37; 57) | 55 (47, 64) | < 0.001 |
| Male | 833 | 459 (42%) | 374 (58%) | < 0.001 |
| Female | 913 | 647 (58%) | 266 (42%) | < 0.001 |
| BMI (kg/m2) | 1746 | 25 (23; 28) | 30 (27; 32) | < 0.001 |
| Alcohol consumption (g/day) | 1732 | 4 (1; 9) | 5 (1; 14) | < 0.001 |
| Hepatic steatosis ultrasound | < 0.001 | |||
| Negative | 1119 | 949 (86%) | 170 (27%) | |
| Positive | 619 | 152 (14%) | 467 (73%) | |
| Liver fat (MRI %) | 1746 | 2.6 (2; 3.5) | 9.4 (6.7; 15.2) | < 0.001 |
| ALT (µkatal/l) | 1745 | 0.33 (0.25; 0.43) | 0.49 (0.36; 0.67) | < 0.001 |
| AST (µkatal/l) | 1743 | 0.27 (0.21; 0.33) | 0.32 (0.26; 0.40) | < 0.001 |
| GGT (µkatal/l) | 1745 | 0.43 (0.35; 0.56) | 0.64 (0.48; 0.93) | < 0.001 |
| HbA1c % | 1745 | 5.1 (4.8; 5.4) | 5.3 (5; 5.6) | < 0.001 |
| Glucose (mmol/l) | ||||
| Fasting | 1746 | 5.2 (4.9; 5.6) | 5.7 (5.3; 6.1) | < 0.001 |
| 2-h | 1622 | 5.6 (4.8; 6.6) | 6.6 (5.6; 8.1) | < 0.001 |
| Insulin (µU/ml) | ||||
| Fasting | 1617 | 7.5 (5.5; 10.5) | 13.8 (9.6; 20.1) | < 0.001 |
| 2-h | 1619 | 39 (25; 58) | 72 (47; 145) | < 0.001 |
| HOMA-IR | 1617 | 1.8 (1.2; 2.5) | 3.5 (2.3; 5.3) | < 0.001 |
| OGTT | < 0.001 | |||
| NGT | 918 | 710 (69%) | 208 (35%) | |
| i-IFG | 404 | 208 (20%) | 196 (33%) | |
| i-IGT | 87 | 39 (4%) | 48 (8%) | |
| IFG + IGT | 133 | 49 (5%) | 84 (14%) | |
| Undiagnosed T2DM | 80 | 17 (2%) | 63 (10%) | |
Data are given as absolute number and percentage for categorical data and as median (25th and 75th percentiles) for continuous data.
ALT alanine aminotransferase, AST aspartate aminotransferase, GGT γ-glutamyl transpeptidase, HbA1c Glycated Hemoglobin, HOMA-IR Homeostasis model assessment-insulin resistance index, NGT normal glucose tolerance, i-IFG isolated impaired fasting glucose, i-IGT isolated impaired glucose tolerance, OGTT oral glucose tolerance test, T2DM type 2 diabetes mellitus. To calculate p value chi-square tests were used for categorical variables and Wilcoxon rank-sum tests for continuous variables.
We observed that individuals having hepatic steatosis derived from MRI were older, comprised more males, had a higher BMI as well as higher levels of HbA1c, fasting glucose, 2-h glucose, fasting insulin, 2-h insulin, and HOMA-IR compared to those without hepatic steatosis. Individuals with hepatic steatosis through MRI had slightly higher levels of ALT, AST, and GGT compared to those without hepatic steatosis. Similarly, individuals with MRI-based definition of hepatic steatosis had more often prediabetes (i-IGT, i-IFG, IFG + IGT) or undiagnosed type 2 diabetes mellitus than individuals without hepatic steatosis (Table 1).
Linear regression models adjusted for age, sex, BMI and alcohol consumption revealed significantly positive associations between hepatic steatosis defined either by ultrasound or MRI. Levels of HbA1c, fasting glucose, 2-h glucose, fasting insulin, 2-h insulin and HOMA-IR were also associated with hepatic steatosis derived from ultrasound or MRI (Table 2). The mean level of 2-h glucose increased over the amount of fat in the liver (Fig. 1).
Table 2.
Associations between hepatic steatosis derived from ultrasound and PDFF-MRI with continuous markers for glucose metabolism adjusted for age, sex, BMI and alcohol consumption.
| Outcome variables | Hepatic steatosis (Ultrasound) | Hepatic steatosis (MRI) | MRI-PDFF % | |||
|---|---|---|---|---|---|---|
| β (95% CI) | P value | β (95% CI) | P value | β (95% CI) | P value | |
| HbA1c % | 0·07 (0·01; 0·12) | 0.012 | 0·09 (0·03; 0·14) | 0.004 | 0·01 (0·01; 0·01) | < 0.001 |
| Fasting glucose (mmol/l) | 0.18 (0.11; 0.24) | < 0.001 | 0.24 (0.17; 0.32) | < 0.001 | 0.03 (0·02; 0·03) | < 0.001 |
| 2-h glucose (mmol/l) | 0.52 (0.31; 0.73) | < 0.001 | 0.75 (0.53; 0.97) | < 0.001 | 0.03 (0.02; 0.03) | < 0.001 |
| Fasting insulin (µU/ml) | 4.2 (3.2; 5.2) | < 0.001 | 4.9 (3.8; 5.9) | < 0.001 | 0.5 (0.4; 0.6) | < 0.001 |
| 2-h insulin (µU/ml) | 22.3 (16.4; 28.2) | < 0.001 | 36.9 (30.8; 43.0) | < 0.001 | 3.5 (3.0; 4.0) | < 0.001 |
| HOMA-IR | 1.2 (0.9; 1.5) | < 0.001 | 1.4 (1.1; 1.8) | < 0.001 | 0.1 (0.1; 0.2) | < 0.001 |
β, derived from linear regression adjusted for age, sex, BMI and alcohol consumption; 95% CI Adjusted 95% confidence interval, BMI body mass index, HOMA-IR homeostasis model assessment-insulin resistance index, PDFF proton density fat fraction.
Figure 1.
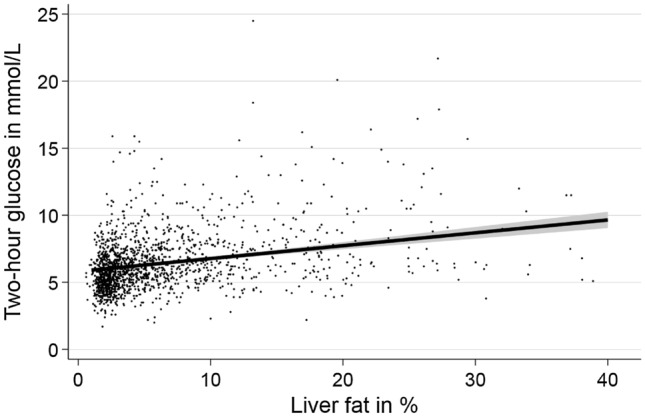
Association between liver fat fraction derived from quantitative MRI and two-hour glucose based on linear regression adjusted for age, sex, body mass index and alcohol consumption.
Table 3 shows the associations between hepatic steatosis and prediabetes and undiagnosed type 2 diabetes mellitus using multinomial logistic regression models adjusted for age, sex, BMI and alcohol consumption. Individuals with hepatic steatosis defined either by ultrasound or MRI had a higher relative risk ratio to be in one of the prediabetes groups (i-IFG, i-IGT, IFG + IGT) or to have undiagnosed type 2 diabetes mellitus than individuals without hepatic steatosis. All associations were stronger when hepatic steatosis was defined by MRI compared to the definition from ultrasound. We observed a positive continuous association between the liver fat as assessed by MRI with prediabetes (Fig. 2).
Table 3.
Associations of hepatic steatosis with categories of prediabetes and undiagnosed type 2 diabetes mellitus.
| Outcome variables | Hepatic steatosis (Ultrasound) | Hepatic steatosis (MRI) | MRI-PDFF % | |||
|---|---|---|---|---|---|---|
| RRR 95% CI | P value | RRR 95% CI | P value | RRR 95% CI | P value | |
| i-IFG | 1.5 (1.2; 2.0) | 0.002 | 1.6 (1.2; 2.2) | 0.001 | 1.1 (1.0; 1.1) | < 0.001 |
| i-IGT | 1.7 (1.1; 2.8) | 0.029 | 3.3 (2.0; 5.6) | < 0.001 | 1.1 (1.0; 1.1) | < 0.001 |
| IFG + IGT | 2.1 (1.4; 3.3) | < 0.001 | 2.5 (1.6; 3.9) | < 0.001 | 1.1 (1.0; 1.1) | < 0.001 |
| Undiagnosed T2DM | 2.8 (1.6; 4.8) | < 0.001 | 4.8 (2.6; 9.0) | < 0.001 | 1.2 (1.1; 1.2) | < 0.001 |
Multinomial regression with normal glucose tolerance (NGT) as base outcome adjusted for age, sex, BMI and alcohol consumption. RRR relative risk ratio, 95% confidence interval (CI), adjusted 95% confidence interval; BMI body mass index, i-IFG isolated impaired fasting glucose, i-IGT isolated impaired glucose tolerance, T2DM type 2 diabetes mellitus, PDFF proton density fat fraction.
Figure 2.
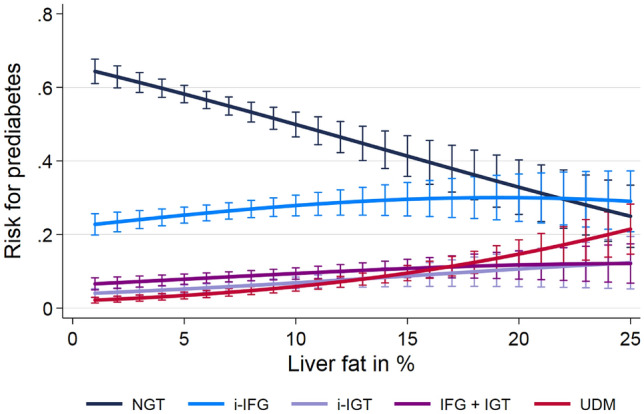
Association between liver fat and prediabetes and expressed as absolute risks based on multinomial regression after adjustment for age, sex, body mass index and alcohol consumption. NGT normal glucose tolerance test, i-IFG isolated impaired fasting glucose, i-IGT isolated impaired glucose tolerance, UDM undiagnosed type 2 diabetes.
To investigate a potential effect modification by sex on our associations we tested the interaction term of hepatic steatosis defined by MRI or ultrasound with sex on all outcomes. In none of these analyses, we observed any significant interactions.
Discussion
In the present study, we investigated the association of hepatic steatosis derived from transabdominal ultrasound and MRI with prediabetes and undiagnosed type 2 diabetes mellitus in the general adult population. We demonstrated positive associations of hepatic steatosis with markers of glucose metabolism including HbA1c, fasting glucose, 2-h glucose, fasting insulin, 2-h insulin, and HOMA-IR. Similarly, we observed that individuals with hepatic steatosis had a higher risk of prediabetes or undiagnosed type 2 diabetes mellitus than individuals without hepatic steatosis. Associations were consistently stronger for hepatic steatosis derived from MRI compared to the ultrasound-based assessment.
Previous literature demonstrated associations between hepatic steatosis and type 2 diabetes mellitus9,12–17, but only few studies investigated the association between sonographically assessed hepatic steatosis and prediabetes in general populations16,20–23. A large occupational cohort of Chinese men showed that hepatic steatosis was a risk factor for prediabetes ascertained by OGTT after a follow-up of 5 years20. Similar results were observed in a longitudinal study with Japanese health-checkup participants defining IFG by fasting glucose levels22. Another study with a relatively small sample size (n = 213) demonstrated an association between hepatic steatosis and incident prediabetes defined by fasting glucose or HbA1c after a follow-up of 7 years23.
In line with our finding, data from the cross-sectional German KORA F4 study showed that subjects having hepatic steatosis as derived from fatty liver index (as calculated from BMI, waist circumference, GGT and triglycerides)35 had an increased chance to be in one of the prediabetes groups as defined by the ADA criteria24. In contrast to our results, a cohort study in 508 healthy subjects with a follow-up of five years failed to demonstrate a significant association of hepatic steatosis with incident prediabetes as defined by OGTT16. The discrepant finding may be explained by differences in study design and over-adjustment in the previous study16. For example, smoking or blood pressure are not considered as co-variables for the investigated association, because they do not confound the association between hepatic steatosis and metabolic endpoints.
Also a cross-sectional study from India21 did not find any association of hepatic steatosis with prediabetes categories as defined by the ADA criteria. Although that study adjusted for similar confounders (age, gender and waist circumference) as we did, probably no association was found due to the relatively small sample size of (n = 541) participants in that study21.
In our study we assessed hepatic steatosis by both ultrasound and MRI. We observed that the effect sizes for the association of hepatic steatosis with markers of prediabetes and undiagnosed type 2 diabetes mellitus were consistently larger when defining hepatic steatosis by MRI. This can be explained by the fact that MRI is a more sensitive and specific than ultrasound to detect liver fat25. Similarly, compared to ultrasound MRI is operator independent and has a lower sample variability36. MRI is highly reproducible and need less time for the examination of the entire liver25. Further, liver fat assessment by MRI is less confounded by body fat than liver fat measurement by ultrasound37.
It has been proposed that excessive lipid metabolites like diacylglycerol and ceramides within the liver cause insulin resistance by reducing phosphorylation of insulin receptor substrate 1 and 2 and activation of proinflammatory receptors38. An experimental study in mice suggested that diacylglycerol promotes insulin resistance in liver steatosis39. As a consequence, insulin is unable to suppress intrahepatic gluconeogenesis and lipolysis in adipose tissue, while promoting de novo hepatic lipogenesis40. In hepatic steatosis, endoplasmic reticulum stress and mitochondrial dysfunction may induce oxidative stress, which leads to production of reactive oxygen species41. As a result, β-cells of the pancreas are unable to compensate for the oxidative stress, which may lead to type 2 diabetes mellitus42,43. Recently, it has been investigated that various types of hepatokines such as fetuin A and B secreted by hepatocytes are increased in hepatic steatosis resulting in decreased insulin signaling, inflammation, lipolysis and insulin resistance44.
The association of hepatic steatosis with prediabetes and undiagnosed type 2 diabetes mellitus may be bidirectional as suggested from studies in patients with type 2 diabetes mellitus8–10. Similarly, there are hereditary factors to cause hepatic steatosis, which is then accompanied by insulin resistance and type 2 diabetes mellitus suggesting that liver fat may be a consequence rather than a cause of insulin resistance and type 2 diabetes mellitus45.
One strength of our study is the large population-based sample. Further, we defined hepatic steatosis according to sophisticated MRI analysis, which is more sensitive and specific than ultrasound46, because the threshold for detecting fat is lower and liver fat can be differentiated from liver iron26. Prediabetes was derived from the ADA criteria. Besides OGTT, we included further markers of glucose metabolism including HbA1c, fasting insulin, 2-h insulin and HOMA-IR.
A limitation of our study is that associations were only investigated cross-sectionally. Thus, we cannot draw causal inference. However, previous genomic studies using mendelian randomization demonstrated a causal relationship between hepatic steatosis and type 2 diabetes mellitus47,48. Although we adjusted our analysis for confounding, we cannot exclude residual confounding. Similarly, due to ethical constrains in our population of volunteers we did not use biopsy, which is the gold standard method to determine hepatic steatosis, or computed tomography as a radiation-based examination method49.
Conclusions
Hepatic steatosis is associated with prediabetes and undiagnosed type 2 diabetes mellitus in the general population. The PDFF derived from liver MRI seems to be the more sensitive and specific method to determine hepatic steatosis than ultrasound, because it revealed stronger associations between hepatic steatosis and prediabetes.
Author contributions
M.N.: data analysis, manuscript writing. R.B.: design of the study, manuscript drafting. S.S.: manuscript drafting. N.W.: manuscript drafting. M.D.: design of the study, manuscript drafting. M.M.L.: design of the study, manuscript drafting. J-P.K: design of the study, manuscript drafting. W.R.: manuscript drafting. M.N.: design of the study, manuscript drafting. M.R.P.M.: manuscript drafting. T.I.: data analysis, manuscript writing. H.V.: design of the study, manuscript writing.
Funding
Open Access funding enabled and organized by Projekt DEAL. The work is part of the Community Medicine Research net (CMR) of the University of Greifswald, Germany, which is supported by the Federal State of Mecklenburg-West Pomerania. This study is supported by the German Center for Diabetes Research (DZD).
Competing interests
The authors declare no competing interests.
Footnotes
Publisher's note
Springer Nature remains neutral with regard to jurisdictional claims in published maps and institutional affiliations.
These authors contributed equally: Till Itterman and Henry Völzke.
References
- 1.Chalasani N, Younossi Z, Lavine JE, Diehl AM, Brunt EM, Cusi K, et al. The diagnosis and management of non-alcoholic fatty liver disease: Practice guideline by the american association for the study of liver diseases, American College of Gastroenterology, and the American Gastroenterological Association. Hepatology (Baltimore, MD) 2012;55(6):2005–2023. doi: 10.1002/hep.25762. [DOI] [PubMed] [Google Scholar]
- 2.Younossi ZM, Koenig AB, Abdelatif D, Fazel Y, Henry L, Wymer M. Global epidemiology of nonalcoholic fatty liver disease—Meta-analytic assessment of prevalence, incidence, and outcomes. Hepatology (Baltimore, MD) 2016;64(1):73–84. doi: 10.1002/hep.28431. [DOI] [PubMed] [Google Scholar]
- 3.Bril F, Cusi K. Management of nonalcoholic fatty liver disease in patients with type 2 diabetes: A call to action. Diabetes Care. 2017;40(3):419–430. doi: 10.2337/dc16-1787. [DOI] [PubMed] [Google Scholar]
- 4.Hazlehurst JM, Woods C, Marjot T, Cobbold JF, Tomlinson JW. Non-alcoholic fatty liver disease and diabetes. Metabolism. 2016;65(8):1096–1108. doi: 10.1016/j.metabol.2016.01.001. [DOI] [PMC free article] [PubMed] [Google Scholar]
- 5.Ipsen DH, Lykkesfeldt J, Tveden-Nyborg P. Molecular mechanisms of hepatic lipid accumulation in non-alcoholic fatty liver disease. Cell. Mol. Life Sci. 2018;75(18):3313–3327. doi: 10.1007/s00018-018-2860-6. [DOI] [PMC free article] [PubMed] [Google Scholar]
- 6.Lonardo A, Ballestri S, Marchesini G, Angulo P, Loria P. Nonalcoholic fatty liver disease: A precursor of the metabolic syndrome. Dig. Liver Dis. 2015;47(3):181–190. doi: 10.1016/j.dld.2014.09.020. [DOI] [PubMed] [Google Scholar]
- 7.Manchanayake J, Chitturi S, Nolan C, Farrell GC. Postprandial hyperinsulinemia is universal in non-diabetic patients with nonalcoholic fatty liver disease. J. Gastroenterol. Hepatol. 2011;26(3):510–516. doi: 10.1111/j.1440-1746.2010.06528.x. [DOI] [PubMed] [Google Scholar]
- 8.Ma J, Hwang S-J, Pedley A, Massaro JM, Hoffmann U, Chung RT, et al. Bi-directional analysis between fatty liver and cardiovascular disease risk factors. J. Hepatol. 2017;66(2):390–397. doi: 10.1016/j.jhep.2016.09.022. [DOI] [PMC free article] [PubMed] [Google Scholar]
- 9.Li Y, Wang J, Tang Y, Han X, Liu B, Hu H, et al. Bidirectional association between nonalcoholic fatty liver disease and type 2 diabetes in Chinese population: Evidence from the Dongfeng-Tongji cohort study. PLoS ONE. 2017;12(3):e0174291. doi: 10.1371/journal.pone.0174291. [DOI] [PMC free article] [PubMed] [Google Scholar]
- 10.Lonardo A, Lugari S. A round trip from nonalcoholic fatty liver disease to diabetes: molecular targets to the rescue? Acta Diabetol. 2019;56(4):385–396. doi: 10.1007/s00592-018-1266-0. [DOI] [PubMed] [Google Scholar]
- 11.Shah RV, Allison MA, Lima JAC, Bluemke DA, Abbasi SA, Ouyang P, et al. Liver fat, statin use, and incident diabetes: The multi-ethnic study of atherosclerosis. Atherosclerosis. 2015;242(1):211–217. doi: 10.1016/j.atherosclerosis.2015.07.018. [DOI] [PMC free article] [PubMed] [Google Scholar]
- 12.Chen G-Y, Cao H-X, Li F, Cai X-B, Ao Q-H, Gao Y, et al. New risk-scoring system including non-alcoholic fatty liver disease for predicting incident type 2 diabetes in East China: Shanghai Baosteel Cohort. J. Diabet. Investig. 2016;7(2):206–211. doi: 10.1111/jdi.12395. [DOI] [PMC free article] [PubMed] [Google Scholar]
- 13.Chen SC, Tsai SP, Jhao JY, Jiang WK, Tsao CK, Chang LY. Liver fat, hepatic enzymes, alkaline phosphatase and the risk of incident type 2 diabetes: A prospective study of 132,377 adults. Sci. Rep. 2017;7(1):4649. doi: 10.1038/s41598-017-04631-7. [DOI] [PMC free article] [PubMed] [Google Scholar]
- 14.Chang Y, Jung HS, Yun KE, Cho J, Cho YK, Ryu S. Cohort study of non-alcoholic fatty liver disease, NAFLD fibrosis score, and the risk of incident diabetes in a Korean population. Am. J. Gastroenterol. 2013;108(12):1861–1868. doi: 10.1038/ajg.2013.349. [DOI] [PubMed] [Google Scholar]
- 15.Tokita Y, Maejima Y, Shimomura K, Takenoshita S, Ishiyama N, Akuzawa M, et al. Non-alcoholic fatty liver disease is a risk factor for type 2 diabetes in middle-aged Japanese men and women. Internal Med. (Tokyo, Japan). 2017;56(7):763–771. doi: 10.2169/internalmedicine.56.7115. [DOI] [PMC free article] [PubMed] [Google Scholar]
- 16.Ming J, Xu S, Gao B, Liu G, Ji Y, Yang F, et al. Non-alcoholic fatty liver disease predicts type 2 diabetes mellitus, but not prediabetes, in Xi'an, China: A five-year cohort study. Liver Int. 2015;35(11):2401–2407. doi: 10.1111/liv.12851. [DOI] [PubMed] [Google Scholar]
- 17.Shibata M, Kihara Y, Taguchi M, Tashiro M, Otsuki M. Nonalcoholic fatty liver disease is a risk factor for type 2 diabetes in middle-aged Japanese men. Diabetes Care. 2007;30(11):2940–2944. doi: 10.2337/dc07-0792. [DOI] [PubMed] [Google Scholar]
- 18.AlShaalan R, Aljiffry M, Al-Busafi S, Metrakos P, Hassanain M. Nonalcoholic fatty liver disease: Noninvasive methods of diagnosing hepatic steatosis. Saudi J. Gastroenterol. 2015;21(2):64–70. doi: 10.4103/1319-3767.153812. [DOI] [PMC free article] [PubMed] [Google Scholar]
- 19.Bohte AE, van Werven JR, Bipat S, Stoker J. The diagnostic accuracy of US, CT, MRI and 1H-MRS for the evaluation of hepatic steatosis compared with liver biopsy: A meta-analysis. Eur. Radiol. 2011;21(1):87–97. doi: 10.1007/s00330-010-1905-5. [DOI] [PMC free article] [PubMed] [Google Scholar]
- 20.Liu M, Wang J, Zeng J, Cao X, He Y. Association of NAFLD with diabetes and the impact of BMI changes: A 5-year cohort study based on 18,507 elderly. J. Clin. Endocrinol. Metab. 2017;102(4):1309–1316. doi: 10.1210/jc.2016-3440. [DOI] [PubMed] [Google Scholar]
- 21.Mohan V, Farooq S, Deepa M, Ravikumar R, Pitchumoni CS. Prevalence of non-alcoholic fatty liver disease in urban south Indians in relation to different grades of glucose intolerance and metabolic syndrome. Diabetes Res. Clin. Pract. 2009;84(1):84–91. doi: 10.1016/j.diabres.2008.11.039. [DOI] [PubMed] [Google Scholar]
- 22.Yamada T, Fukatsu M, Suzuki S, Wada T, Yoshida T, Joh T. Fatty liver predicts impaired fasting glucose and type 2 diabetes mellitus in Japanese undergoing a health checkup. J. Gastroenterol. Hepatol. 2010;25(2):352–356. doi: 10.1111/j.1440-1746.2009.05998.x. [DOI] [PubMed] [Google Scholar]
- 23.Zelber-Sagi S, Lotan R, Shibolet O, Webb M, Buch A, Nitzan-Kaluski D, et al. Non-alcoholic fatty liver disease independently predicts prediabetes during a 7-year prospective follow-up. Liver Int. 2013;33(9):1406–1412. doi: 10.1111/liv.12200. [DOI] [PubMed] [Google Scholar]
- 24.Ruckert IM, Heier M, Rathmann W, Baumeister SE, Doring A, Meisinger C. Association between markers of fatty liver disease and impaired glucose regulation in men and women from the general population: the KORA-F4-study. PLoS ONE. 2011;6(8):e22932. doi: 10.1371/journal.pone.0022932. [DOI] [PMC free article] [PubMed] [Google Scholar]
- 25.Stern C, Castera L. Non-invasive diagnosis of hepatic steatosis. Hep. Intl. 2017;11(1):70–78. doi: 10.1007/s12072-016-9772-z. [DOI] [PubMed] [Google Scholar]
- 26.Kinner S, Reeder SB, Yokoo T. Quantitative imaging biomarkers of NAFLD. Dig. Dis. Sci. 2016;61(5):1337–1347. doi: 10.1007/s10620-016-4037-1. [DOI] [PMC free article] [PubMed] [Google Scholar]
- 27.Volzke H, Alte D, Schmidt CO, Radke D, Lorbeer R, Friedrich N, et al. Cohort profile: The study of health in Pomerania. Int. J. Epidemiol. 2011;40(2):294–307. doi: 10.1093/ije/dyp394. [DOI] [PubMed] [Google Scholar]
- 28.Alte D, Lüdemann J, Piek M, Adam C, Rose H-J, John U. Distribution and dose response of laboratory markers to alcohol consumption in a general population: results of the study of health in Pomerania (SHIP) J. Stud. Alcohol. 2003;64(1):75–82. doi: 10.15288/jsa.2003.64.75. [DOI] [PubMed] [Google Scholar]
- 29.Kuhn JP, Hernando D, Mensel B, Kruger PC, Ittermann T, Mayerle J, et al. Quantitative chemical shift-encoded MRI is an accurate method to quantify hepatic steatosis. J. Magn. Reson. Imaging. 2014;39(6):1494–1501. doi: 10.1002/jmri.24289. [DOI] [PMC free article] [PubMed] [Google Scholar]
- 30.Kühn J-P, Hernando D, Muñoz del Rio A, Evert M, Kannengiesser S, Völzke H, et al. Effect of multipeak spectral modeling of fat for liver iron and fat quantification: correlation of biopsy with MR imaging results. Radiology. 2012;265(1):133–142. doi: 10.1148/radiol.12112520. [DOI] [PMC free article] [PubMed] [Google Scholar]
- 31.Tamayo T, Schipf S, Meisinger C, Schunk M, Maier W, Herder C, et al. Regional differences of undiagnosed type 2 diabetes and prediabetes prevalence are not explained by known risk factors. PLoS ONE. 2014;9(11):e113154. doi: 10.1371/journal.pone.0113154. [DOI] [PMC free article] [PubMed] [Google Scholar]
- 32.Krebs A, Wallaschofski H, Nauck M, Haring R, Völzke H, Steveling A, et al. Low serum testosterone levels are associated with increased risk of mortality in a population-based cohort of men aged 20–79. Eur. Heart J. 2010;31(12):1494–1501. doi: 10.1093/eurheartj/ehq009. [DOI] [PubMed] [Google Scholar]
- 33.Markus MRP, Ittermann T, Wittfeld K, Schipf S, Siewert-Markus U, Bahls M, et al. Prediabetes is associated with lower brain gray matter volume in the general population. The Study of Health in Pomerania (SHIP) Nutr. Metab. Cardiovasc. Dis. 2017;27(12):1114–1122. doi: 10.1016/j.numecd.2017.10.007. [DOI] [PubMed] [Google Scholar]
- 34.Classification and Diagnosis of Diabetes Standards of Medical Care in Diabetes-2018. Diabetes Care. 2018;41(Suppl 1):S13–s27. doi: 10.2337/dc18-S002. [DOI] [PubMed] [Google Scholar]
- 35.Bedogni G, Bellentani S, Miglioli L, Masutti F, Passalacqua M, Castiglione A, et al. The Fatty Liver Index: A simple and accurate predictor of hepatic steatosis in the general population. BMC Gastroenterol. 2006;6(1):33. doi: 10.1186/1471-230X-6-33. [DOI] [PMC free article] [PubMed] [Google Scholar]
- 36.Starekova J, Reeder SB. Liver fat quantification: Where do we stand? Abdominal Radiol. (New York). 2020;45(11):3386–3399. doi: 10.1007/s00261-020-02783-1. [DOI] [PMC free article] [PubMed] [Google Scholar]
- 37.Heba ER, Desai A, Zand KA, Hamilton G, Wolfson T, Schlein AN, et al. Accuracy and the effect of possible subject-based confounders of magnitude-based MRI for estimating hepatic proton density fat fraction in adults, using MR spectroscopy as reference. J. Magn. Reson. Imaging JMRI. 2016;43(2):398–406. doi: 10.1002/jmri.25006. [DOI] [PMC free article] [PubMed] [Google Scholar]
- 38.Reccia I, Kumar J, Akladios C, Virdis F, Pai M, Habib N, et al. Non-alcoholic fatty liver disease: A sign of systemic disease. Metabolism. 2017;72:94–108. doi: 10.1016/j.metabol.2017.04.011. [DOI] [PubMed] [Google Scholar]
- 39.Petersen MC, Madiraju AK, Gassaway BM, Marcel M, Nasiri AR, Butrico G, et al. Insulin receptor Thr1160 phosphorylation mediates lipid-induced hepatic insulin resistance. J. Clin. Investig. 2016;126(11):4361–4371. doi: 10.1172/JCI86013. [DOI] [PMC free article] [PubMed] [Google Scholar]
- 40.Mikolasevic I, Milic S, Turk Wensveen T, Grgic I, Jakopcic I, Stimac D, et al. Nonalcoholic fatty liver disease—A multisystem disease? World J. Gastroenterol. 2016;22(43):9488–9505. doi: 10.3748/wjg.v22.i43.9488. [DOI] [PMC free article] [PubMed] [Google Scholar]
- 41.Masarone M, Rosato V, Dallio M, Gravina AG, Aglitti A, Loguercio C, et al. Role of oxidative stress in pathophysiology of nonalcoholic fatty liver disease. Oxid. Med. Cell Longev. 2018;2018:9547613. doi: 10.1155/2018/9547613. [DOI] [PMC free article] [PubMed] [Google Scholar]
- 42.Tilg H, Moschen AR, Roden M. NAFLD and diabetes mellitus. Nat. Rev. Gastroenterol. Hepatol. 2017;14(1):32–42. doi: 10.1038/nrgastro.2016.147. [DOI] [PubMed] [Google Scholar]
- 43.Yazıcı D, Sezer H. Insulin Resistance, Obesity and Lipotoxicity. In: Engin AB, Engin A, editors. Obesity and Lipotoxicity. Springer International Publishing; 2017. pp. 277–304. [Google Scholar]
- 44.Meex RCR, Watt MJ. Hepatokines: Linking nonalcoholic fatty liver disease and insulin resistance. Nat. Rev. Endocrinol. 2017;13(9):509–520. doi: 10.1038/nrendo.2017.56. [DOI] [PubMed] [Google Scholar]
- 45.Valenti L, Bugianesi E, Pajvani U, Targher G. Nonalcoholic fatty liver disease: Cause or consequence of type 2 diabetes? Liver Int. 2016;36(11):1563–1579. doi: 10.1111/liv.13185. [DOI] [PubMed] [Google Scholar]
- 46.Qu Y, Li M, Hamilton G, Zhang YN, Song B. Diagnostic accuracy of hepatic proton density fat fraction measured by magnetic resonance imaging for the evaluation of liver steatosis with histology as reference standard: a meta-analysis. Eur. Radiol. 2019;29(10):5180–5189. doi: 10.1007/s00330-019-06071-5. [DOI] [PubMed] [Google Scholar]
- 47.Liu Z, Zhang Y, Graham S, Wang X, Cai D, Huang M, et al. Causal relationships between NAFLD, T2D and obesity have implications for disease subphenotyping. J. Hepatol. 2020;73(2):263–276. doi: 10.1016/j.jhep.2020.03.006. [DOI] [PMC free article] [PubMed] [Google Scholar]
- 48.Dongiovanni P, Stender S, Pietrelli A, Mancina RM, Cespiati A, Petta S, et al. Causal relationship of hepatic fat with liver damage and insulin resistance in nonalcoholic fatty liver. J. Intern. Med. 2018;283(4):356–370. doi: 10.1111/joim.12719. [DOI] [PMC free article] [PubMed] [Google Scholar]
- 49.Sumida Y, Nakajima A, Itoh Y. Limitations of liver biopsy and non-invasive diagnostic tests for the diagnosis of nonalcoholic fatty liver disease/nonalcoholic steatohepatitis. World J. Gastroenterol. 2014;20(2):475–485. doi: 10.3748/wjg.v20.i2.475. [DOI] [PMC free article] [PubMed] [Google Scholar]