Abstract
Layered molybdenum diselenide (MoSe2) nanosheets were formed by the weak Van der Waals forces of attraction between Se and Mo atoms. MoSe2 has a larger space between the adjacent layers and smaller band gaps in the range of 0.85 to ~ 1.6 eV. In this study, MoSe2 nanosheets decorated nickel oxide (NiO) nanorods have been synthesized by hydrothermal method using sodium molybdate and selenium metal powder. NiO/MoSe2 composite formation was confirmed by powder X-ray diffraction analysis. In addition, the presence of MoSe2 nanosheets on NiO nanorods were confirmed by field emission scanning electron microscopy, high-resolution transmission electron microscopy and X-ray photoelectron spectroscopy. The Nyquist plots of NiO/MoSe2 coated glassy carbon electrode (GCE) was indicated that it had lower charge transfer resistance compared to NiO/GCE and MoSe2/GCE. Furthermore, as-prepared NiO/MoSe2/GCE was used to detect glucose in alkaline solution by cyclic voltammetry and amperometry techniques. The NiO/MoSe2/GCE was exhibited a linear response for the oxidation of glucose from 50 µM to 15.5 mM (R2 = 0.9842) at 0.5 V by amperometry. The sensor response time and the limit of detection were found to be 2 s and 0.6 µM for glucose. Moreover, selectivity of the NiO/MoSe2 sensor was tested in the presence of common interferent molecules such as hydrogen peroxide, fructose, lactose, ascorbic acid, uric acid, and dopamine. It was found that NiO/MoSe2/GCE did not respond to these interfering biomolecules. In addition, NiO/MoSe2/GCE had shown high stability, reproducibility and repeatability. Finally, the practical application of the sensor was demonstrated by detecting glucose in human blood serum with the acceptable recovery.
Subject terms: Nanoscience and technology, Nanoscale materials
Introduction
The layered structures of transition metal dichalcogenides (TMDs) such as molybdenum diselenide (MoSe2), molybdenum disulphide (MoS2), tungsten disulphide (WS2) and tungsten diselenide (WSe2) have been actively investigated due to their attractive physical and chemical properties. Specifically, MoSe2 has a strong interlayered covalent bonds and each layers are sandwiched together by a weaker Van der Waals force of attraction. MoSe2 is a semiconductor with the bandgap in the range of 0.85 to ~ 1.6 eV and exhibited high catalytic activity, surface area and conductivity1. Compared to MoS2, MoSe2 had exhibited higher electrical conductivity2 and electrocatalytic activity due to its high metallic nature and electrocatalytically active unsaturated edges of Se3. Recently, MoSe2 had been exploited in various applications, specifically, to enhance the electrocatalytic activity in oxygen reduction reaction (ORR), hydrogen evolution reaction (HER)4, supercapacitors5, photocatalysis6 and sensors7. To obtain single-layers of MoSe2, various methods have been developed such as electrochemical exfoliation8, liquid phase exfoliation9, chemical vapor deposition10, hydrothermal methods11, etc. Zhang et al. fabricated MoSe2/NiSe2 nanowires on carbon fibers which had shown high electrocatalytic activity for the hydrogen evolution reaction12. Harpeness et al. synthesized MoSe2 nanorods with the lengths of 45 to 55 nm by microwave-assisted reaction between Mo(CO)6 and Se13. Recently, MoSe2 based composites such as Ru/MoSe214, Rh/MoSe215, Co/MoSe216, Mn/MoSe217, Nb/MoSe218, Pd/MoSe219, Sr/MoSe220 and Er/MoSe221 have been reported for various applications which include gas sensors, solar cells22, sodium-ion23 and lithium-ion batteries24. The electrocatalytic activity of MoSe2 could be improved further by (i) increasing the active sites by cation doping or substitution and (ii) by making composite with highly conducting carbon materials that can serve as a supporting catalyst to enhance the electrocatalytic activity20.
Recently transition metal oxides such as nickel oxide (NiO)25, zinc oxide26, iron oxide (Fe3O4)27, cerium oxide (CeO2)28 and tin oxide (SnO2)29 have been used as active catalytic materials to construct glucose sensors because these metal oxides can be easily synthesized with high stability at low cost. Among the various metal oxides, NiO had shown well-defined redox activity in alkaline (NaOH) solution due to the stable Ni2+/Ni3+ redox reaction. NiO is a p-type semiconductor with the bandgap in the range of 3.6 to 4.0 eV30. In order to further explore the electrocatalytic properties and applications of NiO, it had been synthesized in various shapes such as nanoparticles25, nanosheets31, nanoflowers32, nanofibers33, nanoplates34, hollow sphere 35 and nanoflakes36. Specifically, NiO had shown high electro-catalytic activity towards glucose. So, NiO-based nanocomposites such as NiO/graphene nanosheets37, NiO/MWCNTs38, Ni/NiO-rGO39 and Ni/carbon40 have been used to construct non-enzymatic glucose sensors. However, these reported sensors had shown some limitations such as utilization of expensive nanomaterials and reagents, requirement of higher working potential, short detection range, higher limit of detection (LOD), etc.
In order to increase the sensitivity and selectivity of the electrochemical sensors, various hybrid materials have been synthesized and used to construct glucose sensors by enzymatic and non-enzymatic methods. Although, the enzyme-based glucose biosensors have shown high selectivity and sensitivity, they are susceptible to environmental variations such as pH and temperature which could deteriorate the device performance due to the denaturing of glucose oxidase41. To overcome such problems and reduce the cost of the sensor devices, non-enzymatic glucose sensors have been considered for further developments. At the same time, it is anticipated that the demand for simple and accurate glucose monitoring devices is growing due to the surge in the number of diabetic patients.
In this study, we have reported synthesis of NiO nanorods in the presence of MoSe2 nanosheets. As-prepared NiO/MoSe2 nanocomposite was characterized by PXRD, FE-SEM, HR-TEM, XPS and EDX analysis. In addition, electrochemical and electrocatalytic properties of NiO/MoSe2 nanocomposite modified glassy carbon electrode (NiO/MoSe2/GCE) were studied by cyclic voltammetry, amperometry and electrochemical impedance spectroscopy (EIS). Interestingly, NiO/MoSe2/GCE had shown an enhanced electro-catalytic activity towards glucose oxidation at 0.5 V in 0.1 M NaOH. Using amperometry, a linear response was obtained for glucose oxidation from 50 µM to 15.5 mM. The common interferent molecules such as hydrogen peroxide (H2O2), fructose, lactose, uric acid (UA), dopamine (DA) and ascorbic acid (AA) were tested in the presence of glucose on NiO/MoSe2/GCE. Finally, accurate detection of glucose in human blood serum was demonstrated by using NiO/MoSe2/GCE as a non-enzymatic sensor.
Results and discussion
PXRD analysis
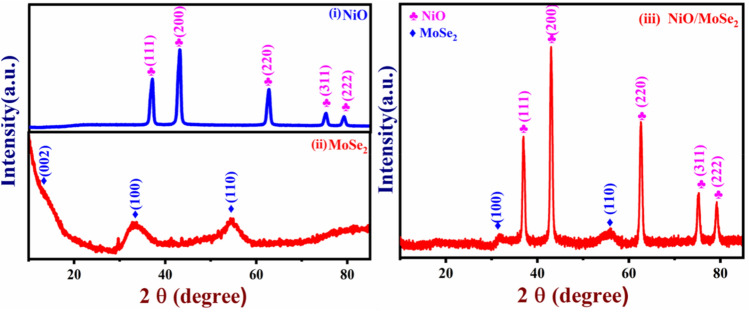
The crystallinity of MoSe2, NiO, and NiO/MoSe2 nanocomposite were studied by using PXRD. For the NiO sample, XRD bands were observed at 37.05°, 43.07°, 62.64°, 75.19° and 79.15° which were assigned to (111), (200), (220), (311) and (222) planes of NiO (Fig. 1, curve i). PXRD spectrum of MoSe2 exhibited diffraction peaks at 13.44°, 33.70° and 54.34° which were related to the (002), (100) and (110) planes, respectively (Fig. 1, curve ii). This XRD data confirmed that the hexagonal 2H-MoSe2 phase formation was obtained (JCPDS No. 29-0914)42. The XRD spectrum of NiO/MoSe2 nanocomposite was showed two major diffraction peaks at 32.44° and 54.98° which were corresponded to the MoSe2 planes of (100) and (110), respectively. In addition, NiO diffraction peaks were also observed at 36.95°, 43.07°, 62.61°, 75.25° and 79.32° due to the crystal planes of (111), (200), (220), (311) and (222) which confirmed that crystalline cubic NiO nanorods were synthesized (JCPDS No. 71-1179)43 (Fig. 1, curve iii). PXRD spectra of MoSe2 did not show very sharp XRD peaks which may be due to the presence of semi-crystalline MoSe2 in the composite. Furthermore, the PXRD results indicated that NiO/MoSe2 nanocomposite was successfully synthesized by hydrothermal method.
Figure 1.
PXRD spectra of the (i) NiO, (ii) MoSe2 powder and (iii) NiO/MoSe2 nanocomposite.
Surface topography analysis of NiO/MoSe2 composite
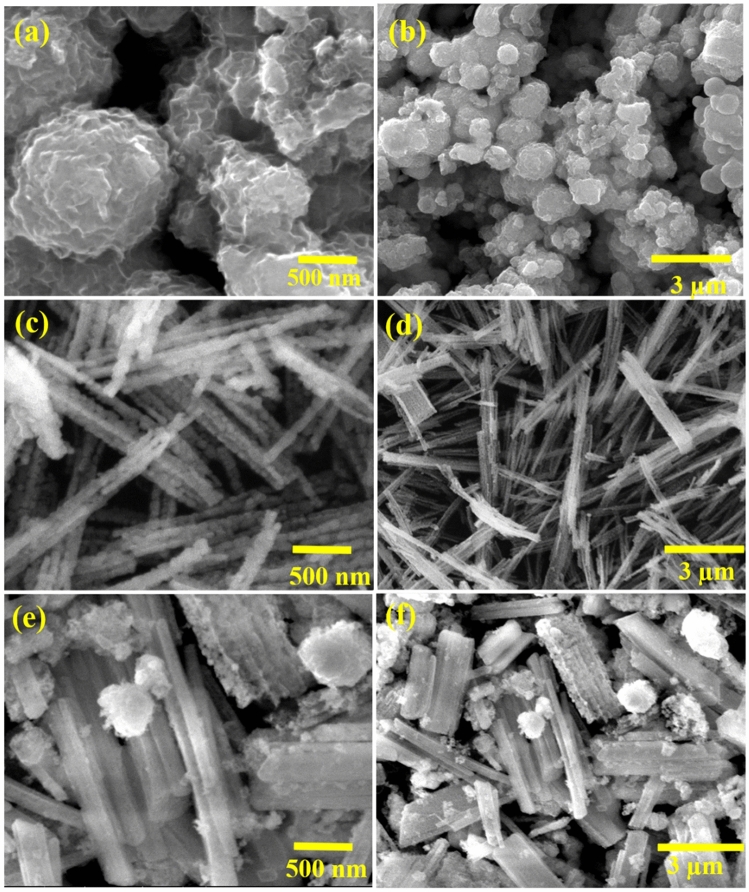
The topography features of MoSe2, NiO and NiO/MoSe2 nanocomposite have been investigated by FE-SEM at different magnifications (Fig. 2a–f). As-prepared MoSe2 exhibited nanoflowers-like structure (Fig. 2a,b)42. FE-SEM images of NiO were recorded as shown in Fig. 2c,d, which confirmed the presence of large number of nanorods with the average lengths of 4 to 8 µm and the average diameter of nanorods was ~ 15 nm. It was noted that NiO nanorods were formed uniformly with high surface area (Fig. 2c,d). In addition, from the surface morphology of the NiO/MoSe2 nanocomposite, it was confirmed that MoSe2 layers were incorporated with NiO nanorods (Fig. 2e,f).
Figure 2.
FE-SEM images of (a,b) MoSe2, (c,d) NiO nanorods and (e,f) NiO/MoSe2 nanocomposite.
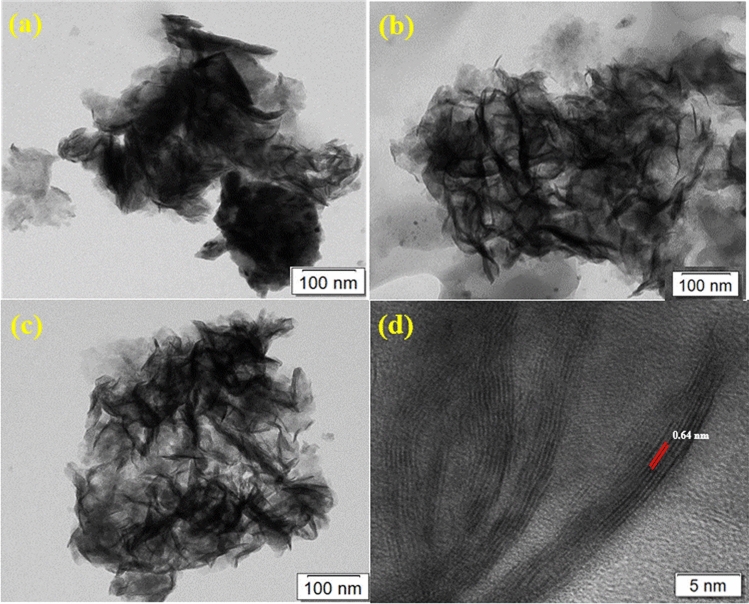
HR-TEM could provide more information about the elemental and compound structures on the atomic scale of MoSe2 and NiO/MoSe2 composite. As shown in Fig. 3a–d, agglomerated MoSe2 nanosheets were observed in the bulk sample. The lattice fringes of MoSe2 nanosheets were measured as 0.64 nm which was in good agreement with the (002) plane (Figs. 3d and 4a)44.
Figure 3.
(a–c) HR-TEM images of MoSe2 nanosheets and (d) the lattice fringe corresponding to the d spacing of MoSe2 nanosheets.
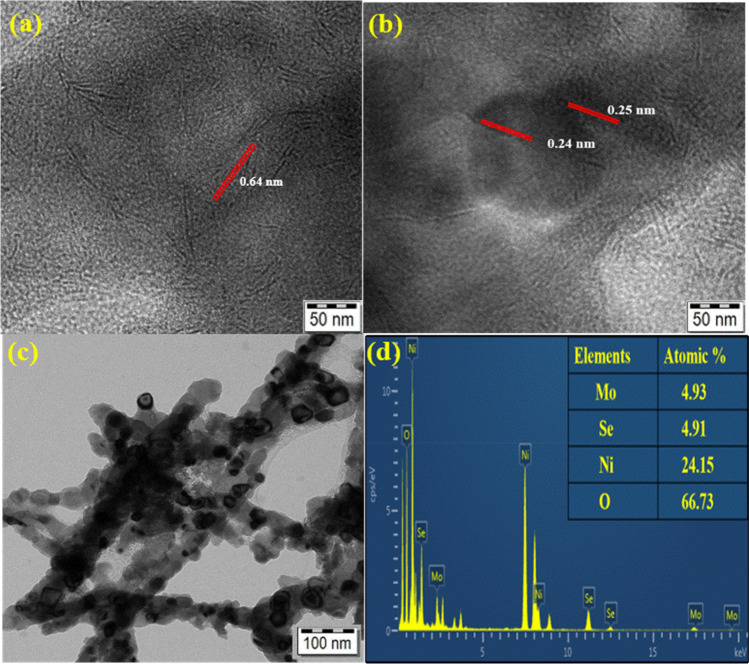
Figure 4.
(a,b) High-resolution HR-TEM images of NiO/MoSe2 with the measured lattice spaces. (c) HR-TEM image and (d) EDX spectrum of the NiO/MoSe2.
In addition, the lattice fringes of NiO were measured as 0.24 and 0.25 nm by high-resolution TEM image analysis45 (Fig. 4b). HR-TEM images of NiO/MoSe2 nanocomposite had indicated that MoSe2 nanosheets were incorporated with NiO nanorods (Fig. 4c). Next, EDX analysis was carried out on NiO/MoSe2 nanocomposite which revealed the chemical composition [4.93% Mo, 4.91% Se, 24.15% Ni and 66.73% O] of the materials that successfully confirmed the formation of NiO/MoSe2 nanocomposite (Fig. 4d).
X-ray photoelectron spectroscopy (XPS) analysis of NiO/MoSe2
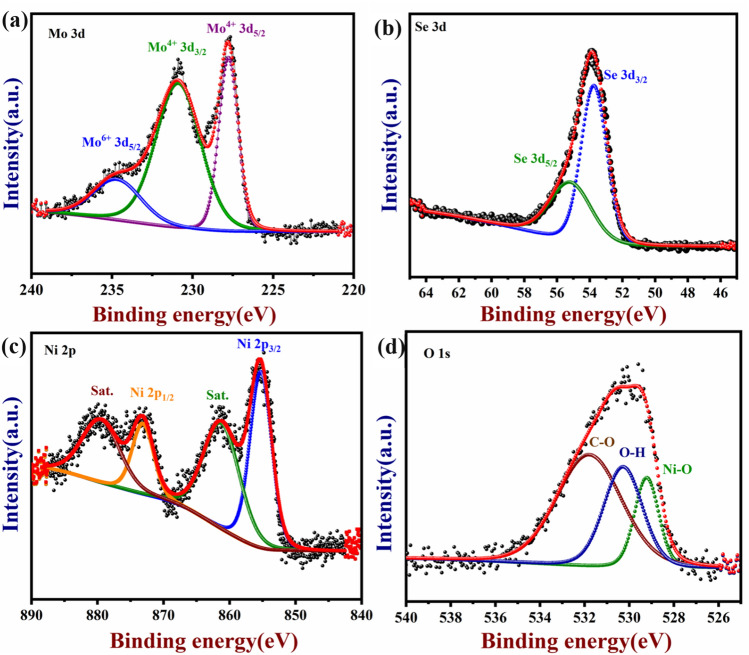
XPS was widely used to investigate the elemental composition and understand the exact details about the electronic state of the elements46. The wide scan XPS spectrum was recorded for NiO/MoSe2 sample which showed the major peaks of Ni, O, Mo, and Se elements in their respective electronic states (Fig. S1a, b). From the full-wide (0–1000 eV) scanned survey spectrum (Fig. 5a–d), Ni, O, Mo, and Se present in the NiO/MoSe2 nanocomposite were confirmed and indicated the high-purity of the synthesized nanocomposite. Moreover, XPS spectra of Mo 3d was deconvoluted into three major peaks 227.8, 231.1, 253.eV corresponding to the various electronic states of Mo4+ 3d5/2, Mo4+ 3d3/2 and Mo6+ 3d5/2, respectively21 (Fig. 5a). Figure 5b showed two peaks with binding energies of 53.8 and 55.3 eV corresponding to the divalent Se ions (Se 3d5/2 and 3d3/2, respectively). These XPS results were consistent with the earlier reports on the valence states of the MoSe220. In addition, Ni 2p spectrum was displayed two edge splits by spin–orbital coupling of the 2p3/2 main peak at 854.7 eV (Fig. 5c) and its satellite peak at 861.9 eV. The 2p1/2 main peak of Ni 2p at 872.4 eV and its satellite peak at 879.7 eV were proved the existence of NiO46. As shown in Fig. 5d, three peaks for the O 1s were observed for the binding energies of O–Ni, Ni–O–H and O–C at 529.2 eV, 530.2 eV and 532.1 eV, respectively47.
Figure 5.
XPS spectra of the NiO/MoSe2 nanocomposite were recorded: (a) Mo 3d, (b) Se 3d, (c) Ni 2p and (d) O 1 s.
Electrochemical impedance spectroscopy analysis (EIS)
Next, EIS was used to study the charge transfer resistance of the modified electrodes. The Nyquist plots were recorded in 0.1 M KCl containing 5 mM [Fe(CN)6]3−/4− using bare GCE, NiO/GCE, MoSe2/GCE, and NiO/MoSe2/GCE. The charge transfer resistance (Rct) of the modified electrode can be estimated at the low-frequency region of the semi-circle from the Nyquist plots. Each of the EIS spectrum is consisted of a typical semicircle and the high-frequency region in the EIS spectrum provided the parametric information about the resistance of the electrode/electrolyte interface48. The solution resistance (Rs) was found to be 13 Ω. After the subtraction of Rs, the Rct values of the NiO/MoSe2/GCE (79.6 Ω), MoSe2/GCE (99.4 Ω), NiO/GCE (92 Ω), and bare/GCE (103.4 Ω) were calculated (Fig. 6). It showed that NiO/MoSe2/GCE had exhibited lower Rct value due to the enhanced conductivity of the nanocomposite.
Figure 6.
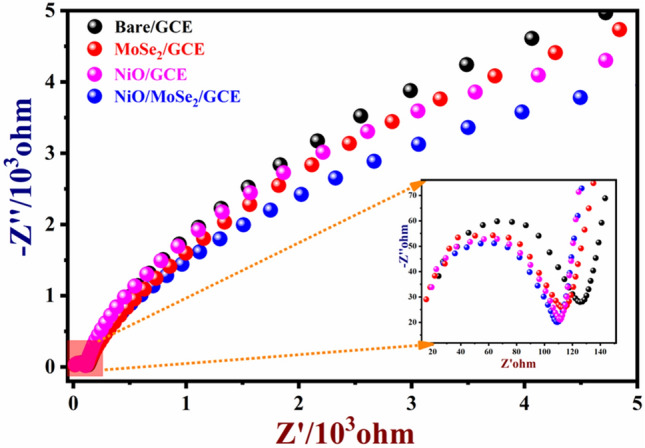
Typical Nyquist plots of NiO/MoSe2/GCE, NiO/GCE, MoSe2/GCE and bare/GCE were recorded in 0.1 M KCl containing 5 mM [Fe(CN)6]3−/4− in the frequency range from 0.1 Hz to 1000 kHz (inset is the enlarged view of high frequency range).
Electro-catalytic oxidation of glucose at NiO/MoSe2/GCE
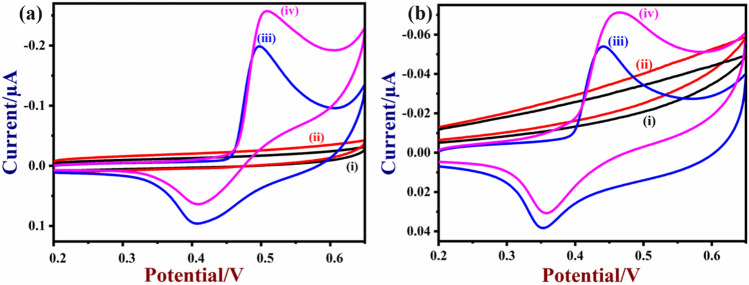
The electro-catalytic activity of the nanocomposite for the glucose oxidation was studied by cyclic voltammetry. Cyclic voltammograms (CVs) of the bare-GCE, NiO, MoSe2 and NiO/MoSe2 modified GCE’s were recorded in the presence and absence of glucose (50 µM) in 0.1 M NaOH. In the presence of glucose, no oxidation or reduction peak was observed on bare GCE (Fig. 7a, curves i, ii). Interestingly, NiO/MoSe2/GCE was showed an enhanced redox peak of Ni2+/Ni3+ in the potential window between 0.2 and 0.65 V in 0.1 M NaOH. The oxidation and reduction peaks of NiO were appeared at 0.49 V and 0.39 V, respectively (Fig. 7a, curve iii). The formal potential (E°′ = Epa + Epc/2) of the NiO redox peak on MoSe2 was found to be + 0.44 V which was in agreement with other reported sensors35. The peak-to-peak (ΔEp = Epa − Epc) separation of redox peak (NiO) was found to be 100 mV. It was clear that NiO nanorods were firmly attached with MoSe2. Furthermore, it is worth to mention that after the injection of 50 µM glucose in to 0.1 M NaOH, NiO/MoSe2/GCE was exhibited a notable enhancement in the anodic peak current at 0.50 V for glucose oxidation and the decrease in the cathodic peak current at ~ 0.40 V. This indicated the good electro-catalytic activity of the NiO/MoSe2 modified electrode (Fig. 7a curves iii and iv).
Figure 7.
(a) CVs of bare-GCE and NiO/MoSe2/GCE in 0.1 M NaOH in the absence (curves i and iii) and presence of 50 µM glucose (curves ii and iv). (b) CVs of MoSe2/GCE and NiO/GCE in 0.1 M NaOH in the absence (curves i and iii) and presence of 50 µM glucose (curves ii and iv). Scan rate = 50 mVs−1.
The observed improvement in the electrocatalytic activity of the NiO/MoSe2 nanocomposite for glucose oxidation was further revealed by comparison studies performed with the individually prepared MoSe2/GCE and NiO/GCE under the same condition. MoSe2/GCE did not show any oxidation peak for glucose (Fig. 7b curves i and ii). However, NiO/GCE was showed an oxidation peak for glucose at 0.46 V (Fig. 7b, curves iii and iv). But, the observed catalytic current was very low compared to the NiO/MoSe2 modified GCE (Fig. 7a curve iii and iv). The higher electro-catalytic activity of the nanocomposite might come from the synergistic interaction between NiO and MoSe2 (Scheme 1). The proposed mechanism for the electro-catalytic oxidation of glucose on NiO/MoSe2/GCE is shown in Eqs. (1, 2)49.
| 1 |
| 2 |
Scheme 1.
Electro-catalytic oxidation mechanism for glucose on NiO/MoSe2 nanocomposite modified electrode.
During the electrochemical oxidation process, NiO was reacted with the hydroxyl (OH-) ions in the alkaline solution (0.1 M NaOH) which converted Ni2+ to Ni3+. This confirmed the formation of nickel oxyhydroxide (NiOOH) (oxidising agent) and converted glucose in to gluconolactone49.
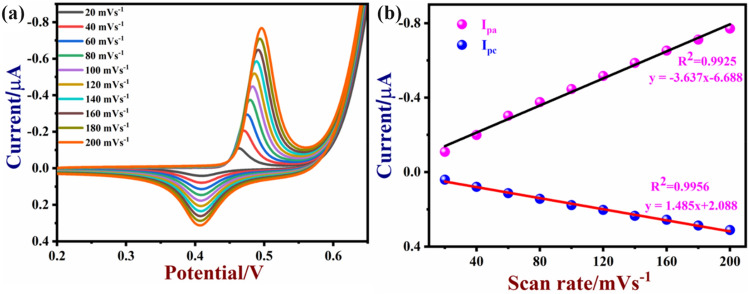
The effects of scan rate on the glucose oxidation was also studied by CV. CVs were recorded in 0.1 M NaOH containing 50 µM glucose at different scan rates (from 20 to 200 mVs−1) using a NiO/MoSe2 nanocomposite modified GCE (Fig. 8a). As can be seen, both cathodic and anodic peaks (Ipc and Ipa) currents were linearly increased with the scan rates. This indicated that glucose oxidation was a surface-controlled process on NiO/MoSe2/GCE50. A linear relationship was observed between the scan rate (mVs-1) and peak currents (I/µA) with a correlation coefficient of (Ipa; R2 of 0.9925) and (Ipc; R2 of 0.9956) (Fig. 8b).
Figure 8.
CVs recorded using (a) NiO/MoSe2/GCE in 0.1 M NaOH containing 50 µM glucose at various scan rates (from 20 to 200 mVs−1). (b) The linear relationship between the scan rate versus peak currents with a correlation coefficient values of (Ipa, R2 = 0.9925 and Ipc, R2 = 0.9956).
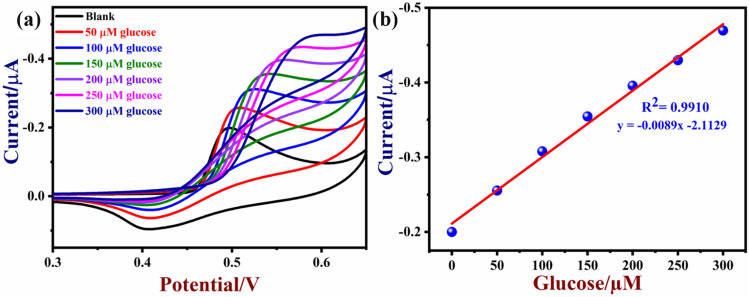
Next, CVs were recorded in 0.1 M NaOH with different concentrations of glucose (from 50 to 350 µM) using a NiO/MoSe2/GCE (Fig. 9a, b). The oxidation peak currents of NiO/MoSe2/GCE were increased linearly with the concentrations of the glucose. In addition, the glucose oxidation peaks were slightly shifted to positive potential because of the restricted diffusion-controlled and mass transfer process51. It may be also due to the local pH change in the electrolyte during the oxidation of glucose and the formation of some oxidized intermediates.
Figure 9.
(a) CVs of NiO/MoSe2/GCE were recorded in the presence of different concentrations of glucose from 50 to 300 µM in 0.1 M NaOH at a scan rate 50 mVs−1. (b) The corresponding calibration graph of glucose with different concentrations.
Next, the optimum amount of NiO/MoSe2 catalyst on the GCE and its effect on the electrocatalytic oxidation of 50 µM glucose was studied (Fig. S2a). For this purpose, different volumes (10 to 50 µL) of NiO/MoSe2 dispersion (0.2 mg/mL) was drop-casted on GCE (Fig. S2b). It was found that glucose oxidation was kinetically favourable on NiO/MoSe2/GCE coated with 2 μg (10 µL) of catalyst. However, higher loadings of the NiO/MoSe2 material (4, 6, 8, and 10 μg) on the GCE were negatively affected the glucose oxidation current (decreased). It might be due to the higher amount of the catalyst was not favourable for the interaction between glucose and electrode surface. From this study, 2 μg (10 µL) of NiO/MoSe2 was selected to prepare modified GCE for further studies (Fig. S2a, b).
Amperometric detection of glucose
Amperometry is one of the highly sensitive electrochemical techniques which works at constant applied potential and current responses were recorded with time by varying the concentrations of the analyte. Firstly, the optimum voltage for glucose oxidation was determined from the series of amperograms recorded with the addition of glucose from 50 to 300 µM at varied applied voltages (from 0.4, 0.45, 0.50 and 0.55 V) on NiO/MoSe2/GCE (Fig. S3). It was found that NiO/MoSe2/GCE was well responded with high current for the each additions of glucose at 0.5 V (Fig. S3, red curve), so it was selected as the optimum voltage for further investigations (Fig. S3).
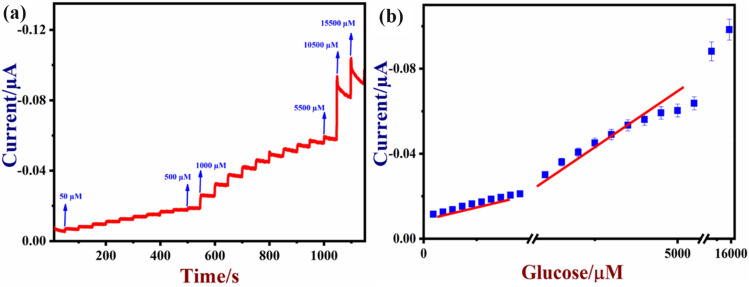
Figure 10a shows the amperograms recorded in 0.1 M NaOH with different concentrations of glucose. After the injection of different concentrations of glucose (from 50 µM to 15.5 mM), NiO/MoSe2/GCE was linearly responded and the steady state current was reached within 2 s after the each addition (Fig. 10a). From this amperograms, a calibration graph was plotted for glucose after triplicate measurements (Fig. 10b) and the corresponding error bars were provided on the calibration plot. As can be seen, a linear relationship was observed between Ipa and glucose concentrations with a correlation coefficient of (R2) 0.9842 (Fig. 10b).
Figure 10.
(a) Amperometric curve was recorded using a NiO/MoSe2/GCE with the successive additions of glucose from 50 µM to 15.5 mM at 0.5 V in 0.1 M NaOH. This solution was stirred at 1200 rpm. (b) The corresponding calibration plot of glucose with the standard deviation (n = 3).
Generally, the limit of detection (LOD) was calculated from formula of 3× standard deviation of the response/slope of the calibration graph. The standard deviation (SD) of the blank was 2.46 × 10⁻⁷ A and the slope of the calibration curve was 1.25 × 10⁻⁶ A µM−1. Using these values, LOD was estimated as 0.6 µM (S/N = 3). From the above results, it was concluded that NiO/MoSe2/GCE had exhibited a wide linear range of detection and lower LOD due to the high electron transfer rate between glucose and NiO/MoSe2/GCE in 0.1 M NaOH. In addition, NiO/MoSe2/GCE sensor was also showed more promising analytical performance for glucose sensing compared to some of the reported electrochemical sensors (Table 1).
Table 1.
Comparison of the analytical performance of the NiO/MoSe2 electrode with the other reported glucose sensors based on different electrode materials.
| Electrode | Electrolyte | Applied potential (V) | Liner range of glucose (mM) | LOD (µM) | References |
|---|---|---|---|---|---|
| Cu2O/CuE | 0.1 M NaOH | 0.6 | 0.05 to 6.75 | 37 | 52 |
| Pt–Au/Au–Si | 0.1 M PBS | 0.3 | 0 to 1.05 | 6.0 | 53 |
| CuO/GE | 0.1 M NaOH | 0.6 | 0.004 to 8 | 4.0 | 54 |
| Nanoporous Pt thin film | PBS | 0.4 | 1 to 10 | 97 | 55 |
| Cu NB/CuE | 50 mM NaOH | 0.6 | – | 10 | 56 |
| Ni/NiO-Nafion-rGO/SPE | 0.1 M NaOH | 0.55 | 0.03 to 6.44 | 1.8 | 39 |
| NiO/GNS/GCE | 0.1 M NaOH | 0.5 | 0.005 to 4.2 | 5.0 | 37 |
| NiO/MWCNTs/Ta | 0.1 M NaOH | 0.5 | 0.001 to 7 | 2.0 | 38 |
| NiO/MoS2/GCE | 0.1 M NaOH | 0.55 | 0.01 to10 | 1.6 | 57 |
| NiO/MoSe2/GCE | 0.1 M NaOH | 0.5 | 0.05 to 15.5 | 0.6 | This work |
NB nanobelt, NiO/GNS nickel oxide/graphene nanosheet, MWCNTs multi-walled carbon nanotubes, CuE Copper electrode, Au–Si gold coated silicon substrate, GE graphite electrode, GCE glassy carbon electrode, SPE screen printed electrode, PBS phosphate buffer solution, Ta Tantalum.
Interference, repeatability and stability analysis
The selectivity of the NiO/MoSe2/GCE was tested in the presence of other common biological compounds because they could affect the sensor response in the real samples. In order to use NiO/MoSe2/GCE sensor in real-world samples, NiO/MoSe2/GCE was tested with the important biomolecules (H2O2, fructose, lactose, DA, AA, and UA) which may affect the direct electrochemical oxidation of glucose because of their overlapping oxidation potentials with glucose. As shown in Fig. 11, after the each addition of interferent compounds (each 0.1 mM) such as H2O2, fructose, lactose, UA, DA, and AA, the NiO/MoSe2/GCE did not show any observable current response at 0.5 V (Fig. 11). It indicated the good selectivity of the modified electrode.
Figure 11.
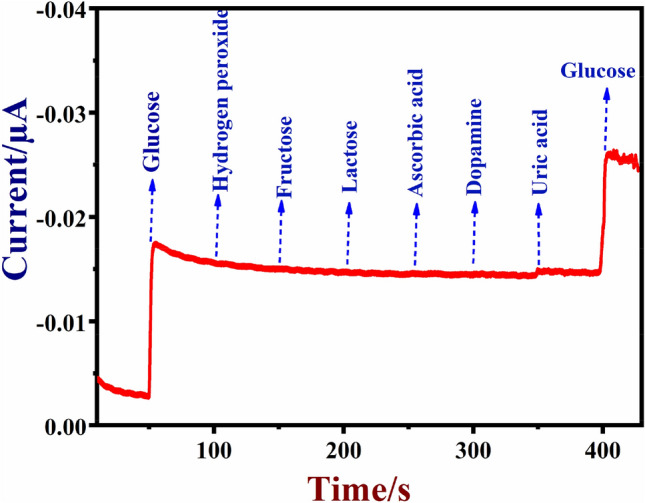
Amperometric response were recorded using a NiO/MoSe2/GCE in 0.1 M NaOH in the presence of H2O2 (0.1 mM), fructose (0.1 mM), lactose (0.1 mM), ascorbic acid (0.1 mM), uric acid (0.1 mM), dopamine (0.1 mM) and glucose (0.5 mM). Rotation rate was 1200 rpm. The applied potential was 0.5 V.
Moreover, repeatability and stability of NiO/MoSe2/GCE were also investigated by cyclic voltammetry. CVs were recorded in 0.1 M NaOH containing 50 µM glucose for five times in the interval of 0 to 8 h (Fig. S4a, b). The relative standard deviation (RSD) for five repeated measurements was 2.08%. This data showed that NiO/MoSe2/GCE can be used for continuous glucose measurements.
The stability of the NiO/MoSe2 film on the GCE surface was also tested by recording continuous CVs in 0.1 M NaOH for 50 cycles (Fig. S5a). The anodic and cathodic peak currents of NiO/MoSe2/GCE were slightly decreased about 9%. However, the redox potential of the NiO/MoSe2/GCE did not change significantly after scanning about 50 cycles that confirmed the good stability of the modified electrode (Fig. S5a, b). Next, the reproducibility of NiO/MoSe2/GCE was investigated by detecting 50 μM glucose under the same condition using three independently prepared NiO/MoSe2/GCE electrodes. The relative standard deviation (RSD) for the three different electrodes was 5.3% which showed that the electrode modification procedure was highly reproducible (Fig. S6).
Determination of glucose in blood serum samples
The real application of the NiO/MoSe2/GCE was tested by detecting glucose concentrations in blood serum samples. The human blood serum samples were obtained from the SRM Medical College Hospital and Research Centre which is located inside our campus. The serum was obtained using the following procedure. The blood was collected in a serum separator tube (SST, tiger top tube) from two healthy individuals and allowed to clot for one hour at room temperature. After that, the sample was centrifuged at 2500 rpm for 15 min to remove the clot. Finally, the resulted serum liquid was stored at − 20 °C in the refrigerator58. Next, 100 µL of the blood serum solution was injected into the 10 mL of 0.1 M NaOH and the electrode response was recorded at 0.5 V59. The blood glucose concentration in the human blood serum was estimated from the calibrated graph (Fig. 9b). Our obtained glucose concentrations in two different serum samples were shown in Table 2. It has been observed that our proposed sensor showed accurate results compared to the results obtained from the SRM Hospital and Research Centre (Table 2). Thus, we have concluded that our proposed sensor may be useful to construct commercial glucose sensing devices.
Table 2.
Determination of glucose in human blood serum samples by using a NiO/MoSe2/GCE.
| S. No | Samples | Glucose concentration (mM) detected by hexokinase method (from SRM Hospital) | Glucose concentration (mM) detected by NiO/MoSe2/GCE | Recovery % | Error % |
|---|---|---|---|---|---|
| 1 | Human serum-1 | 7.8 | 7.6 | 97.4 | 2.6 |
| 2 | Human serum-2 | 9.4 | 9.29 | 98.8 | 1.2 |
The long-term stability of the NiO/MoSe/GCE was also tested by using the same modified electrode for the determination glucose in 50 µL blood serum. During this period, CVs were recorded with blood serum in 0.1 M NaOH from day 1 to 25 days. The oxidation current of glucose in blood serum was decreased by about 4.3% (n = 5) after 25 days which indicated that NiO/MoSe/GCE may be useful for repeated measurements (Fig. S7).
Conclusions
In summary, MoSe2 incorporated NiO nanorods were hydrothermally synthesized and comprehensively characterized by PXRD, HR-TEM, FE-SEM and XPS. It was found that MoSe2 nanosheets were present on the NiO nanorods. In addition, the electrochemical and electrocatalytic properties of NiO/MoSe2 have been studied which showed that this sensor may be useful for selective detection of glucose by amperometry. The NiO/MoSe2 catalyst loading (2 µg on GCE) and applied voltage (0.5 V) for glucose oxidation were optimized. The NiO/MoSe2/GCE exhibited a linear response for the detection of glucose from 50 μM to 15.5 mM and LOD was 0.6 µM. Furthermore, stability, reproducibility and repeatability studies were indicated that the NiO/MoSe2/GCE was highly stable and can be used for repeated measurements. The response time of the sensor was 2 s for glucose. The real sample analysis was also carried out in blood serum samples using the NiO/MoSe2/GCE. The glucose recovery analysis were indicated that NiO/MoSe2/GCE can be applied for the detection of glucose in real samples with high selectivity and accuracy. Based on our results, NiO/MoSe2 nanocomposite-based electrode can be easily prepared for the selective detection of glucose in various samples.
Experimental
Reagents and apparatus
All the reagents and chemicals used were of analytical grade. Ammonium molybdate tetrahydrate (NH4)6 Mo7O24.4H2O, selenium metal powder (99.9%), hydrazine hydrate (N2H4, 80%), nickel chloride hexahydrate (NiCl2.6H2O), sodium hydroxide (NaOH), sodium oxalate (Na2C2O4) and glucose (C6H12O6)) were purchased from Sigma-Aldrich, Sisco Research Laboratories, Thermo Fisher Scientific and Loba Chemie. These chemicals were used without any further purifications. All solutions were prepared with Mili-Q distilled water (18.2 MΩ cm @ 25 ± 2 °C).
Electrochemical measurements were carried out by using the electrochemical workstation (Model: CHI-760E) from CH Instruments, Austin, TX, USA. Electrochemical studies were performed in a standard electrochemical cell using a three-electrode system with NiO/MoSe2/GCE as the working electrode, Ag/AgCl (3M KCl) as the reference electrode and platinum wire as the counter (auxiliary) electrode. The blood serum samples were received from the SRM Medical College Hospital and Research Centre, Kattankulathur, Tamil Nadu. All the experiments were carried out in accordance with the relevant guidelines and regulations. The SRMIST ethics committee was approved the experiments (Ref. No: 002/HYC/IEC/2018). Informed consents were obtained from the human participants of this study.
Hydrothermal synthesis of MoSe2 nanosheets
MoSe2 nanosheets were prepared by the hydrothermal method as reported elsewhere with some modifications12. Briefly, 0.03 g of (NH4)6Mo7O24·4H2O was added in to 50 mL of distilled water and stirred for 20 min. 0.07 g of selenium (Se) metal powder was dissolved in 10 mL distilled water and 2 mL of 80% hydrazine hydrate solution was added. This solution was mixed well with constant stirring (1000 rpm) up to 24 h. After that, the Se solution was slowly added into (NH4)2.MoO4 solution which produced an orange-red colour. Later, the solution mixture was transferred into the Teflon-lined autoclave and heated in a hot air oven at 200 °C for 12 h. Finally, the sample was centrifuged at 5000 rpm for 15 min and the precipitate was collected, washed with ethanol, water and dried in hot air oven at 60 °C. The obtained product was annealed in a tubular furnace at 500 °C for 3 h under nitrogen atmosphere and a black MoSe2 powder was obtained.
Synthesis of NiO/MoSe2 nanocomposite
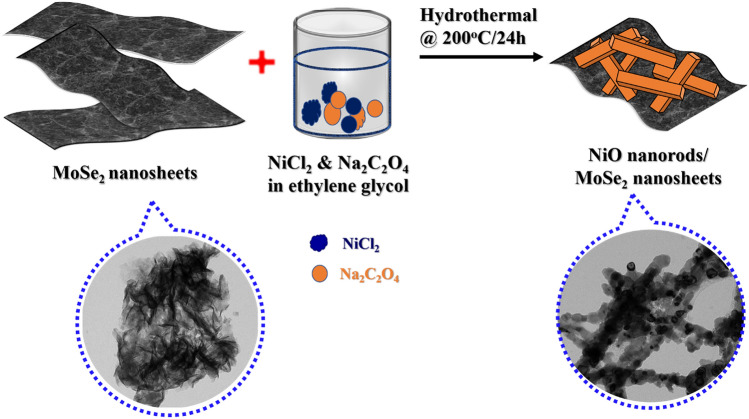
NiCl2 (0.474 g) and MoSe2 (0.307 g) were dissolved in 18 mL of distilled water plus 30 mL ethylene glycol (80%) and stirred continuously for 30 min. After that, Na2C2O4 (0.1206 g) was added in to the above solution under constant stirring at room temperature. Finally, the resulted solution mixture was transferred into a Teflon–lined stainless steel autoclave and maintained at 200 °C for 24 h60. Then, the reaction mixture was cooled down to the room temperature and transferred in to a centrifuge tube. After the centrifugation at 8000 rpm for 15 min, the precipitate was collected and dried at 60 ºC for 12 h. After that NiO/MoSe2 nanocomposite was calcinated at 500º C for 3 h under N2 atmosphere (Scheme 2).
Scheme 2.
The schematic illustration for the preparation of NiO/MoSe2 nanocomposite by hydrothermal method.
Material characterizations
The crystal structure of the NiO/MoSe2 was investigated by using a powder X-ray diffraction (PXRD) spectrometer with Cu Kα radiation (λ = 0.15406 nm) (X’pert powder XRD system, Malvern Panalytical). The surface morphology of the samples were characterized by using FE-SEM (FEI Quanta FEG 200) and HR-TEM (TEM, JEM-2100 Plus, Jeol) with energy dispersive X-ray (EDX) analysis. For TEM characterizations, 3 µL suspension of (0.5 mg/mL) NiO/MoSe2 was drop casted on copper grid and dried at room temperature. The sample coated copper grid was used for HR-TEM analysis. A PHI Versa Probe III Scanning XPS Microprobe was used for the XPS analysis (Physical Electronics, USA).
Preparation of NiO/MoSe2 modified GCE
The glassy carbon electrode (GCE, diameter 3 mm) polished on alumina slurry with different particle sizes (0.05, 0.1, 0.3 µm) and washed with distilled water and ethanol to obtain a mirror-like surface. After that, 1 mg of NiO/MoSe2 nanocomposite was dispersed in 5 mL of distilled water and bath sonicated for 30 min. To prepare NiO/MoSe2/GCE, 10 μL of NiO/MoSe2 composite solution was drop casted on the GCE surface and water was evaporated at 50 °C. For comparison measurements, bare GCE, NiO/GCE, and MoSe2/GCE were also similarly prepared.
Supplementary Information
Acknowledgements
This work was financially supported by the Department of Science and Technology (DST)-Science and Engineering Research Board (SERB), Government of India for the funding through Early Career Research Award (Ref. No.: ECR/2016/001446), and Department of Science and Technology (International Bilateral Cooperation Division) for financial support through “INDO-RUSSIA Project (No. INT/RUS/RFBR/385)”. The authors are grateful to the support and fund by the Distinguished Scientist Fellowship Program (DSFP-2021), King Saud University, Riyadh, Saudi Arabia and Taif University Researchers Supporting Project number (TURSP-2020/04), Taif University, Taif, Saudi Arabia.
Author contributions
A.K.S. and G.J. conceived the idea of the research project. G.J. carried out all experiments, analysis, characterization and written the first draft of the manuscript. A.K.S. was edited and revised with the help of G.J. K.V., Z.A.A. and T.A. contributed to the revision, experimental, writing and provided suggestions to improve the quality of the research and results.
Competing interests
The authors declare no competing interests.
Footnotes
Publisher's note
Springer Nature remains neutral with regard to jurisdictional claims in published maps and institutional affiliations.
Supplementary Information
The online version contains supplementary material available at 10.1038/s41598-021-92620-2.
References
- 1.Tang H, et al. Hydrothermal synthesis of 3D hierarchical flower-like MoSe2 microspheres and their adsorption performances for methyl orange. Appl. Surf. Sci. 2016;379:296–303. doi: 10.1016/j.apsusc.2016.04.086. [DOI] [Google Scholar]
- 2.Kam, K.-K. Electrical properties of WSe2, WS2, MoSe2, MoS2, and their use as photoanodes in a semiconductor liquid junction solar cell. Retrospective Theses and Dissertations, 8356. 10.31274/rtd-180813-7962 (1982).
- 3.Ma L, Xu L, Zhou X, Xu X, Zhang L. Synthesis of a hierarchical MoSe2/C hybrid with enhanced electrochemical performance for supercapacitors. RSC Adv. 2016;6:91621–91628. doi: 10.1039/C6RA16157J. [DOI] [Google Scholar]
- 4.Dai C, et al. Large-scale synthesis of graphene-like MoSe2 nanosheets for efficient hydrogen evolution reaction. J. Phys. Chem. C. 2017;121:1974–1981. doi: 10.1021/acs.jpcc.6b11423. [DOI] [Google Scholar]
- 5.Kirubasankar B, Vijayan S, Angaiah S. Sonochemical synthesis of a 2D–2D MoSe2/graphene nanohybrid electrode material for asymmetric supercapacitors. Sustain. Energy Fuels. 2019;3:467–477. doi: 10.1039/C8SE00446C. [DOI] [Google Scholar]
- 6.Huang J, et al. Controllable synthesis of flower-like MoSe2 3D microspheres for highly efficient visible-light photocatalytic degradation of nitro-aromatic explosives. J. Mater. Chem. A. 2018;6:11424–11434. doi: 10.1039/C8TA02287A. [DOI] [Google Scholar]
- 7.Dhenadhayalan N, Lin T-W, Lee H-L, Lin K-C. Multisensing capability of MoSe2 quantum dots by tuning surface functional groups. ACS Appl. Nano Mater. 2018;1:3453–3463. doi: 10.1021/acsanm.8b00634. [DOI] [Google Scholar]
- 8.Eng AYS, Ambrosi A, Sofer Z, Simek P, Pumera M. Electrochemistry of transition metal dichalcogenides: Strong dependence on the metal-to-chalcogen composition and exfoliation method. ACS Nano. 2014;8:12185–12198. doi: 10.1021/nn503832j. [DOI] [PubMed] [Google Scholar]
- 9.Gholamvand Z, et al. Comparison of liquid exfoliated transition metal dichalcogenides reveals MoSe2 to be the most effective hydrogen evolution catalyst. Nanoscale. 2016;8:5737–5749. doi: 10.1039/C5NR08553E. [DOI] [PubMed] [Google Scholar]
- 10.Wang X, et al. Chemical vapor deposition growth of crystalline monolayer MoSe2. ACS Nano. 2014;8:5125–5131. doi: 10.1021/nn501175k. [DOI] [PubMed] [Google Scholar]
- 11.Jiang Q, Lu Y, Huang Z, Hu J. Facile solvent-thermal synthesis of ultrathin MoSe2 nanosheets for hydrogen evolution and organic dyes adsorption. Appl. Surf. Sci. 2017;402:277–285. doi: 10.1016/j.apsusc.2017.01.049. [DOI] [Google Scholar]
- 12.Zhang L, et al. Hydrothermal synthesis of 3D hierarchical MoSe 2/NiSe2 composite nanowires on carbon fiber paper and their enhanced electrocatalytic activity for the hydrogen evolution reaction. J. Mater. Chem. A. 2017;5:19752–19759. doi: 10.1039/C7TA05352E. [DOI] [Google Scholar]
- 13.Harpeness R, Gedanken A, Weiss AM, Slifkin MA. Microwave-assisted synthesis of nanosized MoSe2. J. Mater. Chem. 2003;13:2603–2606. doi: 10.1039/b303740a. [DOI] [Google Scholar]
- 14.Vasu K, Meiron OE, Enyashin AN, Bar-Ziv R, Bar-Sadan M. Effect of Ru doping on the properties of MoSe2 nanoflowers. J. Phys. Chem. C. 2018;123:1987–1994. doi: 10.1021/acs.jpcc.8b11712. [DOI] [Google Scholar]
- 15.Cui H, Zhang G, Zhang X, Tang J. Rh-doped MoSe2 as a toxic gas scavenger: A first-principles study. Nanoscale Adv. 2019;1:772–780. doi: 10.1039/C8NA00233A. [DOI] [PMC free article] [PubMed] [Google Scholar]
- 16.Zimron O, et al. Co-doped MoSe2 nanoflowers as efficient catalysts for electrochemical hydrogen evolution reaction (HER) in acidic and alkaline media. Isr. J. Chem. 2020;60:624. doi: 10.1002/ijch.201900162. [DOI] [Google Scholar]
- 17.Dau MT, et al. van der Waals epitaxy of Mn-doped MoSe2 on mica. APL Mater. 2019;7:51111. doi: 10.1063/1.5093384. [DOI] [Google Scholar]
- 18.Bougouma M, Guel B, Segato T, Legma JB, Ogletree M-PD. The structure of niobium-doped MoSe2 and WSe2. Bull. Chem. Soc. Ethiop. 2008;22:225–236. doi: 10.4314/bcse.v22i2.61289. [DOI] [Google Scholar]
- 19.Zhang D, Li Q, Li P, Pang M, Luo Y. Fabrication of Pd-decorated MoSe2 nanoflowers and density functional theory simulation toward ammonia sensing. IEEE Electron Device Lett. 2019;40:616–619. doi: 10.1109/LED.2019.2901296. [DOI] [Google Scholar]
- 20.Sakthivel M, Sukanya R, Chen S-M, Dinesh B. Synthesis of two-dimensional Sr-Doped MoSe2 nanosheets and their application for efficient electrochemical reduction of metronidazole. J. Phys. Chem. C. 2018;122:12474–12484. doi: 10.1021/acs.jpcc.8b02188. [DOI] [Google Scholar]
- 21.Sakthivel M, Sukanya R, Chen S-M. Fabrication of europium doped molybdenum diselenide nanoflower based electrochemical sensor for sensitive detection of diphenylamine in apple juice. Sensors Actuators B Chem. 2018;273:616–626. doi: 10.1016/j.snb.2018.06.094. [DOI] [Google Scholar]
- 22.Delphine SM, Jayachandran M, Sanjeeviraja C. Review of material properties of (Mo/W) Se2-layered compound semiconductors useful for photoelectrochemical solar cells. Crystallogr. Rev. 2011;17:281–301. doi: 10.1080/0889311X.2011.611130. [DOI] [Google Scholar]
- 23.Kang W, Wang Y, Cao D, Kang Z, Sun D. In-situ transformation into MoSe2/MoO3 heterogeneous nanostructures with enhanced electrochemical performance as anode material for sodium ion battery. J. Alloys Compd. 2018;743:410–418. doi: 10.1016/j.jallcom.2018.02.037. [DOI] [Google Scholar]
- 24.Luo Z, et al. Two-dimensional hybrid nanosheets of few layered MoSe2 on reduced graphene oxide as anodes for long-cycle-life lithium-ion batteries. J. Mater. Chem. A. 2016;4:15302–15308. doi: 10.1039/C6TA04390A. [DOI] [Google Scholar]
- 25.El-Kemary M, Nagy N, El-Mehasseb I. Nickel oxide nanoparticles: Synthesis and spectral studies of interactions with glucose. Mater. Sci. Semicond. Process. 2013;16:1747–1752. doi: 10.1016/j.mssp.2013.05.018. [DOI] [Google Scholar]
- 26.Wahab HA, et al. Zinc oxide nano-rods based glucose biosensor devices fabrication. Res. Phys. 2018;9:809–814. [Google Scholar]
- 27.Cao X, Wang N. A novel non-enzymatic glucose sensor modified with Fe2O3 nanowire arrays. Analyst. 2011;136:4241–4246. doi: 10.1039/c1an15367f. [DOI] [PubMed] [Google Scholar]
- 28.Saha S, et al. Nanoporous cerium oxide thin film for glucose biosensor. Biosens. Bioelectron. 2009;24:2040–2045. doi: 10.1016/j.bios.2008.10.032. [DOI] [PubMed] [Google Scholar]
- 29.Ansari SG, et al. Glucose sensor based on nano-baskets of tin oxide templated in porous alumina by plasma enhanced CVD. Biosens. Bioelectron. 2008;23:1838–1842. doi: 10.1016/j.bios.2008.02.022. [DOI] [PubMed] [Google Scholar]
- 30.Yang H, Tao Q, Zhang X, Tang A, Ouyang J. Solid-state synthesis and electrochemical property of SnO2/NiO nanomaterials. J. Alloys Compd. 2008;459:98–102. doi: 10.1016/j.jallcom.2007.04.258. [DOI] [Google Scholar]
- 31.Huang W, et al. Ni (OH)2/NiO nanosheet with opulent active sites for high-performance glucose biosensor. Sensors Actuators B Chem. 2017;248:169–177. doi: 10.1016/j.snb.2017.03.151. [DOI] [Google Scholar]
- 32.Prasad MS, Chen R, Ni H, Kumar KK. Directly grown of 3D-nickel oxide nano flowers on TiO2 nanowire arrays by hydrothermal route for electrochemical determination of naringenin flavonoid in vegetable samples. Arab. J. Chem. 2020;13:1520–1531. doi: 10.1016/j.arabjc.2017.12.004. [DOI] [Google Scholar]
- 33.Ding Y, Wang Y, Su L, Zhang H, Lei Y. Preparation and characterization of NiO–Ag nanofibers, NiO nanofibers, and porous Ag: towards the development of a highly sensitive and selective non-enzymatic glucose sensor. J. Mater. Chem. 2010;20:9918–9926. doi: 10.1039/c0jm01968b. [DOI] [Google Scholar]
- 34.Wang L, et al. One-step synthesis of Pt–NiO nanoplate array/reduced graphene oxide nanocomposites for nonenzymatic glucose sensing. J. Mater. Chem. A. 2015;3:608–616. doi: 10.1039/C4TA04724A. [DOI] [Google Scholar]
- 35.Huang W, et al. 3D NiO hollow sphere/reduced graphene oxide composite for high-performance glucose biosensor. Sci. Rep. 2017;7:5220. doi: 10.1038/s41598-017-05528-1. [DOI] [PMC free article] [PubMed] [Google Scholar]
- 36.Wang G, et al. Free-standing nickel oxide nanoflake arrays: Synthesis and application for highly sensitive non-enzymatic glucose sensors. Nanoscale. 2012;4:3123–3127. doi: 10.1039/c2nr30302g. [DOI] [PubMed] [Google Scholar]
- 37.Zeng G, Li W, Ci S, Jia J, Wen Z. Highly dispersed NiO nanoparticles decorating graphene nanosheets for non-enzymatic glucose sensor and biofuel cell. Sci. Rep. 2016;6:36454. doi: 10.1038/srep36454. [DOI] [PMC free article] [PubMed] [Google Scholar]
- 38.Zhang W-D, Chen J, Jiang L-C, Yu Y-X, Zhang J-Q. A highly sensitive nonenzymatic glucose sensor based on NiO-modified multi-walled carbon nanotubes. Microchim. Acta. 2010;168:259–265. doi: 10.1007/s00604-010-0288-2. [DOI] [Google Scholar]
- 39.Zhang X, et al. Nonenzymatic glucose sensor based on in situ reduction of Ni/NiO-graphene nanocomposite. Sensors. 2016;16:1791. doi: 10.3390/s16111791. [DOI] [PMC free article] [PubMed] [Google Scholar]
- 40.Marini S, et al. Non-enzymatic glucose sensor based on nickel/carbon composite. Electroanalysis. 2018;30:727–733. doi: 10.1002/elan.201700687. [DOI] [Google Scholar]
- 41.Suzuki N, et al. Engineered glucose oxidase capable of quasi-direct electron transfer after a quick-and-easy modification with a mediator. Int. J. Mol. Sci. 2020;21:1137. doi: 10.3390/ijms21031137. [DOI] [PMC free article] [PubMed] [Google Scholar]
- 42.Zhang H-J, Wang Y-K, Kong L-B. A facile strategy for the synthesis of three-dimensional heterostructure self-assembled MoSe2 nanosheets and their application as an anode for high-energy lithium-ion hybrid capacitors. Nanoscale. 2019;11:7263–7276. doi: 10.1039/C9NR00164F. [DOI] [PubMed] [Google Scholar]
- 43.Dong C, et al. Porous NiO nanosheets self-grown on alumina tube using a novel flash synthesis and their gas sensing properties. RSC Adv. 2015;5:4880–4885. doi: 10.1039/C4RA13025A. [DOI] [Google Scholar]
- 44.Balasingam SK, Lee JS, Jun Y. Few-layered MoSe2 nanosheets as an advanced electrode material for supercapacitors. Dalt. Trans. 2015;44:15491–15498. doi: 10.1039/C5DT01985K. [DOI] [PubMed] [Google Scholar]
- 45.Wang J, et al. Preparation of high aspect ratio nickel oxide nanowires and their gas sensing devices with fast response and high sensitivity. J. Mater. Chem. 2012;22:8327–8335. doi: 10.1039/c2jm16934g. [DOI] [Google Scholar]
- 46.Sakthivel M, Ramaraj S, Chen S-M, Chen T-W, Ho K-C. Transition-metal-doped molybdenum diselenides with defects and abundant active sites for efficient performances of enzymatic biofuel cell and supercapacitor applications. ACS Appl. Mater. Interfaces. 2019;11:18483–18493. doi: 10.1021/acsami.9b04884. [DOI] [PubMed] [Google Scholar]
- 47.Wang H, et al. In situ growth of NiO nanoparticles on carbon paper as a cathode for rechargeable Li–O2 batteries. RSC Adv. 2017;7:23328–23333. doi: 10.1039/C7RA02932B. [DOI] [Google Scholar]
- 48.Agudosi ES, et al. Fabrication of 3D binder-free graphene NiO electrode for highly stable supercapattery. Sci. Rep. 2020;10:11214. doi: 10.1038/s41598-020-68067-2. [DOI] [PMC free article] [PubMed] [Google Scholar]
- 49.Ibrahim AA, et al. Highly sensitive and selective non-enzymatic monosaccharide and disaccharide sugar sensing based on carbon paste electrodes modified with perforated NiO nanosheets. New J. Chem. 2018;42:964–973. doi: 10.1039/C7NJ03253F. [DOI] [Google Scholar]
- 50.Ahmad R, et al. Highly efficient non-enzymatic glucose sensor based on CuO modified vertically-grown ZnO nanorods on electrode. Sci. Rep. 2017;7:5715. doi: 10.1038/s41598-017-06064-8. [DOI] [PMC free article] [PubMed] [Google Scholar]
- 51.Guo C, Wang Y, Zhao Y, Xu C. Non-enzymatic glucose sensor based on three dimensional nickel oxide for enhanced sensitivity. Anal. Methods. 2013;5:1644–1647. doi: 10.1039/c3ay00067b. [DOI] [Google Scholar]
- 52.Wang L, Fu J, Hou H, Song Y. A facile strategy to prepare Cu2O/Cu electrode as a sensitive enzyme-free glucose sensor. Int. J. Electrochem. Sci. 2012;7:12587–12600. [Google Scholar]
- 53.Li C, Wang H, Yamauchi Y. Electrochemical deposition of mesoporous Pt–Au alloy films in aqueous surfactant solutions: towards a highly sensitive amperometric glucose sensor. Chem. Eur. J. 2013;19:2242–2246. doi: 10.1002/chem.201203378. [DOI] [PubMed] [Google Scholar]
- 54.Wang X, et al. Synthesis of CuO nanostructures and their application for nonenzymatic glucose sensing. Sensors Actuators B Chem. 2010;144:220–225. doi: 10.1016/j.snb.2009.09.067. [DOI] [Google Scholar]
- 55.Joo S, Park S, Chung TD, Kim HC. Integration of a nanoporous platinum thin film into a microfluidic system for non-enzymatic electrochemical glucose sensing. Anal. Sci. 2007;23:277–281. doi: 10.2116/analsci.23.277. [DOI] [PubMed] [Google Scholar]
- 56.Huang T-K, et al. Glucose sensing by electrochemically grown copper nanobelt electrode. J. Electroanal. Chem. 2009;636:123–127. doi: 10.1016/j.jelechem.2009.08.011. [DOI] [Google Scholar]
- 57.Jeevanandham G, et al. Nickel oxide decorated MoS2 nanosheet-based non-enzymatic sensor for the selective detection of glucose. RSC Adv. 2020;10:643–654. doi: 10.1039/C9RA09318D. [DOI] [PMC free article] [PubMed] [Google Scholar]
- 58.Bagheri S, et al. Carbon-based nanobiohybrid thin film for amperometric glucose sensing. ACS Biomater. Sci. Eng. 2017;3:2059–2063. doi: 10.1021/acsbiomaterials.7b00325. [DOI] [PubMed] [Google Scholar]
- 59.Mishra AK, et al. Au nanoparticles modified CuO nanowire electrode based non-enzymatic glucose detection with improved linearity. Sci. Rep. 2020;10:17669. doi: 10.1038/s41598-020-74222-6. [DOI] [PMC free article] [PubMed] [Google Scholar]
- 60.Le Dang TT, Tonezzer M. Polycrystalline NiO nanowires: scalable growth and ethanol sensing. Proc. Eng. 2015;120:427–434. doi: 10.1016/j.proeng.2015.08.658. [DOI] [Google Scholar]
Associated Data
This section collects any data citations, data availability statements, or supplementary materials included in this article.


