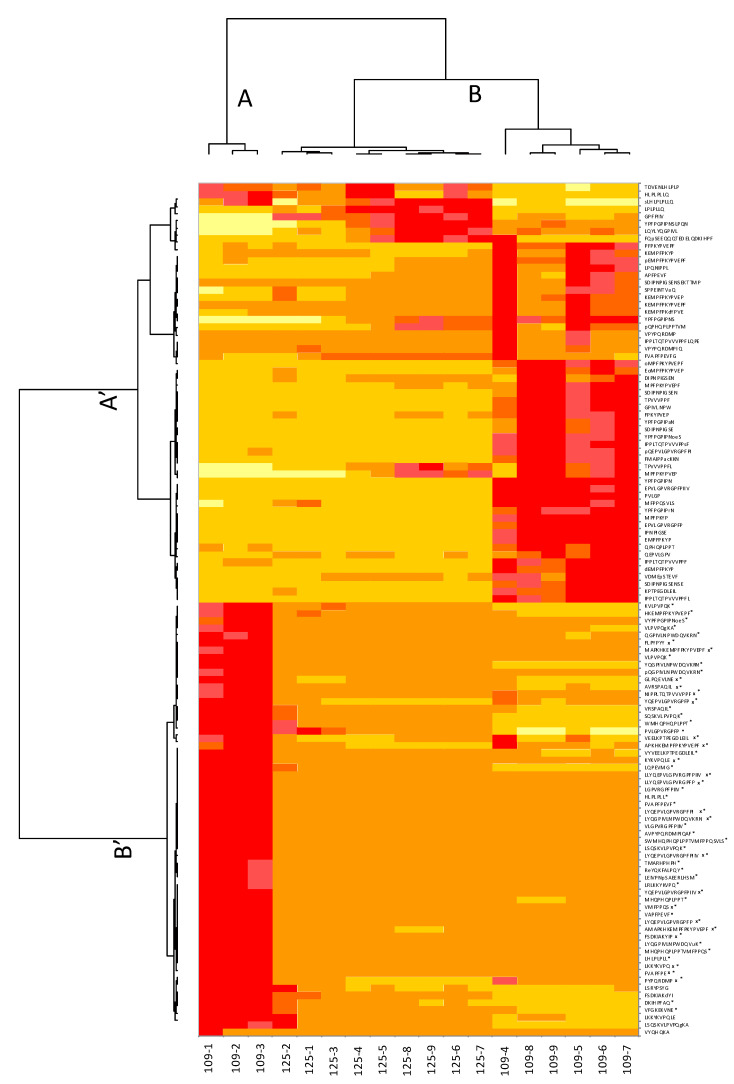
Figure 4.
Heat map related to mass spectrometry data. The peptides marked with * correspond to the peptides that explain the significant difference between the two groups of hydrolysates obtained with the differential analysis (p ≤ 0.05). Peptides marked with an “x” are the peptides identified through random forests as the most influential in explaining the bitterness of hydrolysates.

