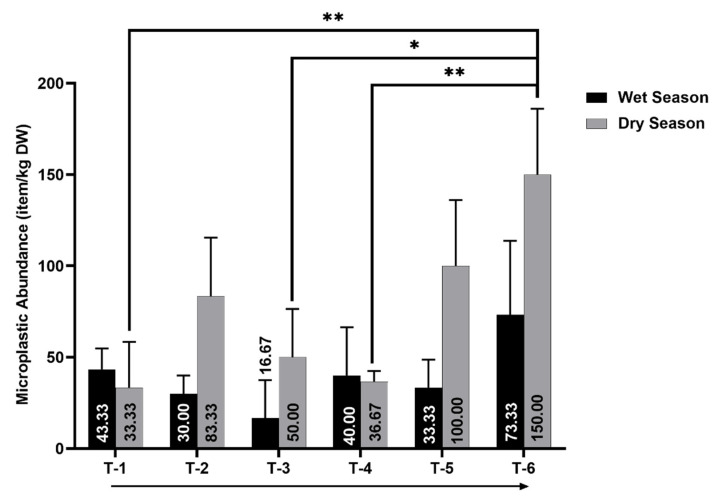
Figure 4.
Microplastic abundance in sediment from Tallo River. The arrows below the graph indicate the position of every site from the upstream to the downstream part of the river. The error bar indicates standard deviation (n = 3). The asterisk (*) indicates the significant difference between the sites based on a one-way ANOVA (p < 0.05). The double asterisks (**) indicate the higher significant difference between the sites (p < 0.01).

