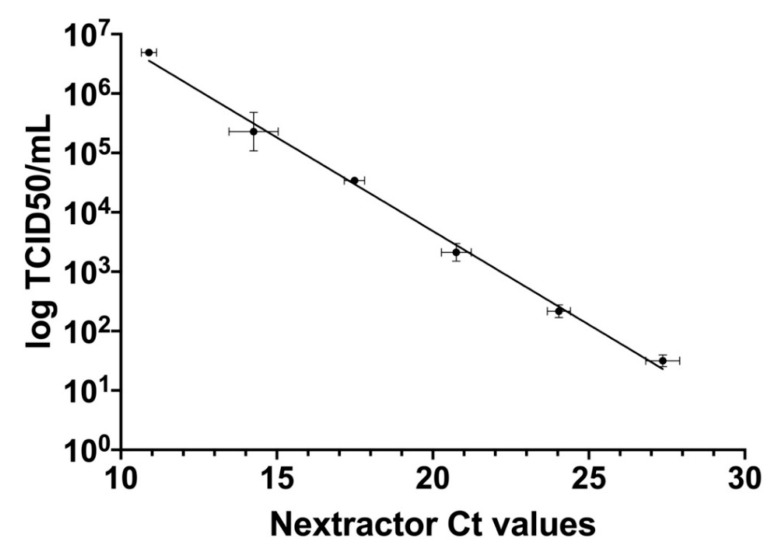
Figure 5.
Correlation between TCID50/mL results (on a log10 scale) from titration on Vero E6 cells with the Reed and Muench method and Ct values derived from qRT-PCR with preliminary RNA extraction (Nextractor). Ct values are presented as the mean of six replicates for each dilution ± SE, whereas TCID50/mL values are presented as the mean of the two different methods (Reed and Muench and Karber) of two replicates for each dilution ± SE.

