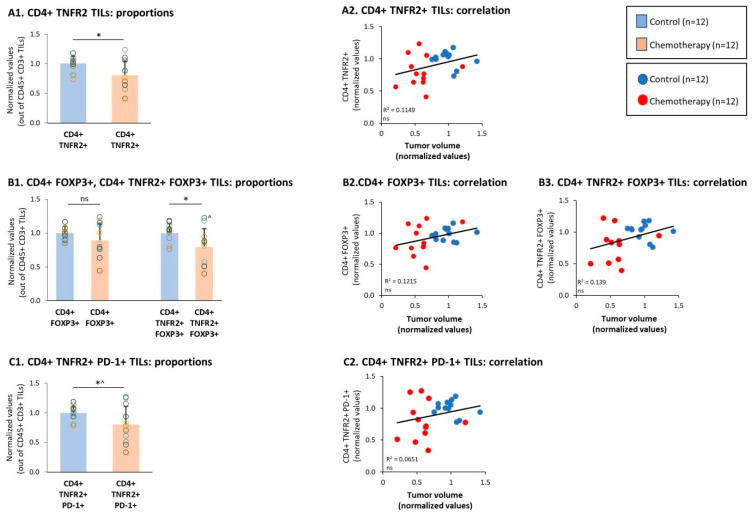
Figure 4.
Chemotherapy reduced the proportions of CD4+ TNFR2+ FOXP3+ and CD4+ TNFR2+ PD-1+ TILs. Murine 4T1 TNBC cells were syngrafted to BALB/c mice in the presence of chemotherapy or a vehicle control; procedures and analyses were performed as described in Figure 3. (A) CD4+ TNFR2+ TILs, gated out of CD45+ CD3+ cells. (A1) Proportions of CD4+ TNFR2+ TILs. (A2) CD4+ TNFR2+ TILs, correlated with tumor volumes. (B) CD4+ FOXP3+ and CD4+ TNFR2+ FOXP3+ TILs, gated out of the CD45+ CD3+ cells. (B1) Proportions of CD4+ FOXP3+ and CD4+ TNFR2+ FOXP3+ TILs. (B2, B3) CD4+ FOXP3+ and CD4+ TNFR2+ FOXP3+ TILs, respectively, correlated with tumor volumes. In B1: ^ n = 11. (C) CD4+ TNFR2+ PD-1+ TILs, gated out of CD45+ CD3+ cells. (C1) Proportions of CD4+ TNFR2+ PD-1+ TILs. (C2) CD4+ TNFR2+ PD-1+ TILs, correlated with tumor volumes. In the proportion and correlation analyses, the average value of the vehicle-treated group in each biological repeat was given the value of 1 and the values of all mice analyzed in that repeat were normalized accordingly. The value of each mouse is presented as a dot. * p < 0.05 (in C1: ^ p = 0.0505), ns: not significant (two-tailed unpaired Student’s t-test; correlation analyses: Pearson; T.DIST).

