

Abstract
Many point-of-care (POC) analyzers are available for the measurement of electrolytes and acid-base status in animals. We assessed the precision of the i-STAT Alinity v, a recently introduced POC analyzer, and compared it to 2 commonly used and previously validated POC analyzers (i-STAT 1, Stat Profile pHOx Ultra). Precision was evaluated by performing multiple analyses of whole blood samples from healthy dogs, cats, and horses on multiple i-STAT Alinity v analyzers. For comparison between analyzers, whole blood samples from dogs and cats presented to the emergency room were run concurrently on all 3 POC instruments. Reported values were compared by species (dogs and cats only) using Pearson correlation, and all values from all species were analyzed together for the Bland–Altman analysis. Results suggested that the i-STAT Alinity v precision was very good, with median coefficients of variability <2.5% for all measured parameters (except the anion gap), with variable ranges of coefficients of variation. In addition, good-to-excellent correlation was observed between the i-STAT Alinity v and i-STAT 1, and between the i-STAT Alinity v and Stat Profile pHOx Ultra for all parameters in both cats and dogs, respectively. In this cohort, the i-STAT Alinity v had clinically acceptable bias compared to the currently marketed analyzers and can be used for monitoring measured analytes in cats and dogs, although serial measurements in a single animal should be performed on the same analyzer whenever possible.
Keywords: blood gas, cats, dogs, electrolytes, emergency, point-of-care.
There are many point-of-care (POC) blood-gas and electrolyte analyzers available for veterinary use today. These analyzers are often used for obtaining quick and accurate results in both emergency and clinical field settings. They vary in size, cost, and sample volume requirement, and feature either cartridge-based or wet chemistry–based technology. In general, the cartridge-based analyzers have quality control (QC) at the level of the cartridge production, whereas the wet analyzers require periodic calibration that assesses linearity and accuracy to a standard analyte mixture.1,18 Other possible benefits of the cartridge-based systems are a smaller benchtop footprint, a decreased need for skilled laboratory personnel, and instrument portability.
There are many devices specifically marketed for veterinary use. Most require heparinized whole blood for analysis, and many can also perform specific measurements on serum, plasma, and bodily fluids (e.g., urine, effusions). Most available veterinary devices measure electrolyte concentrations by direct ion-selective electrode (ISE) potentiometry, considered the gold standard for these measurements.4,11 Dissolved gases (oxygen and carbon dioxide) are measured using amperometry and direct potentiometry. 4 Other blood-gas parameters (e.g., bicarbonate concentration) are calculated using standard algorithms. 18
Two commonly used devices in the veterinary market are the cartridge-based i-STAT 1 (Abbott Point of Care) and the wet chemistry Stat Profile pHOx Ultra (Nova Biomedical). These instruments have been validated for use in various species, and provide similar test menus including blood-gas, blood electrolyte (sodium [Na+], potassium [K+], chloride [Cl−], ionized calcium [iCa2+]) concentrations, and blood glucose, lactate, urea nitrogen (BUN), and creatinine concentrations.6,8,18–20 Although these instruments both use ISE measurement technology and amperometry, algorithmic and other qualities can result in variability in reported parameters between instruments.
A newer model of the i-STAT 1, the i-STAT Alinity v (Abbott Point of Care), has been introduced to the veterinary market. Although the newer i-STAT Alinity v uses the same cartridges as the i-STAT 1, it has not been prospectively evaluated for use in veterinary species; therefore, we evaluated the i-STAT Alinity v for precision. Because these instruments are commonly used in the veterinary emergency room and intensive care unit setting, we also compared the 3 instruments (i-STAT 1, i-STAT Alinity v, Stat Profile pHOx Ultra) in their measurement of common blood-gas and electrolyte concentrations in dogs, cats, and horses presented to an emergency facility. We hypothesized that the i-STAT Alinity v would show acceptable precision and that the comparison with other instruments would demonstrate slight numeric differences in measured concentrations, but that these differences would be clinically insignificant.
Materials and methods
Analyzers
Testing occurred on a single Stat Profile pHOx Ultra, which performed QC measurements and self-calibrated every 8 h, and which was routinely serviced by dedicated members of a clinical pathology laboratory. Two different i-STAT 1 analyzers and 4 different i-STAT Alinity v analyzers were used for the duration of our study. Following precision testing on the 4 i-STAT Alinity v analyzers, 2 of the analyzers were used for sample comparison at any given time but were rotated among the 4 that were available for testing, so that each analyzer had a similar number of clinical samples analyzed. All i-STAT instruments had quality assessment verified using QC material (control solutions) 7 every 2 wk during the study period, and daily during precision testing (see precision testing immediately below; detailed QC data not shown). For all client-owned animals, written, informed consent was obtained prior to collecting blood for our study. The protocol was approved by the University of Georgia Clinical Research Committee (CR-527).
Study design
Precision testing
Four i-STAT Alinity v analyzers were used for this portion of the study. Three levels of QC material (i-STAT level 1, 2, and 3; Abbott Point of Care) were run on these instruments daily prior to any blood measurements, to verify calibration. Precision of the machines regarding day-to-day measures of the calibrator solutions was not recorded; however, no machines tested outside of the recommended range during the study period. Precision was determined using heparinized venous blood samples from 20 dogs (70 individual samples), 5 horses (28 samples), 8 cats (36 samples), and 1 cow (2 samples). Two different cartridges were evaluated concurrently, in duplicate or quadruplicate, depending on the volume of blood available: the CG4+ cartridge (measures pH, partial pressure of carbon dioxide [PCO2], partial pressure of oxygen [PO2], and blood lactate concentration, and calculates bicarbonate concentration [HCO3-], base excess [BE], hemoglobin oxygen saturation [SO2], and total CO2 [TCO2]) and the CHEM8+ cartridge (measures Na+, K+, Cl−, iCa2+, creatinine, urea [blood urea nitrogen, BUN], glucose, hematocrit [Hct], and TCO2, and calculates hemoglobin concentration [Hb]). The analysis was run on 4 i-STAT Alinity v analyzers, 2 of which were dedicated for analysis of 1 specific cartridge type per day. On subsequent days, the 2 analyzers selected for 1 cartridge type would be used for analysis of the other cartridge type and would alternate back and forth for each day of analysis. Analysis was completed over 20 d, using cartridges that were all from the same manufactured lot.
Comparison of analyzers
From September 2018 to May 2019, 54 dogs, 22 cats, and 7 horses that had been presented for emergent evaluation at the University of Georgia Veterinary Medical Center (Athens, GA, USA) were prospectively enrolled in our study. Peripheral venous or arterial blood was collected by direct venipuncture and placed in lithium heparin tubes (BD) for venous samples, or directly into a heparinized syringe (Portex; Smiths Medical) for arterial samples. Using heparinized whole blood, samples were run concurrently on the i-STAT 1, the i-STAT Alinity v (using both CHEM8+ and CG4+ cartridges on each, run on separate analyzers concurrently), and the Stat Profile pHOx Ultra. Samples were run within 5 min of collection, and analyses were started on each analyzer within 15 s of one another. Samples were not exposed to air during the time that cartridges were being filled. The first sample was run on either the i-STATs or the pHOx Ultra depending on the day of the week (the i-STAT samples were started first on even days). Measurements for all reported values were recorded in a commercial spreadsheet (Excel; Microsoft). No temperature correction was applied for blood-gas values; hence all reported values were analyzed for a patient temperature of 37°C.
Statistical analysis
The data collected from the precision study were analyzed using JMP v.15.1.0 (SAS). For precision data, coefficients of variability (CVs) were calculated for replicates from each animal (n = 2 or n = 4) as the mean value divided by the standard deviation, expressed as a percent. For the comparison between the i-STAT Alinity v and the Stat Profile pHOx Ultra, reported values were compared by species (dogs and cats only) using the Pearson correlation, and all values from all species were blended together for the Bland–Altman analysis. Bland–Altman analysis was not performed to compare the i-STAT 1 and i-STAT Alinity v. Pearson correlation coefficients ≥0.97 were considered excellent, with 0.95–0.969 considered very good, 0.93–0.949 considered good, and 0.91–0.929 considered fair. Regarding the bias (mean of the differences between methods) calculated in the Bland–Altman analyses, a bias of <10% between instruments was arbitrarily considered to be a target, accepting that clinically relevant differences vary not only with the reference interval (RI), but also with inter-individual variability in the measured analyte. 17
Results
For the within-device precision study of the i-STAT Alinity v, 116 samples were available; 19 animals had 4 replicates available for comparison, and 15 animals had duplicate measurements. Given the time sensitivity of blood-gas measurement, each animal had an individual CV calculated (Table 1). Some individual animals showed a high CV for specific analytes, increasing the maximum CV, although the median and 75% quartile for all analytes was <10%. There was no correlation between Hct CV and high CV in other analytes (data not shown). Given that this analyzer is recommended for use in all studied species, the species were combined for the precision summary.
Table 1.
Precision analysis for the i-STAT Alinity v analyzer using the i-STAT CHEM8+ and CG4+ cartridges and blood samples drawn from dogs, cats, and horses. The median coefficient of variation (CV), 25% and 75% quartiles, and the minimum and maximum CV are shown for 110 replicate measures of blood samples from 34 animals.
| CV (%) | Range (min.–max.) | |||||
|---|---|---|---|---|---|---|
| Median | 25% quartile | 75% quartile | Minimum | Maximum | ||
| Na+ | 0.35 | 0 | 0.47 | 0 | 0.58 | 126–152 mmol/L |
| K+ | 0 | 0 | 0 | 0 | 2.19 | 2.6–6.4 mmol/L |
| Cl− | 0.63 | 0.48 | 1.13 | 0 | 1.76 | 84–129 mmol/L |
| TCO2 | 2.25 | 0 | 4.01 | 0 | 10.18 | 9–32 mmol/L |
| BUN | 0 | 0 | 2.78 | 0 | 8 | 2.14–22.5 mmol/L |
| Creatinine | 0 | 0 | 6.56 | 0 | 20 | 17.7–194 μmol/L |
| Glucose | 1.29 | 0.67 | 1.86 | 0 | 8.08 | 1.61–6.6 mmol/L |
| iCa2+ | 1.09 | 0.50 | 2.13 | 0 | 4.48 | 0.55–1.63 mmol/L |
| Anion gap* | 6.28 | 4.29 | 9.15 | 0 | 17.0 | 8–23 mmol/L |
| Hematocrit | 1.75 | 0 | 5.17 | 0 | 24.70 | 0.22–0.65 L/L |
| pH | 0.09 | 0.07 | 0.13 | 0.01 | 1.08 | 6.90–7.50 |
| PCO2 | 1.93 | 1.17 | 4.07 | 0 | 21.24 | 2.45–14.0 kPa |
| PO2 | 1.70 | 0.78 | 5.16 | 0 | 16.3 | 4.52–31.5 kPa |
| HCO3−* | 1.30 | 0.86 | 2.87 | 0 | 8.72 | 8.4–33.9 mmol/L |
| SO2* | 0 | 0 | 0.44 | 0 | 1.05 | 38–100 |
| TCO2* | 2.06 | 0 | 4.81 | 0 | 11.36 | 9–36 mmol/L |
| Base excess* | 0 | 0 | 10.88 | 0 | 27.22 | −21 to 8 |
| Lactate | 1.19 | 0.83 | 2.35 | 0.11 | 4.79 | 0.59–16.3 mmol/L |
All analytes are measured directly, except those marked by an asterisk (*), which are calculated by the machine (TCO2 is directly measured by the CHEM8+ cartridge and calculated by the CG4+ cartridge). Base excess was calculated using absolute values to account for negative values. See text for explanation of abbreviations.
Between the i-STAT Alinity v and i-STAT 1, all directly measured parameters had excellent to very good correlations, ≥0.97 for dogs and 0.96 for cats (Table 1). Between the i-STAT Alinity v and Stat Profile pHOx Ultra, all measured parameters had excellent to very good correlations (r ≥ 0.95) for both dogs and cats, with the exceptions of Cl−, iCa2+, and Na+ in cats, and TCO2 in both cats and dogs (good correlation; Table 2). Calculated parameters (Hb, TCO2, HCO3-, BE) had good to very good correlations in dogs and excellent correlation in cats between the i-STAT Alinity v and the i-STAT 1, as well as between the i-STAT Alinity v and the STAT Profile pHOx Ultra (Table 3). Given the small numbers, separate correlations were not calculated for horses in either comparison, although the values were used as part of the datasets for the Bland–Altman analysis.
Table 2.
Pearson correlations for analytes measured on the i-STAT Alinity v (CHEM8+ and CG4+ cartridges) compared to the i-STAT 1 (same cartridges) and the Stat Profile pHOx Ultra in dogs and cats. TCO2 is measured directly by the CHEM8+ cartridge and displayed here.
| i-STAT 1 | pHOx Ultra | |||||||
|---|---|---|---|---|---|---|---|---|
| Correlation coefficient (canine) | n | Correlation coefficient (feline) | n | Correlation coefficient (canine) | n | Correlation coefficient (feline) | n | |
| BUN | 1.00 | 45 | 1.00 | 20 | 0.99 | 45 | 0.97 | 20 |
| Cl- | 0.99 | 46 | 0.99 | 22 | 0.95 | 46 | 0.94 | 22 |
| Creatinine | 1.00 | 46 | 1.00 | 22 | 0.96 | 46 | 0.99 | 22 |
| Glucose | 1.00 | 47 | 1.00 | 20 | 0.98 | 47 | 0.98 | 20 |
| Hematocrit | 0.98 | 45 | 0.99 | 21 | 0.96 | 45 | 0.98 | 21 |
| iCa2+ | 0.99 | 47 | 0.99 | 22 | 0.95 | 47 | 0.94 | 22 |
| K+ | 1.00 | 47 | 0.99 | 22 | 0.99 | 47 | 0.99 | 22 |
| Na+ | 1.00 | 47 | 0.99 | 22 | 0.96 | 47 | 0.93 | 22 |
| Lactate | 0.99 | 53 | 1.00 | 19 | 0.99 | 53 | 0.98 | 19 |
| TCO2 | 0.92 | 47 | 0.89 | 22 | 0.93 | 47 | 0.94 | 22 |
| PCO2 | 0.99 | 54 | 0.98 | 20 | 0.98 | 54 | 0.97 | 20 |
| pH | 0.99 | 54 | 1.00 | 20 | 0.98 | 54 | 0.99 | 20 |
| PO2 | 1.00 | 53 | 0.99 | 20 | 0.99 | 53 | 0.99 | 20 |
| SO2 | 0.98 | 52 | 0.96 | 20 | 0.99 | 52 | 0.95 | 20 |
See text for explanation of abbreviations.
Table 3.
Pearson correlation coefficients between analytes calculated by the i-STAT Alinity v and the iSTAT 1 (same cartridges) and the Stat Profile pHOx Ultra in dogs and cats. Total CO2 (TCO2) is calculated by the CG4+ cartridge and is included here.
| i-STAT 1 | pHOx Ultra | |||||||
|---|---|---|---|---|---|---|---|---|
| Correlation coefficient (canine) | n | Correlation coefficient (feline) | n | Correlation coefficient (canine) | n | Correlation coefficient (feline) | n | |
| Hb | 0.98 | 45 | 0.99 | 21 | 0.96 | 45 | 0.98 | 21 |
| Base excess | 0.99 | 54 | 0.99 | 20 | 0.95 | 54 | 0.99 | 20 |
| HCO3− | 0.97 | 54 | 0.99 | 20 | 0.94 | 54 | 0.98 | 20 |
| TCO2 | 1.00 | 53 | 0.99 | 20 | 0.94 | 53 | 0.98 | 20 |
See text for explanation of abbreviations.
Bland–Altman analysis of data comparing the i-STAT Alinity v with the Stat Profile pHOx Ultra indicated clinically acceptable mean bias and 95% confidence interval (CI) for the majority of parameters (Table 4). Three parameters exceeded the 10% arbitrary bias cutoff (PCO2, PO2, urea), but values contained within the 95% CIs were not deemed to be clinically relevant differences, with the exception of PO2. The bias for blood glucose was 9.1%, corresponding to 0.63 mmol/L (11.31 mg/dL), with a 95% CI of 0.49−0.76 mmol/L (8.87−13.74 mg/dL). Given potential concerns that this might affect certain clinical decisions at lower blood glucose values (with the analyzer returning a blood glucose concentration that was higher than the true blood glucose concentration), the data analysis was repeated looking at only values <6.66 mmol/L (120 mg/dL; Fig. 1). At lower concentrations, a positive bias was still present, but was slightly lower, at 8.5%, corresponding to 7.76 mg/dL with a 95% CI of 0.34−0.53 mmol/L (6.04−9.48 mg/dL). Likewise, the PO2 data between the 2 instruments showed a bias of −10.1%, corresponding to a measured value of −1.45 kPa (−10.91 mmHg), with a 95% CI of −1.77 to −1.13 kPa (−13.33 to −8.50 mmHg). When this comparison was run on PO2 values <6.66 kPa, the bias remained the same (−10.2%; Fig. 2).
Table 4.
Summary of Bland–Altman comparison for the i-STAT Alinity v using the CHEM8+ (Na+, K+, Cl-, TCO2, BUN, creatinine, glucose, iCa2+, anion gap, hematocrit) and CG4+ cartridges (remainder) versus the Stat Profile pHOx Ultra in dogs, cats, and horses. The bias and 95% confidence interval (CI) of the bias are listed, and all species are combined for this analysis.
| Bias, SI units and percent | Bias, conventional units | |||||||
|---|---|---|---|---|---|---|---|---|
| Test (unit) | Bias (%) | Bias (test units) | 95% CI (test units) | Tested range (min.–max.) | Test (unit) | Bias (test units) | 95% CI (test units) | Tested range (min.–max.) |
| Na+ (mmol/L) | 0.7 | −1.01 | −1.45 to −0.57 | 125–174 | Na+ (mEq/L) | −1.01 | −1.45 to −0.57 | 125–174 |
| K+ (mmol/L) | 5.3 | −0.21 | −0.23 to −0.19 | 2–7.1 | K+ (mEq/L) | −0.21 | −0.23 to −0.19 | 2–7.1 |
| Cl− (mmol/L) | −0.6 | 1.0 | 0.07–1.94 | 84–139 | Cl− (mEq/L) | 1.00 | 0.067–1.94 | 84–139 |
| TCO2 (mmol/L) | −8.9 | 1.66 | 1.21–2.11 | 8.7–30 | TCO2 (mmol/L) | 1.66 | 1.21–2.11 | 8.7–30 |
| BUN (mmol/L) | −16.5 | 1.60 | 1.18–2.01 | 2.14–43.55 | BUN (mg/dL) | 4.48 | 3.32–5.64 | 6–122 |
| Creatinine (µmol/L) | 8.9 | −14.03 | −27.63 to −0.43 | 35.36–1280 | Creatinine (mg/dL) | −0.18 | −0.36 to −0.01 | 0.46–16.8 |
| Glucose (mmol/L) | 9.1 | 0.63 | 0.49–0.76 | 1.67–22.7 | Glucose (mg/dL) | 11.31 | 8.87–13.75 | 30–410 |
| Glucose* (mmol/L) | 8.5 | 0.43 | 0.34–0.53 | 1.67–6.66 | Glucose* (mg/dL) | 7.76 | 6.04–9.48 | 30–120 |
| iCa2+ (mmol/L) | 1.7 | −0.01 | −0.02 to 0.002 | 0.12–0.45 | iCa2+ (mEq/L) | −0.02 | −0.03 to 0.003 | 0.47–1.78 |
| Anion gap (mmol/L) | 4.9 | −0.47 | −1.97 to 1.03 | 5–28 | Anion gap (mEq/L) | −0.47 | −1.97 to 1.03 | 5–28 |
| Hematocrit (L/L) | 4.9 | −1.44 | −2.03 to −0.84 | 0.15–0.68 | Hematocrit (%) | −1.44 | −2.03 to −0.84 | 15–68 |
| Hemoglobin (g/L) | 2.9 | −1.96 | −4.14 to 0.22 | 50–231 | Hemoglobin (g/dL) | −0.20 | −0.41 to 0.02 | 5.0–23.1 |
| pH | 0.29 | −0.02 | −0.03 to −0.02 | 7.08–7.62 | pH | −0.02 | −0.03 to −0.02 | 7.08–7.62 |
| PCO2 (kPa) | −13.63 | 0.60 | 0.53–0.67 | 2.1–13.58 | PCO2 (mmHg) | 4.50 | 3.98–5.02 | 15.8–102 |
| PO2 (kPa) | 10.09 | −1.45 | −1.77 to −0.09 | 3.86–71.2 | PO2 (mmHg) | −10.91 | −13.33 to −8.50 | 29–536 |
| PO2* (mmHg) | 10.23 | −0.99 | −0.76 to −1.23 | 3.86–15.9 | PO2* (mmHg) | −7.48 | −5.72 to −9.22 | 29–120 |
| HCO3− (mmol/L) | −7.93 | 1.51 | 1.02–2.0 | 7.2–34.4 | HCO3− (mEq/L) | 1.51 | 1.02–2.00 | 7.2–34.4 |
| Base excess (mmol/L) | 3.47 | 1.28 | 0.68–1.88 | −21 to 11 | Base excess (mEq/L) | 1.28 | 0.68–1.88 | −21 to 11 |
| SO2 (%) | 2.93 | −2.23 | −3.15 to −1.30 | 42–100 | SO2 (%) | −2.23 | −3.15 to −1.30 | 42–100 |
| TCO2 (mmol/L) | −8.0 | 1.60 | 1.10–2.11 | 8–37 | TCO2 (mEq/L) | 1.60 | 1.10–2.11 | 8–37 |
| Lactate (mmol/L) | 4.77 | 0.01 | −0.09 to 0.11 | 0.3–19.6 | Lactate (mg/dL) | 0.1 | −0.82 to 1.02 | 2.7–177 |
Analytes indicated with an asterisk (*) underwent analysis limited to values <6.66 mmol/L (glucose) or 16.0 kPa (PO2). See text for explanation of abbreviations.
Figure 1.
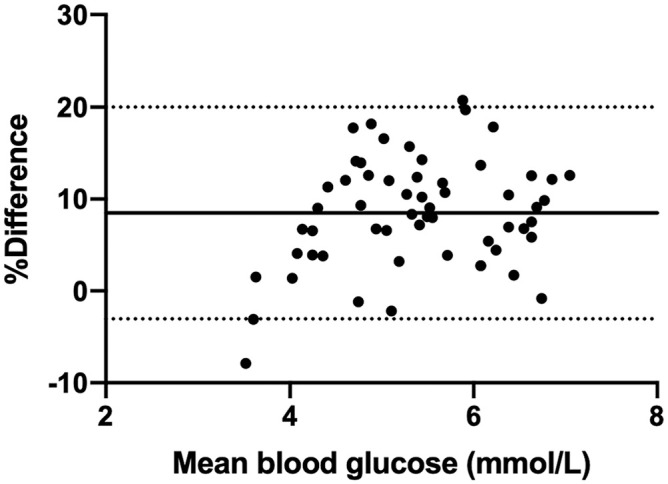
Bland–Altman analysis of glucose concentration, compared between 2 point-of-care analyzers, for all values <6.66 mmol/L (120 mg/dL). The x-axis indicates the mean value for glucose (mmol/L), and the y-axis displays the percent difference in results between the i-STAT Alinity v and Stat Profile pHOx Ultra. The solid line represents the bias (8.48%), and the dashed lines represent the 95% confidence interval of the bias (–3.04% to 8.49%).
Figure 2.
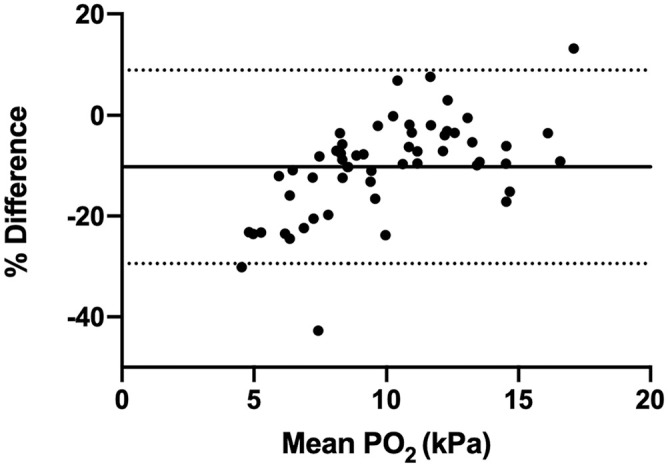
Bland–Altman analysis of oxygen concentration, for values <16.0 kPa (120 mmHg). The x-axis indicates the mean value for partial pressure of oxygen (PO2, kPa), and the y-axis display the difference in results between the i-STAT Alinity v and Stat Profile pHOx Ultra. The solid line represents the bias (–10.2%), and the dashed lines represent the 95% confidence interval of the bias (–29.4% to 9.0%).
Discussion
Overall, the high correlation combined with the small, clinically acceptable bias between these POC instruments suggested satisfactory agreement for measurement of the studied analytes in both cats and dogs. The i-STAT 1 and i-STAT Alinity v had excellent correlations for all variables, which was anticipated given the similarities in the analyzers and the cartridges used. The i-STAT Alinity v, when compared to the Stat Profile pHOx Ultra for measured analytes, showed very good to excellent correlations for all but TCO2, and Cl-, iCa2+, and Na+ in feline samples. Calculated analytes showed slightly lower correlations but were still assessed to be good or excellent. Within-device precision was considered to be clinically acceptable, with the median CV for all analytes ≤2.5%, despite some outlier values.
Although correlations were generally excellent between the Stat Profile pHOx Ultra and the i-STAT Alinity v, the Bland–Altman analysis indicated that there was a bias between the 2 instruments for many analytes. For this reason, we recommend that the same instrument be used for serial measurements of clinical patients, especially if the measured values are outside the normal RI. If it is not possible to use the same system for serial measurements, the data presented here will allow the clinician to approximate the degree of deviation from the expected value. The majority of samples assessed in our study were within the RIs for electrolyte measurements, and Bland–Altman analysis for some analytes with a greater number of abnormal values may result in more predictive nomograms for assessment. The bias for BUN was higher than expected and higher than the preferred cutoff of 10%. A relatively small number of samples with high BUN concentrations accounted for the reported bias, but it is unlikely that this variability would impact clinical decision-making because the high BUN concentration was already well above the RI.
When considering the bias between the i-STAT Alinity v and the Stat Profile pHOx Ultra, the impact of differential values on clinical decision-making was considered. In general, the bias between the 2 machines was minimal; however, for blood glucose concentration and PO2, the bias was potentially enough to be clinically relevant at values below the RI. For this reason, Bland–Altman analysis was repeated, focusing only on the samples that were within the Stat Profile pHOx Ultra RI and lower. Optimally, a gold standard measure would have been used to determine the true bias of both machines, and to allow further analysis, such as Clarke or consensus error grid analysis.3,9 The i-STAT Alinity v had a positive bias (read higher) for glucose concentration compared to the Stat Profile pHOx Ultra in total, but at lower individual values (<3.33 mmol/L [60 mg/dL]) the bias approached zero (i.e., the 2 were more similar at lower values). In the analysis evaluating the subset of blood glucose <6.66 mmol/L, bias was slightly improved (from 9.1% to 8.5%), but, unfortunately, few samples were acquired that had blood glucose concentrations <3.33 mmol/L, limiting the possible conclusions that can be drawn. In contrast, the PO2 had a negative bias (i-STAT Alinity v generally read lower than Stat Profile pHOx Ultra), and at PO2 concentrations <10.6 kPa (80 mmHg), the bias seemed to be consistent. We acknowledge these differences in measurement, but without a gold standard measure, cannot advocate for one analyzer over the other in this context.
Both instruments provided results within 2 min of sample introduction, and both use small amounts of blood (0.25 mL for the Stat Profile pHOx Ultra, 0.08 mL and 0.12 mL for the i-STAT CHEM8+ and CG4+ cartridges, respectively). The Stat Profile instrument provides blood-gas and chemistry/electrolyte analysis on a single sample run, whereas in our study, 2 cartridges were required to obtain the same information from the i-STAT. Other cartridges are available for use in i-STAT instruments that give different combinations of blood-gas and chemistry/electrolyte analytes (e.g., the CG8+ cartridge measures iCa2+, Na+, K+, and glucose concentrations, in addition to blood-gas parameters). Depending on the analytes desired and the cartridges that are chosen, the smaller amount of total blood required for the i-STAT may facilitate analyses in smaller patients, and the portable nature of the analyzer can facilitate cage- or stall-side assessments.
Under ideal study conditions, the total observable error (TEo) would have been calculated during the precision studies. 5 Generally, TEo (calculated as bias + 2 CV) is calculated from the CV of 20 replicate assessments of a single sample. In our study, we assessed precision by generating a CV for each animal (based on n = 2 or n = 4, depending on animals), and focused on the median CV. This design generates a CV different from the CV included in the TEo formula but was necessary because of the time sensitivity of the blood-gas data. Data provided by the manufacturers for the i-STAT Alinity v and the Stat Profile pHOx Ultra, using repeated measures of aqueous calibrator solutions, generally showed CVs of <2.5% for all measured analytes, with some exceptions for very high or very low abnormal values.5,12 Because TEo is a tool to quantify the maximal observed error between 2 methods, a TEo between 2 POC analyzers could be generated to quantify the maximal error between those 2 specific methods. This may be useful for interpretation of results if the monitoring of an animal cannot be performed on a single POC analyzer, although it should be recognized that the error may vary across the reportable range of a specific analyte.
Although there were individual animals with high CVs in the precision testing, the source of this variability was unclear. Blood tubes were continually agitated on a tube rocker during the study, and cartridges were filled sequentially in a short period of time from the same anaerobic syringe to minimize the impact of rouleaux formation and settling of red blood cells and to minimize changes in the dissolved gasses (which had high maximum CV). High variability in Hct was not related to high variability in other analytes, and the strong correlations of the dissolved gas analytes between machines in the precision part of our study suggests that the technique was appropriate for use. Additional assessment of precision in whole blood using larger sample sizes may elucidate the cause of this intermittent variability.
Our study has several limitations. One limitation was the relatively low sample size for assessing the correlation and bias between the tested instruments, especially for horses, which was a result of the difficulty of recruiting samples while simultaneously treating these animals in an emergent setting. The Stat Profile pHOx Ultra that we used was located at a distance from the equine emergency area, which impaired sample recruitment. Further analysis, especially involving samples with analyte concentrations outside of the RIs, will provide a better picture of how these instruments compare in different circumstances. Additionally, regression analysis was not performed between the 2 analyzers, hence we have no information that supports the interchangeable use of any of the analyzers.
The other limitation related to case number is the fact that all species were analyzed together in the Bland–Altman part of the comparison study. This decision was made after noting that there was minimal difference among the species-specific assessments. Both instruments are routinely used to assess the studied analytes in dogs, cats, and horses, resulting in the decision to combine analyses, but this does not preclude the presence of specific blood characteristics that may result in a species-specific bias. The i-STAT 1 has been evaluated in cattle, and shown to have good correlation with values obtained by either benchtop blood-gas or central laboratory analyzers.2,18,19 Smaller studies of the i-STAT 1 on the measurement of electrolytes in birds and mice have also resulted in very good to excellent correlations with benchtop analyzers, indicating that, although we cannot speak directly to the lack of variability in our sample population, the i-STAT cartridges perform well across a variety of species.14–16
Another limitation was the lack of a gold standard measurement. A gold standard measurement for electrolyte concentration (e.g., serum electrolytes measured by a central laboratory analyzer) was not performed as part of our study because our objective was to compare the POC instruments. In addition, it would have a significant impact on sample allocation meeting the sample volume requirements needed to carry out all testing. Prior versions of the i-STAT 1 and the Stat Profile pHOx Ultra have been compared favorably to a central laboratory analyzer for both blood-gas and electrolyte analysis.10,13 Although the instruments that we used underwent routine QC assessment and maintenance, as recommended by the manufacturer, they both likely have some variation from gold standard measurements.
In the future, comparison between these POC analyzers and a central laboratory analyzer in canine and feline patients is recommended and is most valuable when performed using the specific analyzer that will be used clinically. 3 Future studies are warranted to document the performance of these POC analyzers in other species and to evaluate the performance of other i-STAT cartridges when used with the i-STAT Alinity v in a veterinary medical context.
Acknowledgments
We thank Barbara Arteldt for assistance in data collection, and Dr. Michelle Larsen for her initial review of the study.
Footnotes
Declaration of conflicting interests: Our project was sponsored by Zoetis Inc., which provided the i-STAT analyzers and cartridges for testing. i-STAT and Alinity are registered trademarks of the Abbott group of companies in various jurisdictions, used under license by Zoetis. Representatives of Zoetis were not involved in collection or recording of data. Dr. Thuy Hien Nguyen and Tanya Davis are employees of Zoetis Inc. Tanya Davis is a statistician who performed the statistical analyses reported here.
Funding: Our project was funded by Zoetis Inc.; the contents are solely the responsibility of the authors and do not necessarily represent the official view of Zoetis.
ORCID iD: Benjamin M. Brainard  https://orcid.org/0000-0003-4299-2936
Contributor Information
Jasper E. Burke, Department of Small Animal Medicine and Surgery, College of Veterinary Medicine, University of Georgia, Athens, GA, USA
Thuy Hien T. Nguyen, Zoetis Inc., Parsippany, NJ, USA
Tanya Davis, Zoetis Inc., Parsippany, NJ, USA.
Amie Koenig, Department of Small Animal Medicine and Surgery, College of Veterinary Medicine, University of Georgia, Athens, GA, USA.
Selena L. Lane, Department of Small Animal Medicine and Surgery, College of Veterinary Medicine, University of Georgia, Athens, GA, USA
Jennifer Good, Department of Small Animal Medicine and Surgery, College of Veterinary Medicine, University of Georgia, Athens, GA, USA.
Benjamin M. Brainard, Department of Small Animal Medicine and Surgery, College of Veterinary Medicine, University of Georgia, Athens, GA, USA.
References
- 1. Adams DA, Buus-Frank M. Point-of-care technology: the i-STAT system for bedside blood analysis. J Pediatr Nurs 1995;10:194–198. [DOI] [PubMed] [Google Scholar]
- 2. Bleul U, Götz E. Evaluation of the i-STAT portable point-of-care analyzer for determination of blood gases and acid-base status in newborn calves. J Vet Emerg Crit Care 2014;24:519–528. [DOI] [PubMed] [Google Scholar]
- 3. Flatland B, et al. ASVCP guidelines: quality assurance for point-of-care testing in veterinary medicine. Vet Clin Pathol 2013;42:405–423. [DOI] [PubMed] [Google Scholar]
- 4. Gonzalez AL, Waddell LS. Blood gas analyzers. Top Companion Anim Med 2016;31:27–34. [DOI] [PubMed] [Google Scholar]
- 5. Harr KE, et al. ASVCP guidelines: allowable total error guidelines for biochemistry. Vet Clin Pathol 2013;42:424–436. [DOI] [PubMed] [Google Scholar]
- 6. Indrasari ND, et al. Comparison of point-of-care and central laboratory analyzers for blood gas and lactate measurements. J Clin Lab Anal 2019;33:e22885. [DOI] [PMC free article] [PubMed] [Google Scholar]
- 7. i-STAT Alinity System Operations Manual. Section 4.1–supplemental test Information for the i-STAT alinity system. 2017. [cited 2017 Oct 23]. https://www.pointofcare.abbott/int/en/offerings/istat-alinity
- 8. Klein LV, et al. Accuracy and precision of the portable StatPal II and the laboratory-based NOVA stat profile 1 for measurement of pH, P(CO2), and P(O2) in equine blood. Vet Surg 1999;28:67–76. [DOI] [PubMed] [Google Scholar]
- 9. Lane SL, et al. Formulation and validation of a predictive model to correct blood glucose concentrations obtained with a veterinary point-of-care glucometer in hemodiluted and hemoconcentrated canine blood samples. J Am Vet Med Assoc 2015;246:307–312. [DOI] [PubMed] [Google Scholar]
- 10. Lee H-Y, et al. Performance evaluation of the Stat Profile pHOx ultra blood gas analyzer. J Lab Med Qual Assur 2019;41:47–49. Korean. [Google Scholar]
- 11. Maas A. IFCC reference methods for measurement of pH, gases and electrolytes in blood: reference materials. Clin Chem Lab Med 1991;29:253–262. [DOI] [PubMed] [Google Scholar]
- 12. Nova Medical. Stat Profile pHOx Ultra Instructions for Use: Appendix A. Reference 49786. Nova Medical, 2013. [Google Scholar]
- 13. Schneider J, et al. Der i-STAT Analyzer. Ein neues, tragbares Gerät zur Bedsidebestimmung des Hämatokrits, der Blutgase und Elektrolyte [The i-STAT analyzer. A new, hand-held device for the bedside determination of hematocrit, blood gases, and electrolytes]. Anaesthesist 1997;46:704–714. German. [DOI] [PubMed] [Google Scholar]
- 14. Steinmetz HW, et al. Evaluation of the i-STAT portable clinical analyzer in chickens (Gallus gallus). J Vet Diagn Invest 2007;19:382–388. [DOI] [PubMed] [Google Scholar]
- 15. Stender RN, et al. Establishment of blood analyte intervals for laboratory mice and rats by use of a portable clinical analyzer. J Am Assoc Lab Anim Sci 2007;46:47–52. [PubMed] [Google Scholar]
- 16. Tarbert DK, et al. Evaluation of the i-STAT portable clinical analyzer for measurement of ionized calcium and selected blood chemistry values in Asian elephants (Elephas maximus). J Zoo Wildl Med 2017;48:319–327. [DOI] [PubMed] [Google Scholar]
- 17. Theodorsson E, et al. Bias in clinical chemistry. Bioanalysis 2014;6:2855–2875. [DOI] [PubMed] [Google Scholar]
- 18. Verwaerde P, et al. The accuracy of the i-STAT portable analyser for measuring blood gases and pH in whole-blood samples from dogs. Res Vet Sci 2002;73:71–75. [DOI] [PubMed] [Google Scholar]
- 19. Yildirim E, et al. Reliability of the i-STAT for the determination of blood electrolyte (K+, Na+, and CI-) concentrations in cattle. J Vet Intern Med 2015;29:388–394. [DOI] [PMC free article] [PubMed] [Google Scholar]
- 20. Yilmaz O, Karapinar T. Evaluation of the i-STAT analyzer for determination of ionized calcium concentrations in bovine blood. Vet Clin Pathol 2019;48:31–35. [DOI] [PubMed] [Google Scholar]