

Summary
Background
Adding trastuzumab to first-line chemotherapy improves overall survival in patients with HER2-positive metastatic gastric cancer. We assessed the safety and efficacy of pembrolizumab in combination with trastuzumab and chemotherapy in first-line HER2-positive metastatic esophagogastric (EG) cancer.
Methods
This was an open-label, non-randomized, single-arm, investigator-initiated single center phase 2 trial in patients aged 18 years or older with HER2-positive mEG cancer. Eligible patients had measurable or evaluable non-measurable disease at baseline, Eastern Cooperative Oncology Group performance status of 0, 1, or 2, and baseline left ventricular ejection fraction of ≥ 53%. Patients were eligible to receive an initial induction cycle of intravenous (IV) pembrolizumab (200 mg flat dose) and IV trastuzumab 8 mg/kg loading dose. For subsequent cycles, patients received IV oxaliplatin 130 mg/m2 or cisplatin 80 mg/m2 on day 1, oral capecitabine 850 mg/m2 twice a day for 2 weeks followed by 1 week off, or IV 5-FU 800 mg/m2/day on day 1 to 5, and IV pembrolizumab 200 mg flat dose and trastuzumab 6 mg/kg, both administered on day 1 of each 3-week cycle. The primary endpoint was 6-month progression-free survival (PFS). Pre-treatment tumor and plasma samples were collected for confirmation of HER2 status and exploratory biomarker analysis by targeted and whole exome sequencing. This trial is registered with Clinicaltrials.gov, number NCT02954536 (ongoing, closed to enrollment).
Findings
Between Nov 11, 2016, and Jan 23, 2019, 37 patients were enrolled. At the time of data cutoff on Aug 6, 2019, the median follow-up among survivors was 13 months (range 6–31). The primary endpoint was achieved; 26 of 37 (70%, 95% CI 54–83%) patients were progression-free at 6 months. The overall response rate among 35 patients with measurable disease was 91% (32 patients, 95% CI 78–97%), including 6 (17%) complete responses, 26 (74%) partial responses, and 3 (8%) stable disease. The median PFS was 13.0 months (95% CI 8.6–NA), median overall survival (OS) was 27.2 months (95% CI 18.8–NA), and the 12-month OS rate was 80% (95% CI 68–95%). The most common treatment-related adverse event of any grade was neuropathy, which affected 36 (97%) of the 37 patients. Treatment-related grade 3 or 4 adverse events occurred in 21 (67%) patients, and serious adverse events occurred in 2. Two patients discontinued treatment due to treatment-related adverse events, and 4 discontinued pembrolizumab due to immune-related adverse events. ERBB2 amplification or focal gain was detected in 21 of 32 patients (66%) patients who had tumor sequencing and in 18 of 33 patients (54%) whose circulating tumor DNA (ctDNA) was sequenced. Tissue and ctDNA sequencing were concordant for presence or absence of ERBB2 amplification in 27 of 29 patients (93%). A decline in tumor-matched ctDNA was observed after the first dose of pembrolizumab and trastuzumab in 13 of the 16 patients with tumor-matched pre-treatment ctDNA. Patients with ERBB2 amplification in both tumor and ctDNA had longer PFS; median 16.4 (n = 14, 95% CI 13.0–NA) versus 6.2 months (n = 12, 95% CI 5.9–NA) in those who did not (p = 0.013).
Interpretation
Pembrolizumab can be safely combined with trastuzumab and chemotherapy and has promising activity in HER2-positive mEG cancer irrespective of PD-L1 status. Plasma-based ctDNA should be explored in future randomized studies as a predictive biomarker. A randomized phase 3 clinical trial assessing the efficacy and safety of pembrolizumab versus placebo in combination with trastuzumab and chemotherapy in first-line HER2-positive mEG cancer is currently underway.
Introduction
With an estimated 1.5 million new diagnoses in 2018, esophagogastric (EG) cancer represents the fifth most common cancer worldwide and the third leading cause of cancer-related death.1 Moreover, the incidence of gastro-esophageal junction (GEJ) cancer is increasing rapidly in Western countries, particularly among young individuals.2 Approximately one third of EG tumors are characterized by chromosomal instability and aberrant activation of human epidermal growth factor receptor (HER) tyrosine kinases (HER1–4).3–5 In patients whose cancers harbor ERBB2 amplification or HER2 protein overexpression, the combination of the anti-HER2 antibody trastuzumab with cytotoxic chemotherapy (a fluoropyrimidine and platinum) is the recommended first-line therapy. Patients treated with this combination have a median overall survival (OS) of 13.8 months and an overall response rate (ORR) of 47%.6
Pembrolizumab, an anti-programmed cell death protein 1 (PD-1) antibody, has been shown to induce durable responses in 23% of patients with programmed death ligand 1 (PD-L1)-positive (combined positive score (CPS) ≥ 1) metastatic EG (mEG) cancer in the third-line setting.7 However, a recent study found that the combination of pembrolizumab and chemotherapy did not improve survival relative to first-line chemotherapy in patients with HER2-negative, PD-L1-positive mEG cancer.8
Both preclinical and clinical evidence support combining pembrolizumab with trastuzumab and cytotoxic chemotherapy to treat HER2-positive cancers. The combination can eradicate tumors in a HER2-positive breast cancer murine model and induce durable clinical responses in a subset of patients with trastuzumab-refractory HER2-positive metastatic breast cancer.9,10 Though the mechanistic basis for synergy between anti-HER2 and anti-PD-1-based therapies has not been definitively established, possible contributors have been identified. Analysis of tumor samples from patients treated with trastuzumab demonstrates upregulation of PD-L1,10,11 which could increase the efficacy of pembrolizumab. In addition, administration of trastuzumab with pembrolizumab can augment HER2-specific T cell responses, promote T cell and dendritic cell trafficking, and induce peripheral memory T cell expansion.12–15
To determine whether pembrolizumab can be safely combined with trastuzumab and chemotherapy and whether the combination is sufficiently active to warrant comparison to the current standard of care, we conducted a phase 2 trial to define the activity of pembrolizumab, trastuzumab, a fluoropyrimidine and platinum as first-line therapy in patients with HER2-positive mEG cancer. Tumor and blood samples were collected prior to treatment to centrally confirm HER2 status and to identify molecular determinants of response.
Methods
Study design and population
This was an open label, non-randomized, single-arm, investigator-initiated phase 2 trial conducted at Memorial Sloan Kettering Cancer Center (MSK). The study protocol and all amendments were approved by the MSK institutional review board and the trial was registered with ClinicalTrials.gov (NCT02954536). The study was performed in accordance with the protocol and its amendments and Good Clinical Practice guidelines, and was overseen by the MSK Data and Safety Monitoring Committee. All patients provided written informed consent before enrollment.
Eligible patients were 18 years of age or older and had histologically confirmed HER2-positive (defined as immunohistochemistry [IHC] 3+ or HER2:CEP17 fluorescence in situ hybridization (FISH) ratio ≥ 2.0) metastatic esophageal, GE junction, or gastric adenocarcinoma. Selection criteria included previously untreated metastatic disease that was measurable or evaluable non-measurable per Response Evaluation Criteria in Solid Tumors version 1.1 (RECIST v1.1) by investigator assessment and an Eastern Cooperative Oncology Group (ECOG) performance status of 0, 1, or 2. Patients could have received adjuvant therapy but needed to have completed therapy > 6 months prior to study enrollment. Eligibility also required adequate organ function demonstrated by cardiac, hematologic, renal, and liver function tests performed within 10 days of treatment initiation. A complete list of inclusion and exclusion criteria is included in the clinical protocol provided in the Supplementary Material.
Treatment and procedures
At treating investigator discretion, patients initially received an induction cycle of intravenous (IV) pembrolizumab 200 mg flat dose and IV trastuzumab 8 mg/kg loading dose. A treatment cycle consisted of 3 weeks. Beginning with the second cycle (or the first for patients who did not receive the induction cycle without chemotherapy), patients received IV oxaliplatin 130 mg/m2 (or IV cisplatin 80 mg/m2) on day 1, oral capecitabine 850 mg/m2 twice a day for 2 weeks followed by 1 week off (or IV 5-FU 800 mg/m2/day on day 1 to 5), and IV pembrolizumab 200 mg flat dose and trastuzumab 6 mg/kg, both administered intravenously on the first day (± 7 days) of each 3-week cycle. Computed tomography (CT) or magnetic resonance imaging (MRI) was performed at baseline (within 28 days of beginning therapy), week 3, week 9, and every 9 weeks thereafter; the week 27 scan was treated as the 6-month scan. Given the cumulative toxicity of platinum chemotherapies, discontinuation of the platinum was allowed at the treating physician’s discretion, after which maintenance therapy continued with pembrolizumab, trastuzumab, and/or capecitabine. Patients were monitored for adverse events (AEs) throughout follow-up and for 30 days following the last dose of study treatment. Intra-patient dose reductions were allowed depending on the type and severity of toxicity.
Outcomes
The primary endpoint of this phase 2 study was 6-month progression-free survival (PFS), defined as the proportion of patients alive and free of progression at 6 months. Secondary endpoints included overall response rate (ORR), disease control rate, overall survival (OS; both median and percent at 1 year), median PFS (defined as the time from the start of the treatment with trastuzumab and pembrolizumab to the date of documentation of clinical or radiological disease progression [assessed per RECIST v1.1 by reference radiologist] or death from any cause), association between PFS and PD-L1 status, association between PFS and ERBB2 amplification on ctDNA sequencing, response to pembrolizumab and trastuzumab induction, and safety and tolerability. ORR was defined as best overall RECIST 1.1 response (complete response [CR] or partial response [PR]), disease control rate as the proportion of patients with stable disease (SD) or PR or CR, and OS as the time from the date of initial treatment to the date of death from any cause.
Biomarker analysis
Tumors and blood were collected pre-treatment, on-treatment, and at the time of disease progression. Tumors and matched normal samples (as a source of germline DNA) were analyzed using MSK-IMPACT, a capture-based next-generation sequencing (NGS) platform that detects mutations, copy-number alterations, and select rearrangements in up to 468 cancer-associated genes, as previously described.16,17 All variants were reviewed by a molecular pathologist prior to signing out results into the medical record.
The presence of MSI was assessed genomically using MSIsensor (version 0.2).18 MSIsensor assigns a clinically validated numeric score based on the percentage of unstable microsatellite sites, divided by the total number of microsatellite sites tested from aligned sequencing data.19 MSI status was defined on the basis of MSIsensor scores: < 3, microsatellite stable (MSS); > 3 and < 10, MS indeterminate; and ≥ 10, MSI-high (MSI-H).
To infer mutational signatures and detect potential neoantigens, tumor and normal specimens were also re-captured for whole exome sequencing. We used a comprehensive in-house WES pipeline, TEMPO (Time-Efficient Mutational Profiling in Oncology; https://github.com/mskcc/tempo), which performs alignment using the BWA-mem algorithm followed by mutation calling using the Strelka2 and Mutect2 variant callers. Details about the variant call processing are described at https://ccstempo.netlify.com/. Copy number analysis was performed with FACETS (https://github.com/mskcc/facets) and processed using facets-suite (https://github.com/mskcc/facets-suite). To delineate mutational processes driving the acquisition of somatic alterations, mutational signatures were decomposed for all tumor samples that had a minimum of 5 single-nucleotide somatic mutations using the R package mutation-signatures (https://github.com/mskcc/mutation-signatures). For cases with > 1 signature present, the proportion of mutations in the sample attributed to each signature was calculated.
Cell-free tumor DNA (ctDNA) isolated from plasma collected at baseline and during treatment was analyzed using the Guardant360 assay.20 The highest variant allele frequency (VAF, or relative frequency of a given mutation among all plasma DNA reads) was used as a surrogate for the degree of tumor DNA shedding in a given patient’s plasma sample.21 DNA copy number alterations were then adjusted using an algorithm developed using data from the HERACLES trial that corrects copy number bias for tumor DNA shedding.22 Adjusted ERBB2 amplification was defined as having a DNA copy number higher than the median adjusted copy number among 1630 EG patients from a historical ctDNA analysis.21 Immunohistochemistry for HER2 and PD-L1 was performed and interpreted as previously described.23, 24
Statistical analysis
Using an exact single-stage binomial design, the study sample size of 37 patients provided 80% power to detect an improvement in the 6-month PFS from a historical control of 55% to 75% with a type I error rate of 5%.6 The regimen would be considered worthy of further investigation if 26 or more of 37 patients were progression-free at 6 months. Patients that came off study due to toxicity before 6 months without documented progression underwent continued assessment at regular intervals to obtain 6 months of data. Patients who came off study before 6 months without documented progression were considered as events for the primary endpoint of 6-month PFS.
The OS, PFS, and ORR analyses included patients who received ≥ 1 dose of trastuzumab and pembrolizumab. Duration of response was analyzed for all patients who had a best response of CR or PR and was estimated using Kaplan-Meier methods. Safety was assessed in all patients who received ≥ 1 dose of study treatment. All adverse events were graded according to the National Cancer Institute Common Toxicity Criteria for Adverse Events (v4.0). ORR was estimated using binomial proportions along with 95% confidence intervals. OS and PFS were measured from the start of first treatment until the time of death for OS, or until the first progression or death, whichever came first, for PFS.
The log-rank test was used to compare progression-free survival distributions between patient subgroups. In addition, the log-rank test was used to compare PFS distributions between patients with and without ERBB2 amplification in tumor or ctDNA (adjusted for tumor DNA shedding), and between those with and without a given detectable tumor-matched ctDNA alteration at baseline.
All statistical analyses were performed using R version 3.6.0 (R Foundation for Statistical Computing, Vienna, Austria). All P-values were two-sided. P-values of < 0.05 were considered statistically significant.
Role of the funding source
Merck funded this investigator-initiated study, contributed to the study design, and approved the final version of the manuscript, but was not involved in data interpretation or writing of the report. The principal investigator (YYJ) was involved in all aspects of study design, data analysis, and interpretation, wrote the first draft of the manuscript, and approved the final version of the manuscript in conjunction with Merck and all the authors and had the final responsibility to submit the study results for publication.
Results
Patient characteristics
Forty-one patients were considered for enrollment between Nov 2016 and Jan 2019, of which 4 were excluded based on eligibility criteria (Figure 1). The study cohort consisted of patients with ECOG performance status of 0 or 1, a median age of 60 years (range 21– 84), and predominantly patients with esophageal or GE junction adenocarcinoma (26, 70%) (Table 1). All 37 patients had HER2-positive disease by IHC or FISH testing prior to enrollment. Central confirmation of HER2 positivity was not required prior to study entry, and 15 patients were enrolled based on pre-treatment HER2 testing performed at outside institutions. HER2 positivity (by IHC, FISH, tissue and/or plasma NGS) could not be centrally confirmed in 6 of these 15 patients, 3 due to a lack of tissue for repeat IHC testing and 3 due to discordance between the local and central IHC result. Notably, there was no evidence of ERBB2 amplification in all 6 of these patients based on pre-treatment tissue and/or plasma NGS (Supplementary Table 1). All patient-level clinical and genomic data used in this analysis are available via cBioPortal for Cancer Genomics (https://cbioportal.mskcc.org/study/summary?id=egc_trap_msk_2019) and in Supplementary Table 1.25
Figure 1. Trial profile.
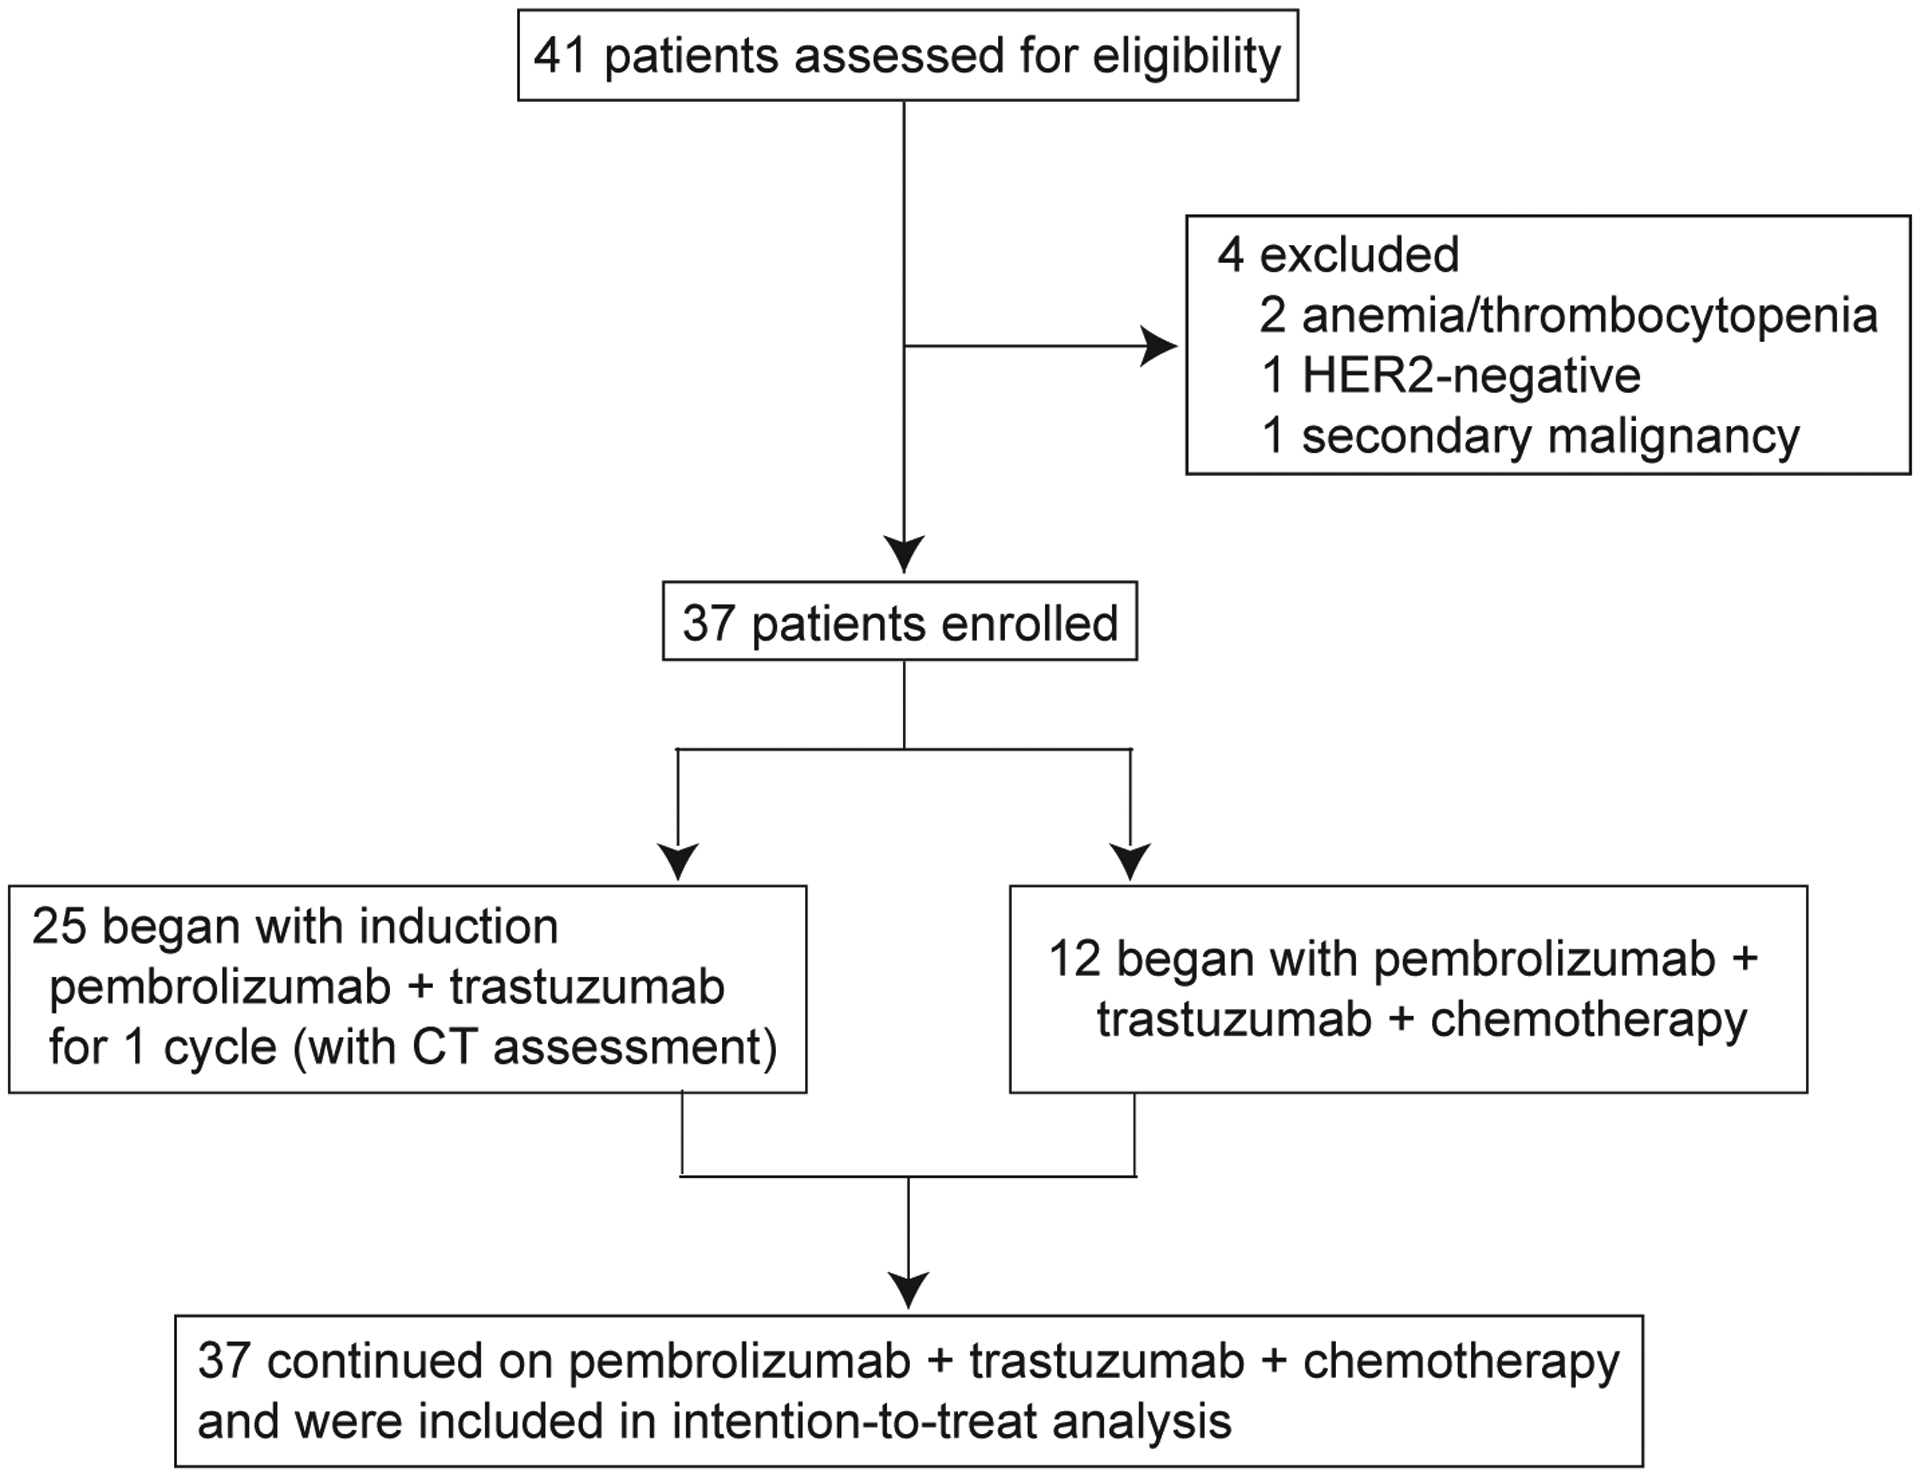
CT, computed tomography.
Table 1.
Baseline demographic and clinical characteristics (n = 37).
| Patients, n (%) | |
|---|---|
| Age, median (range) | 60 (21–84) |
| Male | 29 (78%) |
| Race | |
| White | 32 (86%) |
| Asian | 2 (5%) |
| Black, Hispanic, or other | 3 (8%) |
| Chemotherapy regimen | |
| Capecitabine | 24 (65%) |
| 5-fluorouracil | 13 (35%) |
| Oxaliplatin | 36 (97%) |
| Cisplatin | 1 (3%) |
| Primary site | |
| Esophageal | 14 (38%) |
| GEJ | 12 (32%) |
| Gastric | 11 (30%) |
| ECOG performance status | |
| 0 | 15 (40%) |
| 1 | 22 (60%) |
| HER2 by IHC, FISH, or tissue or plasma NGS at MSK | |
| Positive | 31 (84%) |
| Negative | 6 (16%) |
| Pre-treatment PD-L1 status | |
| CPS < 1 (negative) | 13 (35%) |
| CPS ≥ 1 (positive) | 14 (38) |
| Not available | 10 (27%) |
CPS, combined positive score; ECOG, Eastern Cooperative Oncology Group; GEJ, gastroesophageal junction; IHC, immunohistochemistry; FISH, fluorescence in situ hybridization; NGS, next-generation sequencing; PD-L1, programmed death-ligand 1
The median treatment duration on study was 10 months (range 0.7–28.3) and the median follow-up among surviving patients (n = 25) was 13 months (range 5.9–31.4). Most patients received a chemotherapy regimen that included capecitabine (25, 66%) and oxaliplatin (36, 97%). The median number of cycles of oxaliplatin was 6 (range 3–13) and the median number of cycles of combined pembrolizumab, trastuzumab, and fluoropyrimidine administration was 10 (range 1–37). Upon discontinuation of chemotherapy, patients were eligible to continue pembrolizumab and trastuzumab, and the median number of cycles of this combination was 12 (range 1–38).
At the time of data lock in Aug 2019, 13 patients remained on study. Among those patients not continuing therapy, 22 discontinued treatment as a result of disease progression and 2 discontinued treatment due to treatment-related adverse events (TRAEs; Table 2). Following disease progression, 17 patients went on to receive second-line therapy and 8 received third-line therapy (Supplementary Table 1).
Table 2.
Treatment-related adverse events (TRAEs). Data are presented as n (%).
| Any grade | Grade 3 | Grade 4 | |
|---|---|---|---|
| Any TRAE | 36 (97%) | 18 (49) | 3 (8%) |
| Serious TRAE | 2 (5%) | 2 (5%) | 0 (0%) |
| TRAEs leading to treatment discontinuation | 2 (5%) | 2 (5%) | 0 (0%) |
| TRAEs in ≥ 10% of patients | |||
| Paresthesia or peripheral sensory neuropathy | 36 (97%) | ||
| Hyperglycemia | 33 (89%) | ||
| Fatigue | 32 (86%) | ||
| Nausea | 31 (84%) | 2 (5%) | |
| Anemia | 30 (81%) | 4 (11%) | |
| Diarrhea | 27 (73%) | ||
| Vomiting | 25 (68%) | ||
| Increased ALT or AST | 23 (62%) | 1 (3%) | |
| Hypokalemia, hypomagnesemia, or hyponatremia | 22 (59%) | 6 (16%) | |
| Decreased platelet count | 21 (57%) | ||
| Decreased lymphocyte count | 19 (51%) | 7 (19%) | 2 (5%) |
| Anorexia or dysgeusia | 18 (49%) | ||
| Dry skin, pruritus, or maculo-papular rash | 18 (49%) | 2 (5%) | |
| Cough | 17 (46%) | ||
| Abdominal pain | 16 (73%) | ||
| Decreased white blood cell count | 16 (43%) | ||
| Oral mucositis | 14 (38%) | 2 (5%) | |
| Weight loss | 14 (38%) | ||
| Limb edema | 10 (27%) | 1 (3%) | |
| Headache | 10 (27%) | ||
| Palmar-plantar erythrodysesthesia syndrome | 8 (22%) | ||
| Increased blood bilirubin | 8 (22%) | ||
| Decreased neutrophil count | 7 (19%) | ||
| Decreased ejection fraction | 4 (11%) | ||
| Immune-related toxicities | |||
| Interstitial nephritis | 3 (8%) | 2 (5%) | 1 (3%) |
| Increased ALT or AST | 2 (5%) | 1 (3%) | |
| Colitis | 1 (3%) |
ALT, alanine transaminase; AST, aspartate transaminase.
Efficacy
The disease control rate was 100%, including 2 patients with disease evaluable but non-measurable by RECIST 1.1 criteria with SD as best response. All 35 patients with measurable disease by RECIST 1.1 criteria had tumor regression ranging from −20% to −100% (Figure 2A, B). The ORR of patients with measurable disease was 91% (32/35 patients, 95% CI 78–97%), with 6 patients (17%) achieving CRs, 26 (74%) PRs, and 3 (8%) SD as best response. Among patients achieving a CR or PR as best response, the median duration of response was 9.4 months (95% CI 4.2–NA) and the median time to response was 2 months (range 0.6–10.7). While all 37 treated patients exhibited evidence of clinical benefit, the duration of clinical benefit was highly variable, and non-target escape lesions represented the only site of progressive disease in 12 of 22 (54%) patients (Figure 2B) at the time of discontinuation of study therapy.
Figure 2. Changes in tumor burden in individual patients with pembrolizumab, trastuzumab and chemotherapy.
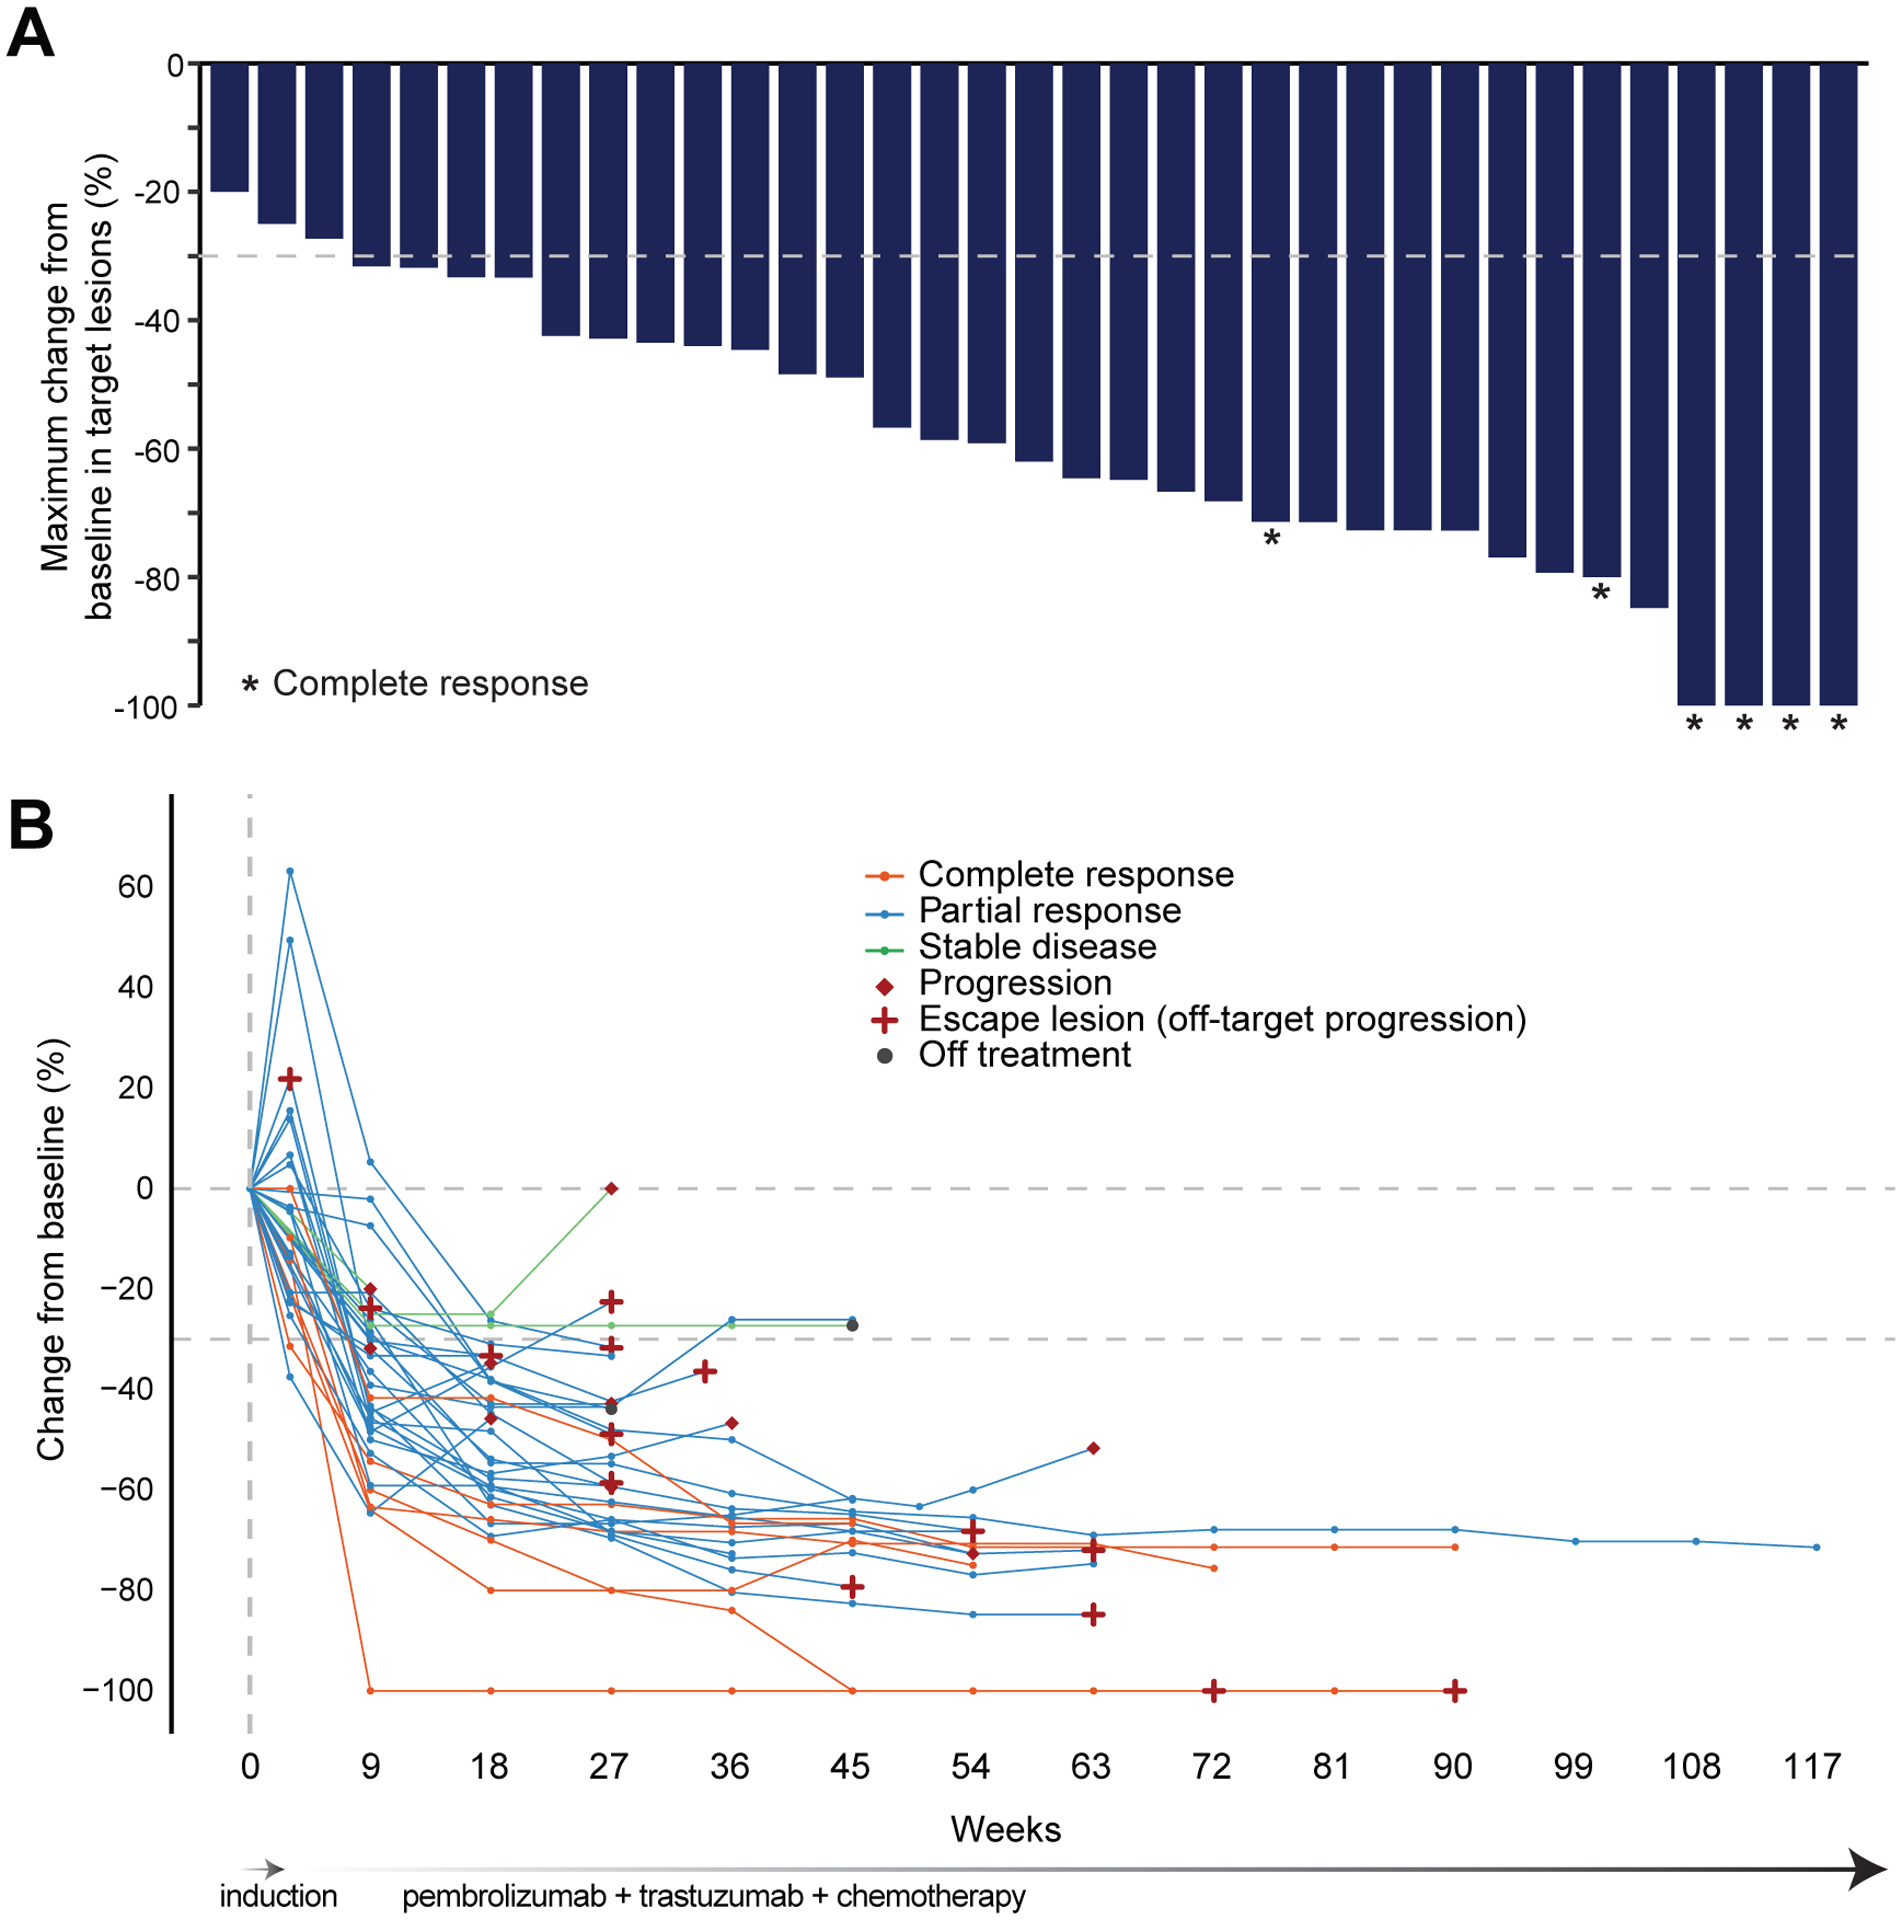
(A) Maximum percentage change from baseline in size of tumors. Patients with evaluable non-measurable lesions are not shown (n = 2). *Confirmed complete response, including 2 patients with biopsy-proven complete responses on endoscopic evaluation of primary EG tumors; remaining signal represents sub-centimeter nonviable residual lung opacities (not active metastasis). (B) Percentage change from baseline in target lesions over time.
Twenty-six of 37 (70%, 95% CI 54–83%) treated patients were alive and progression-free at 6 months, so the study met the decision rule (26 of 37 patients) for the primary endpoint of 6-month PFS (binary endpoint as per the statistical design). Overall, the median PFS was 13.0 months (95% CI 8.6–NA) and the Kaplan-Meier estimate of the 6-month PFS rate was 75% (95% CI 63–91%; Figure 3A), while the median OS was 27.3 months (95% CI 18.8–NA), with a 12-month OS rate of 80% (95% CI 68–95%; Figure 3B).
Figure 3. Kaplan-Meier curves.
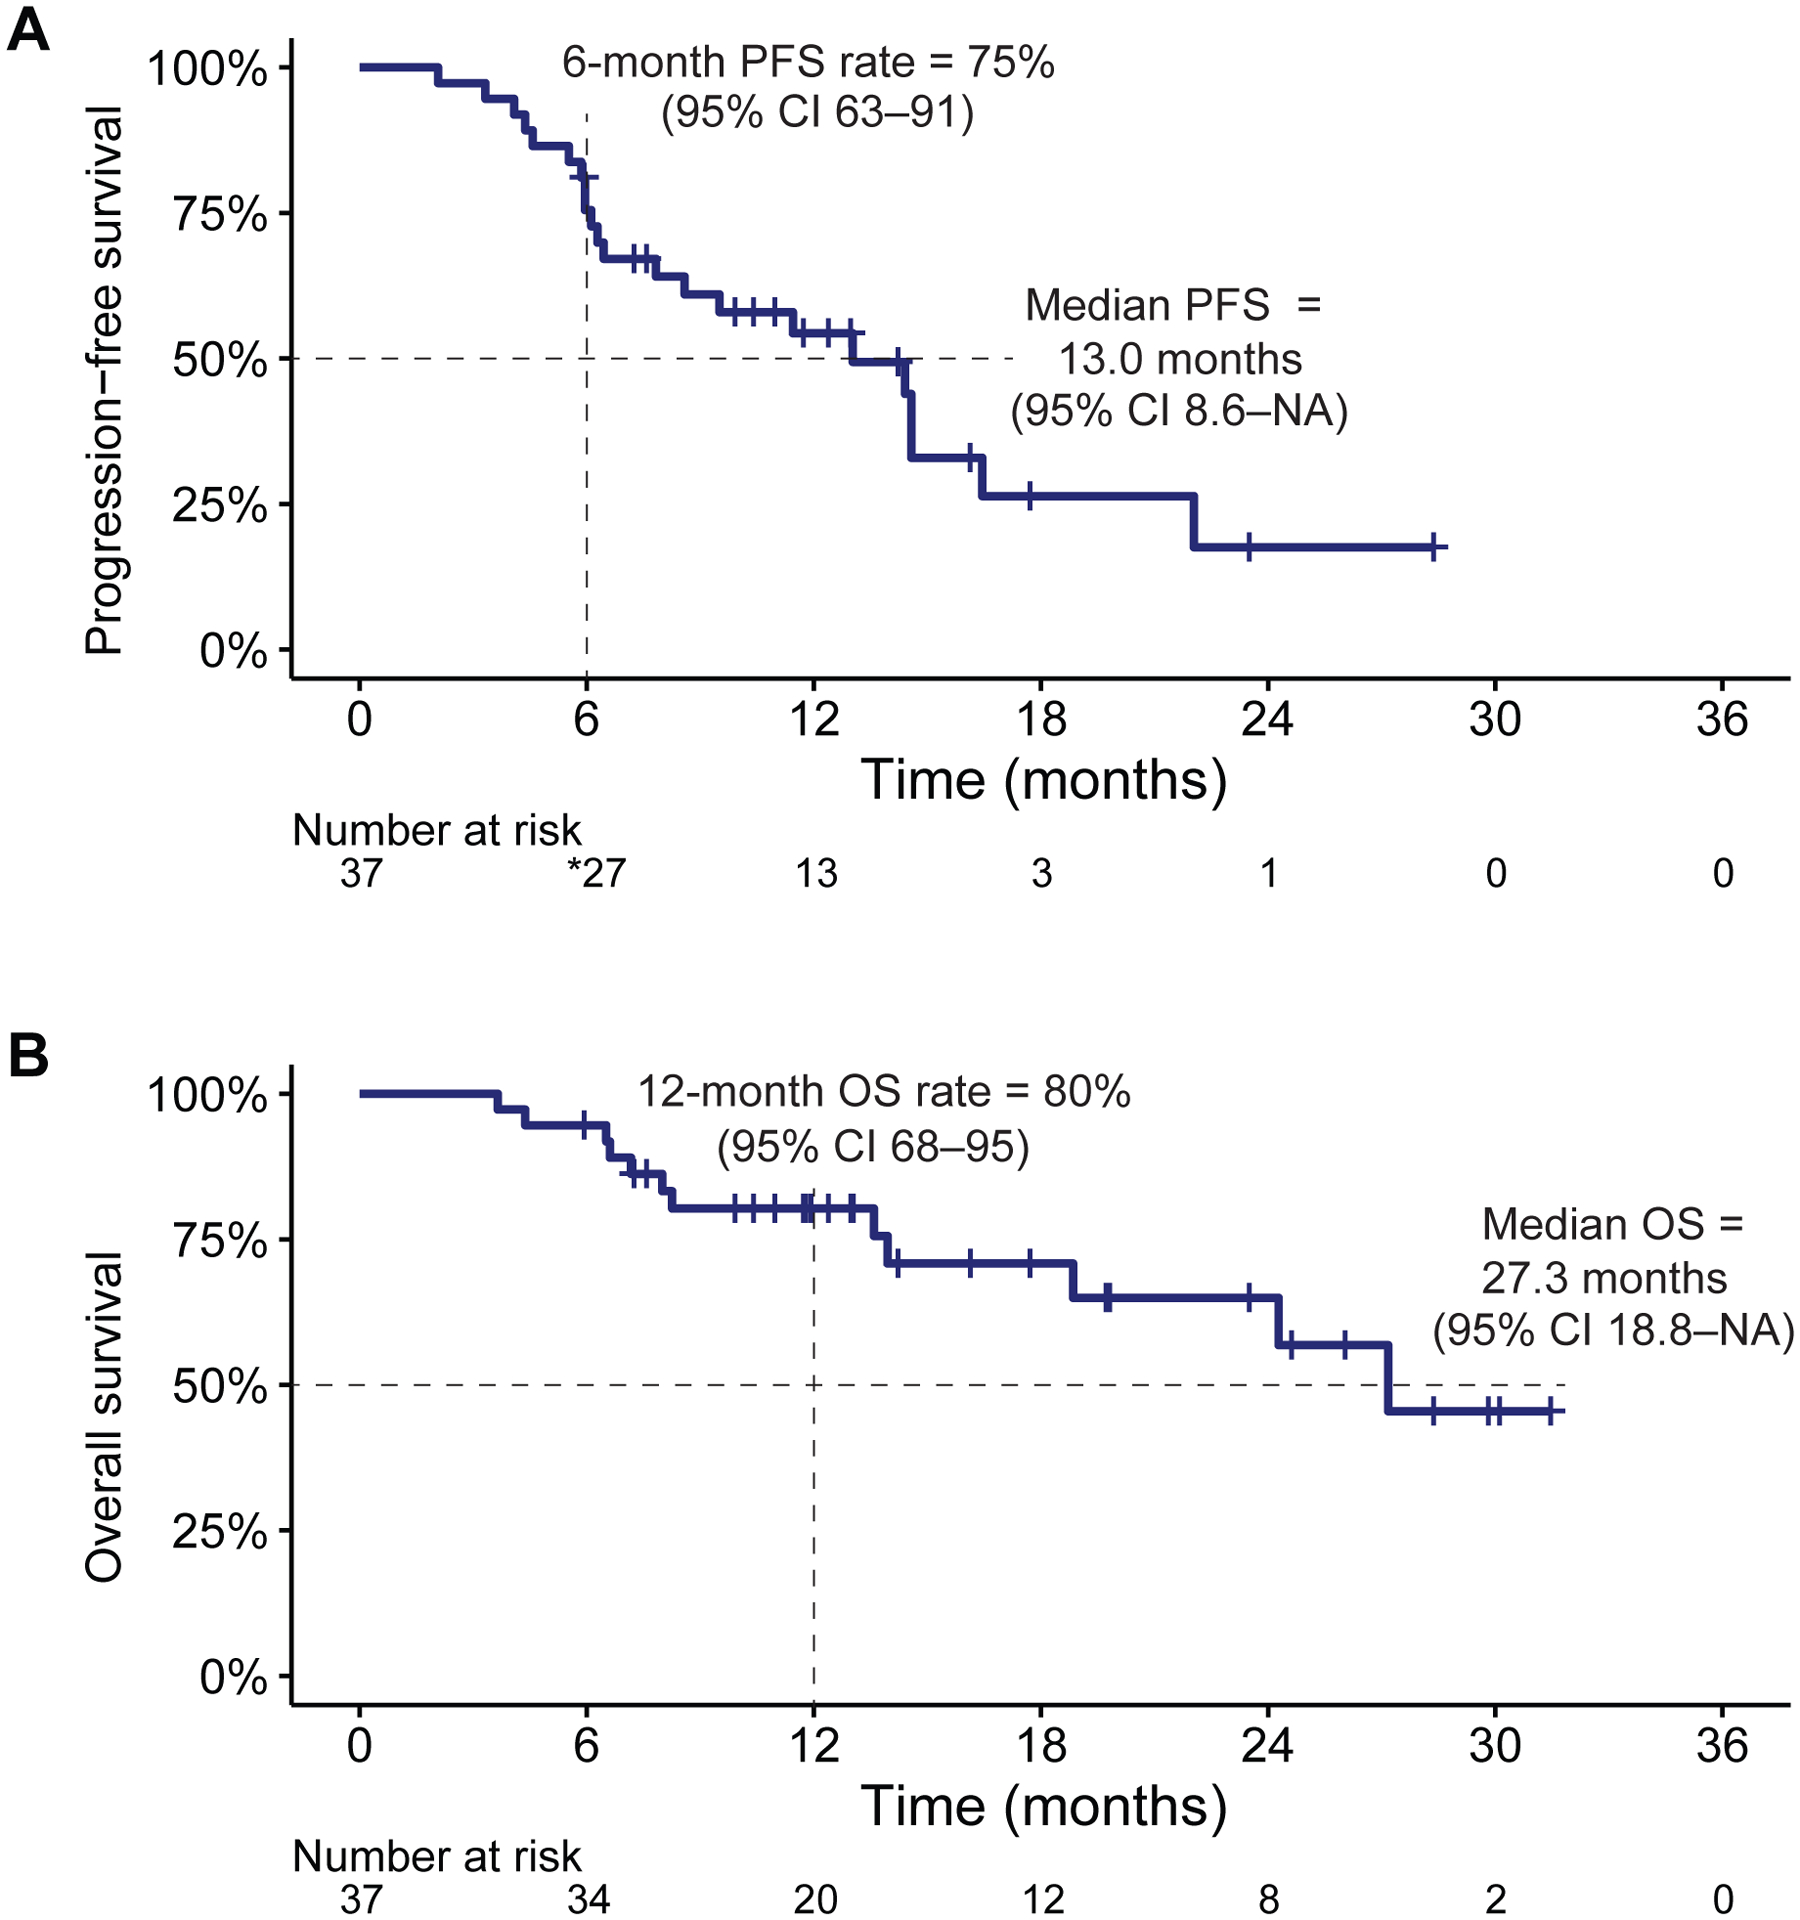
(A) Progression-free survival (PFS) in all patients. *1 patient with progression 3 days after 6-month evaluation counted as event for the binomial calculation of 6-month PFS. (B) Overall survival (OS) in all patients. Hash marks indicate censored observations.
To explore the activity of the combination of anti-HER2 and anti-PD-1 therapies, the study allowed, per investigator discretion, an initial induction cycle of biologic therapy without any chemotherapy. Twenty-five patients received an initial induction cycle of pembrolizumab and trastuzumab only, followed by pembrolizumab, trastuzumab, and chemotherapy beginning with cycle 2; the remaining 12 received pembrolizumab, trastuzumab, and chemotherapy as initial treatment. The median PFS did not significantly differ between these groups; 13 months (95% CI 6.45–NR) versus 14.6 (95% CI 8.59–NR). Nor did 12-month OS; 91% (95% CI 75–100%) versus 75% (95% CI 60–95%). Among the 25 patients who received the induction cycle of only pembrolizumab and trastuzumab, 2 patients achieved PRs and 12 (48%) demonstrated a reduction in at least some target lesions as assessed by repeat CT scan 3 weeks after the first dose of pembrolizumab and trastuzumab, and prior to initiation of chemotherapy (Supplementary Figure 1).
Safety
TRAEs occurred in 36 of 37 (97%) patients, with the most frequent TRAEs being neuropathy, hyperglycemia, fatigue, nausea, anemia, diarrhea, vomiting, and transaminitis (Table 2). All patients with TRAEs required ≥ 1 dose reduction, primarily for nausea, fatigue, or neuropathy, which were deemed by the investigative team to be attributable to oxaliplatin, or diarrhea, nausea, or mucositis presumed to be caused by capecitabine/5-FU. Four patients (11%) had immune-related AEs requiring discontinuation of pembrolizumab, but allowing for continuation of trastuzumab and the fluoropyrimidine. Immune-related AEs included interstitial nephritis (3, 8%), transaminitis (2, 5%), and colitis (1, 3%). Grade 3/4 non-immune-related AEs included lymphocytopenia (9 patients, 24%), electrolyte disturbances (6, 16%), anemia (4, 11%), nausea (2, 5%), dry skin or pruritis (2, 5%), oral mucositis (2, 5%), transaminitis (1, 3%), and limb edema (1, 3%).
Biomarker analyses
Thirty-two patients had sufficient pre-treatment tumor material for targeted DNA sequencing using MSK-IMPACT, of which 31 were also analyzed by whole exome sequencing; NGS and IHC findings and clinical response data are summarized in Figure 4A. ERBB2 amplification or focal gain was detected in 21 of 32 (66%) tumors by targeted and/or whole exome sequencing (Supplementary Table 1). All 20 patients with tumor ERBB2 amplification by NGS had HER2 overexpression graded by IHC as 3+, versus only 6 of the 12 patients without. All 6 patients with tumors with HER2 IHC with 2+ intensity (equivocal) and ERBB2 amplification by FISH were negative for ERBB2 amplification by tissue NGS, likely due to tumor heterogeneity and/ or low amplification. Similar to prior results with trastuzumab plus chemotherapy,4,26 patients with ERBB2 amplification by tumor NGS had longer PFS on pembrolizumab, trastuzumab, and chemotherapy than those without, though this difference was not statistically significant (median PFS 14.6 [95% CI 13.0–NR] versus 7.8 months [95% CI 6.12–NR]; p = 0.12, Figure 4B).
Figure 4. Integrated treatment outcome and biomarker analysis.
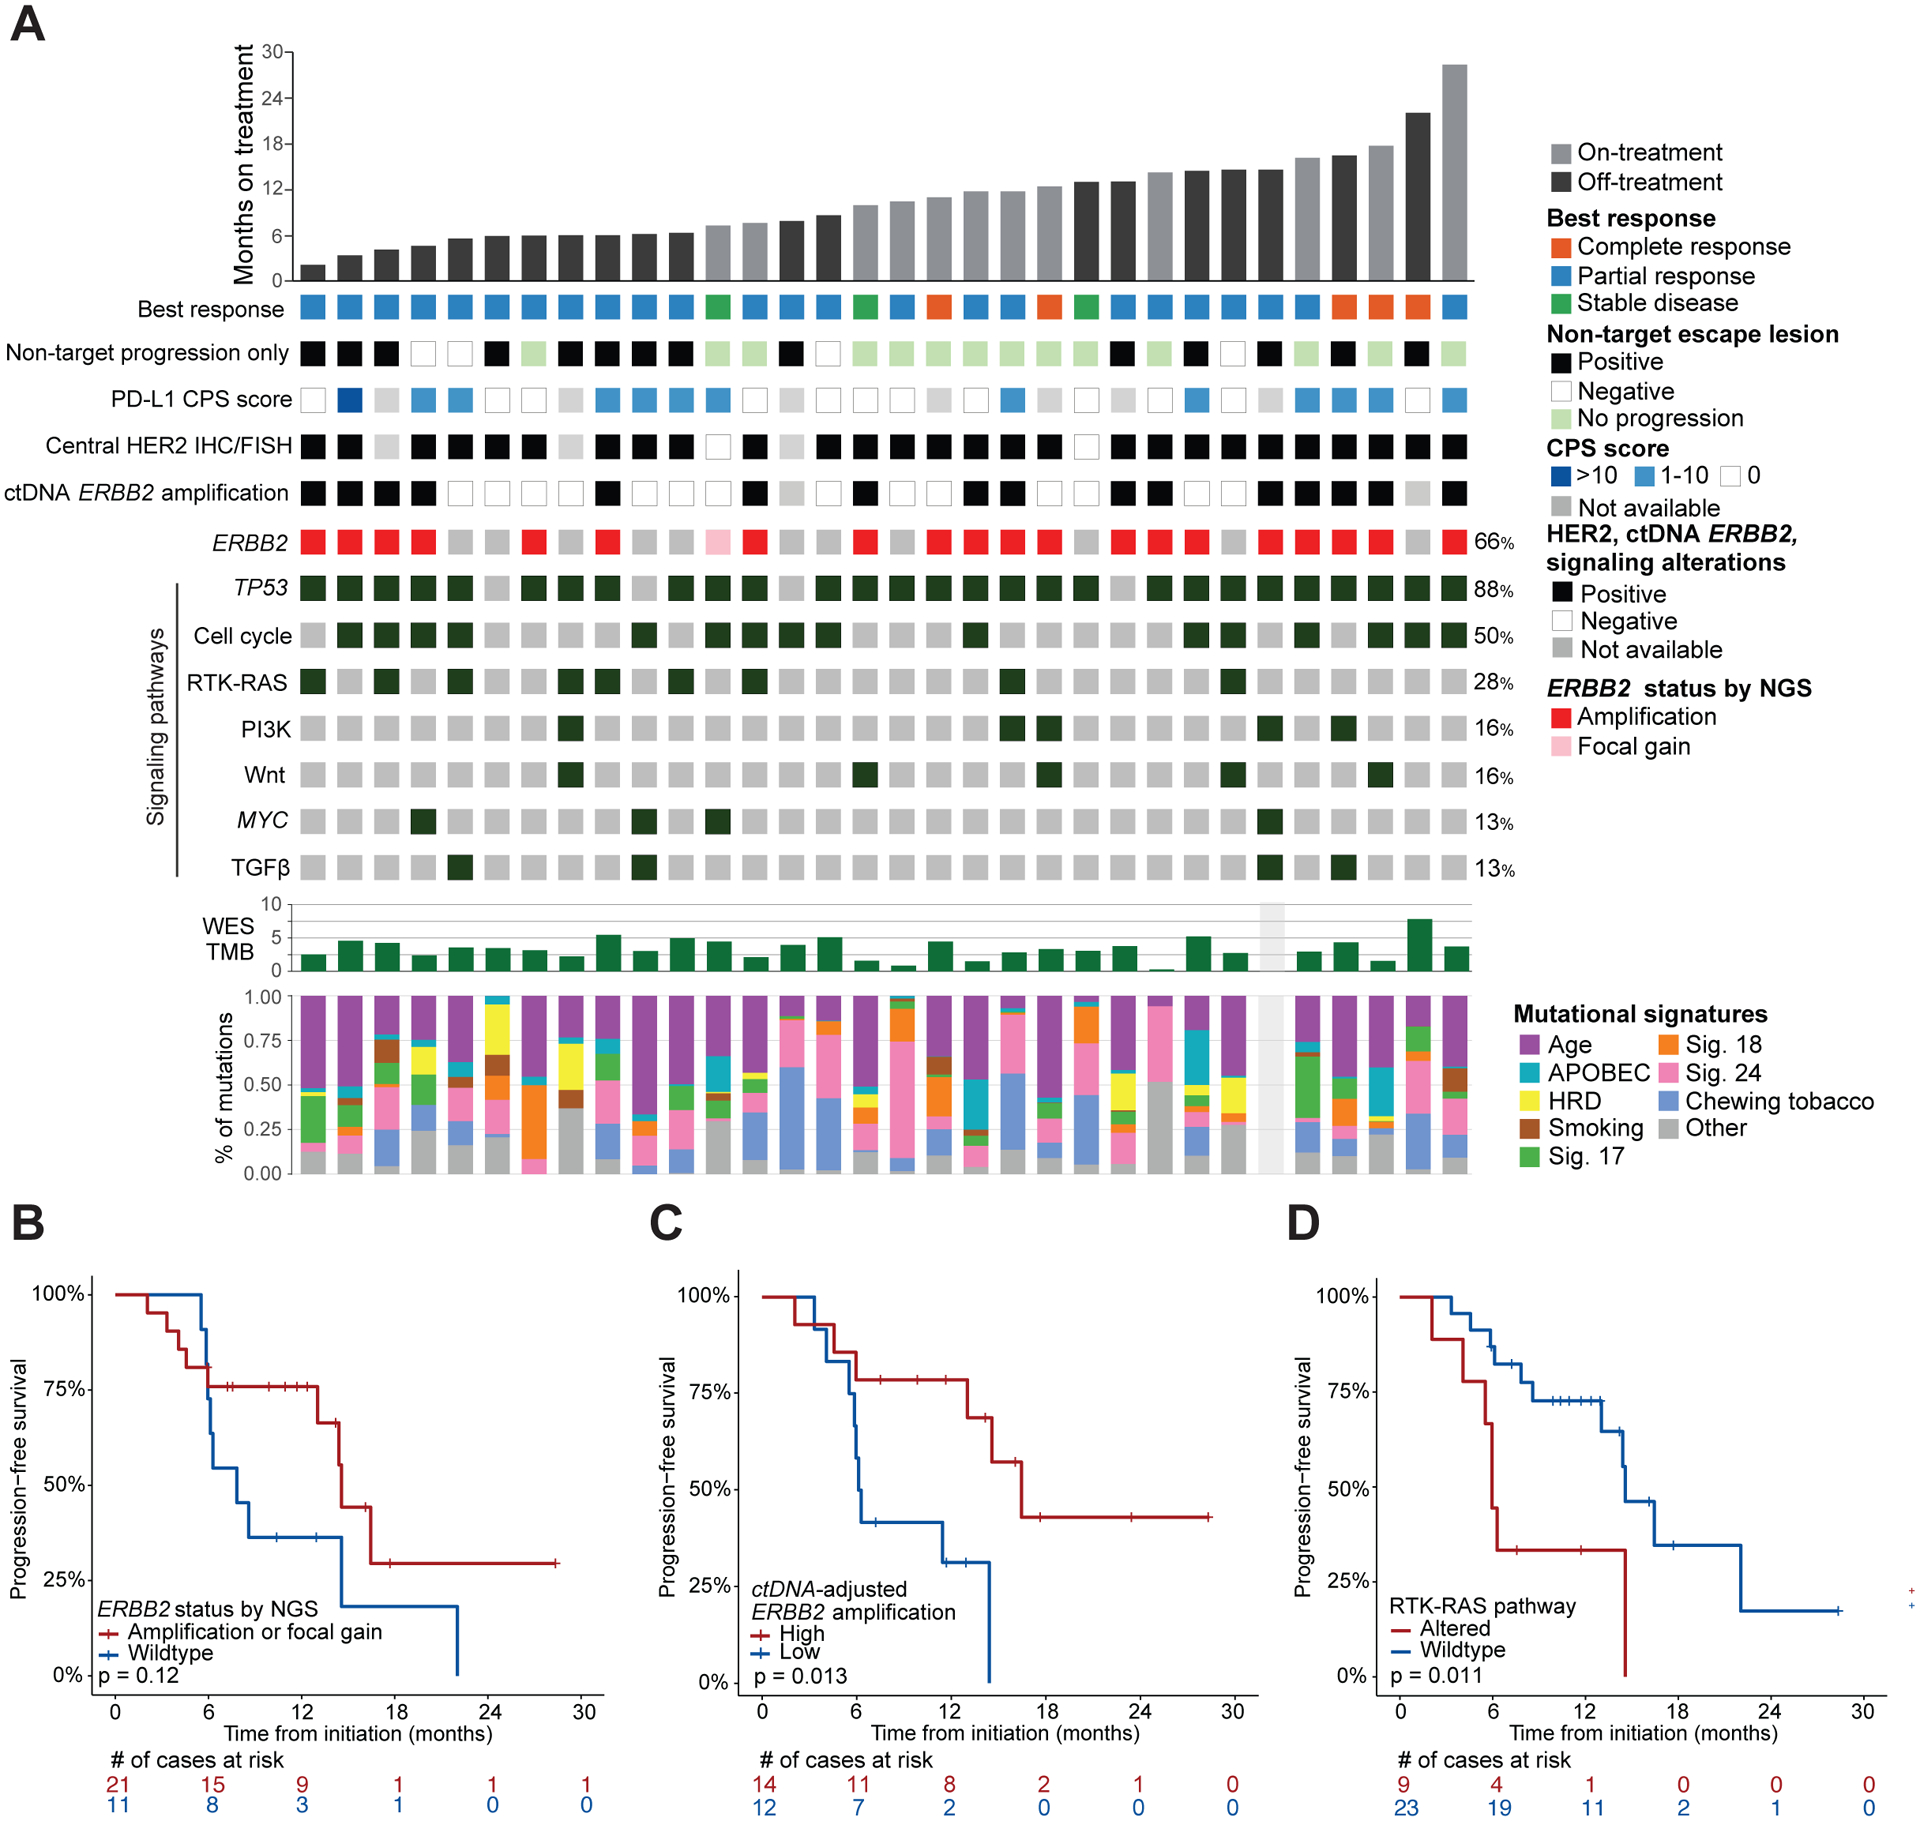
Data are shown for the 32 patients with sufficient pre-treatment tumor material for targeted DNA sequencing and grouped by time on therapy. (A) From top to bottom: duration of therapy, best response according to RECIST v1.1, pattern of disease progression, PD-L1 combined positive score (CPS), HER2 by IHC and/or FISH, ERBB2 amplification in tumor-matched ctDNA, individual alterations, tumor mutation burden (TMB) on whole exome sequencing (WES), and relative proportion of known EG cancer mutational signatures (HRD, homologous recombination deficiency). (B–D), Kaplan-Meier curves comparing PFs of patients grouped by (B) tumor ERBB2 amplification status determined by sequencing, (C) variant allele frequency-adjusted ERBB2 amplification in ctDNA, and (D) RTK/RAS pathway co-alteration status.
Among the patients with matched pre-treatment tissue and plasma NGS, 27 of 29 (93%) were concordant for the presence or absence of ERBB2 amplification. ERBB2 amplification was detected in 18 of 33 (54%) patients with pre-treatment plasma NGS, including 2 patients for whom tissue was inadequate for tumor NGS. Of the 18 patients within this subset with ERBB2-amplified tumors by tissue NGS, 16 (89%) had concordant ERBB2 amplification in plasma ctDNA (Supplementary Table 1). Of the 2 discordant cases, plasma NGS failed to detect any alterations found in the tumor of one of the patients, suggesting that absence of ERBB2 amplification in plasma may have reflected inadequate tumor DNA shedding. Of the 26 patients with detectable tumor-matched ctDNA alterations at baseline, the 14 patients with ERBB2 amplification (adjusted for max VAF; see Methods) had significantly longer PFS; median 16.4 months (95% CI 13.0–NA) vs. 6.2 (95% CI 5.9–NA) in those who did not; p = 0.013 (Figure 4C). Beyond ERBB2, patients with tumors harboring co-alterations in RTK-RAS pathway genes had significantly shorter PFS; median PFS 5.9 months (95% CI 5.53–NR) versus 14.6 (95% CI 13.0–NR); p = 0.011 (Figure 4D). We did not detect an association between any of the other pathways presented in Figure 4A and PFS.
Patients were enrolled irrespective of PD-L1 status and PD-L1 expression did not correlate with clinical benefit (median PFS of 10.3 versus 14.6 months for PD-L1-positive and -negative, respectively; p = 0.56, Supplementary Figure 2). There were no Epstein-Barr virus (EBV)-positive and no microsatellite instability high (MSI-H) tumors in this cohort. The median tumor mutation burden (TMB) was 3.3 mut/mb (range 0.3 to 7.8, typical for mEG cancer) similar to previous series of mEG patients,3 and TMB was not associated with prolonged PFS. In addition, we found no association between depth or duration of response and degree of DNA copy number alterations or number of predicted strong clonal neoantigens (Supplementary Figure 3).
Thirteen of the 16 patients with detected tumor-matched baseline ctDNA alterations and who received an induction cycle of pembrolizumab and trastuzumab demonstrated a decline in ctDNA after the first dose and prior to initiation of chemotherapy (Supplementary Table 1). Of these 13, 10 patients were progression-free at 6 months. Among the 10 patients remaining on study with baseline detectable tumor-matched ctDNA alterations, 9 achieved durable ctDNA clearance.
Discussion
In this phase 2 study, the combination of pembrolizumab and trastuzumab with fluoropyrimidine and platinum chemotherapy was tested in patients with mEG cancer. The study reached its primary endpoint, with 26 of 37 (70%) patients progression-free at 6 months and 17% achieving a complete response, which is unprecedented for this tumor type. The 91% response rate and median OS of 27.2 months were also numerically superior compared to the 47% response rate and median OS of 16 months previously reported for chemotherapy plus trastuzumab, the current first-line standard.6 While treatment-related adverse events were observed in all patients, the frequency of chemotherapy-related and immunotherapy-related grade 3 or higher toxicities was similar to that reported for combinations of trastuzumab with chemotherapy6 and pembrolizumab with chemotherapy.8 In sum, the results suggest that the addition of pembrolizumab to trastuzumab and chemotherapy is safe and potentially synergistic in patients with mEG cancer.
To identify molecular features that predict for sensitivity or resistance to this promising investigational combination, we performed integrated analyses of tumor and blood samples when available. PD-L1 CPS was not predictive of outcome in this study population, with the caveat that baseline PD-L1 status was available in only 70% of patients. Using pre-treatment tissue and plasma-based DNA sequencing, we were able to recapitulate previous findings that patients with ERBB2 amplification had more durable responses to trastuzumab-based combination therapy than HER2-positive patients who lacked ERBB2 gene amplification by NGS.4,21 As it is often difficult to obtain sufficient tumor tissue in mEG patients for tumor-based NGS analysis, it was notable that detection of ERBB2 amplification was highly concordant between tumor and plasma-based NGS. Consistent with ctDNA data from other cancer types,22,27,28 tumor-based testing was more sensitive in a small number of patients, likely due to low tumor shedding of DNA into the plasma. Conversely, ERBB2 amplification was detected by plasma-based sequencing in two patients for whom inadequate tumor tissue was available for tumor-based NGS. Importantly, PFS was significantly associated with adjusted ERBB2 plasma copy number, but not with tissue NGS-based ERBB2 amplification, perhaps because plasma copy number better reflects tumor heterogeneity.
Central confirmation of HER2 status at MSK was not required prior to start of therapy, and re-testing of patients who were treated based on external results revealed variation between local and central testing in 3 patients. Variability between local and central testing may reflect the heterogeneity of HER2 expression in gastric cancer and has been previously reported in 23% of mEG patients.29 Failure to validate HER2 positivity centrally has been shown to be associated with less benefit from trastuzumab and chemotherapy; median OS for patients with centrally confirmed HER2 positivity was 30.7 versus 7.9 months in patients for whom secondary HER2 testing was negative; p < 0.0001.29 It is therefore possible that the lack of central confirmation of HER2 status prior to treatment initiation may have led to an underestimation of the activity of the pembrolizumab, trastuzumab, chemotherapy combination. Central confirmation would have, however, likely slowed patient accrual.
One notable observation from the trial was that new escape lesions were the first site of tumor progression in 54% of patients who initially responded but later developed disease progression. This is consistent with prior biomarker studies indicating that pre-existing tumor heterogeneity and selection for tumor clones lacking ERBB2 amplification or with co-occurring resistance mutations may be the mechanistic basis for acquired resistance to trastuzumab in most mEG patients.4 Further studies should analyze matched pre- and post-progression samples to identify the basis of acquired resistance to the pembrolizumab, trastuzumab, and chemotherapy combination and identify alternative treatment approaches to overcome or minimize drug resistance.
As the pembrolizumab-chemotherapy combination was recently shown to lead to a 49% response rate and 6.9 months median PFS in the first-line setting,8 the robust clinical benefit observed with the addition of trastuzumab reported here suggests that there was either a synergistic benefit to combining pembrolizumab with trastuzumab and chemotherapy, or that the population enrolled was more likely to benefit from one or more of the 4 agents administered than patients enrolled in prior studies. Notably, none of the treated patients had MSI-H- or EBV-positive tumors, two molecularly defined subsets of mEG cancer with a greater likelihood of response to anti-PD-L1 therapy.30,31 Therefore, given the evidence for synergy observed, future studies should seek to collect patient samples prior to and on therapy to determine if pembrolizumab increases immune cell engagement or enhances the effects of trastuzumab or chemotherapy through other mechanisms.10,11,32 Such correlative studies could also help determine whether the benefits of combining pembrolizumab, trastuzumab, and chemotherapy are limited to only a molecularly definable subset of patients.
Limitations of the study included its single-arm design, modest sample size, and inadequate baseline tissue for biomarker testing and sequencing in several patients. Despite these limitations, we believe that the 91% measurable disease response rate, 75% 6-month PFS rate, and median overall survival of 27.2 months observed in the current study strongly support the direct comparison of the pembrolizumab, trastuzumab and chemotherapy combination to the current standard of care first-line regimen of trastuzumab and chemotherapy for HER2 positive mEG within the context of a randomized clinical trial. The data reported here thus represent the basis for the ongoing randomized double-blind phase 3 KEYNOTE 811 trial (NCT03615326) of pembrolizumab versus placebo in combination with trastuzumab and chemotherapy.
Supplementary Material
Research in context.
Evidence before this study
We searched PubMed from inception until Jan 6, 2020 for clinical trials published in English assessing trastuzumab or pembrolizumab in esophagogastric (EG, or gastric, esophageal, or gastro-esophageal junction) cancer, using the search terms “trastuzumab” and “gastric cancer OR esophageal cancer,” then repeating the search by substituting “pembrolizumab” for “trastuzumab.” Following the results of the ToGA trial in 2010, trastuzumab plus fluoropyrimidine and platinum chemotherapy became the standard of care for HER2-positive metastatic EG (mEG) cancer. In the KEYNOTE-059 trial, pembrolizumab induced durable responses in 23% of patients with previously treated, programmed death ligand 1 (PD-L1)-positive mEG cancer. However, KEYNOTE-062 found no survival advantage for the combination of pembrolizumab and chemotherapy relative to first-line chemotherapy.
To inform our investigation of molecular and genetic correlates of response, we also searched for predictors of response and resistance to trastuzumab by adding the term “biomarker” to the search. Resistance has been associated with activation of the receptor tyrosine kinase/KRAS and PI3K pathways, while greater response correlates with degree of ERBB2 amplification in tumor and circulating tumor DNA (ctDNA).
Added value of this study
To our knowledge, this is the first study to evaluate the synergistic potential of pembrolizumab, trastuzumab, and chemotherapy for previously untreated mEG cancer. We also explored potential molecular determinants of response to inform future studies to identify subsets of patients most likely to benefit from this combination.
Implications of all the available evidence
The results of this study suggest that the addition of pembrolizumab to trastuzumab and chemotherapy is safe and may be more effective than either pembrolizumab or trastuzumab with chemotherapy in treating mEG cancer. The efficacy of this combination is currently being evaluated in the randomized double-blind phase 3 KEYNOTE 811 trial (NCT03615326).
Acknowledgments:
Our patients and caretakers who face this challenging disease for their trust and dedication to gastric cancer research. Pembrolizumab and clinical research funding was provided by Merck & Co. Biomarker analyses were funded by the NIH/NCI Cancer Center Support Grant P30 CA008748, the Marie-Josée and Henry R. Kravis Center for Molecular Oncology, the Robertson Foundation (grant to N.S.), and the Department of Defense Congressionally Directed Medical Research Program (CA 150646 to Y.Y.J.). Editorial support was provided by Jessica Moore at Memorial Sloan Kettering Cancer Center.
Declaration of Interests:
YYJ has received research funding from Boehringer Ingelheim, Bayer, Genentech/Roche, Bristol-Myers Squibb, Eli Lilly, and Merck and served on advisory boards for Merck Serono, Bristol-Myers Squibb, Eli Lilly, Pfizer, Bayer, Imugene, Merck, Daiichi-Sankyo, and AstraZeneca. SBM has received research funding from Genentech and travel expenses from Merck and Bayer. GYK has received honoraria and research funding from Merck, Bristol-Myers Squibb, and Pieris, and research funding from AstraZeneca, Zymeworks, and Daiichi Sankyo. DHI has received research funding from and served on advisory boards for Astellas, Eli Lilly, Pieris, and Taiho, and served on advisory boards for Astra-Zeneca, Amgen, Bayer, Bristol-Myers Squibb, and Roche. RJN and RBL are employees of Guardant Health, Inc. BST reports receiving honoraria and research funding from Genentech and Illumina and advisory board activities for Boehringer Ingelheim. DBS has consulted with/accepted honoraria from Pfizer, Loxo Oncology, Eli Lilly, Vivideon Therapeutics, Illumina and QED Therapeutics. JFH has received research funding from Bayer, Boehringer Ingelheim, and Eli Lilly and consulted/ accepted honoraria from Axiom Healthcare Strategies and WebMD. All other authors report no financial interests.
References
- 1.Bray F, Ferlay J, Soerjomataram I, Siegel RL, Torre LA, Jemal A. Global cancer statistics 2018: GLOBOCAN estimates of incidence and mortality worldwide for 36 cancers in 185 countries. CA Cancer J Clin 2018; 68: 394–424. [DOI] [PubMed] [Google Scholar]
- 2.Bartel M, Brahmbhatt B, Bhurwal A. Incidence of gastroesophageal junction cancer continues to rise: Analysis of Surveillance, Epidemiology, and End Results (SEER) database. J Clin Oncol 2019; 37: 40–40. [Google Scholar]
- 3.Cancer Genome Atlas Research Network, Analysis Working Group: Asan University, BC Cancer Agency, et al. Integrated genomic characterization of oesophageal carcinoma. Nature 2017; 541: 169–75. [DOI] [PMC free article] [PubMed] [Google Scholar]
- 4.Janjigian YY, Sanchez-Vega F, Jonsson P, et al. Genetic predictors of response to systemic therapy in esophagogastric cancer. Cancer Discov 2018; 8: 49–58. [DOI] [PMC free article] [PubMed] [Google Scholar]
- 5.Cancer Genome Atlas Research Network. Comprehensive molecular characterization of gastric adenocarcinoma. Nature 2014; 513: 202–9. [DOI] [PMC free article] [PubMed] [Google Scholar]
- 6.Bang Y-J, Van Cutsem E, Feyereislova A, et al. Trastuzumab in combination with chemotherapy versus chemotherapy alone for treatment of HER2-positive advanced gastric or gastro-oesophageal junction cancer (ToGA): a phase 3, open-label, randomised controlled trial. Lancet 2010; 376: 687–97. [DOI] [PubMed] [Google Scholar]
- 7.Fuchs CS, Doi T, Jang RW, et al. Safety and Efficacy of Pembrolizumab Monotherapy in Patients With Previously Treated Advanced Gastric and Gastroesophageal Junction Cancer: Phase 2 Clinical KEYNOTE-059 Trial. JAMA Oncol 2018; 4: e180013. [DOI] [PMC free article] [PubMed] [Google Scholar]
- 8.Tabernero J, Van Cutsem E, Bang Y-J, et al. Pembrolizumab with or without chemotherapy versus chemotherapy for advanced gastric or gastroesophageal junction (G/GEJ) adenocarcinoma: The phase III KEYNOTE-062 study. J Clin Oncol 2019; 37: LBA4007–LBA4007. [Google Scholar]
- 9.Loi S, Giobbie-Hurder A, Gombos A, et al. Pembrolizumab plus trastuzumab in trastuzumab-resistant, advanced, HER2-positive breast cancer (PANACEA): a single-arm, multicentre, phase 1b-2 trial. Lancet Oncol 2019; 20: 371–82. [DOI] [PubMed] [Google Scholar]
- 10.Stagg J, Loi S, Divisekera U, et al. Anti-ErbB-2 mAb therapy requires type I and II interferons and synergizes with anti-PD-1 or anti-CD137 mAb therapy. Proc Natl Acad Sci USA 2011; 108: 7142–7. [DOI] [PMC free article] [PubMed] [Google Scholar]
- 11.Chaganty BKR, Qiu S, Gest A, et al. Trastuzumab upregulates PD-L1 as a potential mechanism of trastuzumab resistance through engagement of immune effector cells and stimulation of IFNγ secretion. Cancer Lett 2018; 430: 47–56. [DOI] [PMC free article] [PubMed] [Google Scholar]
- 12.zum Büschenfelde CM, Hermann C, Schmidt B, Peschel C, Bernhard H. Antihuman epidermal growth factor receptor 2 (HER2) monoclonal antibody trastuzumab enhances cytolytic activity of class I-restricted HER2-specific T lymphocytes against HER2-overexpressing tumor cells. Cancer Res 2002; 62: 2244–7. [PubMed] [Google Scholar]
- 13.Taylor C, Hershman D, Shah N, et al. Augmented HER-2 specific immunity during treatment with trastuzumab and chemotherapy. Clin Cancer Res 2007; 13: 5133–43. [DOI] [PubMed] [Google Scholar]
- 14.Mortenson ED, Park S, Jiang Z, Wang S, Fu Y-X. Effective anti-neu-initiated antitumor responses require the complex role of CD4+ T cells. Clin Cancer Res 2013; 19: 1476–86. [DOI] [PMC free article] [PubMed] [Google Scholar]
- 15.Park S, Jiang Z, Mortenson ED, et al. The therapeutic effect of anti-HER2/neu antibody depends on both innate and adaptive immunity. Cancer Cell 2010; 18: 160–70. [DOI] [PMC free article] [PubMed] [Google Scholar]
- 16.Cheng DT, Mitchell TN, Zehir A, et al. Memorial Sloan Kettering-Integrated Mutation Profiling of Actionable Cancer Targets (MSK-IMPACT): A Hybridization Capture-Based Next-Generation Sequencing Clinical Assay for Solid Tumor Molecular Oncology. J Mol Diagn 2015; 17: 251–64. [DOI] [PMC free article] [PubMed] [Google Scholar]
- 17.Zehir A, Benayed R, Shah RH, et al. Mutational landscape of metastatic cancer revealed from prospective clinical sequencing of 10,000 patients. Nat Med 2017; 23: 703–13. [DOI] [PMC free article] [PubMed] [Google Scholar]
- 18.Niu B, Ye K, Zhang Q, et al. MSIsensor: microsatellite instability detection using paired tumor-normal sequence data. Bioinformatics 2014; 30: 1015–6. [DOI] [PMC free article] [PubMed] [Google Scholar]
- 19.Middha S, Zhang L, Nafa K, et al. Reliable Pan-Cancer Microsatellite Instability Assessment by Using Targeted Next-Generation Sequencing Data. JCO Precis Oncol 2017; 2017. DOI: 10.1200/PO.17.00084. [DOI] [PMC free article] [PubMed] [Google Scholar]
- 20.Lanman RB, Mortimer SA, Zill OA, et al. Analytical and Clinical Validation of a Digital Sequencing Panel for Quantitative, Highly Accurate Evaluation of Cell-Free Circulating Tumor DNA. PLoS ONE 2015; 10: e0140712. [DOI] [PMC free article] [PubMed] [Google Scholar]
- 21.Maron SB, Chase LM, Lomnicki S, et al. Circulating tumor DNA sequencing analysis of gastroesophageal adenocarcinoma. Clin Cancer Res 2019; 25: 7098–112. [DOI] [PMC free article] [PubMed] [Google Scholar]
- 22.Siravegna G, Sartore-Bianchi A, Nagy RJ, et al. Plasma HER2 (ERBB2) Copy Number Predicts Response to HER2-targeted Therapy in Metastatic Colorectal Cancer. Clin Cancer Res 2019; 25: 3046–53. [DOI] [PubMed] [Google Scholar]
- 23.Liu S, Gӧnen M, Stadler ZK, et al. Cellular localization of PD-L1 expression in mismatch-repair-deficient and proficient colorectal carcinomas. Mod Pathol 2019; 32: 110–21. [DOI] [PMC free article] [PubMed] [Google Scholar]
- 24.Bartley AN, Washington MK, Colasacco C, et al. HER2 testing and clinical decision making in gastroesophageal adenocarcinoma: guideline from the college of american pathologists, american society for clinical pathology, and the american society of clinical oncology. J Clin Oncol 2017; 35: 446–64. [DOI] [PubMed] [Google Scholar]
- 25.Cerami E, Gao J, Dogrusoz U, et al. The cBio cancer genomics portal: an open platform for exploring multidimensional cancer genomics data. Cancer Discov 2012; 2: 401–4. [DOI] [PMC free article] [PubMed] [Google Scholar]
- 26.Gomez-Martin C, Plaza JC, Pazo-Cid R, et al. Level of HER2 gene amplification predicts response and overall survival in HER2-positive advanced gastric cancer treated with trastuzumab. J Clin Oncol 2013; 31: 4445–52. [DOI] [PubMed] [Google Scholar]
- 27.Offin M, Chabon JJ, Razavi P, et al. Capturing Genomic Evolution of Lung Cancers through Liquid Biopsy for Circulating Tumor DNA. J Oncol 2017; 2017: 4517834. [DOI] [PMC free article] [PubMed] [Google Scholar]
- 28.Razavi P, Li BT, Brown DN, et al. High-intensity sequencing reveals the sources of plasma circulating cell-free DNA variants. Nat Med 2019; 25: 1928–37. [DOI] [PMC free article] [PubMed] [Google Scholar]
- 29.Lordick F, Haffner I, Luber B, et al. Abstract 2615: Heterogeneity of HER2 expression in gastric cancer (GC) leads to high deviation rates between local and central testing and hampers efficacy of anti-HER2 therapy: Survival results from the VARIANZ study. In: Clinical Research (Excluding Clinical Trials). American Association for Cancer Research, 2018: 2615–2615. [Google Scholar]
- 30.Kim ST, Cristescu R, Bass AJ, et al. Comprehensive molecular characterization of clinical responses to PD-1 inhibition in metastatic gastric cancer. Nat Med 2018; 24: 1449–58. [DOI] [PubMed] [Google Scholar]
- 31.First-Line Pembrolizumab Versus Chemotherapy in Patients | ESMO. https://www.esmo.org/Oncology-News/First-Line-Pembrolizumab-Versus-Chemotherapy-in-Patients-with-Advanced-G-GEJ-Cancer-Demonstrates-Similar-Survival-and-HRQoL (accessed Jan 7, 2020).
- 32.Dong W, Wu X, Ma S, et al. The Mechanism of Anti-PD-L1 Antibody Efficacy against PD-L1-Negative Tumors Identifies NK Cells Expressing PD-L1 as a Cytolytic Effector. Cancer Discov 2019; 9: 1422–37. [DOI] [PMC free article] [PubMed] [Google Scholar]
Associated Data
This section collects any data citations, data availability statements, or supplementary materials included in this article.