Figure 2.
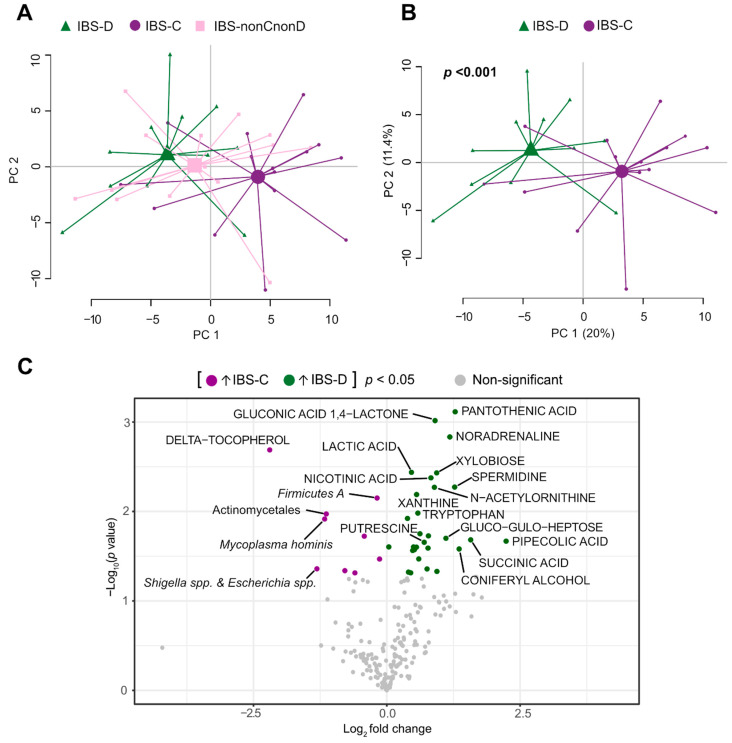
Faecal microbiota and metabolite profiles of IBS patients based on the predominant bowel habit. Principal component analysis (PCA) score scatter plot based on faecal bacteria and metabolites showing (A) IBS-D (n = 11, green triangles), IBS-C (n = 15, purple circles) and IBS-nonCnonD (n = 14, pink squares) patients and (B) patients with the predominant bowel habit, IBS-D and IBS-C. The p value depicts the statistical significance of the distance between the centroids (scores averages) of the groups. (C) Volcano plot illustrating statistical significance versus mean fold change of 54 bacteria (probe intensity) and 155 metabolites (signal intensity) between IBS-D patients respect to IBS-C patients (IBS-D/IBS-C). Each dot corresponds to a bacteria probe or metabolite signal. Variables increased in IBS-D are coloured in green (n = 29), while decreased variables compared to IBS-C are coloured in purple (n = 9). Mean fold change is shown as log2. p values are shown as –log10; p values < 0.05 are coloured; non-significant p values are shown in grey. Student’s t-test was used to identify differences between the groups. Not all variables were labelled, only some bacteria and metabolites with log2 (IBS/H) < −1 and >+1 and p values < 0.05.

