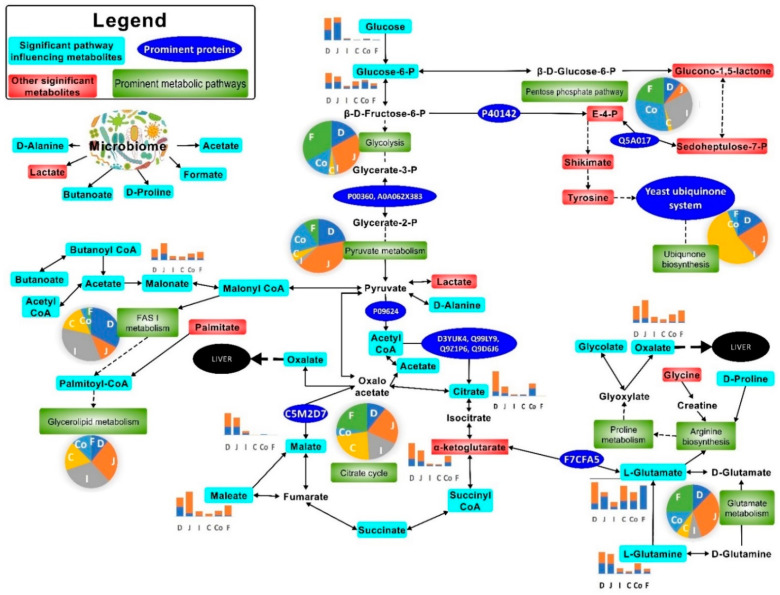
Figure 7.
Most prominent metabolic activities in the mouse gut upon Cryptosporidium infection. The pie charts indicate the relative impact of pathways in the duodenum (D), jejunum (J), ileum (I), caecum (C), colon (Co), and faeces (F). The bar graphs show perturbed metabolites in uninfected ( ) and Cryptosporidium (
 ) infected mice. Note: Please refer to Figure S8 for a more descriptive pathway chart.

