Abstract
This article examines the effect of the coronavirus disease 2019 (COVID-19) pandemic on electricity markets across select Canadian provinces, using available data. Using high-frequency electricity data, we find electricity demand declined by roughly 10 percent in Ontario and by about 5 percent in Alberta, British Columbia, and New Brunswick. On the supply side, in Alberta we find reductions from some natural gas plants and an increase in net generation from the oil sands region, whereas Ontario sees an increase in net electricity exports. Policy implications include potential rate impacts as a result of fixed charges spread over a smaller rate base, the potential use of electricity data as a real-time economic indicator during the pandemic, and a call to arms to make electricity data across all Canadian provinces more readily available.
Keywords: COVID-19, data availability, electricity demand, generation
Abstract
Les auteurs examinent l’effet de la pandémie de COVID-19 sur les marchés de l’électricité dans certaines provinces canadiennes en s’appuyant sur les données disponibles. Leur analyse des données relatives à l’électricité à haute fréquence révèle que la demande d’électricité a diminué d’environ 10 % en Ontario, moins dans les autres provinces étudiées. Du côté de l’offre, en Alberta, ils observent que la production de certaines centrales au gaz naturel a diminué, mais que la production nette à partir des installations des sables bitumineux a augmenté, tandis que l’Ontario a enregistré une augmentation des exportations nettes. Les répercussions de ces constats sur les politiques sont notamment leur incidence potentielle sur les tarifs en raison de frais fixes répartis sur une base tarifaire plus restreinte, l’utilisation potentielle des données sur l’électricité comme indicateur économique en temps réel pendant la pandémie et un cri du cœur pour que soit facilité l’accès aux données sur l’électricité dans toutes les provinces canadiennes.
Mots clés : COVID-19, demande d’électricité, disponibilité des données, génération
Introduction
The coronavirus disease 2019 (COVID-19) pandemic and related government policy has produced the largest mass shutdown in human history. At its peak, it is estimated that more than four billion people globally were restricted in their mobility and economic activity, with induced economic slowdowns affecting many more than that. Initial assessments as to the extent of the economic implications of these restrictions, however, have been limited by the available data. Researchers and policy-makers have turned to non-traditional “real-time” data—for example, OpenTable dining reservations, Apple Maps routing requests, and Google Mobility reports—to gain a better understanding of the shutdowns in near-real time.
Electricity data, recorded hourly and published immediately in many jurisdictions, present an opportunity to get feedback on economic activity in real time. In this article, we provide an initial assessment of the effect of COVID-19 on electricity markets in Canada. In doing so, we provide a glimpse of the magnitude of the initial shutdown’s effect and propose a tool to identify recovery in real time empirically. We argue that the limits on our analysis highlight the value of comprehensive and timely electricity data, which are currently not available for most of Canada.
To determine the effect of COVID-19 on electricity markets, we must first identify the appropriate counterfactual: how would electricity markets have evolved in the absence of COVID-19? To do so, we use data on electricity demand and supply at the hourly level from 2016 to the present. We use a fixed-effects estimation, controlling for key factors of electricity demand: time of day, day of week, week of year, and temperature, essentially comparing electricity demand for an hour during COVID-19 with that for a similar hour in a similar week of the year, after controlling for temperature. We also use Alberta’s competitive wholesale market as well as transmission-connected generation in Ontario to test for supply-side responses, using a fixed-effects approach on generation by plant type (Alberta) and plant fuel (Ontario).
Our results show that electricity demand fell by about 5 percent relative to expected levels in Alberta, New Brunswick, and British Columbia and by about 10 percent in Ontario after the introduction of economic shutdowns in each province. As of time of writing, electricity demand remains below typical levels, such that recovery from the economic shock of the pandemic remains incomplete. Looking more closely at industrial demand in Ontario, where data are available, we see heterogeneous effects by sector, with pronounced declines in the motor vehicle and iron and steel manufacturing sectors.
On the supply side, we find little impact of the COVID-19–related shutdowns on the supply mix in Ontario, but we do find statistically significant changes in trade flows, indicating that the impact of the decrease in domestic demand is mostly being shipped out of province. In Alberta, although coal generation continues to fall, we show that the pandemic led to a shift away from natural gas (with the exception of must-run oil sands cogeneration units) and reductions in net imports with no statistically significant effect of COVID-19 on coal generation.
There has been a rapid proliferation of articles examining the effect of COVID-19 on electricity demand outside Canada.1 Our article adds to these contributions in two ways. First, our article is unique in its focus on Canada, which allows us to draw more accurate implications for Canadian policy-makers. We note in our concluding discussion the challenge of analyzing electricity markets in Canada because of a lack of publicly available data outside a few select provinces and hope, among other things, that this article serves as impetus to improve data availability. Second, we consider changes not only to the demand side of electricity markets but also to the supply side. Our findings highlight the degree to which trends in the shifting mix of electricity supply are being affected by the COVID-19 pandemic.
Data
Electricity data are not as readily available across Canada as in other jurisdictions. In the United States, data are available at the balancing authority (BA) level for all 71 BAs in the United States.2 In Europe, electricity data are available in real time across the continent. In Canada, however, hourly electricity demand data are only publicly available in near real time for four provinces: British Columbia, Alberta, Ontario, and New Brunswick.3 Unlike in the United States and Europe, detailed demand data in Canada are not aggregated or standardized in a central repository and made publicly available. Supply data are even more limited.
For our analysis, we consider the effects of COVID-19 on electricity demand for the four provinces mentioned. On the supply side, we restrict our analysis to Alberta and Ontario, again because of data availability. An in-depth study of Alberta, however, is warranted because it is undergoing more consequential changes in its electricity system relative to other regions in Canada.4
The electricity demand data consist of hourly observations of total system load by BA for each hour over 1 January 2016 to 10 June 2020. Data are sourced from the BC Hydro Power Authority (British Columbia), the Alberta Electricity System Operator (Alberta), the Independent Electric System Operator (Ontario), and NB Power (New Brunswick) and accessed via NRGStream, a data aggregation service.5 Load data are a measure of electric demand drawn from the grid and include all classes of demand: residential, commercial, farm, and industrial. The data we have selected measure domestic demand, excluding any draw from exports. We merge electricity data with historical weather data from Environment Canada (Canada 2019). We construct a temperature variable for each province and hour in our sample by taking the average hourly temperature of all weather stations within 20 kilometres of the largest city in the province. Table 1 presents summary statistics for minimum, mean, and maximum hourly demand and temperature, by province. British Columbia and Alberta have similarly sized electricity systems; Ontario’s peak demand is substantially larger than the other three provinces and New Brunswick’s demand is significantly smaller. Temperature ranges considerably within each province, highlighting the importance of temperature controls in our electricity demand estimation.
Table 1:
Summary Statistics of Demand and Temperature, 2016–2020
| Province | Hourly Electric Demand (MW), Mean (SD) | Hourly Temperature (°C) |
|
|---|---|---|---|
| Mean | Range, Min-Max | ||
| British Columbia | 7,240 (1,180) | 10.4 | –7.3 to 28.9 |
| Alberta | 9,484 (843) | 4.1 | –32.3 to 36.5 |
| Ontario | 15,365 (2,308) | 9.0 | –24.3 to 34.7 |
| New Brunswick | 1,627 (407) | 5.6 | –24.1 to 34.1 |
Sources: BC Hydro (2020), AESO (2020b), IESO (2020a), NB Power (2020), and Environment Canada (2020). Electricity data accessed via NRGStream.
On the supply side, we use plant-level data for Alberta sourced either directly from the Alberta Electricity System Operator or, where noted, via NRGStream. Supply data for Ontario are accessed directly from the IESO (Ontario) and consist of hourly generation by fuel type. The two provinces differ considerably in their supply mixes (Table 2). Alberta supply is predominantly fossil fuel generation, with the respective shares of natural gas and coal shifting in recent years. Ontario is dominated by nuclear generation, followed by hydroelectric sources.
Table 2:
Summary Statistics for Supply Mix by Fuel Type, Select Years
| Fuel Type | Alberta, % |
Ontario, % |
||||
|---|---|---|---|---|---|---|
| 2016 | 2019 | 2020 YTD | 2016 | 2019 | 2020 YTD | |
| Coal | 48.1 | 33.5 | 28.6 | — | — | — |
| Nuclear | — | — | — | 61.3 | 61.3 | 60.1 |
| Natural gas | 41.3 | 56.4 | 58.9 | 8.7 | 6.7 | 5.1 |
| Hydro | 2.2 | 2.4 | 2.0 | 23.6 | 24.3 | 25.5 |
| Wind | 5.5 | 4.9 | 7.5 | 6.1 | 7.5 | 9.0 |
| Other | 2.9 | 2.7 | 3.0 | 0.3 | 0.2 | 0.2 |
Notes: Includes all transmission-connected generation (excludes distribution-connected generation). 2020 YTD values are through 31 May 2020. YTD = year to date.
Sources: AESO (2020b) and IESO (2020a); authors’ calculations.
Methods
We identify the effect of COVID-19 on electricity demand or supply by comparing the current (COVID-19) period with outcomes in the recent past. Specifically, we estimate a fixed-effects regression controlling for predictable patterns in electricity demand or supply through the course of the day, week, and year, as well as for temperature effects.
Our main regression equation, estimated separately by province, is as follows:
| (1) |
where h refers to hour of the day, d refers to day of the week, w refers to week of the year, and y refers to year. We include three sets of dummy variables to account for predictable patterns in electricity demand at different temporal scales. First, it includes dummy variables for hour of day (hourh) interacted with a weekday dummy variable (weekdayd) to flexibly allow for a different relationship between hour of day on weekdays versus weekends and holidays.6 Second, it includes a set of week-of-year fixed effects (weekw) to control for predictable patterns in the seasonal shape of demand not fully reflected through temperature. These patterns can be attributed to differences in seasonal activities and to differences in daylight. Last, it includes year fixed effects (yeary) to control for time trends in province-specific system load.
Temperature controls enter non-linearly. It is well known that electricity demand exhibits a U-shaped pattern with respect to temperature (Apadula et al. 2012; Henley and Peirson 1997), with higher demand at both extreme cold and extreme hot temperatures. In Canada, the low point for electricity demand occurs at roughly 14 degrees Celsius (Rivers and Shaffer 2020). Accordingly, we use the concept of heating and cooling degrees as controls in our analysis, with a 14 degree base. A cooling degree (CDD) is the number of degrees above a neutral temperature, as a proxy for energy demand required for cooling. A heating degree (HDD) is the opposite—the absolute number of degrees below the same neutral point, used as a proxy for the need for heating. In our regression, we include heating and cooling degrees and their squares for temperature controls to allow for a further non-linear relationship with load.7
The coefficients of interest in our regression are associated with the variable CovidDaydwy. CovidDaydwy is a vector of dummy variables equal to one where the date identified by dwy falls during the calendar dates during the COVID-19 period from 11 March to present day (14 June 2020).8 Thus, the coefficient βdwy is a vector containing one entry for each of the days during the COVID-19 period. These absorb any unexplained residuals on individual days during the COVID-19 period. βdwy can thus be interpreted as the effect of the COVID-19 pandemic on electricity demand.9
Our approach will recover an unbiased estimate of the effect of COVID-19 on electricity demand provided our controls and fixed effects control for observed and unobserved demand shocks that are potentially correlated with the onset of COVID-19. We believe this is likely to be the case. The week-of-year fixed effects ensure that we condition on seasonal changes in demand that are likely to confound the effect of COVID-19. Likewise, because COVID-19 began during a seasonal transition, our temperature variable adjusts for changes in demand that are due to changes in temperature. By also controlling for annual load growth, our regressions should recover an unbiased estimate of the effect of COVID-19 on electricity demand.
We follow a similar approach to estimate the impacts of COVID-19 on the supply mix. We use supply data by fuel, plant type, or both as well as trade flows as the dependent variable in a set of regressions structured as shown in Equation (1), although in this case only for available data for Alberta and Ontario. This will identify the daily effect of the COVID-19 shock on generation by fuel type and trade flows as well as revealing additional information about the impact of COVID-19 on oil sands activity.
Results
Demand
We present our results graphically. Figure 1 plots the estimated daily fixed effects for each CovidDayt, which can be interpreted as the percentage difference between expected and actual daily demand, having controlled for year, week, day, hour, and temperature effects. In the figure, solid lines represent seven-day moving averages for coefficients of daily fixed effects during the COVID-19 period from Equation 1.
Figure 1:
Daily Electricity Demand Relative to Expected Demand During COVID-19: (a) British Columbia, (b) Alberta, (c) Ontario, and (d) New Brunswick
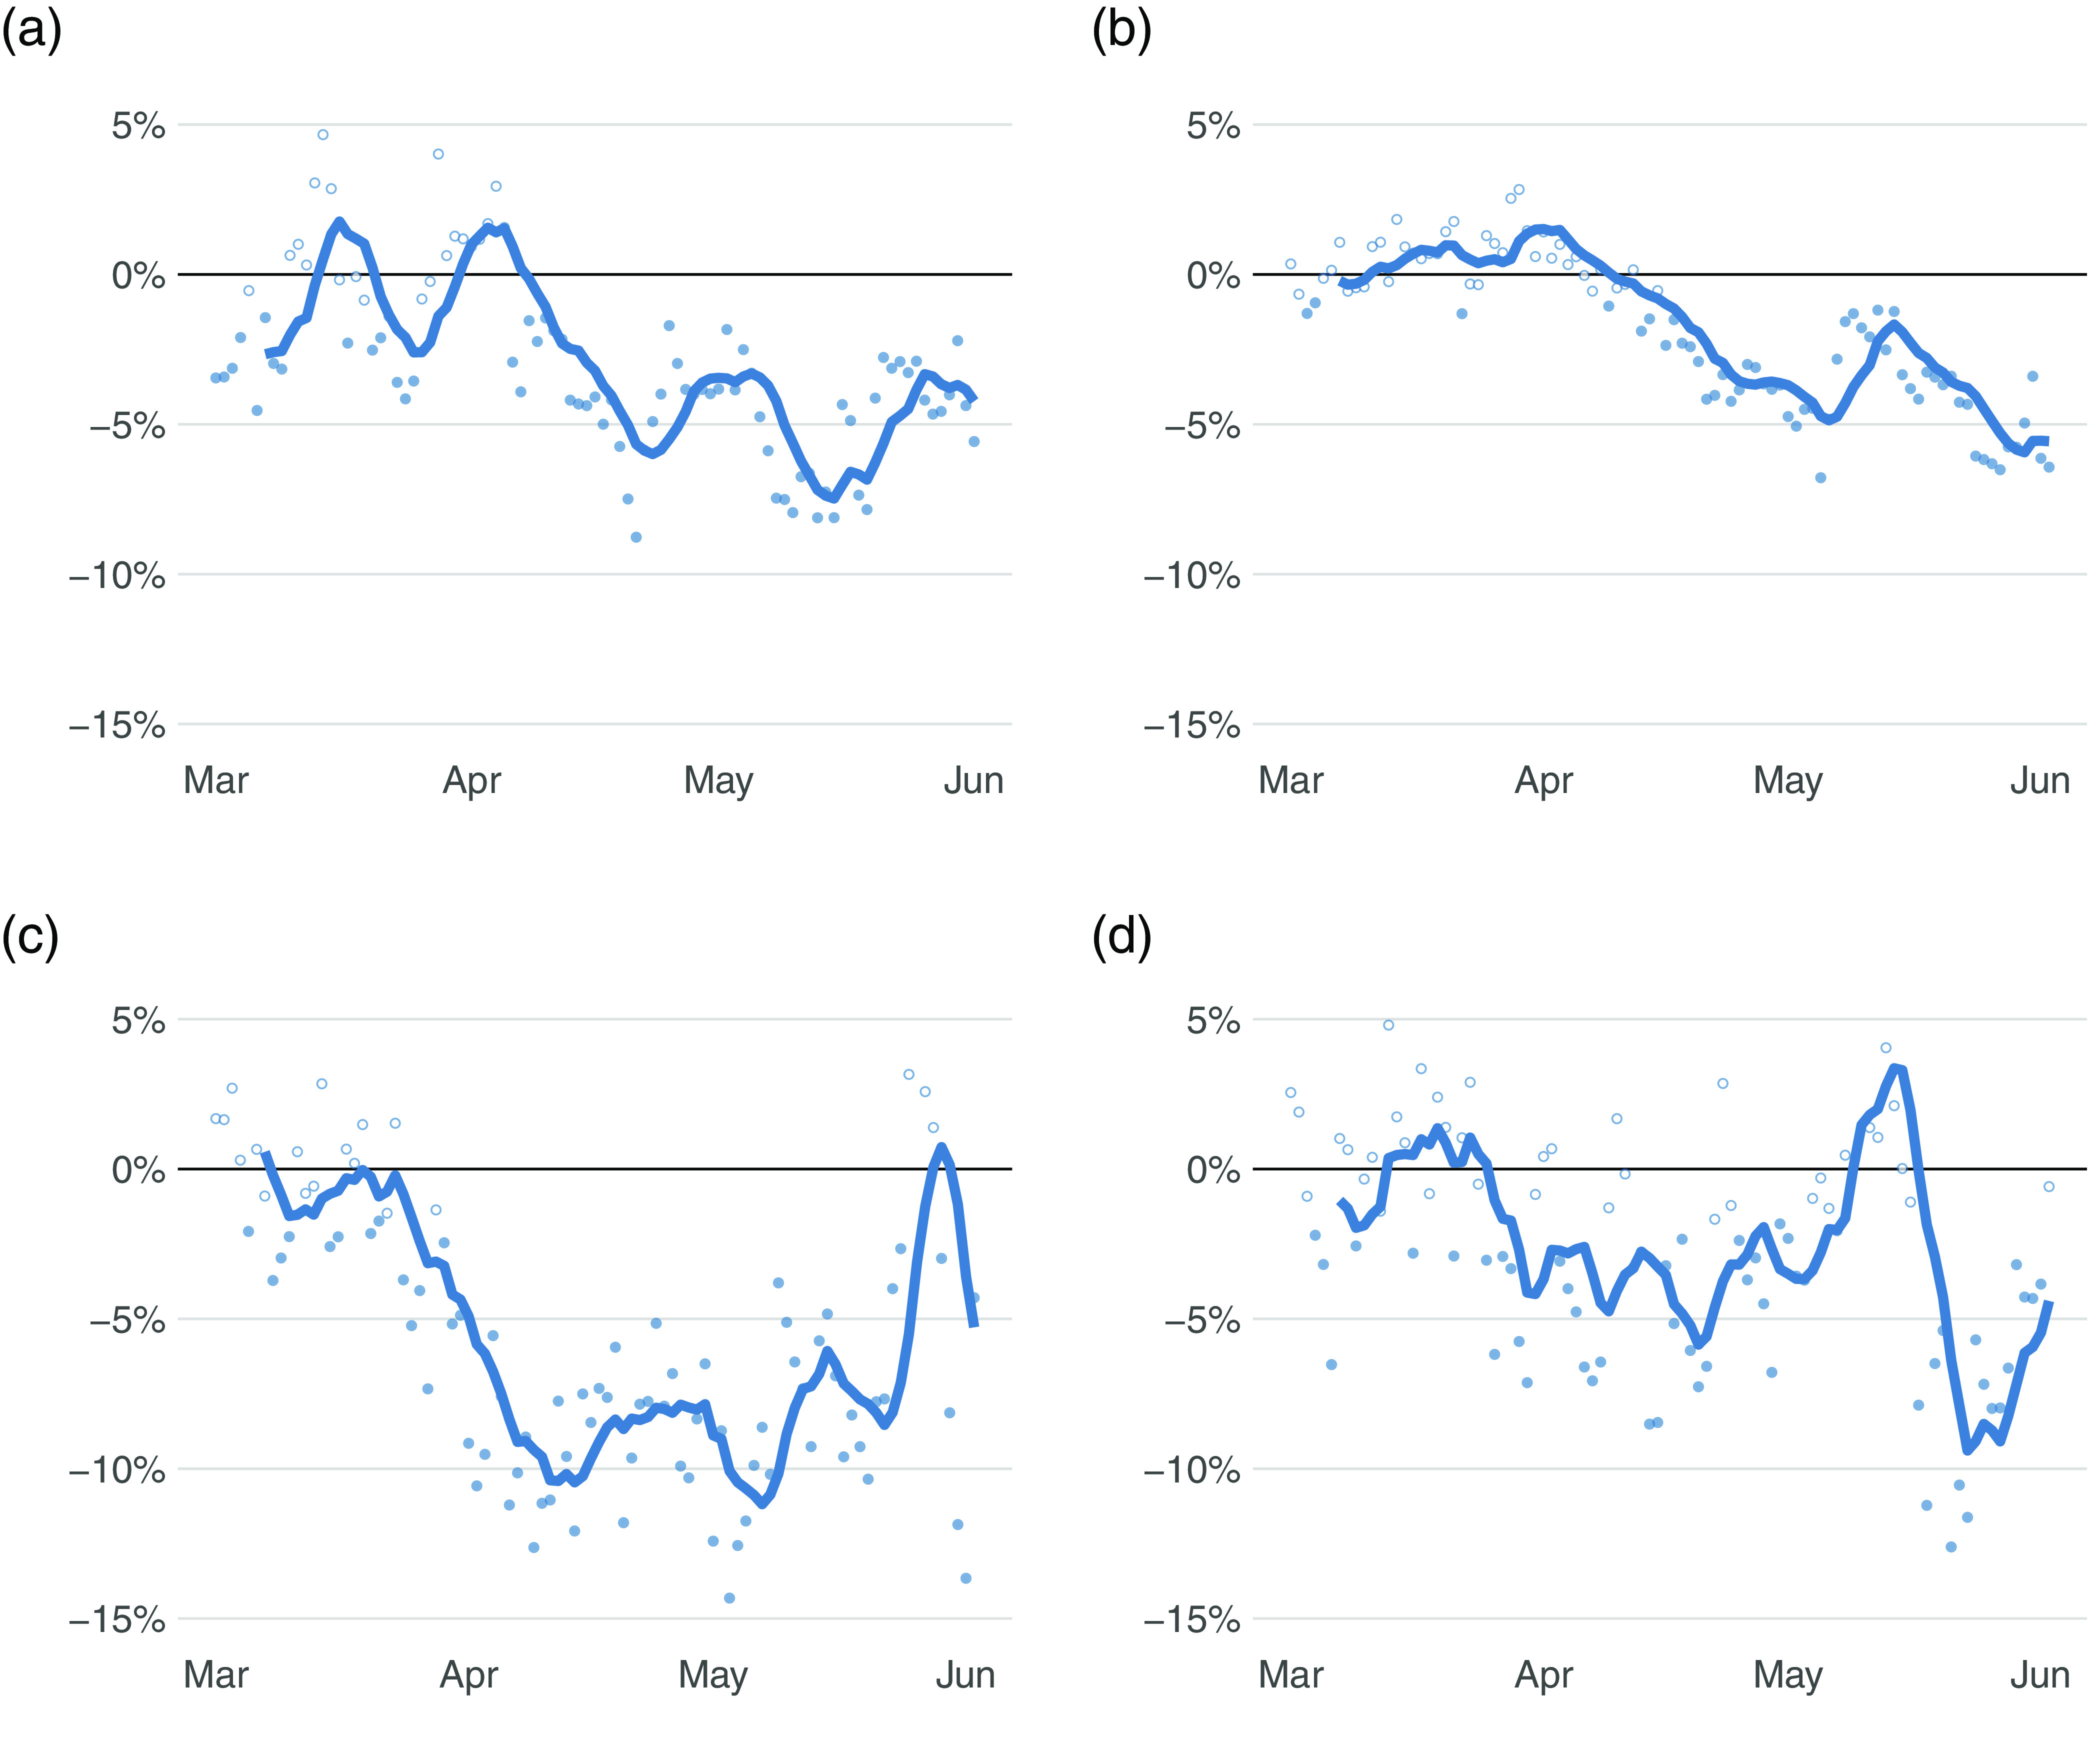
Notes: Solid lines represent seven-day moving averages for coefficients of daily fixed effects during the COVID-19 period from Equation (1). Individual dots are the daily fixed-effects coefficients from Equation (1), with solid dots indicating that we can reject the one-sided null hypothesis that the estimate is greater than zero at the 5 percent significance level. COVID-19 = coronavirus disease 2019.
Sources: AESO (2020b), BC Hydro (2020), IESO (2020a), NB Power (2020), and Environment Canada (2020); authors’ calculations.
The largest decline in electricity demand is seen in Ontario, falling roughly 10 percent at its peak decline. The other provinces’ declines are more modest, at closer to 5 percent excluding a few outlier events. For comparison, Burlig, Cicala, and Sudarshan (2020) find that aggregate US electricity demand fell 8 percent during the same COVID-19 period, whereas European countries with more stringent lockdown measures such as France, Spain, and Italy saw their electricity demand decline by 20, 25, and 28 percent, respectively. Less hard-hit Norway experienced virtually no reduction in electricity demand. There are also differences in the timing of noticeable declines, with Alberta’s decline appearing at least two weeks after the initial declines in Ontario and New Brunswick.
Interpreting the different provincial results requires more study, but we note a few plausible hypotheses for the observed differences. The first relates directly to the severity of the pandemic and associated response. Ontario, showing the largest decline in electricity demand in Figure 1, has also been the hardest hit by COVID-19 in terms of total cases and deaths of the four studied provinces. Seeing the rising caseload, Ontario moved earlier to impose some of itis shutdown measures, with restaurant closures (excluding takeout) beginning on 16 March 2020, whereas New Brunswick, British Columbia, and Alberta put similar measures in place later: on 19 March, 20 March, and 27 March, respectively (Breton and Tabbara 2020).
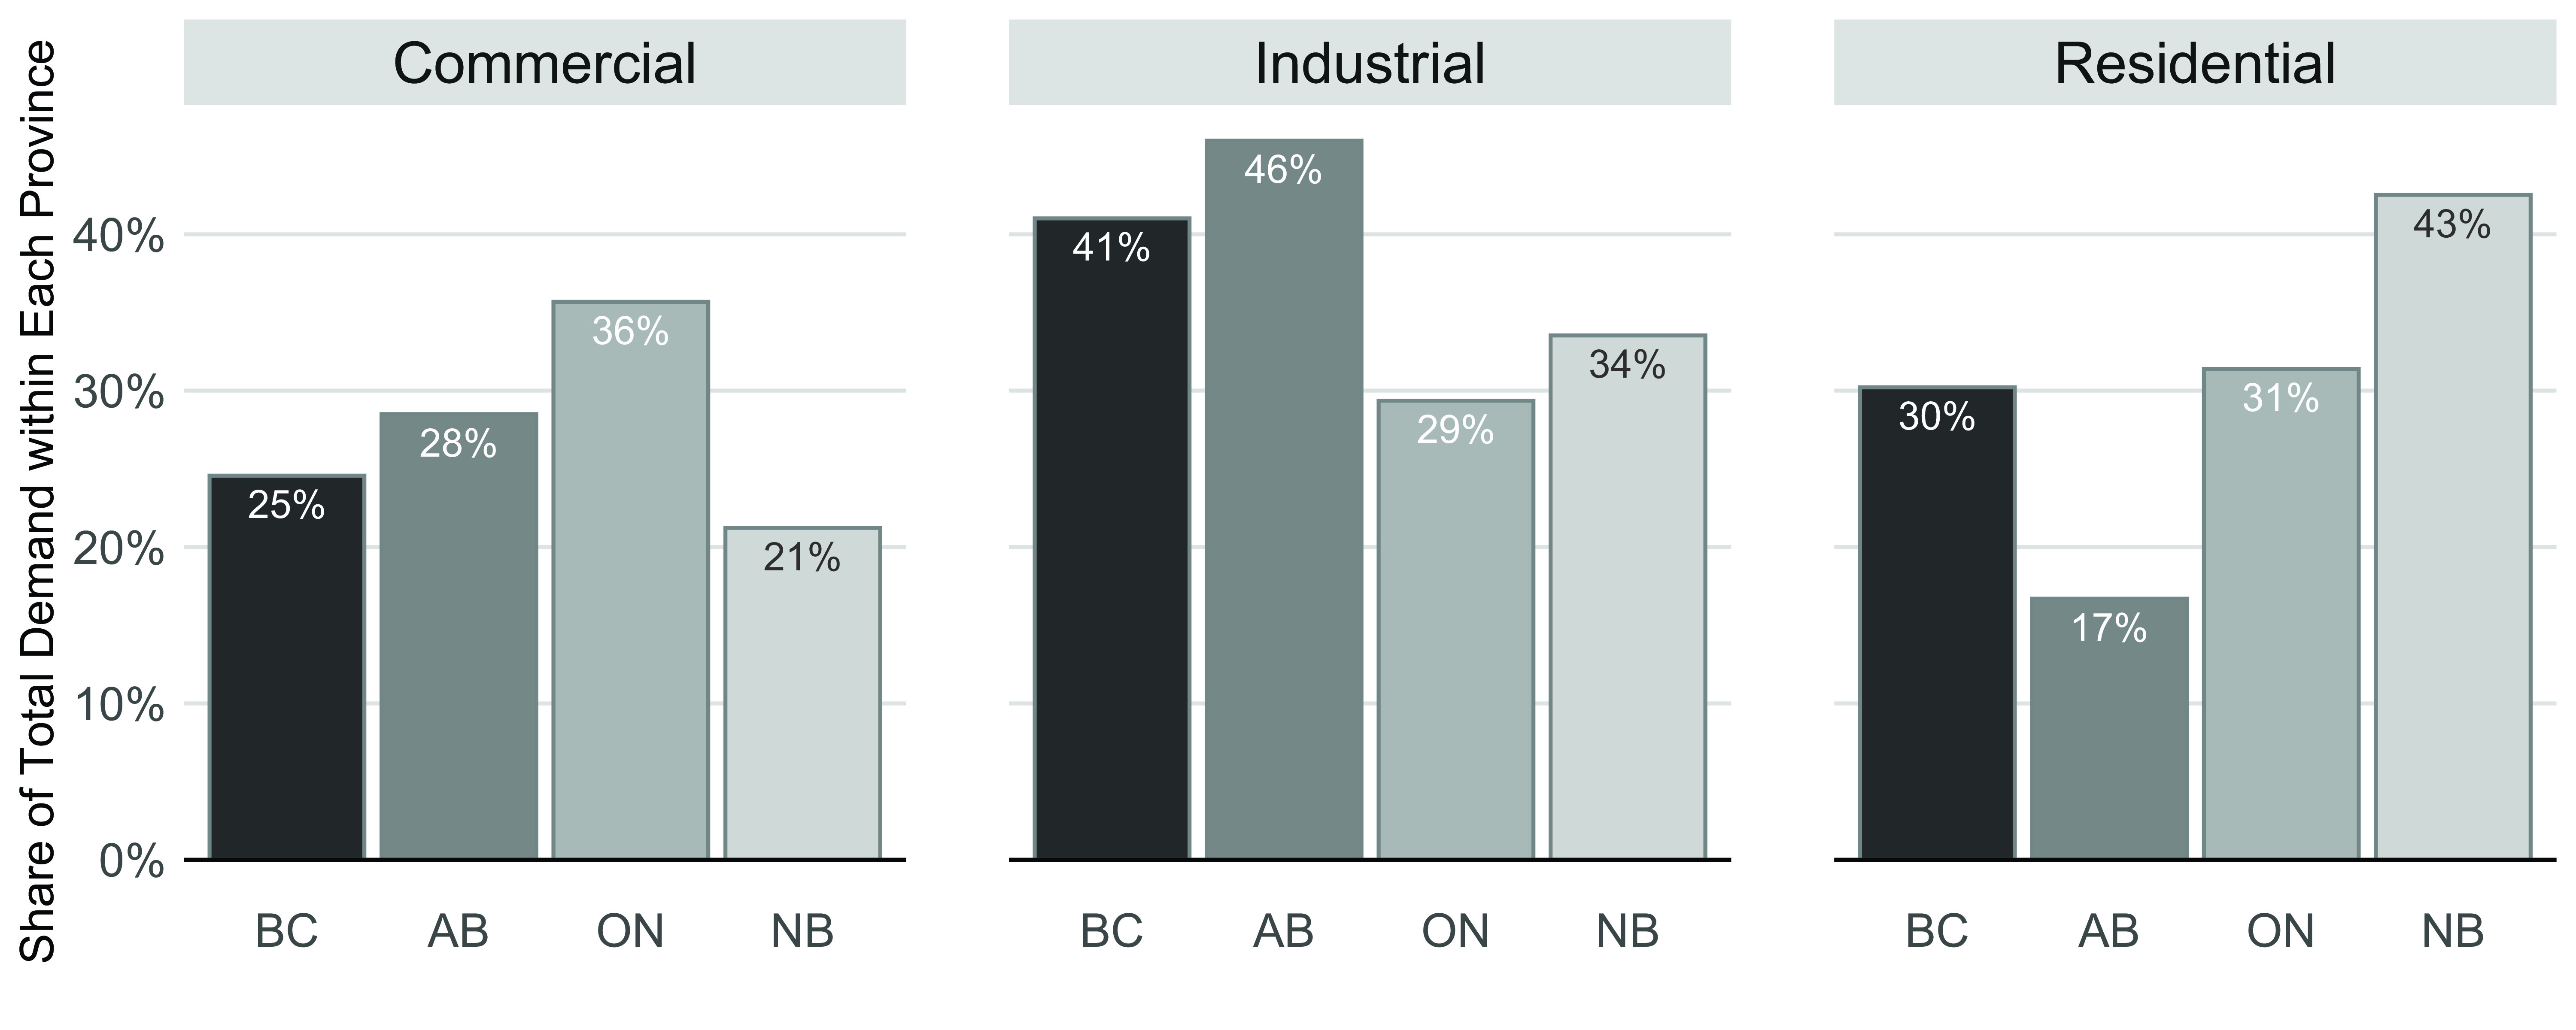
The second possible explanation is differences across the provinces in the composition of electricity usage. Figure 2 shows the shares of annual electricity demand by the three main customer classes: residential, commercial, and industrial. Ontario stands out as having a much larger share of its total load from the commercial class. It is within this class, made up of small businesses, manufacturers, and light industry, that we would expect to see the largest decline in activity from the shutdown measures and consequently the largest decline in electricity demand, whereas residential demand has been shown to be rising during the pandemic as more people work from home (Hinson 2020).
Figure 2:
Shares of Electricity Demand by Customer Class
Source: Statistics Canada Table 25-10-0030; authors’ calculations.
Last, differences in the composition and response of industrial demand can play a large role in the heterogeneity of provincial responses. In Alberta, the major economic and energy-intensive activity of the oil sands continued largely unchanged during the early stages of the shutdown.10 However, as oil prices declined to extremely low levels in April, production started to decline in Alberta, with many companies announcing production shut-ins. This coincides with the delayed decline in overall Alberta electric demand seen in Figure 1. In Ontario, where hourly industrial demand data are available by select sectors, we see pronounced declines in some sectors, with limited response in others. Motor vehicle manufacturing, playing a much larger role in Ontario’s economy than in those of the other provinces, shows the most stark decline in the data, falling by more than 60 percent from its pre-COVID 2020 levels (Figure 3).11
Figure 3 .
Industrial Electricity Demand in Ontario by Sector, 2016–2020
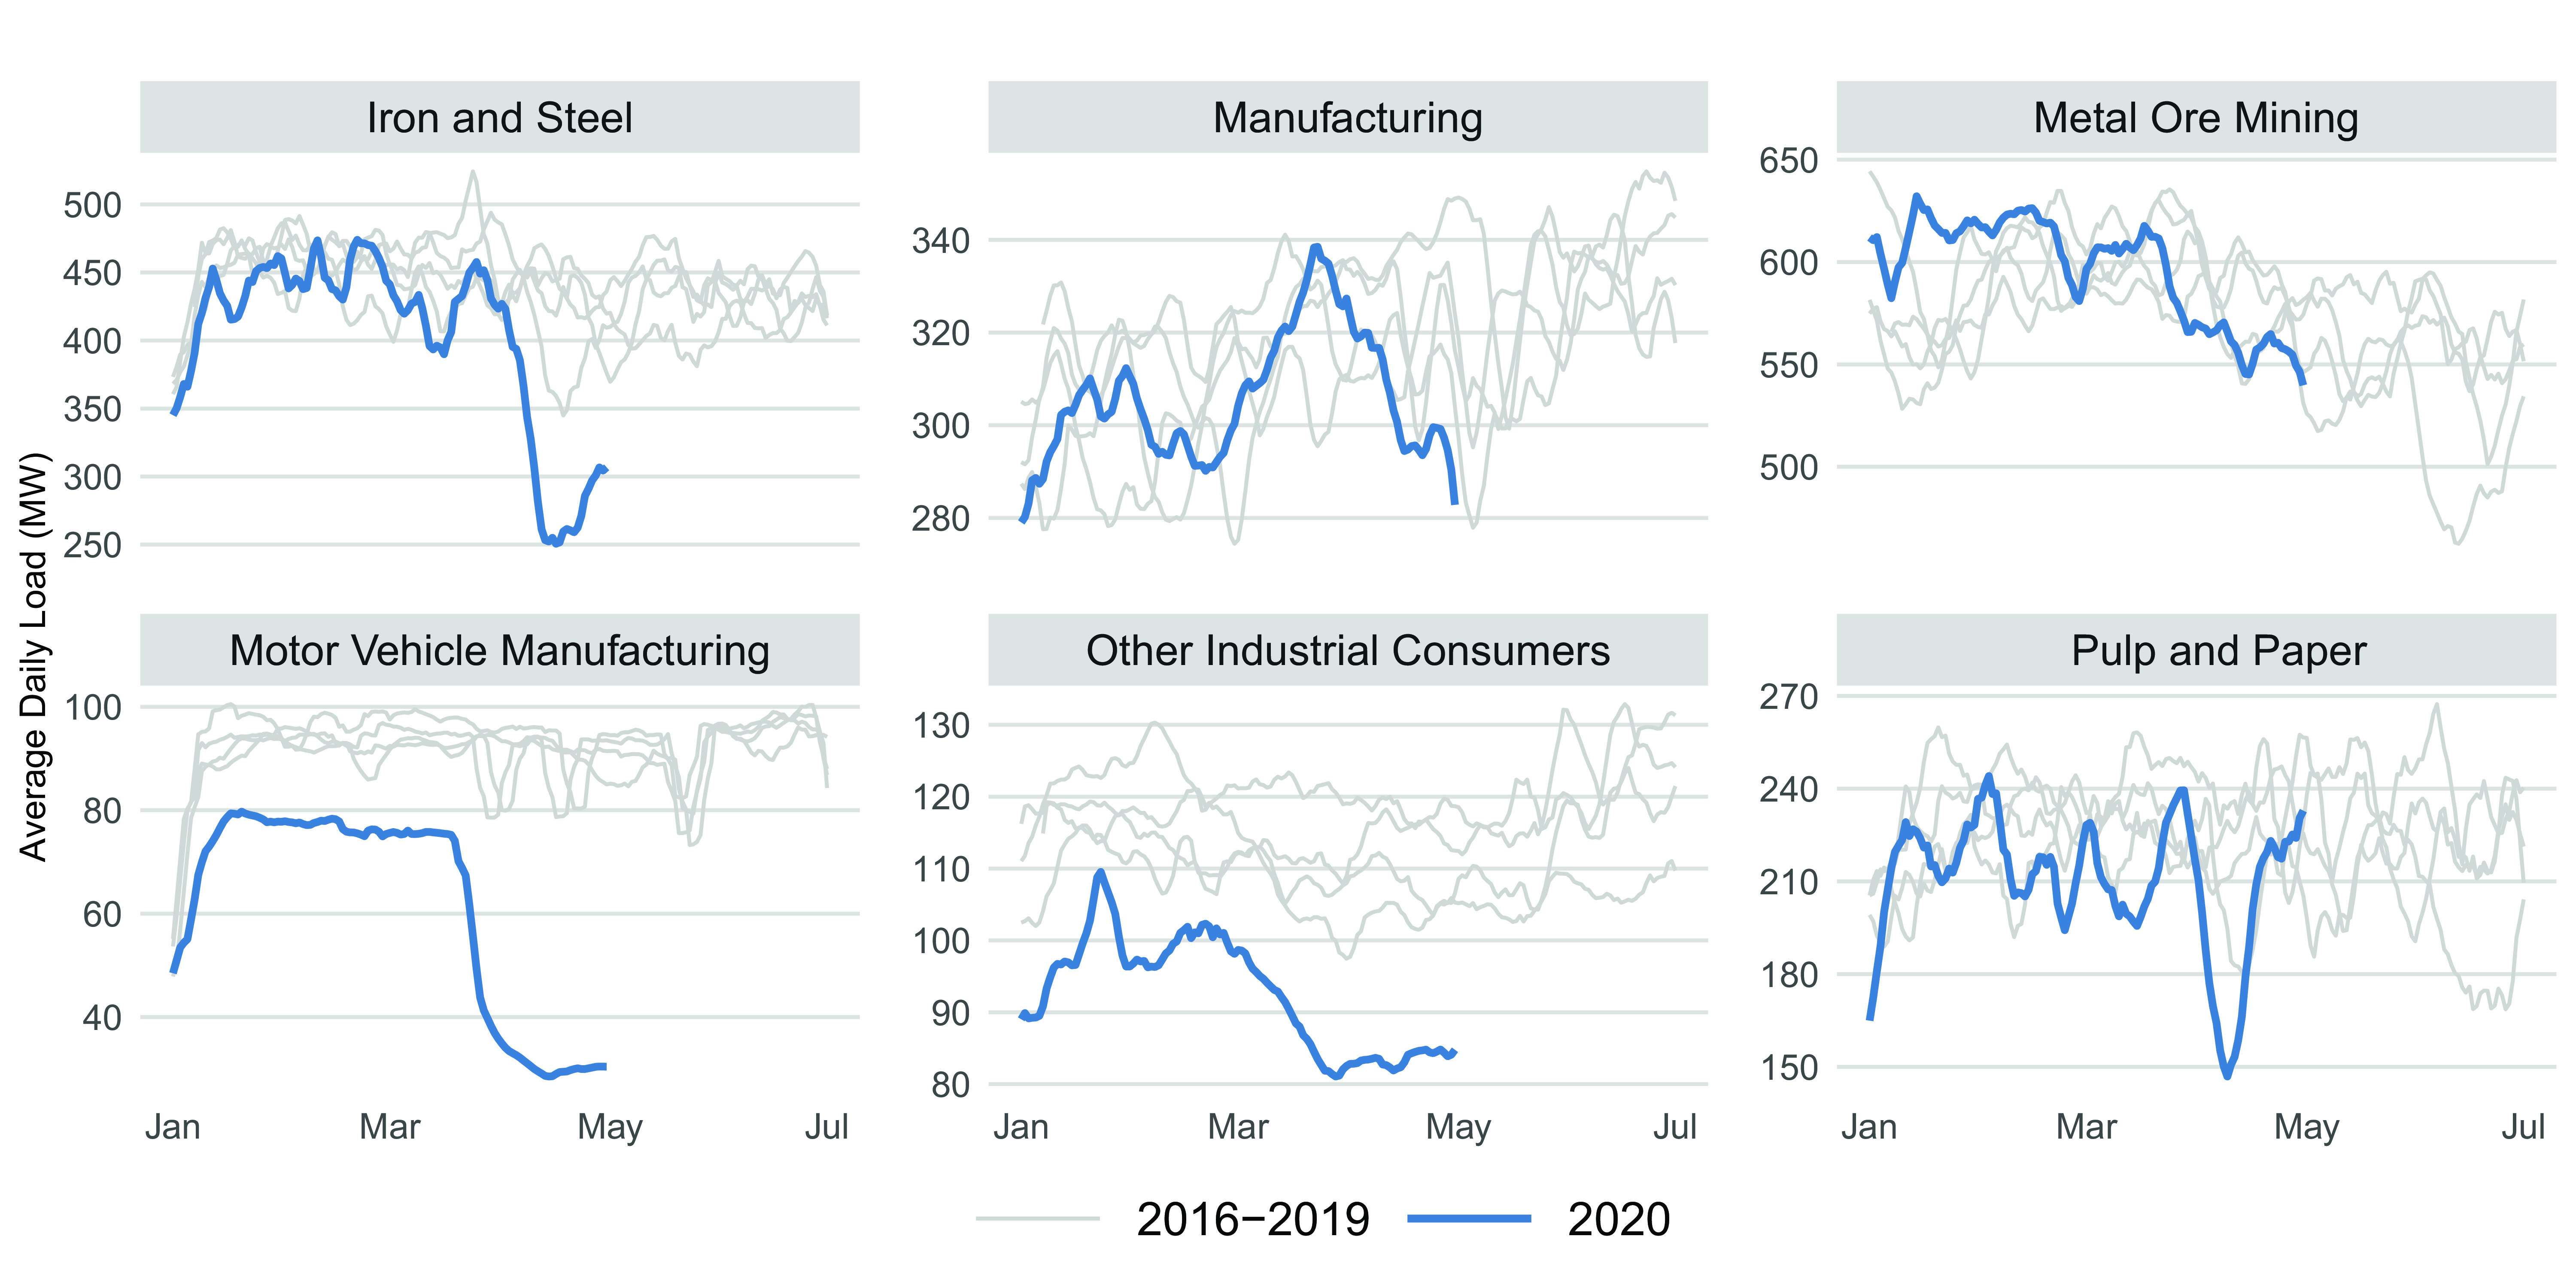
Notes: Seven-day moving averages of daily average load are shown. Data end 30 April 2020.
Source: IESO (2020b).
Supply
On the supply side, we are interested in whether the COVID-19 shock could have led to significant changes in the emissions intensity of electricity and whether the shock has been more costly to some generators over others. For example, if the COVID-19 shock disproportionately led to a preference for coal over gas generation in Alberta or for hydro or nuclear over gas in Ontario, these decisions would have greenhouse gas and air quality impacts. To examine this, we focus on two markets for which we have data on generator- or fuel-level hourly commitments. In Alberta, hourly supply data for individual generation facilities is used, aggregated by plant and fuel type, whereas our Ontario data are aggregated to generation by fuel. In both markets, we also track electricity trade flows.
Alberta
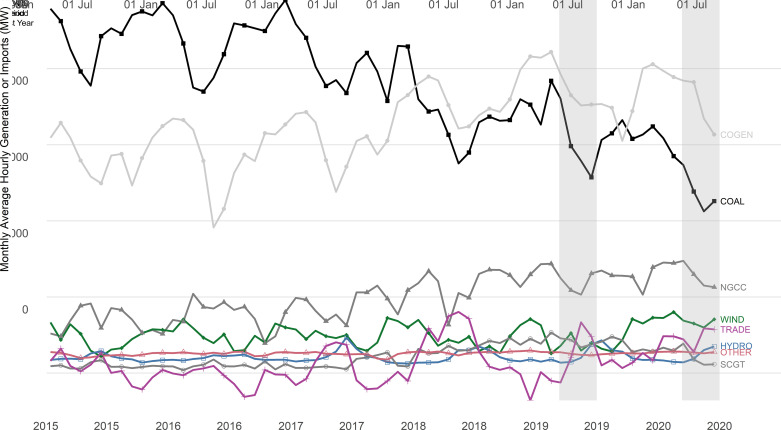
Alberta’s supply mix is among the most emissions intensive in the country, dominated by coal and gas generation. At first glance, Figure 4 shows the decline in coal generation, which has been underway since at least 2016, continuing and even appearing to accelerate through the COVID period. However, a similar decrease in coal generation occurred during the same period one year ago, because the spring is generally a period of low power demand in Alberta coinciding with higher imports from British Columbia, and thus a time when coal plants in Alberta tend to undergo maintenance.
Figure 4 .
Alberta Imports and Power Generation by Energy Source, 2015–2020
Notes: COVID-19 = coronavirus disease 2019; COGEN = cogeneration facilities; NGCC = natural gas combined cycle; TRADE = net imports; SCGT = single cycle gas turbine.
Source: Alberta Electricity System Operator supply and trade data as aggregated by NRGStream; authors’ calculations.
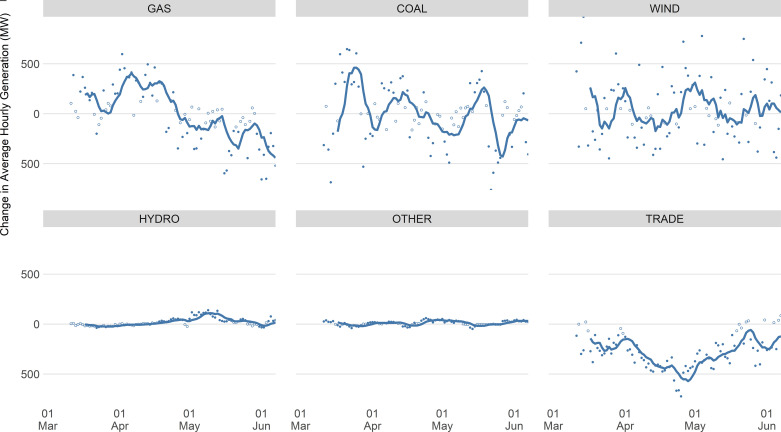
Using the regression framework detailed earlier, we report estimated changes in generation by energy source and trade flows during the COVID-19 pandemic.12 A test of the null hypothesis of no change in average generation by fuel type over the COVID-19 period cannot be rejected for major sources except for trade (net imports), for which we estimate a material and statistically significant average hourly flow decrease of 277 megawatts. Small, statistically significant increases in hydroelectric and wind generation as well as generation from other fuels—mostly biomass—were also estimated to have occurred during the COVID-19 period. The increase in wind generation is expected given new wind facilities coming online through early 2020 and is not related to COVID-19.
More detailed daily regression results are shown in Figure 5. We find the COVID-19 shock has generally acted to displace imports as well as natural gas generation, but with uneven effects over the period of analysis. We find a material and statistically significant decrease in imported power, particularly in the middle of the COVID-19 period, although imports had returned to expected levels by early June. Our estimates show higher-than-expected natural gas generation early in the COVID-19 period, falling to an estimated decrease in most of May and June. Estimated changes in hourly coal generation are not uniformly negative or monotonic through the period. Generation data (Figure 4) confirm that coal power has fallen to recent record lows during the pandemic, but our regression results (Figure 5) suggest that the pandemic has not caused or amplified the drop. Finally, for other energy sources, there was a two-week period in early May with significant increases in hydroelectric generation, although this has not been systematic during the COVID-19 period and is not material to the overall power supply in Alberta.
Figure 5 .
Estimated Change in Generation by Fuel and Trade Flow During COVID-19, Alberta
Notes: Solid lines represent seven-day moving averages for estimated daily fixed effects during the COVID-19 period. Individual points show estimated daily fixed effects, with each point filled on the basis of the p-value of a two-sided t-test for zero effect (solid fill indicates p ≤ 0.05). COVID-19 = coronavirus disease 2019.
Sources: AESO (2020b) supply and trade data as aggregated by NRGStream and Environment Canada (2020) temperature data; authors’ calculations.
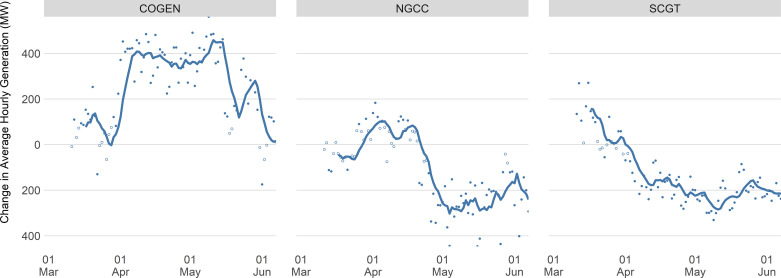
The results with respect to natural gas power supply are more interesting once decomposed by plant type. Averaged over the entire COVID-19 period, we find materially and statistically significant increases in net-to-grid power from combined heat and power (cogeneration) units (248 MW on average), along with statistically significant decreases in output from both simple- and combined-cycle natural gas generators (134 and 115 MW, respectively). The estimated daily drops, adjusted using the fixed-effects regressions discussed earlier, are shown in Figure 6. These results are consistent with the higher marginal costs of simple-cycle and combined-cycle plants relative to typically must-run cogeneration units.
Figure 6 .
Estimated Change in Natural Gas Generation during COVID-19 by Plant Type, Alberta
Notes: Solid lines represent seven-day moving averages for estimated daily fixed effects during the COVID-19 period. Individual points show estimated daily fixed effects, with each point filled on the basis of the p-value of a two-sided t-test for zero effect (solid fill indicates p ≤ 0.05). COVID-10 = coronavirus disease 2019.
Source: AESO (2020b) supply and trade data as aggregated by NRGStream and Environment Canada (2020) temperature data; authors’ calculations.
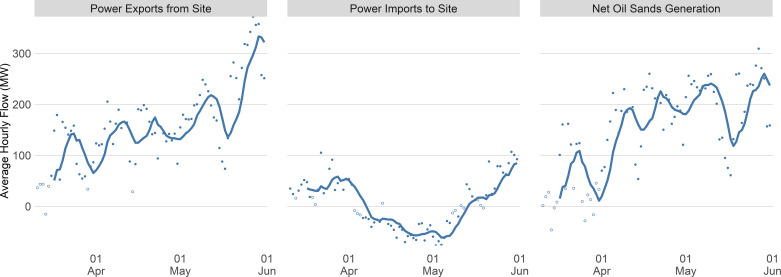
A further decomposition allows us to see even more clearly how electricity data can be a powerful tool to signal economic impacts of an event such as COVID-19, but not always in straightforward ways. Within natural gas combined heat and power plants, the vast majority of capacity serves the oil sands region. Using data from the Alberta Electricity System Operator looking specifically at flows to and from all oil sands facilities, we can isolate the effect of COVID-19 on electricity production from the oil sands. In completing this analysis, we use the same regression model as earlier but, in this case, use temperature data for Fort McMurray. The analysis shows, on average over the period, a statistically significant increase of 156 megawatts in net outflows from oil sands sites (right panel in Figure 7), explained almost entirely by an increase in electricity exports from the oil sands (left panel), with a small and weakly statistically significant increase (p = 0.069) in hourly draws from the grid to oil sands sites, although this effect is highly variable from day to day (middle panel). This increase in net flows onto the grid is material, given the pre-COVID 2020 hourly unadjusted mean of 434 megawatt hourly net flows.
Figure 7 .
Estimated Change in Oil Sands Facility Generation and Load During COVID-19
Notes: Solid lines represent seven-day moving averages for estimated daily fixed effects during the COVID-19 period. Individual points show estimated daily fixed effects, with each point filled on the basis of the p-value of a two-sided t-test for zero effect (solid fill indicates p ≤ 0.05). In addition to the standard regression equation, a fixed effect is included for an outage at Syncrude that occurred in 2017 over the same time of year as the COVID shock, which materially and statistically significantly altered oil sands power flows. COVID-19 = coronavirus disease 2019.
Sources: AESO (2020a) oil sands data and Environment Canada (2020) temperature data; authors’ calculations.
What does this increase in net power flows out of the oil sands signify? It likely indicates a significant reduction in electricity consumption on-site relative to what would have otherwise occurred and is thus an early indicator of reduced oil sands production. This is consistent with Alberta Energy Regulator (2020) reports showing total oil sands production declined 15 percent during April relative to the average production in the first quarter of 2020. This is not a direct consequence of COVID-19 in Alberta, but is connected to the substantial decrease in oil prices brought about by the global economic slowdown from the virus as well as an initial failure on the part of Organization of the Petroleum Exporting Countries (OPEC) and partner countries including Russia to reach an agreement to cut global oil supplies in response to the slowdown.13
Overall, we see some evidence of a slight change in the supply mix in Alberta, but at the plant level, not the fuel level, along with significant changes in trade. Electricity supply from combined heat and power units in the oil sands increases, whereas generation at simple- and combined-cycle plants decreases. Generation of electricity from coal has fallen but does not significantly depart from the downward trend that would otherwise have been expected. The oil sands–specific results highlight the valuable role real-time electricity data can play as a leading indicator of economic activity.
Ontario
Ontario’s market is more complex to analyze than Alberta’s because we only have detailed, hourly data for transmission-connected generation, and long-term supply contracts complicate analysis of generation by fuel type. This omits substantial (at least 3,500 MW) distribution-connected supply, including most of Ontario’s solar generation capacity and some combined heat and power units. The responsiveness of supply is also, in part, dictated by contracts. Ontario has, as of the end of 2019, 26,754 megawatts of contracted generating capacity, of which 23,171 megawatts is transmission connected (IESO 2019). This accounts for 60 percent of transmission-connected generation in Ontario.
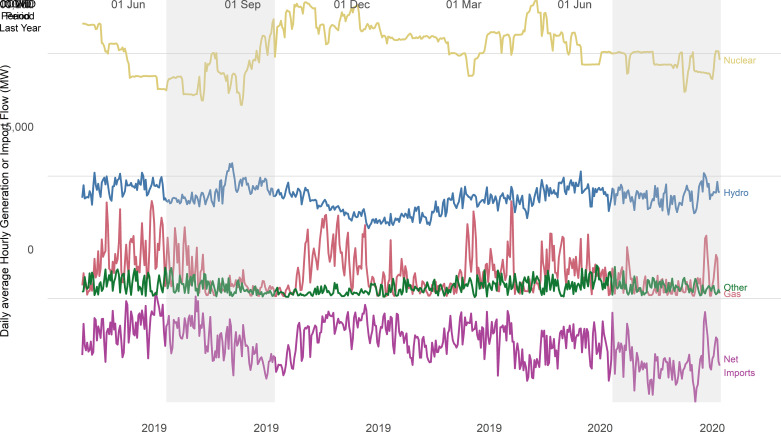
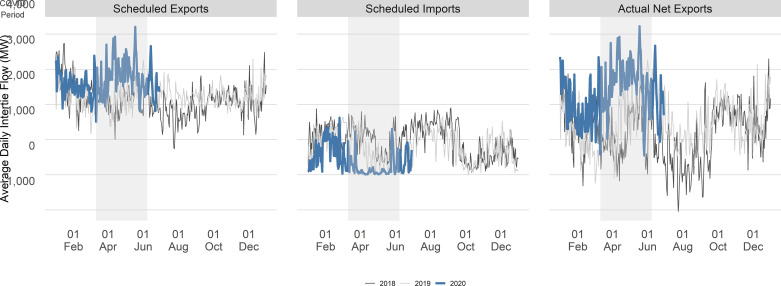
The response to the COVID shock is not as obvious in looking at Ontario’s generation by fuel over 2019 and the first half of 2020 (Figure 8). Nuclear generation appears marginally higher than the previous year, with gas slightly lower at least in the early COVID-19 period. The most obvious impacts come from net imports, which remain negative and are much larger in absolute value than one year previously. A more detailed analysis of trade data confirms this pattern (Figure 9), where the virtual elimination of scheduled net imports and increase in scheduled exports are both obvious during the COVID-19 period compared with the two previous years of data.
Figure 8 .
Ontario Net Imports and Transmission-Connected Generation by Fuel Type, 2019–2020
Notes: Does not include distribution-connected generation, which omits, among other sources, significant quantities of solar power generation from the Other category here.
Source: IESO (2020a) data; authors’ calculations.
Figure 9 .
Ontario Scheduled Imports and Exports and Observer Net Exports, 2018–2020
Notes: COVID = coronavirus disease.
Source: IESO (2020b) Intertie flow data; authors’ calculations.
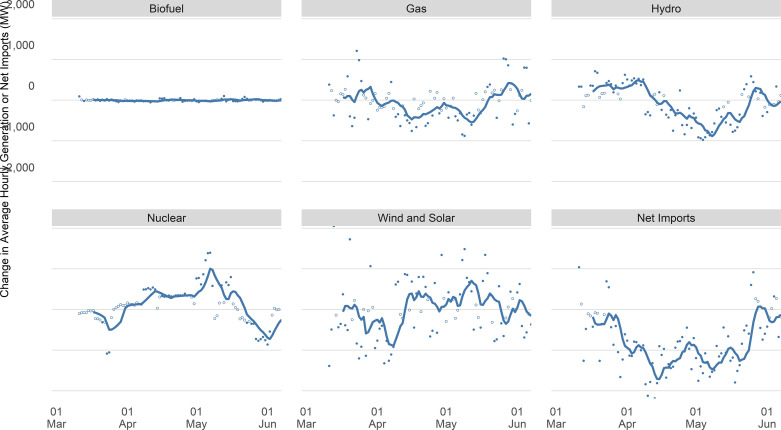
Regression analysis reveals significant impacts within generation sources that were not immediately obvious from the time series plots; in particular, it shows the magnitude of the trade impact (Figure 10). Adjusting for temperature, hour of day, and other factors, there is no systematic statistically significant reduction in daily supply by fuel for any of the tested generating sources, and only hydroelectric generation shows a lengthy period of statistically significant reductions in supply. The estimated reductions in gas generation are smaller in order of magnitude and more variable over the COVID-19 period. As estimated reductions in hydroelectric generation wane later in the COVID-19 period, statistically significant reductions in nuclear generation are observed. The largest impacts are on net imports, which show statistically significant reductions, that is, increased net exports, over almost the entire COVID-19 period, from late March to late May. Although there are statistically significant daily variations in wind and solar supply, these are artefacts of our weather effects not adjusting for wind and insolation rather than a particular effect of COVID-19.
Figure 10 .
Estimated Change in Generation by Plant Type and Trade Flow During COVID-19, Ontario
Notes: Solid lines represent seven-day moving averages for estimated daily fixed effects during the COVID-19 period. Individual points show estimated daily fixed effects, with each point filled on the basis of the p-value of a two-sided t-test for zero effect (solid fill indicates p ≤ 0.05). COVID-19 = coronavirus disease 2019.
Sources: IESO (2020a) hourly supply data and Environment Canada (2020) temperature data; authors’ calculations.
Overall, we do not see impacts on the supply mix in Ontario as clearly as those seen in Alberta; however, there are clearly significant changes in power trade in Ontario with more surplus generation being exported and fewer electricity imports as a result of the COVID-driven demand shock.
Policy Discussion
Our analysis reveals a marked decline and partial recovery in overall electricity demand in all provinces studied, with accentuated impacts in certain sectors. In particular, we find a reduction in demand of about 10 percent in Ontario and a reduction in demand by about 5 percent in Alberta, British Columbia, and New Brunswick. Although a complete breakdown of electricity demand by sector is not available, our results suggest significant demand reductions in certain sectors, including motor vehicle manufacturing. Our results also show displacement of high-cost generating resources on the supply side, in particular from natural gas generators. Our findings have implications beyond the COVID-19 period along many fronts. We conclude by discussing several key implications in turn.
Electricity as a Real-Time Economic Indicator
The production of broad measures of economic activity—including gross domestic product, but also employment, trade, investment, and so forth—takes time and resources. Typically, provincial measures of gross domestic product are only available at an annual frequency, and publication lags mean that data are not available until months after the end of a year. As a result, assessing the impact of COVID-19 or other shocks in real time requires the use of other types of data. Analysts have used a variety of non-traditional data sources in trying to understand the economic impact of COVID-19, including cell phone mobility logs, routing requests, and restaurant reservations. In this article, we make use of high-frequency electricity demand data.
Historically, electricity demand has been highly correlated with economic growth, suggesting the appropriateness of this approach. However, in the past decade, electricity demand and economic output have become decoupled in many Organisation for Economic Co-operation and Development countries, including Canada (Moreau and Vuille 2018; EIA 2017). Before the 2009 recession, a regression of provincial economic growth rates on provincial electricity demand growth rates returned a coefficient of 0.56 (t = 10), suggesting a strong relationship. However, for the past decade (after 2009), the coefficient has fallen to only 0.11 (t = 1.5), and the relationship is no longer statistically different from zero.14 This weakening relationship is due to changes in economic structure, increases in energy efficiency, and (to a lesser extent) penetration of distributed generation resources.
The weakening relationship between electricity demand and gross domestic product limits our ability to draw strong conclusions about the total economic impact of COVID-19 in real time solely on the basis of electricity data. However, to the extent that electricity demand does not fully recover, it is an indication of demand destruction (business shutdown) that is not temporary, but permanent. Moreover, although aggregate demand paints a muddy picture, sector-specific demand data, where available, appear to clearly indicate demand arrests in certain sectors. This further supports our call to make detailed electricity data—granular at the temporal, regional, and customer class levels—more readily available in Canada. The benefits to policy-makers of being able to identify adverse impacts pinpointed to particular regions and sectors in near-real time, and tailor policy accordingly, are likely large.
Highlights Changing Electricity Markets
Electricity markets are evolving, and new technologies are changing the way electricity is both generated and used. The COVID-19 shock in and of itself is unlikely to materially affect the long-term transition in electricity markets, but it has shown the importance of flexible supply. We tend, still, to think of electricity markets as base load complemented by peaking assets that can cycle on and off to meet increases in load. However, as authors such as Jenkins et al. (2018) have argued, these distinctions have less meaning in a world of zero variable-cost solar and wind power. We have already seen changes brought about in the day-to-day management of power systems by mid-day solar generation and variable wind generation (see Rivers and Shaffer 2020). Similarly, electrification has been seen as a key part of the solution to reducing greenhouse gas emissions to combat climate change (see, e.g., Bataille et al. 2018). COVID-19 brings a shock of a different sort: a radical reduction in electricity load in the short term and the potential for a long-term transformation in how people work, commute, and consume. Although this article is principally concerned with the size of the current shock, the aftershocks of the COVID-19 pandemic for electricity will be significant. It is beyond the scope of this article to speculate on specific outcomes, but in areas such as transportation, real estate, and high-density development, important changes may result from the pandemic and its aftermath.
Rate Impacts
Reduced demand for electricity during the pandemic is likely to, perhaps counterintuitively, put upward pressure on electricity rates. This seeming violation of the law of demand is rooted in the regulatory structure of electricity rates. Many fixed costs of the electricity system—for example transmission and distribution grid costs and fixed contracts whose costs, at least in the short run, are mostly independent of volumetric demand—are recovered from ratepayers through variable rates. Less demand means a smaller base from which to collect revenue, leading to revenue shortfalls for utilities. As cost-of-service regulated entities, utilities will have recourse to their respective utility commissions to seek higher variable rates in the coming months to recover these shortfalls. We should note, however, that rate recovery is not necessarily guaranteed, nor would any resulting rate impacts be immediate; rather, they would be spread over several years to avoid rate shock.
An example of this is playing out in Ontario, where the Global Adjustment Charge (GAC) is facing upward pressure as a result of persistent fixed costs being spread over a shrinking base of demand during the pandemic (Bishop and Shaffer 2020).15 With the April 2020 initial estimate of the GAC indicating a 15 percent rise over the previous month, and a 69 percent rise compared with the previous year, the Government of Ontario announced on 1 May 2020 a deferral of any GAC increases, fixing the GAC at roughly the March 2020 level (11.5 cents per kilowatt-hour) until 30 June 2020. In their announcement, the government stated: “without this emergency order, a small industrial or commercial consumer (i.e., Class B) could have seen bills increase by 15 per cent or more” (Government of Ontario 2020). Similar efforts to defer costs have been made for residential customers by applying the off-peak price to all consumption.
It remains to be seen how deferred costs and induced revenue shortfalls will be recovered, and so the ultimate consequence of the impact of the COVID-19 pandemic across many classes of electricity consumers is not yet clear. How utilities and their respective utility commissions, and in many cases their shareholder governments, deal with this challenge is also an open policy question. One possibility is a pandemic surcharge—a rate adder of known duration to recover the shortfall, a solution often used after natural disasters with large but impermanent cost implications. Another is for the utility commission to reject the application for pandemic-related cost relief, letting the shortfall be borne by the utility companies. A third is for the government, which in most Canadian provinces is the sole shareholder of crown corporation utilities, to cover the shortfall, essentially shifting the cost burden from ratepayer to taxpayer. We take no particular position on which of these options is optimal, noting simply that there are large distributional consequences in the ultimate path chosen. We do, however, note that this situation offers a strong reminder of the need to revisit the efficiency and risk of rate designs predicated on the recovery of fixed costs via volumetric rates.
Data Availability
Our analysis uses hourly electricity data from four provinces to estimate the impact of COVID-19 on Canadian electricity markets. The analysis brings to light the limited publicly available energy data in Canada. Whereas the United States and Europe make available, in a consistent manner, comprehensive hourly load data in near real time, similar data from select provinces in Canada have to be compiled piecemeal or are available only through a paid subscription service. Moreover, most provinces do not disclose hourly load data at all, making this type of analysis impossible. In addition to the type of analysis conducted here, high-frequency electric load data are important for understanding the transition to distributed renewables, the opportunity for electricity storage and transmission, and consumer responsiveness to policy changes.
Our analysis also uses data on electricity supply, which are even more restricted than those for demand. High-frequency electricity supply data are only available for Ontario and Alberta. In other provinces, electricity supply data are only available at monthly or annual frequencies.16 Even where high-frequency supply data are available, Canada does not require the use of continuous emissions monitors, so high-frequency emissions data are not available.
These data gaps are reflective of the broader energy data situation in Canada. In many cases, both supply and demand data (for petroleum products, natural gas, coal, biofuels, etc.) are lacking, available only with a considerable lag, or available only at high levels of aggregation. In addition, there are little publicly available data on technology penetration, such as on renewable energy capacity, electric vehicles, or other technologies that are key to the energy transition. These data gaps severely curtail analysis of the energy transition in Canada and leave policy-makers and the public in the dark about new developments and requirements for policy.
Acknowledgements
The authors thank an anonymous guest editor for helpful comments and Julia Zonneveld for excellent research assistance. Shaffer and Leach thank data provider NRGStream for access to their platform. Leach acknowledges funding from Canada First Excellence Research Fund, Future of Energy Systems Institute, University of Alberta.
Notes
Selected articles include Cicala et al. (2020) and Chen et al. (2020), looking at the United States and Europe, respectively. For further reading, the International Association of Energy Economists published a COVID-19 special issue in spring 2020 entirely devoted to energy effects during the pandemic, including several articles specific to electricity (Williams 2020).
A BA is responsible for maintaining grid reliability and coordinating interchange schedules with neighbouring systems. For more, see EIA (2016).
In other provinces or for specific areas, hourly demand data may be available through regulatory processes. For example, in Quebec, Hydro Quebec’s distribution arm generally provides hourly demand data in the context of its regulatory rate hearings.
Alberta is in the midst of significant changes in its electricity supply mix that predate COVID-19. A coal phase-out and more stringent carbon price has shifted the coal-dominated mix to one increasingly consisting of natural gas and wind generation.
We thank NRGStream for access to their platform to more easily collect the electricity data.
We treat holidays (province specific) as a weekend in the weekday variable.
As a robustness measure, we attempt various permutations of Equation (1), including interacting temperature controls with month or week of year to allow for possible seasonal variation in temperature responses. We find no meaningful difference in results.
We chose 11 March as the cut-off to represent the beginning of the COVID-19 pandemic period in Canada on the basis of the abrupt fall in Opentable dining reservations on that date in major Canadian cities (Opentable.com 2020).
This method closely follows Cicala (2020) with the slight departure that Cicala uses daily fixed effects for the entirety of 2020, subsequently normalizing the COVID period estimates by subtracting the mean of the pre-COVID period estimates in 2020. Our use of year fixed effects is analogous and provides standard errors that do not require adjusting for the covariance between two estimated coefficients.
The oil sands were, in fact, declared essential business by the Government of Alberta, allowing them to continue production activity despite COVID-19 outbreaks at several facilities (Graney 2020).
The abrupt fall in motor vehicle manufacturing electricity demand began Friday, 20 March 2020.
The regression framework on the supply side adds fixed effects for peak hours defined as hours between 7:00 a.m. and 11:00 p.m., Monday through Saturday, excluding statutory holidays.
See EIA (2020a, 2020b, and 2020c) for further discussion of these circumstances. It is worth noting that during the sample period, a significant flood occurred in the Fort McMurray region in late April and early May. Although the flood was coincident with the COVID-19 shock, the oil sands sites were not directly affected, and it does not appear that the flood materially affects our results.
This analysis uses Statistics Canada Tables 25100021, 25100001, 36100402, 3610034501, 3610039601, and 18100004 to estimate the regression ∆GDP(p,t) = a + b × ∆Elec(p,t), where p is province, t is year, and ∆GDP and ∆Elec are first differences in real gross domestic product and electricity consumption, respectively. The regression is not causal but is intended to highlight the changing link between economic activity and electricity consumption.
The GAC is a component of Ontario electricity bills to cover “the cost of building new electricity infrastructure in the province, maintaining existing resources, as well as providing conservation and demand management programs” (IESO 2020b). It is reset monthly on a cents per kilowatt-hour basis.
Until recently, electricity supply data lagged by two to three years, a gap that has been addressed by Statistics Canada over the past year.
Contributor Information
Andrew Leach, Alberta School of Business, University of Alberta, Edmonton, Alberta.
Nic Rivers, Graduate School of Public and International Affairs, University of Ottawa, Ottawa, Ontario.
Blake Shaffer, Department of Economics and School of Public Policy, University of Calgary, Calgary, Alberta.
References
- Alberta Electricity System Operator (AESO) . 2020. a. “Historical Monthly and Hourly Oilsands Net Generation and Net Load Jan. 2014–May 2020.” At https://www.aeso.ca/market/market-and-system-reporting/data-requests/historical-monthly-and-hourly-oilsands-net-generation-and-net-load-jan-2014-may-2020/.
- Alberta Electricity System Operator (AESO) . 2020. b. “Market and System Reporting.” At https://www.aeso.ca/market/market-and-system-reporting/.
- Alberta Energy Regulator . 2020. “ST-3, Supply and Disposition of Crude Oil and Equivalent.” At https://www.aer.ca/providing-information/data-and-reports/statistical-reports/st3.html.
- Apadula, F., Bassini A., Elli A., and Scapin S.. 2012. “Relationships between Meteorological Variables and Monthly Electricity Demand.” Applied Energy 98:346–56. 10.1016/j.apenergy.2012.03.053. [DOI] [Google Scholar]
- Bataille, C., Åhman M., Neuhoff K., Nilsson L. J., Fischedick M., Lechtenböhmer S., Solano-Rodriquez B., Denis-Ryan A., Stiebert S., Waisman H., et al. 2018. “A Review of Technology and Policy Deep Decarbonization Pathway Options for Making Energy-Intensive Industry Production Consistent with the Paris Agreement.” Journal of Cleaner Production 187:960–73. 10.1016/j.jclepro.2018.03.107. [DOI] [Google Scholar]
- BC Hydro . 2020. “Balancing Authority Load Data.” At https://www.bchydro.com/energy-in-bc/operations/transmission/transmission-system/balancing-authority-load-data.html.
- Bishop, G., and Shaffer B.. 2020. “As Electricity Demand Sinks, Ontario Power Costs Rise 24 Percent with More to Come.” Intelligence Memo, 21 April. At https://www.cdhowe.org/intelligence-memos/bishop-shaffer-%E2%80%93-electricity-demand-sinks-ontario-power-costs-rise-24-percent.
- Breton, C., and Tabbara M.-D.. 2020. “COVID-19 Canadian Provinces Measures Dataset.” Center of Excellence on the Canadian Federation, Montreal. [Google Scholar]
- Burlig, F., Cicala S., and Sudarshan A.. 2020. “Impact of COVID-19 on Electricity Consumption and Particulate Pollution.” At https://epic.uchicago.edu/area-of-focus/covid-19/.
- Chen, S., Igan D., Pierri N., and Presbitero A.F.. 2020. “Tracking the Economic Impact of COVID-19 and Mitigation Policies in Europe and the United States.” Special Series on COVID-19. Washington, DC: International Monetary Foundation. [Google Scholar]
- Cicala, S. 2020. “Early Economic Impacts of COVID-19 in Europe: A View from the Grid.” Mimeo, University of Chicago. [Google Scholar]
- Cicala, S., Holland S.P., Mansur E.T., Muller N.Z., and Yates A.J.. 2020. “Expected Health Effects of Reduced Air Pollution from COVID-19 Social Distancing.” Working Paper No. 27135. Cambridge, MA: National Bureau of Economic Research. [Google Scholar]
- Environment Canada . 2020. “Historical Data.” At https://climate.weather.gc.ca/historical_data/search_historic_data_e.html.
- Government of Ontario . 2020. “Ontario Providing Support for Industrial and Commercial Electricity Consumers during COVID-19.” At https://news.ontario.ca/mndmf/en/2020/05/ontario-providing-support-for-industrial-and-commercial-electricity-consumers-during-covid-19.html.
- Graney, E. 2020. “Alberta to Declare Oil Sands Workers Essential as Province Prepares COVID-19 Pandemic Response.” Globe and Mail, March 24. At https://www.theglobeandmail.com/canada/alberta/article-alberta-to-declare-oil-sands-workers-essential-as-province-prepares/. [Google Scholar]
- Henley, A., and Peirson J.. 1997. “Non-Linearities in Electricity Demand and Temperature: Parametric versus Non-Parametric Methods.” Oxford Bulletin of Economics and Statistics 59(1):149–62. 10.1111/1468-0084.00054. [DOI] [Google Scholar]
- Hinson, S. 2020. “COVID-19 Is Changing Residential Electricity Demand.” At https://www.pecanstreet.org/2020/05/covid/.
- Independent Electricity System Operator (IESO) . 2019. “A Progress Report on Contracted Electricity Supply, Fourth Quarter 2019.” At http://www.ieso.ca/-/media/Files/IESO/Document-Library/contracted-electricity-supply/Progress-Report-Contracted-Supply-Q4-2019.pdf.
- Independent Electricity System Operator (IESO) . 2020. a. “Data Directory.” At http://www.ieso.ca/Power-Data/Data-Directory.
- Independent Electricity System Operator (IESO) . 2020. b. “Price Overview: Global Adjustment.” At http://www.ieso.ca/en/Power-Data/Price-Overview/Global-Adjustment.
- Jenkins, J.D., Zhou Z., Ponciroli R., Vilim R.B., Ganda F., de Sisternes F., and Botterud A.. 2018. “The Benefits of Nuclear Flexibility in Power System Operations with Renewable Energy.” Applied Energy 222:872–84. 10.1016/j.apenergy.2018.03.002. [DOI] [Google Scholar]
- Moreau, V., and Vuille F.. 2018. “Decoupling Energy Use and Economic Growth: Counter Evidence from Structural Effects and Embodied Energy in Trade.” Applied Energy 215:54–62. 10.1016/j.apenergy.2018.01.044. [DOI] [Google Scholar]
- NB Power . 2020. “System Information Archive.” At https://tso.nbpower.com/Public/en/system_information_archive.aspx.
- Opentable.com . 2020. “The State of the Restaurant Industry.” At https://www.opentable.com/state-of-industry.
- Rivers, N., and Shaffer B.. 2020. “Stretching the Duck: How Rising Temperatures Will Change the Level and Shape of Future Electricity Consumption.” Energy Journal 41(5). 10.5547/01956574.41.5.nriv. [DOI] [Google Scholar]
- US Energy Information Administration (EIA) . 2016. “U.S. Electric System Is Made Up of Interconnections and Balancing Authorities.” At https://www.eia.gov/todayinenergy/detail.php?id=27152.
- US Energy Information Administration (EIA) . 2017. “Link between Growth in Economic Activity and Electricity Use Is Changing Around the World.” At https://www.eia.gov/todayinenergy/detail.php?id=33812.
- US Energy Information Administration (EIA) . 2020. a. “Short Term Energy Outlook, April 2020.” At https://www.eia.gov/outlooks/steo/archives/Apr20.pdf.
- US Energy Information Administration (EIA) . 2020. b. “Short Term Energy Outlook, May 2020.” At https://www.eia.gov/outlooks/steo/archives/May20.pdf.
- US Energy Information Administration (EIA) . 2020. c. “Short Term Energy Outlook, June 2020.” At https://www.eia.gov/outlooks/steo/archives/June20.pdf.
- Willams, D., ed. “Special Covid-19 Edition.” 2020. Special issue, IAEE Energy Forum. At https://www.iaee.org/documents/2020EnergyForumSI.pdf.
Associated Data
This section collects any data citations, data availability statements, or supplementary materials included in this article.
Data Availability Statement
Our analysis uses hourly electricity data from four provinces to estimate the impact of COVID-19 on Canadian electricity markets. The analysis brings to light the limited publicly available energy data in Canada. Whereas the United States and Europe make available, in a consistent manner, comprehensive hourly load data in near real time, similar data from select provinces in Canada have to be compiled piecemeal or are available only through a paid subscription service. Moreover, most provinces do not disclose hourly load data at all, making this type of analysis impossible. In addition to the type of analysis conducted here, high-frequency electric load data are important for understanding the transition to distributed renewables, the opportunity for electricity storage and transmission, and consumer responsiveness to policy changes.
Our analysis also uses data on electricity supply, which are even more restricted than those for demand. High-frequency electricity supply data are only available for Ontario and Alberta. In other provinces, electricity supply data are only available at monthly or annual frequencies.16 Even where high-frequency supply data are available, Canada does not require the use of continuous emissions monitors, so high-frequency emissions data are not available.
These data gaps are reflective of the broader energy data situation in Canada. In many cases, both supply and demand data (for petroleum products, natural gas, coal, biofuels, etc.) are lacking, available only with a considerable lag, or available only at high levels of aggregation. In addition, there are little publicly available data on technology penetration, such as on renewable energy capacity, electric vehicles, or other technologies that are key to the energy transition. These data gaps severely curtail analysis of the energy transition in Canada and leave policy-makers and the public in the dark about new developments and requirements for policy.


