Abstract
We construct a new measure of the aggressiveness of COVID-19 policies in 75 Canadian and American cities and estimate the effect of these policies on mobility patterns in each city. Using a new dataset of five municipal COVID-19 policy indicators for each of our 75 cities, combined with 11 provincial/state policy indicators, we estimate a daily measure of the “aggressiveness” of the provincial/state and municipal COVID-19 policy mix in each city. We then estimate the effects of these policies on subsequent mobility behaviour using dynamic time series models. We find strong evidence of policy effects on subsequent mobility behaviour, but few overall differences between Canadian and American cities. We discuss the significance of our findings both for COVID-19 policy research and for other comparative urban policy research in multilevel policy environments.
Keywords: COVID-19, multi-level governance, mobility, urban policy
Abstract
Les auteurs proposent une nouvelle mesure de la vigueur des politiques visant la COVID‑19 dans 75 villes canadiennes et américaines et estiment les répercussions de ces politiques sur les profils de mobilité dans chaque ville. À l’aide d’un nouveau jeu de données sur cinq indicateurs relatifs aux politiques municipales visant la COVID‑19 pour chacune des 75 villes, qu’ils associent à 11 indicateurs relatifs aux politiques provinciales ou étatiques, les auteurs élaborent une mesure quotidienne estimative de la « vigueur » de la combinaison de politiques provinciales ou étatiques et municipales visant la COVID‑19 dans chaque ville. Ils estiment ensuite les répercussions de ces politiques sur le comportement de mobilité subséquent au moyen de modèles dynamiques de séries chronologiques. Les résultats qu’obtiennent les auteurs corroborent manifestement les répercussions des politiques sur le comportement de mobilité subséquent, mais les différences qu’ils observent entre les villes canadiennes et américaines sont globalement peu nombreuses. Les auteurs traitent de la signification de ces résultats tant pour la recherche sur les politiques visant la COVID‑19 que pour la recherche comparative sur d’autres politiques urbaines dans des environnements où les décisions relatives aux politiques sont prises par plusieurs ordres de gouvernement.
Mots clés : COVID-19, gouvernance multi-niveaux, mobilité, politique urbaine
Introduction
In the past six months, governments at all levels have adopted policies to restrict their citizens’ mobility and thus reduce the spread of the SARS-CoV-2 virus. The relationship between these policy actions and citizen behaviour has been a subject of ongoing conversation among researchers and the general public—particularly as residents compare their experiences with other jurisdictions and seek explanations for variation in case totals and deaths. Some have sought answers to these questions by focusing on individual factors, pointing to partisan attitudes, demographic characteristics, or risk perceptions to explain how individuals respond to social distancing rules and recommendations (van der Linden and Savoie 2020; Merkley et al. 2020; Pickup, Stecula, and van der Linden 2020). Others have focused on aggregate patterns, exploring differences in state and national COVID-19 policies and their effects (Barceló, Hartnett, and Kubinec 2020; Nguyen et al. 2020).
As is common in Canada, comparative discussions of COVID-19 policies and citizen behaviour have largely focused on how the Canadian experience compares with that of the United States. To our knowledge, however, researchers currently lack not only systematic comparative data on actual COVID-19 policies in Canada and the United States, but also a comparative analysis of the relationship between those policy choices and citizen behaviour. While policy researchers have published useful studies of COVID-19 policy in both countries, few have brought the two countries into direct, systematic comparison.
In this article, we provide a comparative analysis of COVID-19 policy measures and citizen mobility patterns in Canada and the United States. We add geographic and analytic richness to previous research, which has largely focused on provincial/state and national levels, by conducting our analysis at the level of 75 individual Canadian and American cities—the scale at which actual patterns of community disease spread are largely playing out. We construct an original dataset of five comparable municipal policy indicators for each of the 75 cities, which we combine with existing data on state/provincial policies to build a new measure of the overall aggressiveness of the local policy mix in each city. We then estimate the effects of this local policy mix on citizen mobility patterns using dynamic time series models in each city. While we find considerable heterogeneity among cities in policy aggressiveness and policy effects, we find few systematic differences between Canadian and American cities: in both countries, average policy aggressiveness is similar, and we find clear effects of policy on subsequent mobility patterns in both countries. In only one respect—overall levels of mobility—do we find clear evidence for differences between Canadian and American cities.
COVID-19 and Cross-National Urban Policy
Our analysis in this article seeks to build not only on recent COVID-19 research but also on longstanding research traditions in comparative Canadian–American urban politics and multilevel policy. In COVID-19 studies, a number of researchers have taken advantage of publicly available mobility data to study the predictors and consequences of mobility patterns during the pandemic. In the United States, Abouk and Heydari (2020) use state-level mobility data to show that stay-at-home policies affect both mobility patterns and subsequent infection rates; Adolph et al. (2020) use similar state-level data to explore the partisan, diffusion, and health predictors of social distancing policies; and Nguyen et al. (2020) use more fine-grained county-level data to identify the consequences of state reopening policies for mobility patterns. Of course, given the role of individual mobility in disease spread, several articles have also investigated the effects of mobility restrictions on the spread of COVID-19 itself (Kraemer et al. 2020; Miller et al. 2020).
These studies provide valuable analyses of the correlates and consequences of mobility during the COVID-19 pandemic. In our view, however, what is missing is attention to the scale at which many of the most important processes are actually playing out: local cities and communities. Moreover, to our knowledge, no study thus far has extended analysis of mobility patterns to the Canadian case. We address both of these gaps by building a systematic, comparable dataset of policy responses in 75 Canadian and American cities at the urban scale. This analysis adds important nuance to previous American studies at the state and county levels and provides a first study of COVID-19 policy and mobility in Canada.
While our analysis is most directly oriented to ongoing discussions of COVID-19 policy, our findings are also relevant to more longstanding literatures in Canadian political science and policy studies. The first concerns similarities and differences in urban politics and policy in Canada and the United States—the so-called “North American city” debate. Goldberg and Mercer (1986), whose Myth of the North American City remains the most detailed single-volume comparison of Canadian and American cities, insisted that the differences in urban policy and governance between the two countries are profound. Subsequent research has questioned Mercer and Goldberg’s claims about national differences in public opinion (Cole, Kincaid, and Whelan 2014), disputed their historical origins (Taylor 2014), and tested their implications for other urban institutional structures (Nelles 2014). Considerable research has also focused on the presence or absence of national differences in urban land-use and economic growth policy (Garber and Imbroscio 1996; Moore 2014; Taylor 2019).
We do not pretend to offer a comprehensive analysis of the “North American city” debate in this article (Good 2014). We do, however, offer evidence that is rare in comparative studies of Canadian and American urban policy: nearly simultaneous policy responses to an identical policy challenge across dozens of Canadian and American cities. The COVID-19 pandemic arose unexpectedly, at about the same time, in Canadian and American cities. By assessing patterns of COVID-19 policy action—and examining how urban residents responded to those policies—we add a distinctive and valuable case study to a longstanding tradition of cross-national comparative research.
Finally, we take an explicitly multilevel approach to COVID-19 policy in Canadian and American cities. For years, urban policy scholars have emphasized that the policy landscape in a particular city results from a mix of local, provincial, and federal policy choices, all of which are involved in “urban” policy-making (Horak 2012; Sancton 2008; Young 2012). Nearly every policy outcome that urban residents care about—from land-use planning to immigrant settlement to economic development—results from policy decisions across all levels of government. In some cases, policy goals at one level of government can be subverted by decisions at another (Hackworth 2020); in other cases, provincial governments can reinforce and backstop particular local policy agendas (Lucas 2016; Taylor 2019). Thus, to understand the policy reality on the ground in a particular city requires that we attend not only to municipal policy decisions, but also to relevant decisions at other levels of government.
In our analysis, we draw on the multilevel governance literature by conceptualizing local restrictions on COVID-19 policy as a mix of municipal and state/provincial policy action. By combining policy indicators at both the state/provincial and municipal levels, we provide a measure of local policy that is not only more geographically focused than summary measures at the state/provincial or national levels (Barceló et al. 2020; Breton 2020) but also more attentive to the multilevel policy context than exclusively municipal measures (Armstrong and Lucas 2020). Our measure is relevant to other COVID-19 research and may also provide a model for future researchers who seek to measure latent characteristics of the local “policy mix” in other multilevel policy domains, such as social welfare provision, immigrant integration, or tax policy.
Data and Methods
Our data are drawn from several sources. Our mobility data come from Apple’s Mobility Trends Reports. This dataset, published daily, summarizes directions requests in Apple Maps for three modes of transportation: walking, driving, and transit. The mobility data begin on 13 January 2020, well before the COVID-19 outbreak in North American cities; for each city, the mobility data report the city’s mobility level in relation to the 13 January 2020 baseline. While other mobility data have been made available by providers such as Google, the Apple mobility data are particularly useful because they provide comparable city-level mobility data for 75 cities in Canada and the United States: 7 in Canada and 68 in the United States.
As discussed above, we conceive of the COVID-19 policy environment in each city as a mix of municipal, regional, and national restrictions on individual actions during the pandemic. For the purpose of comparing the policy environments in Canadian and American cities, we focus especially on measuring the mix of municipal and state/provincial policies in a manner that enables direct comparison among cities not only within but also between the two countries.
To build our measure of the local policy environment in each city, we began by compiling data on state and provincial policy responses from already existing sources. In the United States, we drew from an excellent dataset on state-level policy responses constructed by Raifman et al. (2020). We drew from a similar dataset constructed by Charles Breton (2020) for Canadian provinces. We collected 11 directly comparable indicators from each of the two datasets: state of emergency declared, school closures, day care closures, limits on nursing home visits, shelter-in-place rules, non-essential business closures, public mask wearing, restaurant closures, fitness centre closures, and cinema closures. We used reopening data on all of these indicators from Raifman et al. (2020) for the United States and reconstructed the same data using media and government sources for each Canadian province in our dataset.
To our knowledge, the municipal level of the local policy mix has not been systematically collected for the 75 cities in our dataset. We thus constructed an original dataset of municipal policy indicators for each city. This dataset includes the date (if any) when the municipality declared a local state of emergency; the dates of local park and/or playground closures; the date on which the local transit system imposed an explicit capacity reduction for local buses (usually by blocking off particular seats or rows); and the date on which the local transit system switched to mandatory rear boarding of buses. Where appropriate, we also recorded the date when these municipal restrictions were lifted. To gather these data, we used official statements and press releases on the Web sites of local governments and transit agencies, along with news coverage and official statements on social media.
Our list of municipal policy interventions may at first glance seem idiosyncratic. However, these interventions are important and readily comparable indicators of the seriousness with which local governments are treating the COVID-19 pandemic. Full park closures and playground closures are very unpopular, particularly when schools are also closed, and it is clear from media coverage that municipalities took these policy decisions only when they felt it absolutely necessary. Similarly, transit capacity reductions and especially rear-boarding policies mean drastic reductions in transit revenue—in most cases, in fact, rear boarding policies meant that transit fares were suspended completely. We see substantial variation in the timing and extent of municipal policy choices on these indicators and, taken together, we see them as capturing a diverse mix of local policy actions ranging from the relatively painless (declaring a state of emergency) to the much more costly (playground closures, rear boarding), both for municipalities and for local residents. These policies also have the advantage of having clear start and end dates and enabling directly comparable data collection and analysis across dozens of Canadian and American municipalities.1
We also expect mobility patterns to be affected by local COVID-19 case totals, and we thus collected case data for each city to include in our time series models below. For the United States, our daily COVID-19 case totals are drawn from county-level data published by the New York Times (Smith et al. 2020). For Canada, we use data from the COVID-19 Canada Open Data Working Group (Berry et al. 2020).
While we provide descriptive data for the full time span below, our analysis focuses on the time period beginning on 20 February 2020. We selected this time period to capture the full rise of public policy interventions in the 75 cities in our dataset, as well as the beginning of the reopening period in late April and early May. Because of the time involved in collecting municipal policy data on each of the 75 cities in the analysis, we chose to end the time window on 13 May to create a single, consistent start and end point for each city. Our full dataset contains 27,450 observations: one for each mode of transportation in each city on each day from 13 January to 13 May.
Measuring COVID-19 Policy Responses
Each of the 16 policy indicators in our dataset—11 at the provincial/state level, 5 at the municipal level—is undoubtedly worthy of individual study. In this analysis, however, we are primarily interested in the ways that local residents respond (or do not respond) to the overall mix of policy restrictions imposed by both municipal and provincial/state governments. Each day, in each city, local residents make personal mobility decisions in light of the mix of policies in their city—what we call a city’s overall policy “aggressiveness.”
To measure this overall policy mix, we use an Item Response Theory model (DeMars 2010). This model allows us to capture the relationships among all of the policy variables to identify those places with more and less aggressive responses to the COVID-19 crisis. We use a Bayesian approach to estimation, an approach that has many benefits and few drawbacks relative to alternative approaches (Armstrong et al. 2014). Because of the size of the dataset, we use the emIRT package in R (Imai, Lo, and Olmsted 2016, 2017) to estimate the model. In this case, the binary emIRT model uses the Expectation-Maximization algorithm. It alternates between estimating the model parameters (i.e., the difficulty and discrimination parameters) holding the latent variable estimates fixed and estimating the latent variables holding the model parameters fixed. Imai et al. (2016) derived a closed-form algorithm that drastically speeds up estimation. We use a parametric bootstrap to generate measures of uncertainty for the latent variable. We provide additional information on both the model and the individual indicators in the Appendix.
Modeling the Policy–Mobility Relationship
Between 13 February and 13 May 2020, we have observations of 75 cities on 83 consecutive days. Thus, our data could be considered and analyzed as a macro-panel in a pooled cross-sectional time series design. However, since we are most interested in making comparisons across our cities of the effects of our independent variables, policy responses, and COVID-19 case totals, we estimate a separate time series regression for each city.
An ever-present worry with time series data such as ours is the consequences of autocorrelation. We have two types of autocorrelation to consider. For one, our data are certainly subject to cross-sectional dependence (Peseran 2004). That is, the assumption that each of our cities is independent of the others is not tenable—on any given day, the cities are subject to the same global shocks, which are unmeasured in our model. We avoid problems caused by these within-timepoint correlations by estimating 75 city-specific independent equations. The second type of autocorrelation to worry about is across-time dependence. If our data were all stationary—that is, if they returned quickly to a constant mean and maintained a constant variance—then simple regression techniques could be trusted to test our hypotheses. However, if the mean of the series is non-stationary, the assumption of independent errors is broken and hypothesis tests will no longer rely on standard limiting distributions (Lebo and Grant 2016).
Thus, making inferences from time series models typically relies on being able to properly diagnose the properties of each series—is it stationary or non-stationary? To what extent is the present value predicted by the value in the previous period? In our data, the cumulative number of COVID-19 cases is clearly a series that only goes upwards and is non-stationary. Our other series have time dependence—that is, the mobility in a city on a given day will be highly correlated with mobility in that city on adjacent days—but the extent to which this is present varies from city to city. While properly diagnosing the properties of each time series for each city would allow us to choose among various modeling options, the relatively short time span in our data makes it difficult to rely on tests of stationarity (Lebo and Kraft 2017).
This leads us to choose a modeling strategy that allows maximum flexibility. Webb, Linn, and Lebo (2020) present a bounds procedure for hypothesis testing that accounts for the uncertainty of stationarity testing. Critical value bounds are simulated for long-run multipliers (LRMs) in time series regressions without making assumptions about the data’s properties. We estimate the following model for each city, i, and for each of our three types of mobility, j:
where ψ1ij and ψ3ij are the long-run multipliers used to test our hypotheses. We also include dummy variables for days of the week—excluding Sunday as a reference category—to account for predictable day-based patterns in mobility.
Webb et al. (2020) provide two critical value bounds for the long-run multipliers. If the test statistic for an LRM is below the lower bound, we fail to reject the null hypothesis of no long-run relationship. With two independent variables and our T = 83, that bound is 1.06. Test statistics above the upper bound of 3.70 allow us to reject the null hypothesis of no long-run relationship and do so knowing it is the correct inference regardless of the peculiarities of our data. For test statistics in between the two bounds, we must admit that the uncertainty over our series’ properties makes it impossible to either reject or fail to reject our null hypothesis. This middle ground of indeterminacy is unsatisfying but, unlike other models for time series data, it guards against falsely concluding a relationship exists when it does not.
Mobility and COVID-19 Policy: An Overview
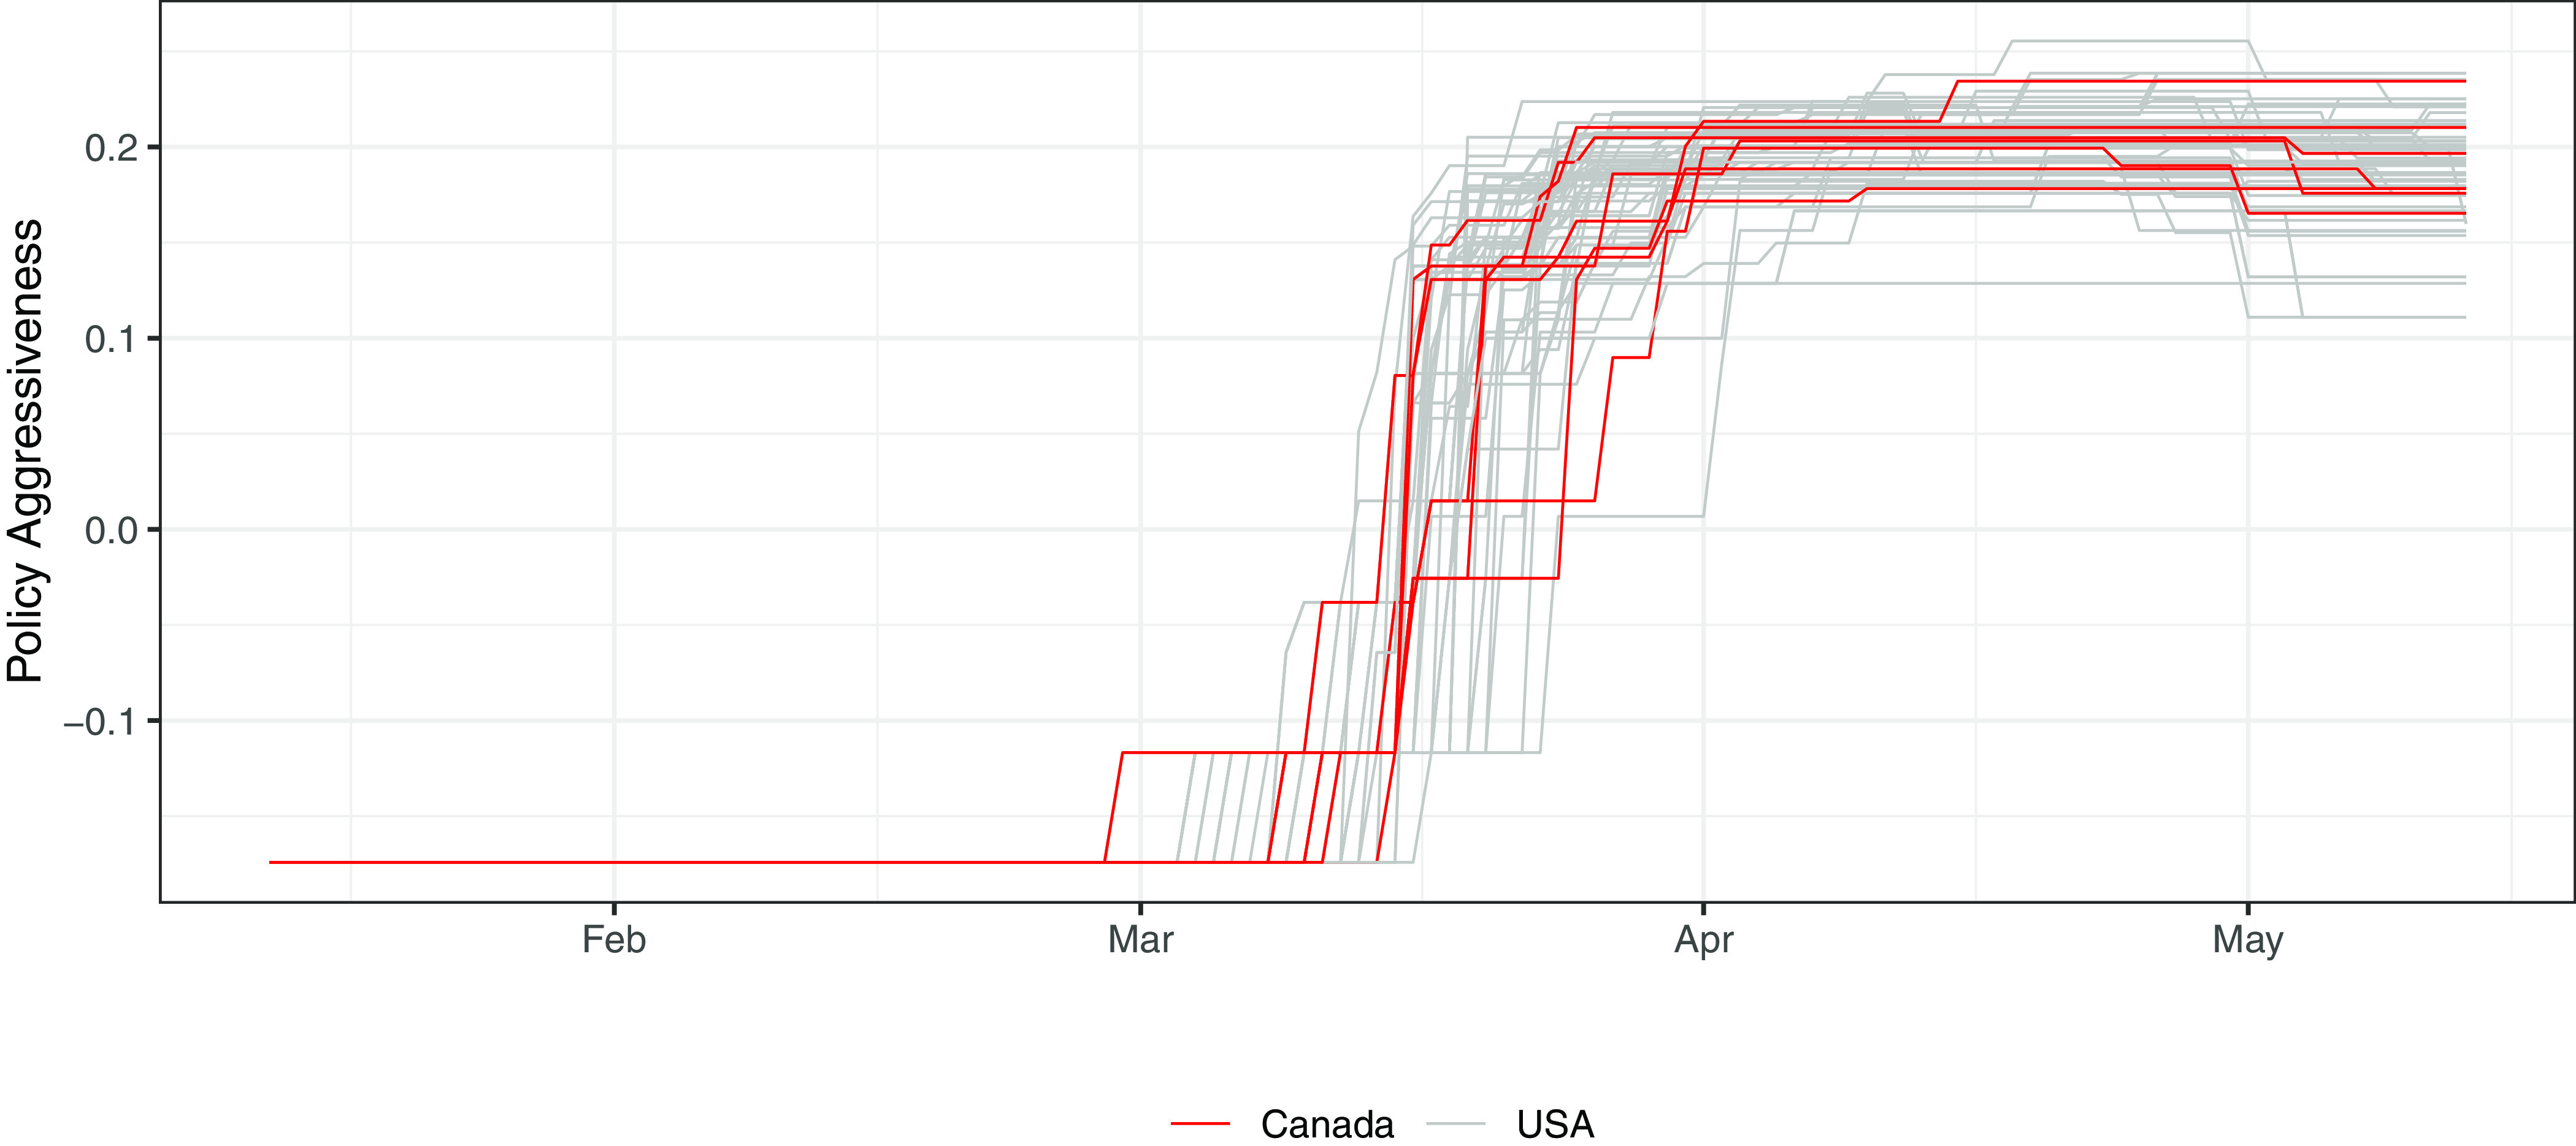
We begin with a descriptive overview of mobility patterns and policy responses in Canadian and American cities. Figure 1 summarizes each city’s daily overall policy response; each line represents a single city, with Canadian cities in red (blank in print version) and American cities in grey. Recall that this measure captures both state/provincial and municipal policy responses as a single latent measure of the overall “aggressiveness” of the policy response in each city. For readers who are interested in the policy trajectory in a particular city, we have provided a more detailed plot in the Appendix.
Figure 1:
COVID-19 Policy Response by City
The overall pattern in Figure 1 suggests that the policy responses in Canadian and American cities have been very similar: a modest increase in aggressiveness in early March, followed by a very rapid increase through mid-March, a plateau through the end of April, and then the early stages of a reopening period. On average, Canadian and American cities began and ended the decisive month of March in very similar policy environments. Within March, however, careful inspection of the data suggests that the speed of the policy response differed between the two countries; policy interventions arrived earlier but increased more slowly in the United States and arrived later but increased much more rapidly in Canada.2
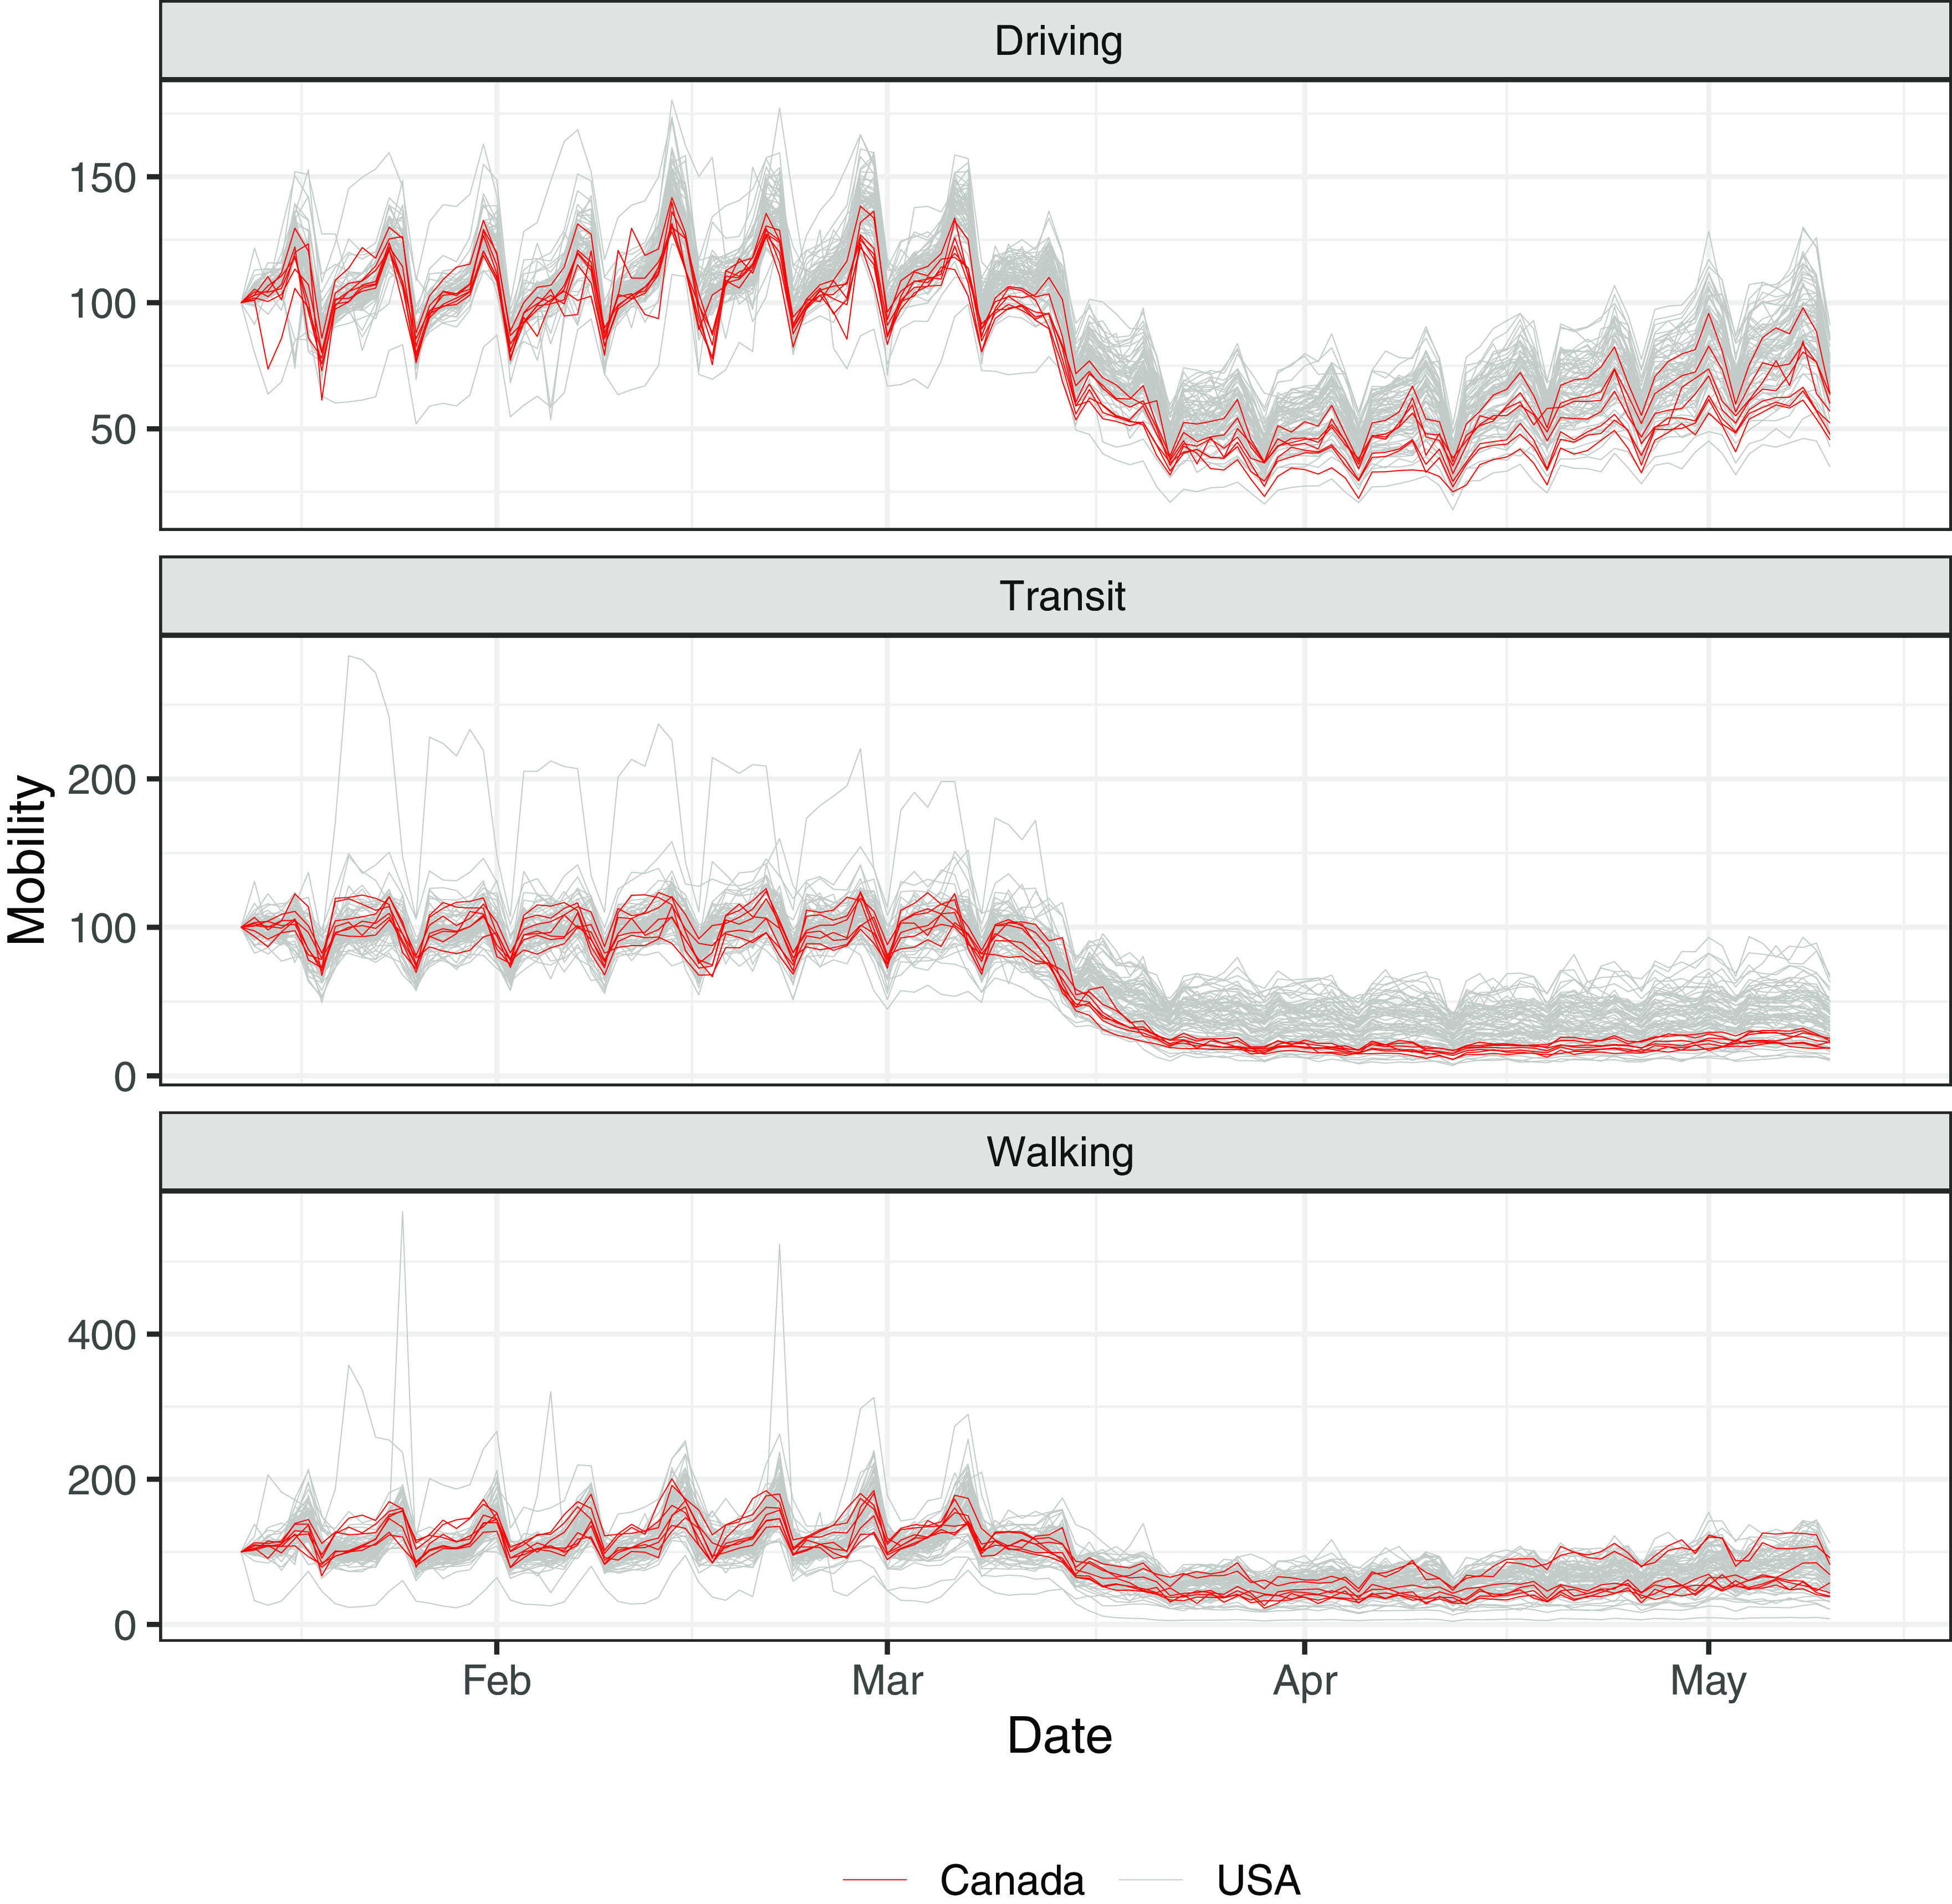
Canadian and American cities thus took somewhat different policy paths through the month of March, but ultimately arrived at roughly the same average level of policy aggressiveness. The same cannot be said of mobility, where we see more pronounced differences between the two countries. Figure 2 summarizes the mobility data for driving, transit, and walking in each city; here, too, Canadian cities are marked in red (black in print version) and American cities in grey. Here the differences between countries are clearer: once the pandemic became a matter of serious public discussion in March, mobility in Canadian cities dropped to the bottom of the overall distribution and has remained there through the remainder of the plot. This difference emerges in early March in the case of driving; for transit and walking, the pattern emerges in mid-March.3
Figure 2:
Mobility by City
Overall, then, we find interesting differences between Canadian and American cities both in policy response and in mobility patterns. On policy, cities in both countries began and ended at similar places; on the average, however, this increase in policy aggressiveness was more gradual in the United States than in Canada. On mobility, Canadian and American urban residents had very similar mobility patterns until March, when mobility in Canadian cities became markedly lower than in American cities across all three modes of transportation.4
Mobility and COVID-19 Policy
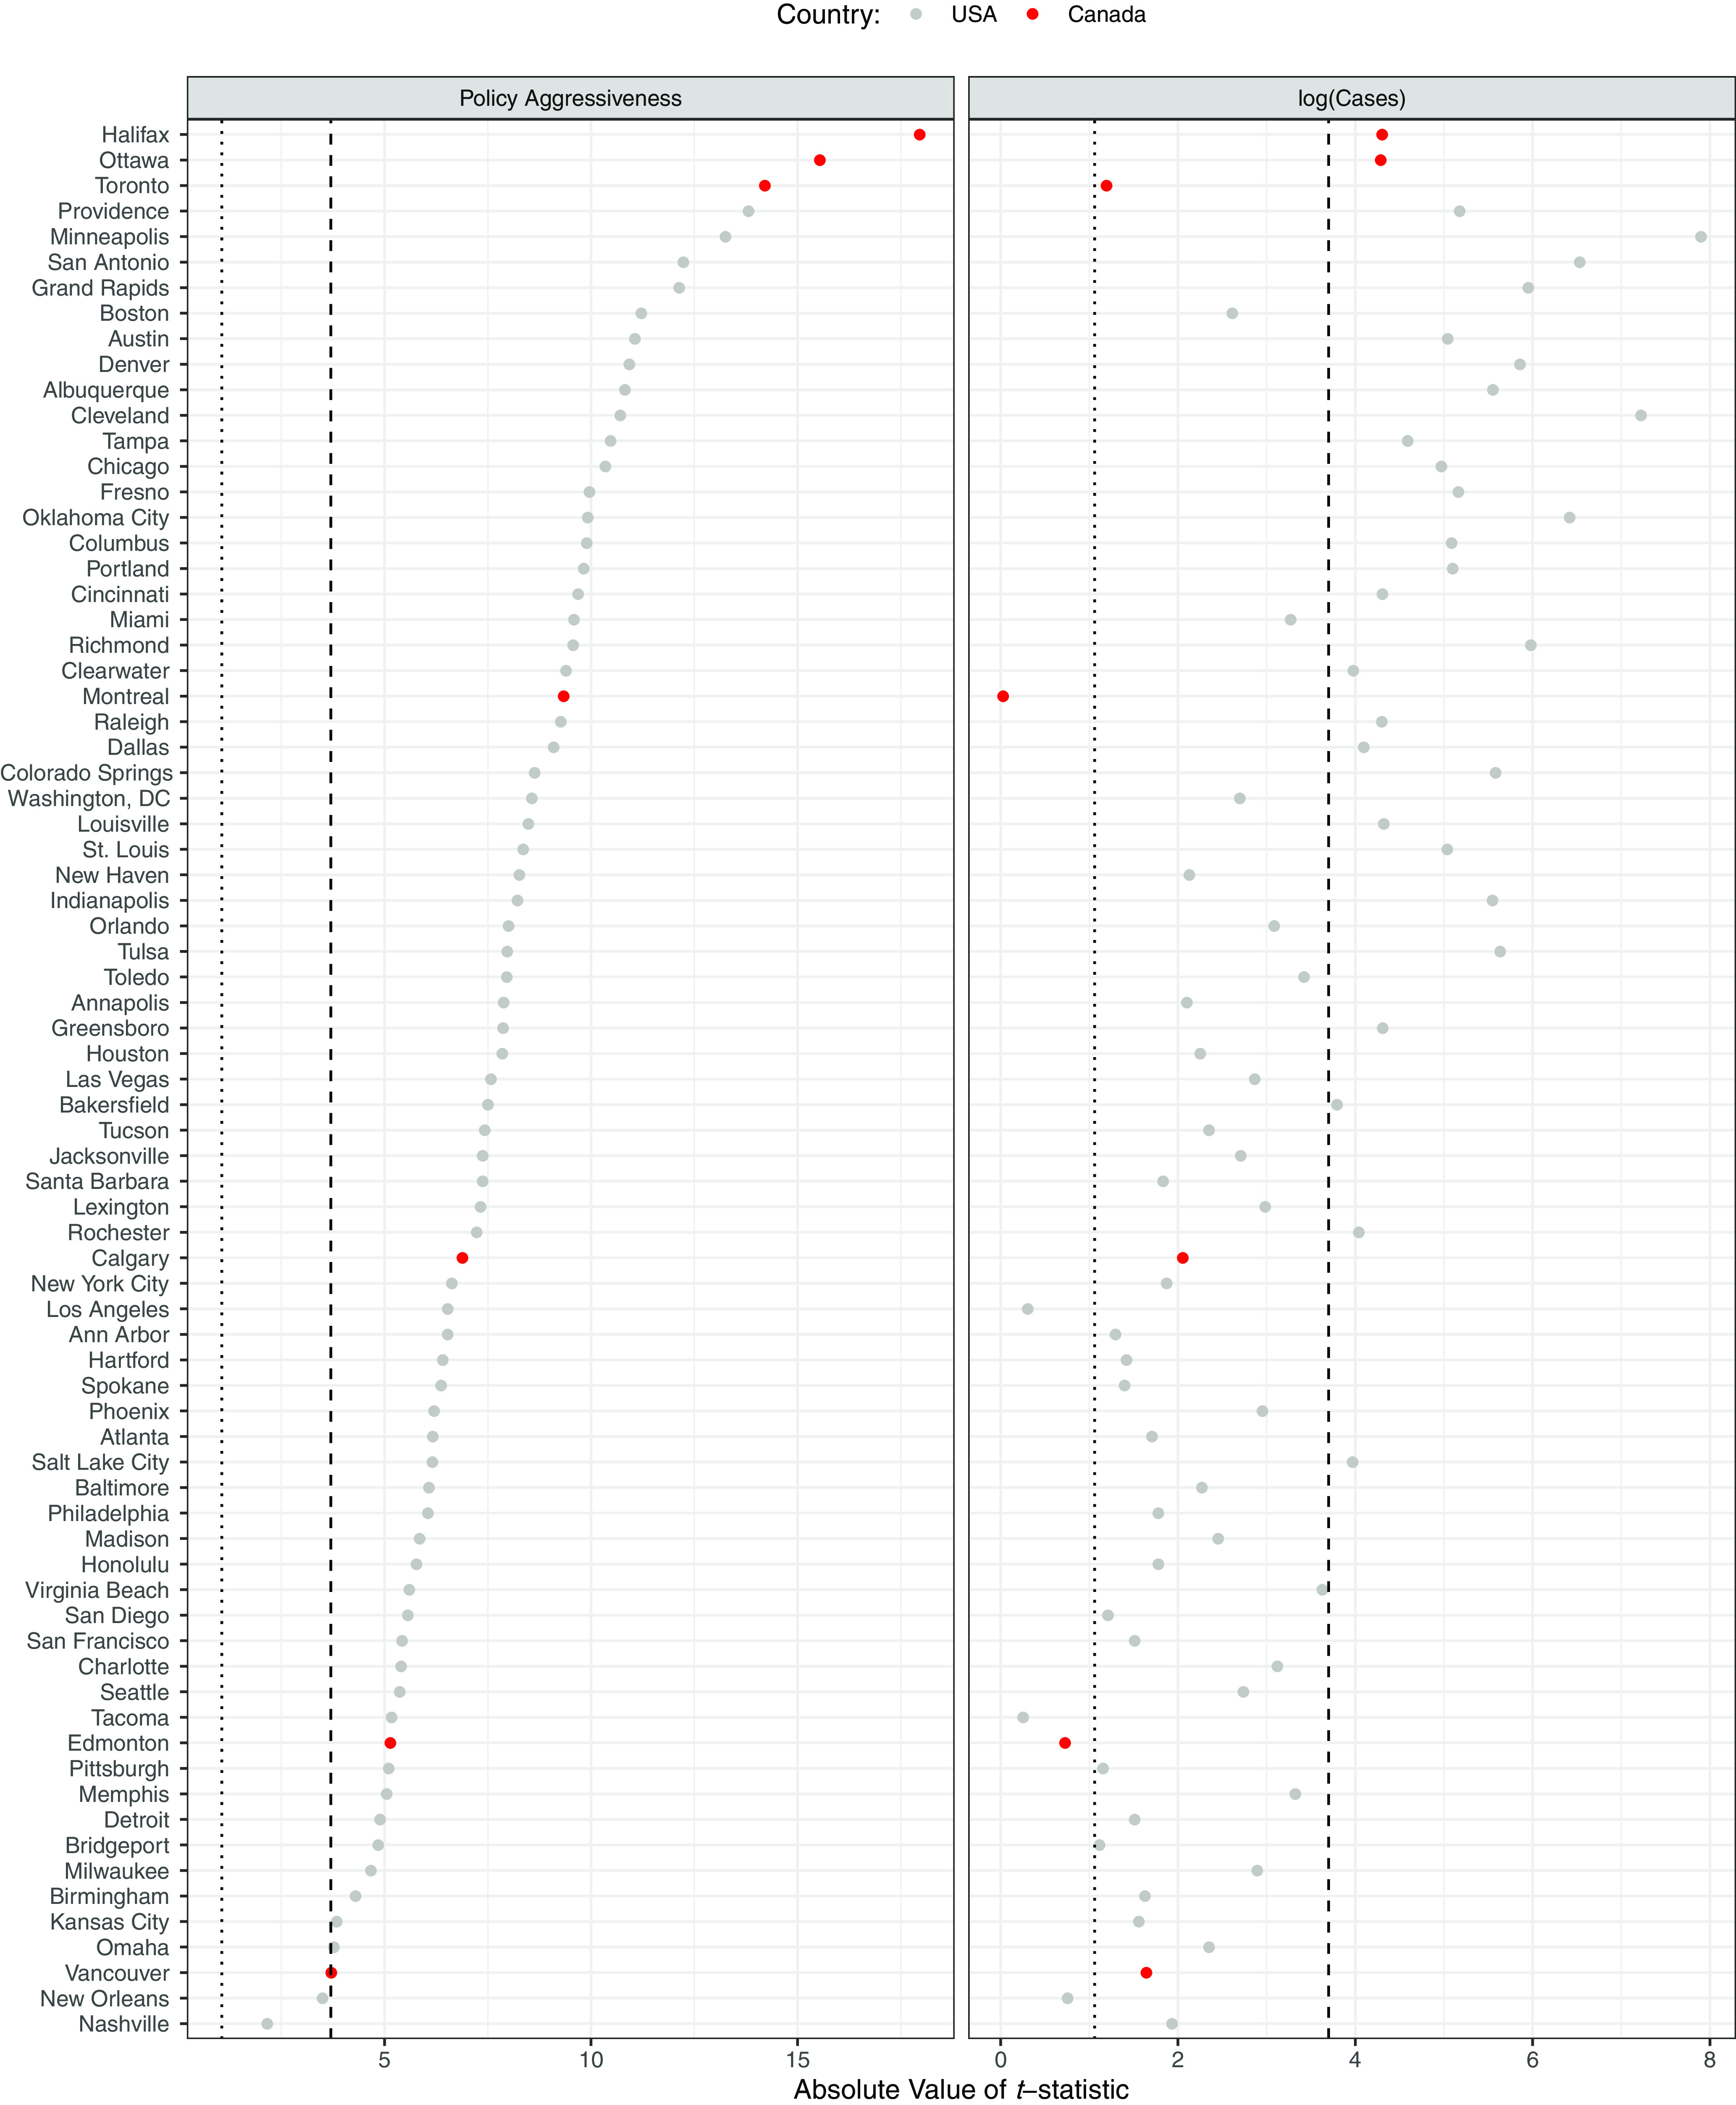
We now turn to the relationship between our latent measure of policy aggressiveness and mobility patterns in each city. For both driving and transit mobility, we plot the long-run multipliers for the effects of policy aggressiveness and local case totals.5 Figure 3 shows the absolute value of the t statistics for driving. In each plot, the dotted vertical line represents the lower bound and the dashed vertical line represents the upper bound; recall that the area within this region represents the range within which results are inconclusive. As above, Canadian cities are marked in red (black in print version) and American cities in grey.
Figure 3:
t-Statistics for Driving
Figure 3 provides clear evidence for a relationship between the local policy environment and subsequent driving mobility. Almost all effects for policy aggressiveness have t statistics above the upper bound of 3.70, indicating that policy has a significant effect on the amount people drive. Local COVID-19 case totals, on the other hand, are much less clearly related to driving habits, with many cities within the inconclusive region.
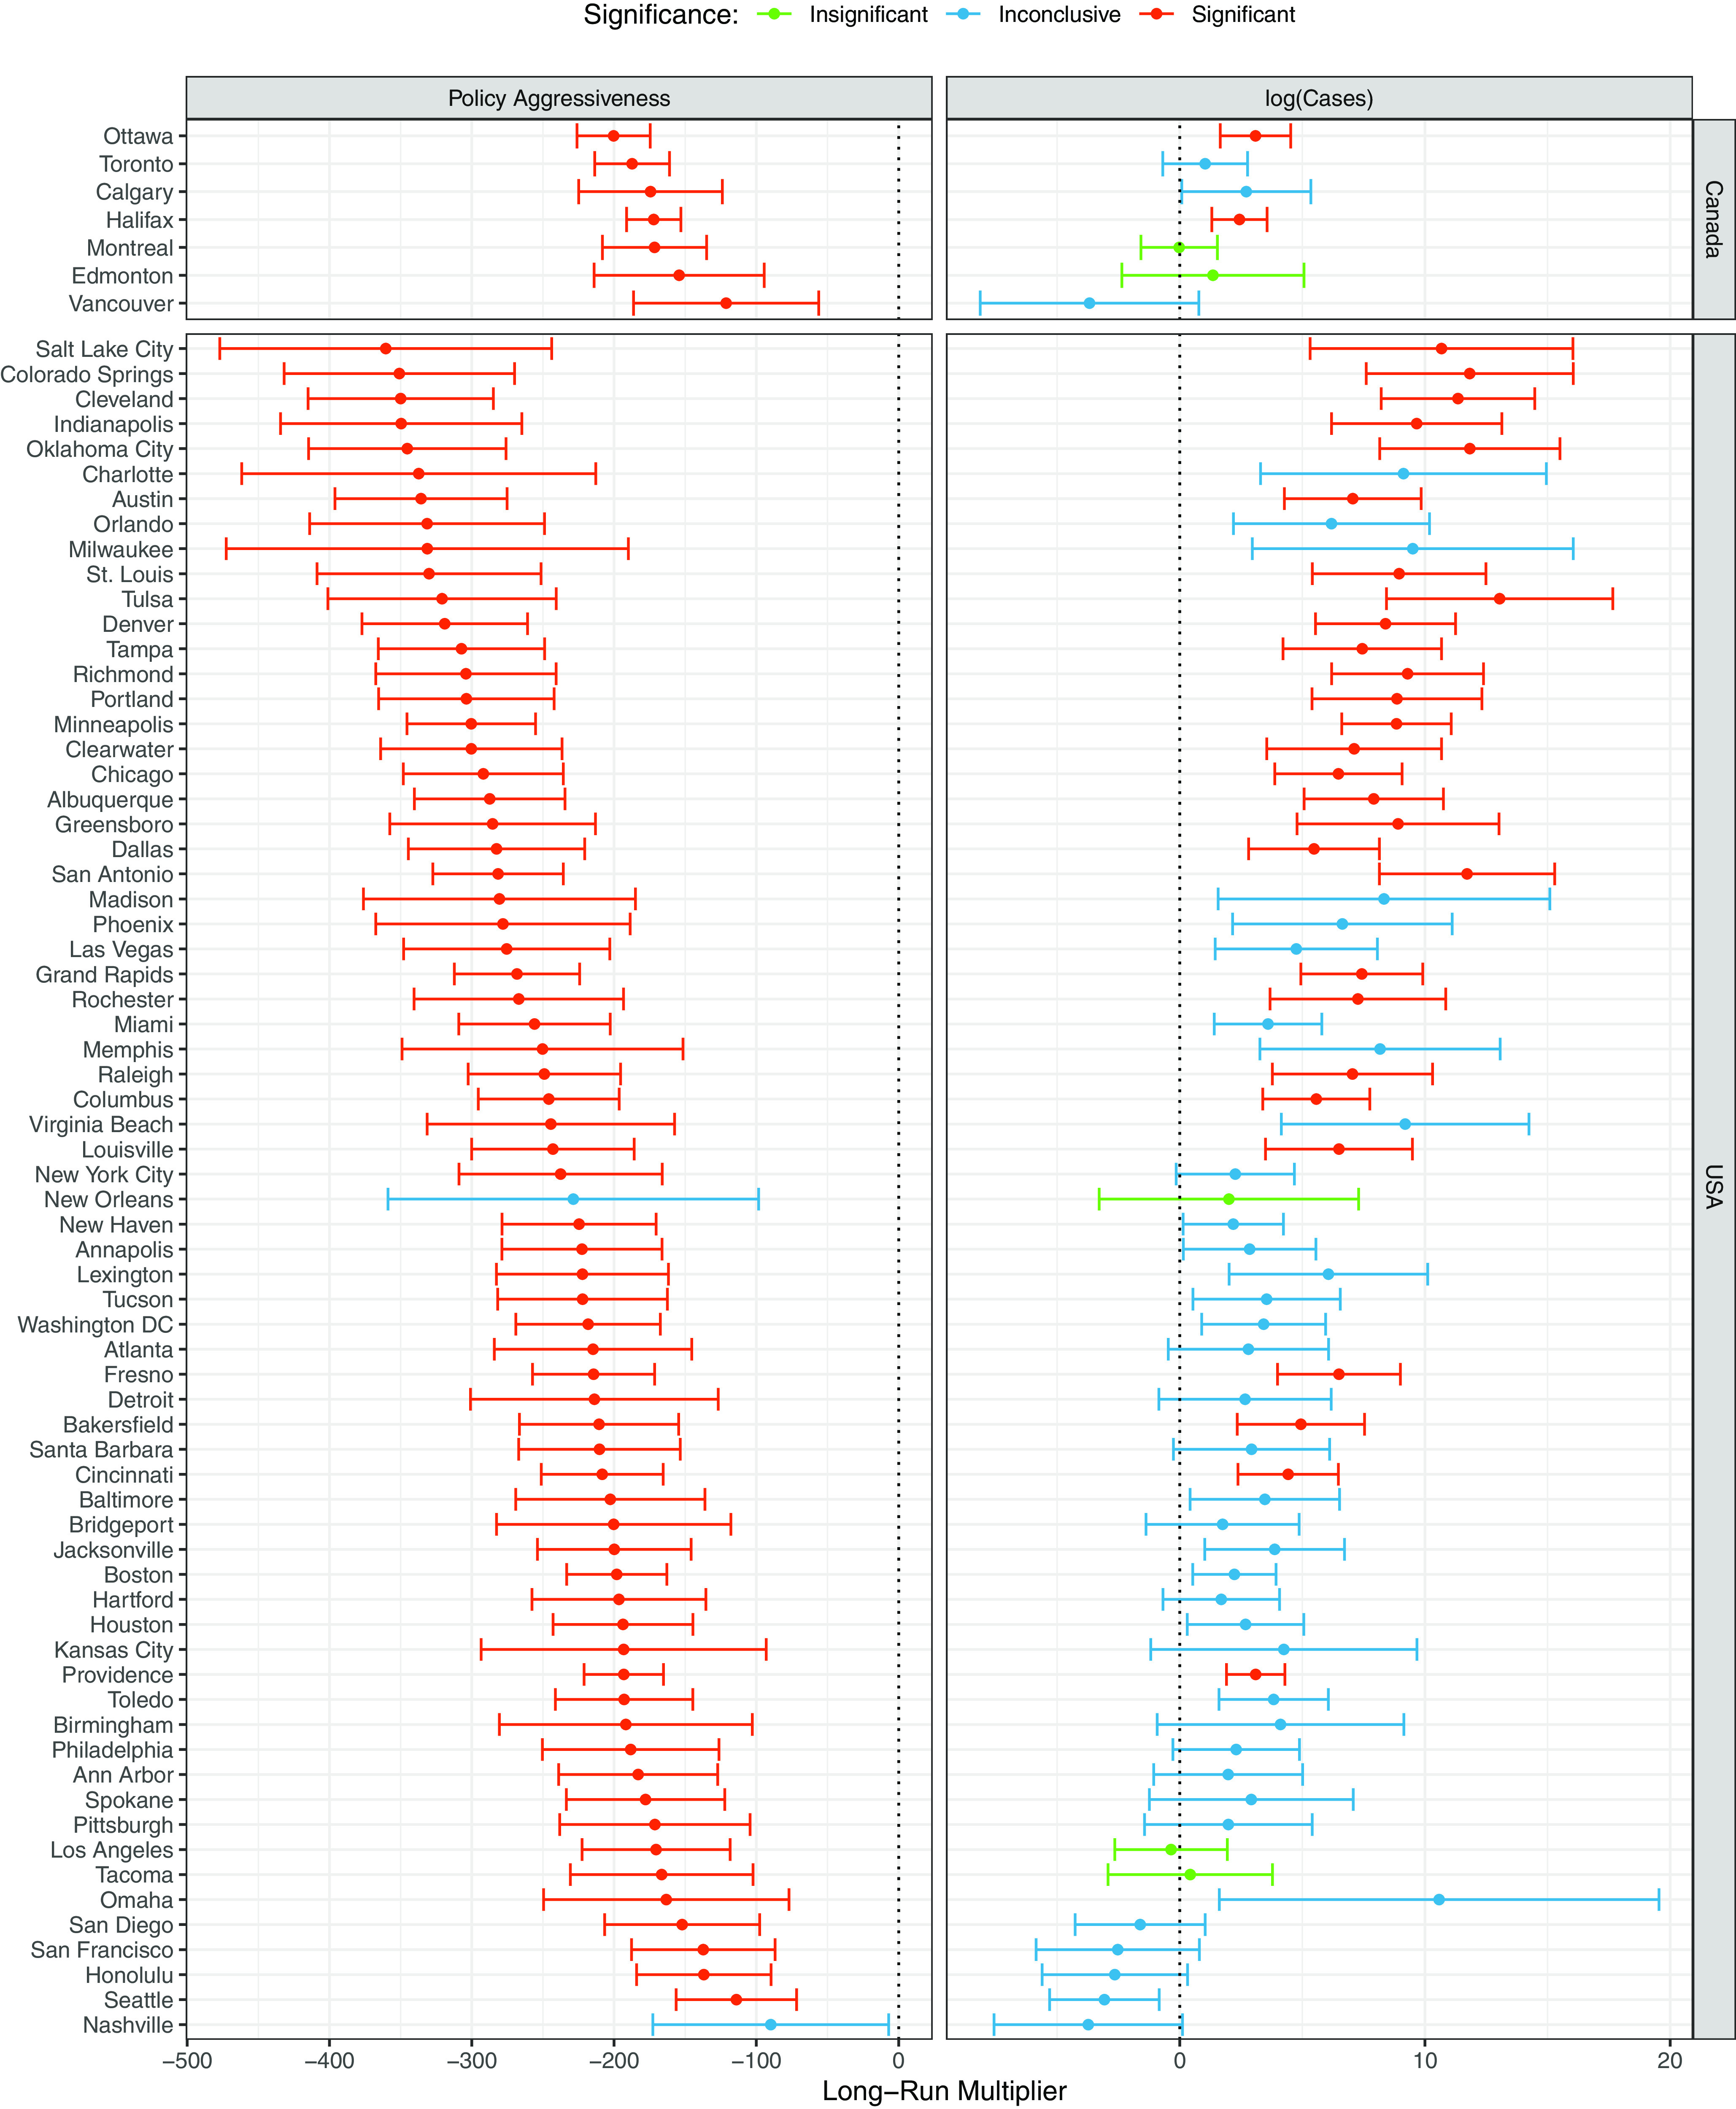
Perhaps more interesting are the long-run multipliers themselves, which we plot in Figure 4. The figure is sorted first by country, with Canadian cities at the top, and then by effect size within each country. The figure reveals that the effect of policy aggressiveness for the Canadian cities is in the lower to middle part of the overall distribution. There is also much less heterogeneity among the Canadian cities than among the American cities in the sample. Almost all of the policy effects are statistically significant, with only two cities (New Orleans and Nashville) showing inconclusive results. The effects of case totals, in the right-hand plot, are much more varied, with many inconclusive results. Overall, however, the effect is positive, suggesting that in the long run, more cases leads to more driving. This is a counterintuitive finding but could be a function of having already controlled for policy aggressiveness. It could also be related to displacement from transit, which we discuss below.
Figure 4:
Long-Run Multipliers for Driving
Figures 5 and 6 provide the same overview of results for transit mobility. We expect transit to be even more clearly affected by policy because changes in transit operations are directly affected by policy decisions, whereas changes in driving mobility are indirectly affected by policies that seek to decrease demand for driving. Once again, we see clear evidence for a relationship between policy and mobility, with consistently large and positive t statistics in Figure 5 and consistently negative estimates in Figure 6. Increases in policy aggressiveness, in other words, lead to large decreases in transit mobility. Once again, Canadian cities are more homogeneous in the effects of policy aggressiveness on transit mobility. Once again, the effects of local case totals are also more heterogeneous, but consistently negative in Canadian cities. This could help explain the positive effect of cases on driving: as people stop using public transit, some may start driving in order to move themselves around their cities.
Figure 5:
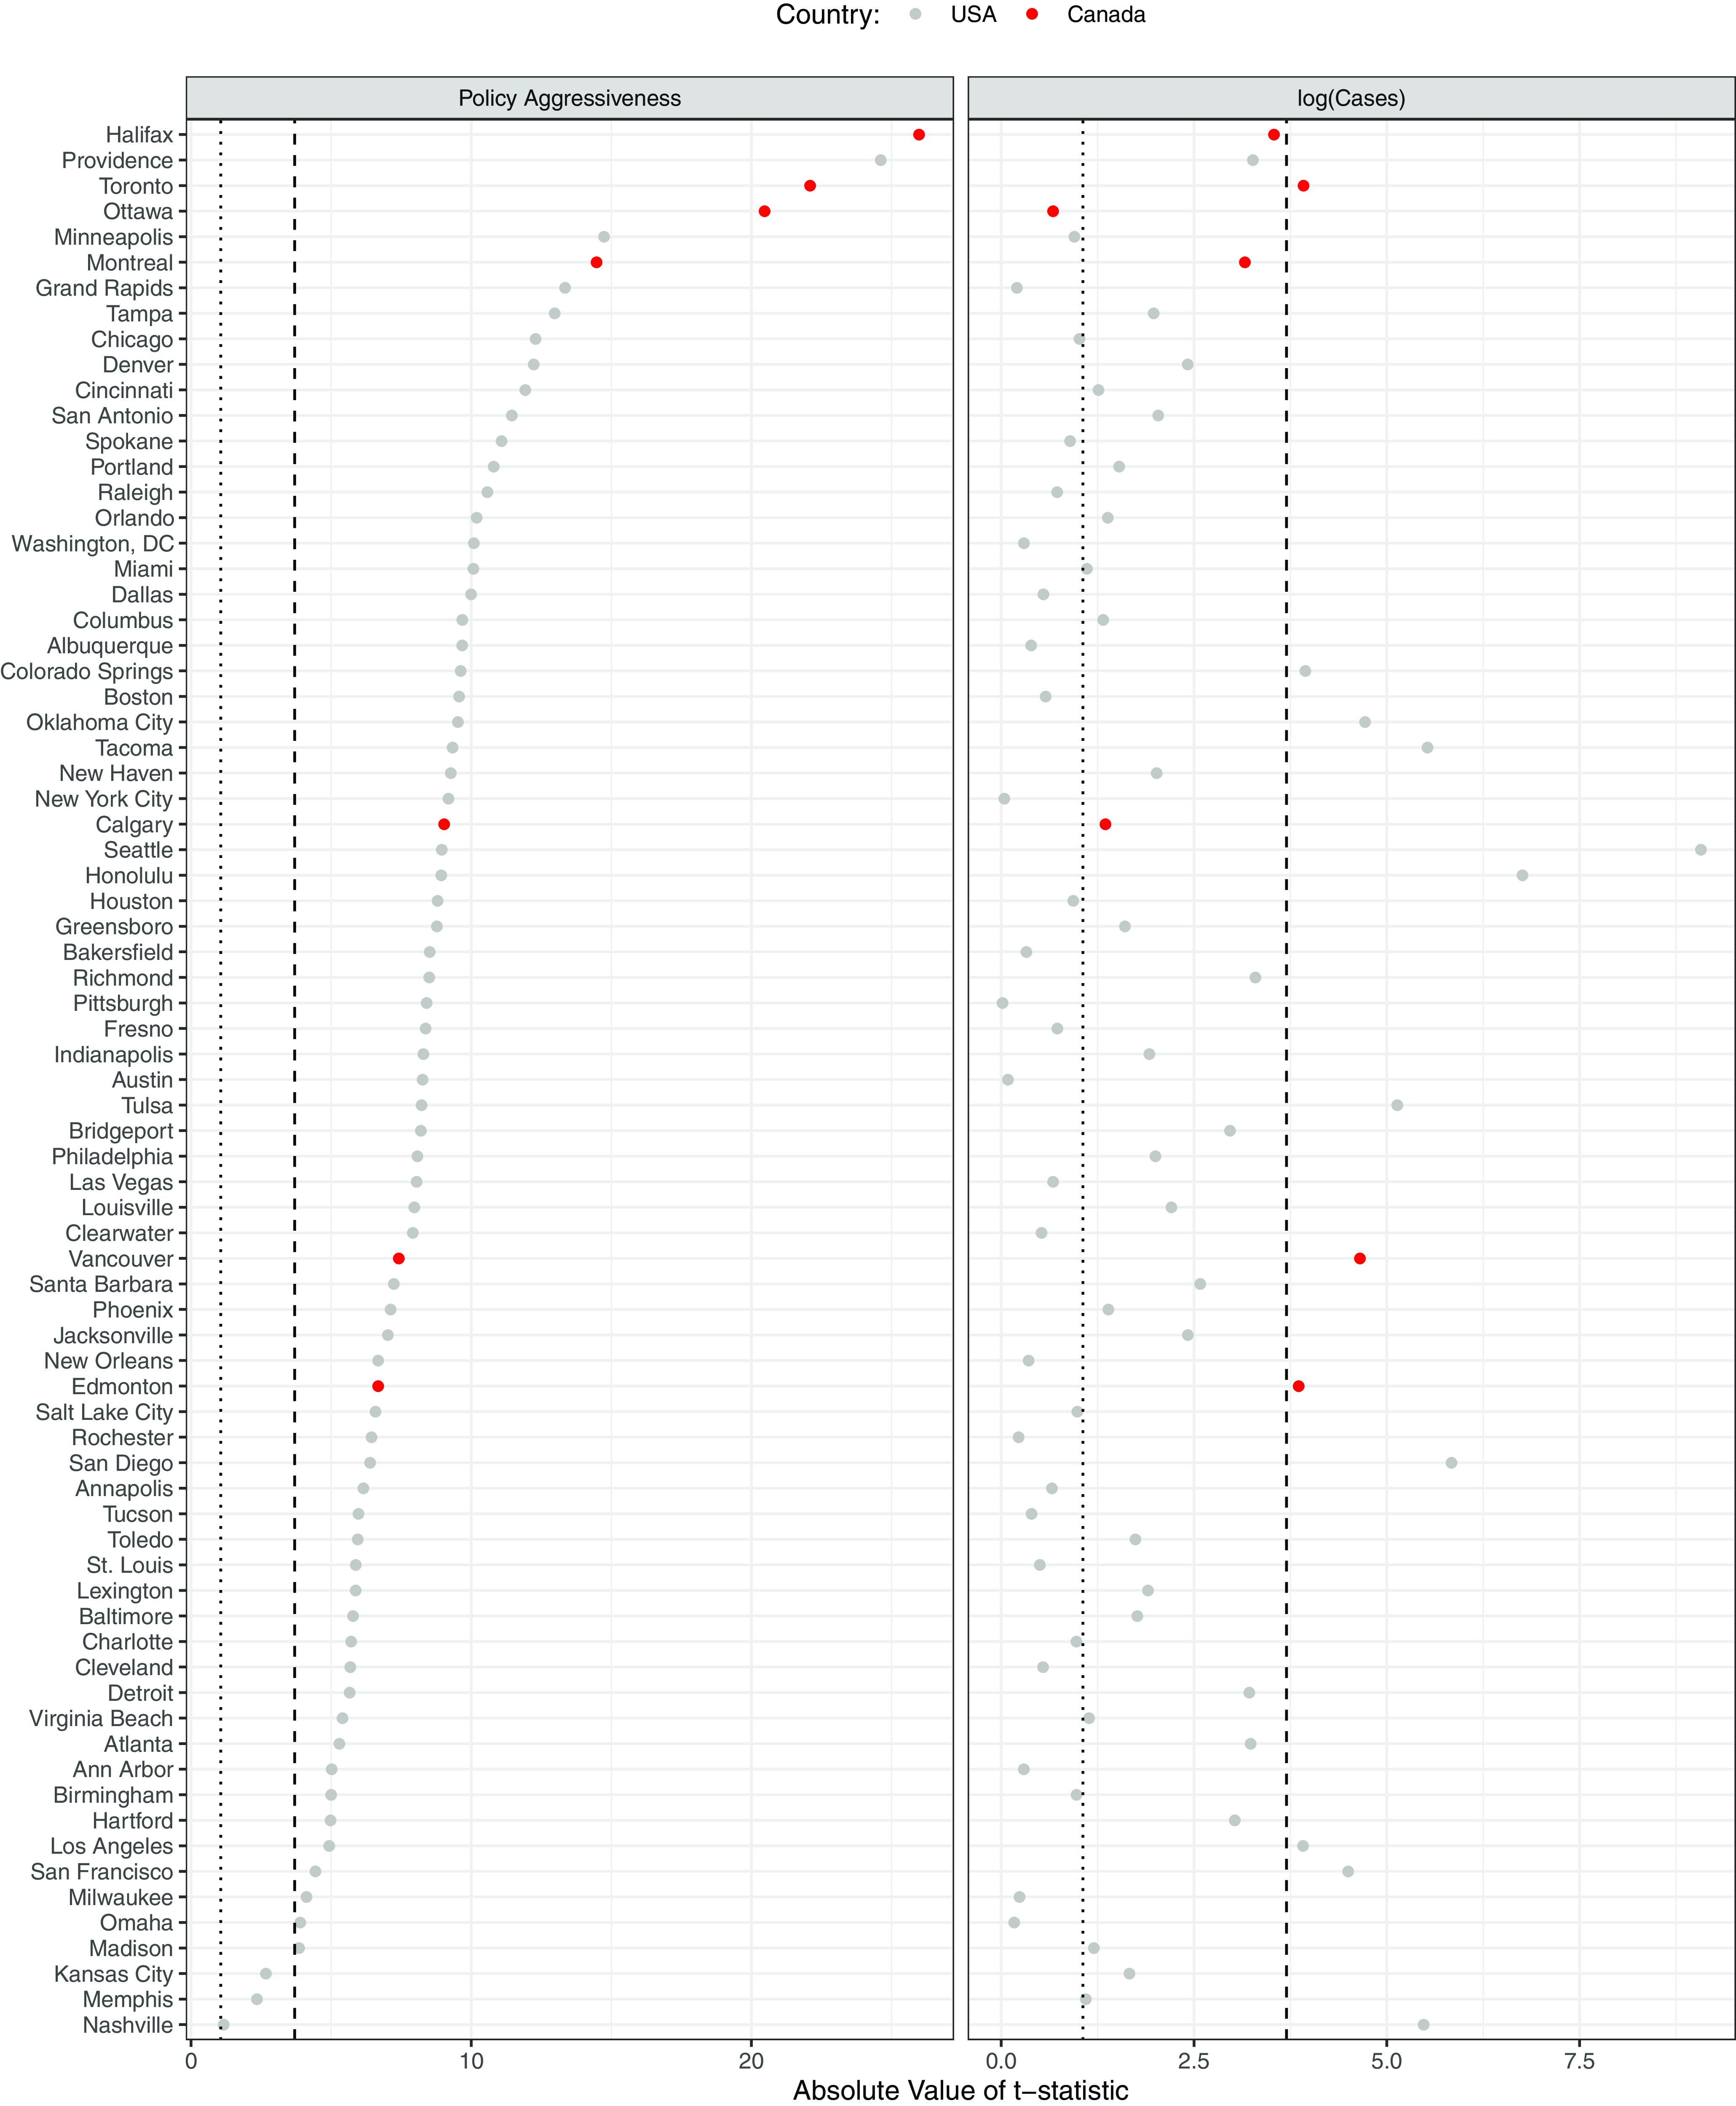
t-Statistics for Transit
Figure 6:
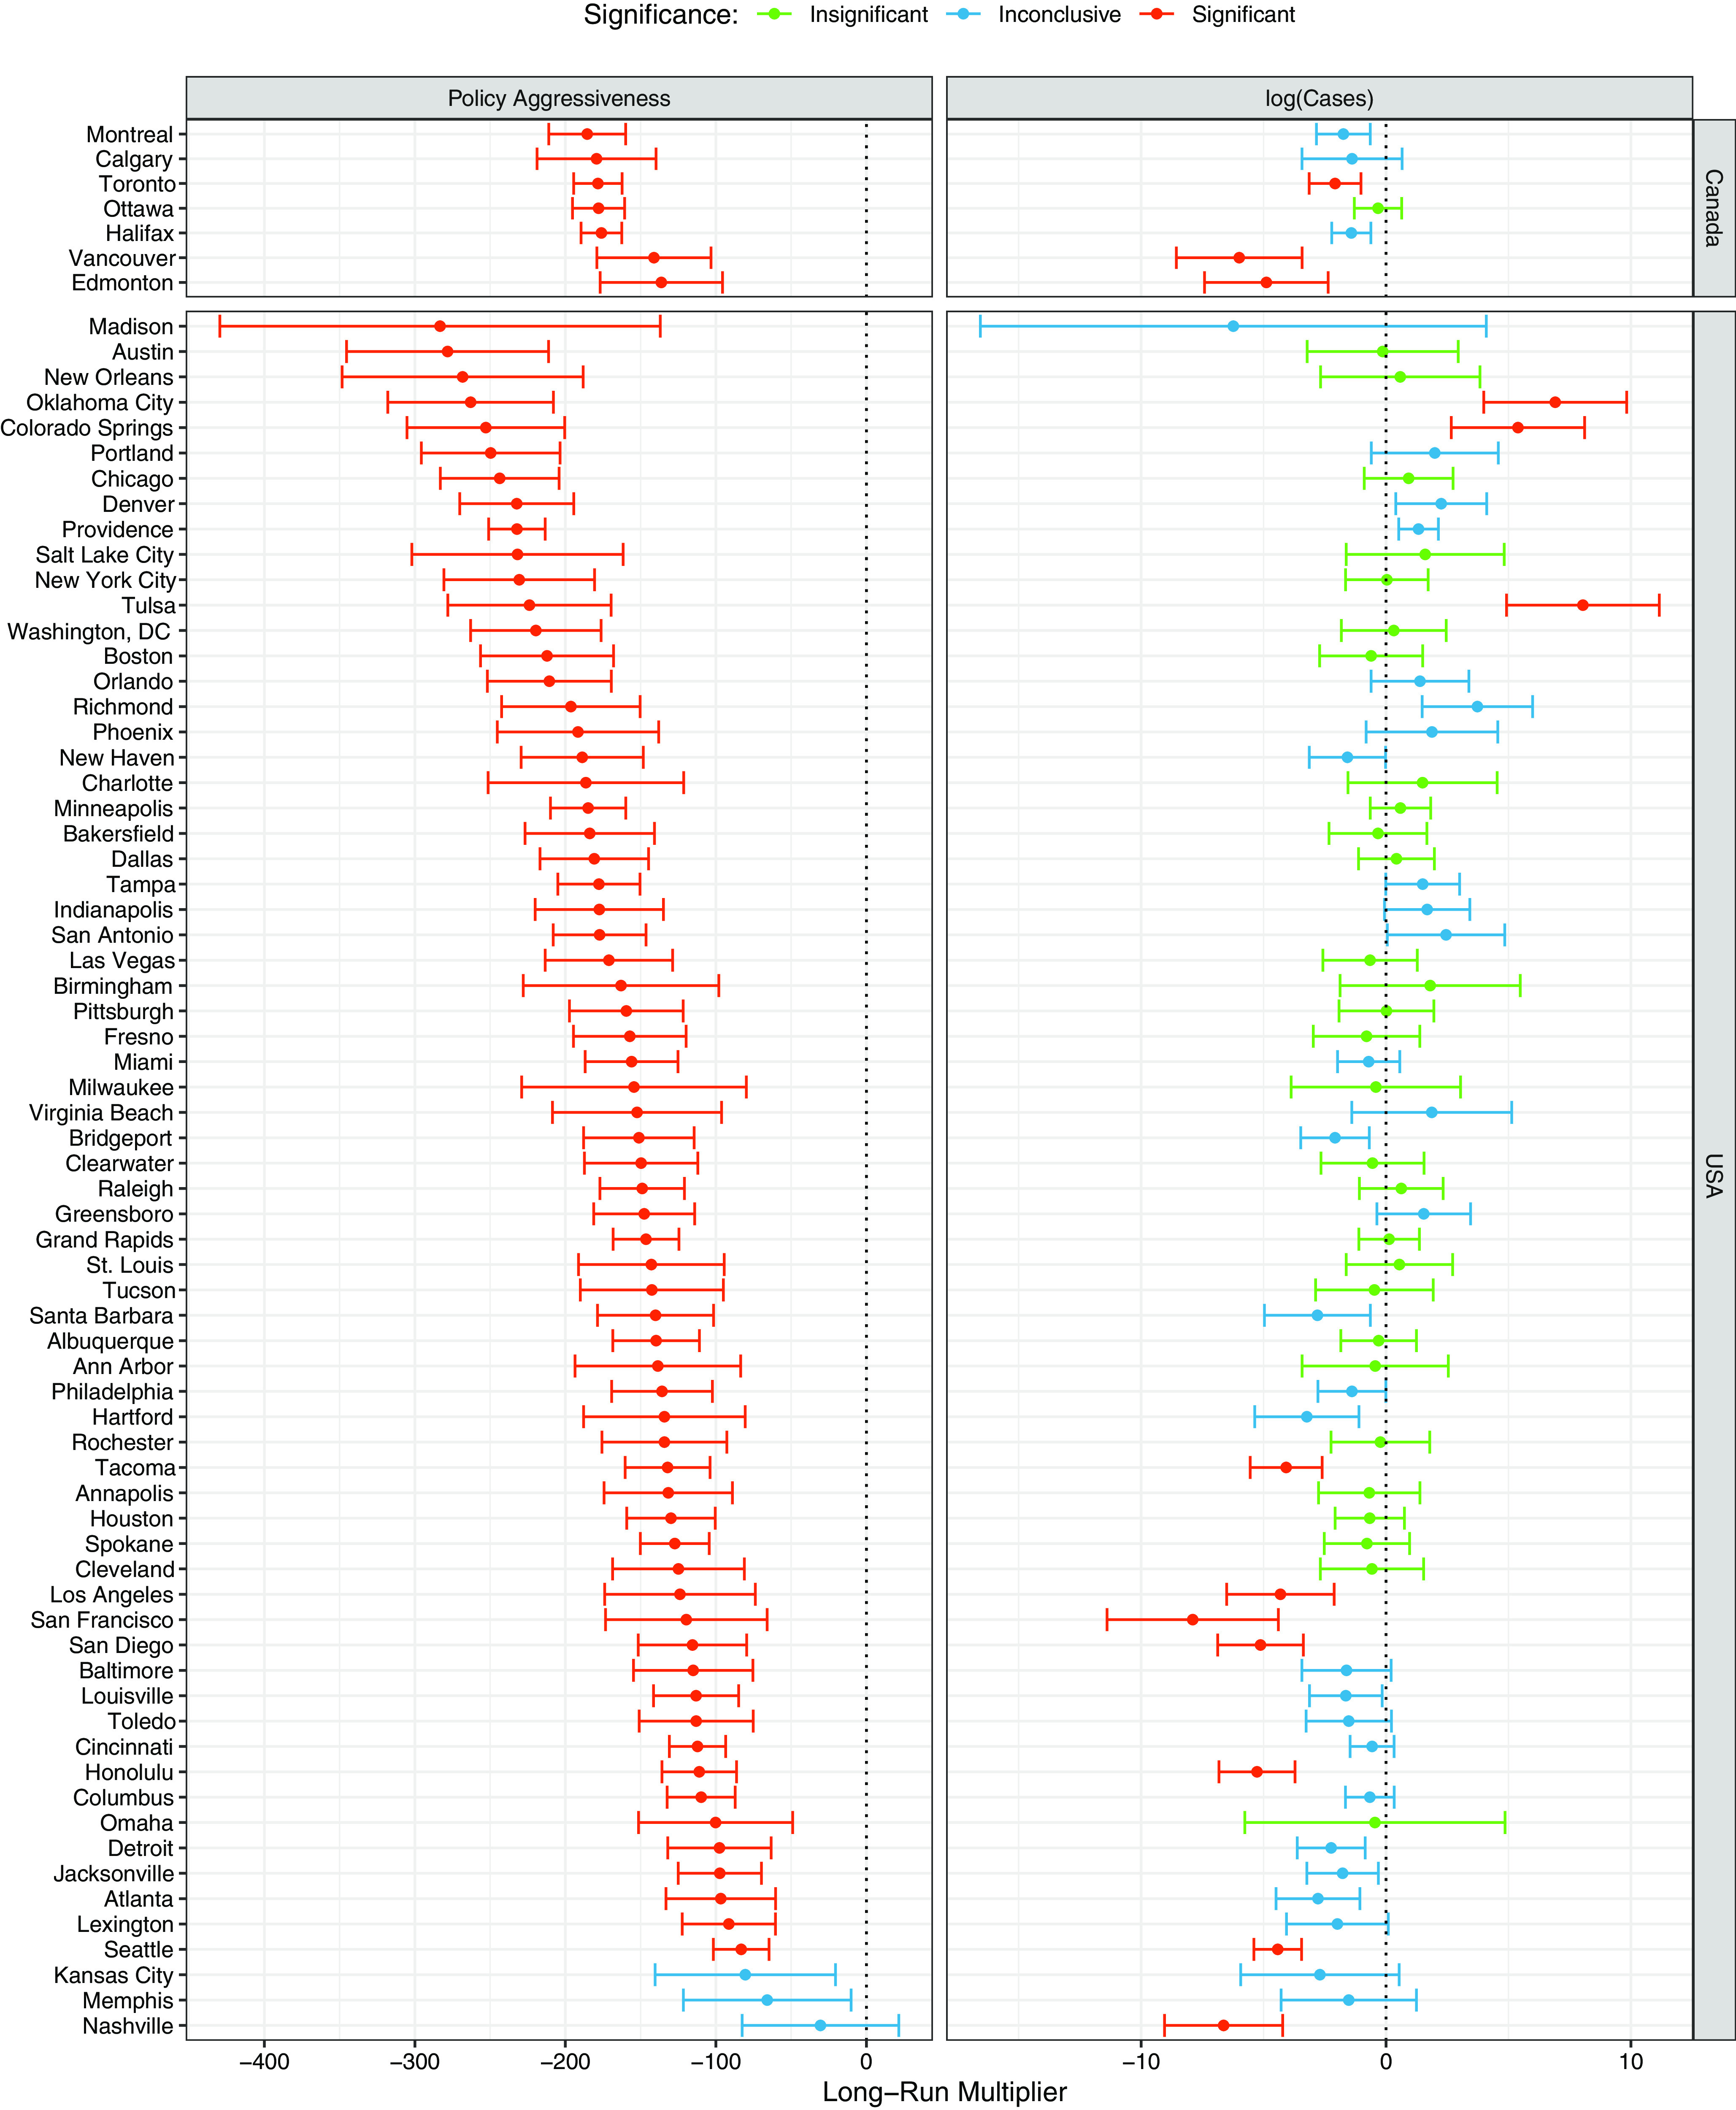
Long-Run Multipliers for Transit
Conclusions
In this article, we have sought to provide a first systematic comparative analysis of state/provincial and municipal COVID-19 policies in Canadian and American cities, as well as an assessment of the effects of those policies on local mobility patterns. Using a new measure of the multilevel policy environment in each city, we first found that policy differences between Canada and the United States were modest, differing more in the pace of implementation than in average policy aggressiveness. With respect to mobility, however, we found discernible differences between Canadian and American cities: on the average, all forms of mobility—driving, transit, and walking—dropped to lower levels in Canada than in the United States during the month of March, and have remained lower even as overall mobility levels in most cities have begun to slowly rise again.
We also tested the relationship between policy and mobility while controlling for local COVID-19 case totals and found clear evidence for policy effects on both driving and transit mobility in most Canadian and American cities. The sizes of these effects were more homogeneous in Canada than in the United States, but aside from this homogeneity, Canadian cities do not differ systematically from American cities: in nearly all cities, we find evidence that COVID-19 policy affects subsequent mobility patterns. Thus, despite important overall mobility differences, we have found little evidence to suggest that residents of Canadian cities faced a more aggressive local–provincial policy mix, or were more responsive to that policy mix, than their American urban counterparts.
In future research, these findings could be extended in several ways. Perhaps most obviously, adding data on mobility patterns as state/provincial and municipal governments further relax their pandemic-period policy restrictions would add additional insight into aggregate responses to local and state/provincial policies. As more data become available, scholars may also wish to investigate the effects of specific policies, such as states of emergency or business closures, on mobility patterns. Incorporating additional countries beyond Canada and the United States would allow a fully multilevel comparison of the local effects of the federal–provincial–municipal COVID-19 policy mix across countries.
We also see a potential for extensions of this research beyond the urgent questions of the COVID-19 pandemic. Our approach to policy measurement, which conceptualizes the local policy environment as a mix of municipal and provincial policy decisions, has the potential to extend to a wide range of important areas of multilevel policy research, such as economic development, climate change policy, and immigrant settlement. Moreover, as we have done here, these policy measures could be combined with increasingly available local data on mobility patterns, the topics and frequency of local service requests, and other data sources to build time-series estimates of the effects of the multilevel policy environment on citizen behaviour. Refining these measures and methods in the data-rich environment of COVID-19 and then applying them to a wider range of important local policy domains in future research promises not only to answer pressing policy questions amidst the pandemic, but also to improve our understanding of the effects of multilevel policy-making in Canadian cities more generally.
Appendix
Additional Descriptive Data
Figure A.1 summarizes our measure of local policy aggressiveness for each of the 75 cities in the analysis. Recall that this measure combines both provincial/state and municipal policy indicators into a measure of the local policy environment in each city on each day from 13 January to 13 May 2020.
Canada–US Mobility and Policy Differences
In our description of local policy environments in the main text, we suggested that Canadian and American cities began and ended the month of March in very similar policy environments, on the average, but that the trajectory was more sudden in Canada, with most Canadian cities surging upwards in policy aggressiveness in the middle of March. Readers may worry that this finding arises due to the greater heterogeneity that we would expect from the larger sample of American than Canadian cities. We test this possibility in Figure A.2, which compares mean policy aggressiveness in Canadian cities, marked by the vertical red line, to the distribution of mean aggressiveness in 10,000 samples of seven American cities (to match the number of Canadian cities in the analysis). We find that Canadian cities were less aggressive on 11 March in 100% of the samples and more aggressive on 16 March in 99.65% of the samples.
Figure A.1:
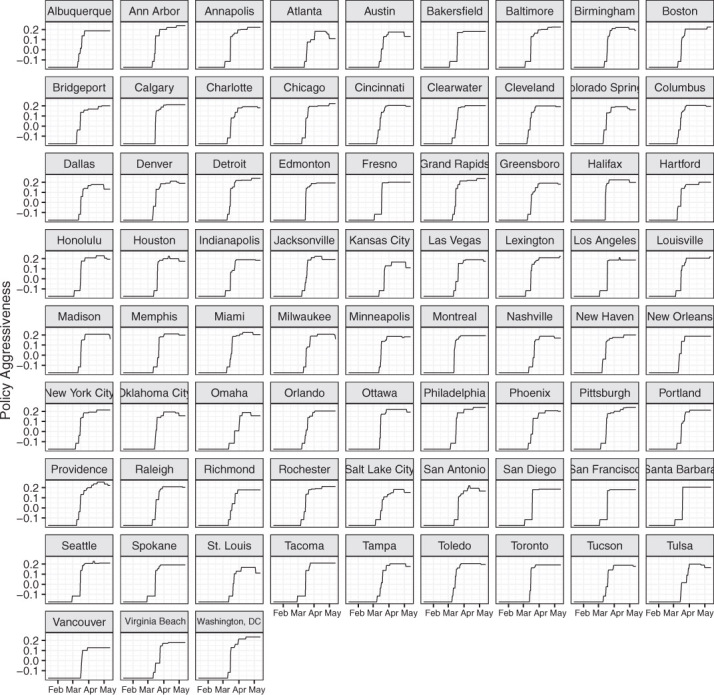
Policy by City
Figure A.2:
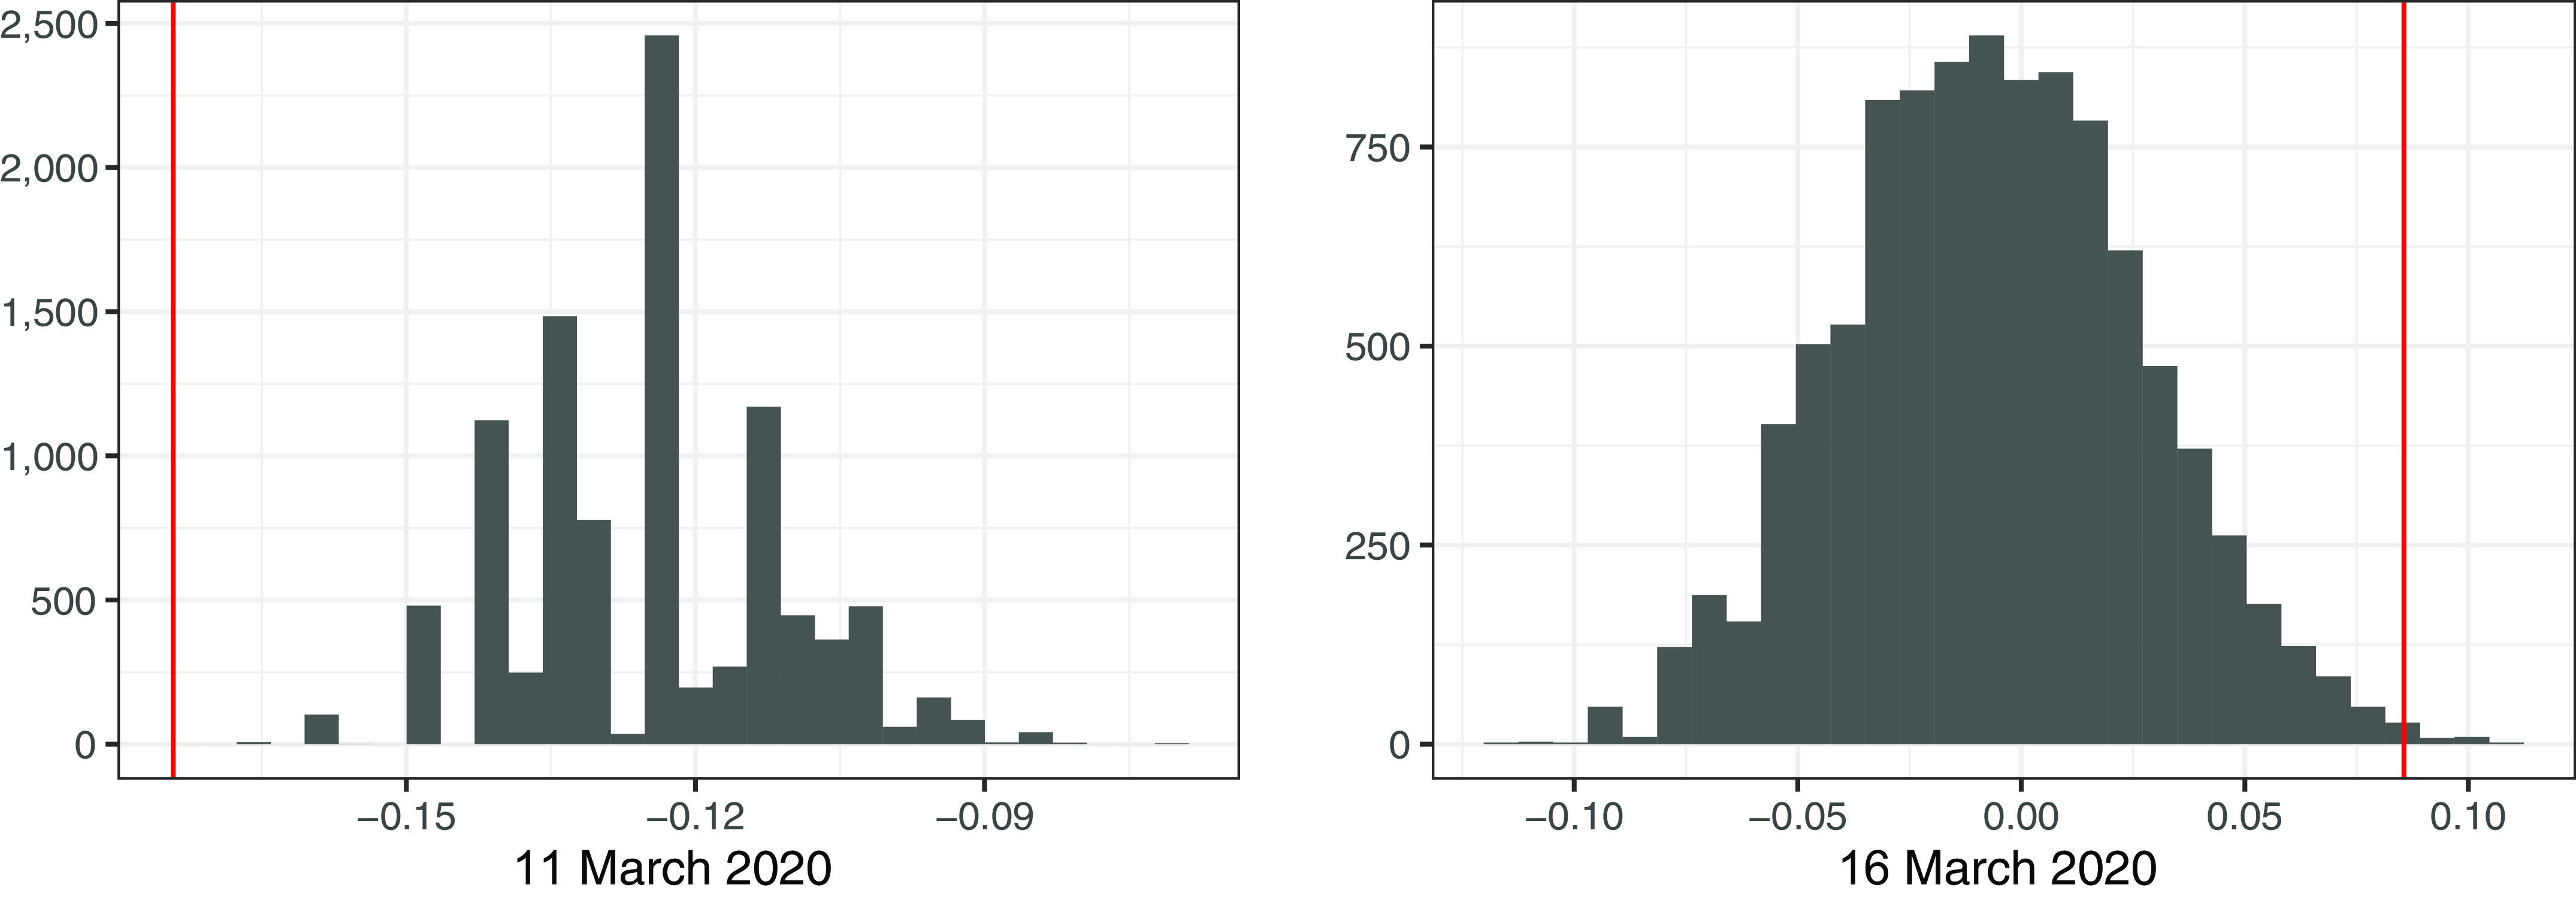
Canadian Mean Policy vs. American Samples
In our description of Canadian–American differences in policy and mobility, we described the dates on which the two countries begin to differ from one another. In the following figures, we provide additional detail to clarify our discussion of those dates. Each figure provides a daily estimate of the relationship between the country to which a city belongs and the relevant measure; the black line marks daily coefficient estimates and the grey area marks 95% confidence intervals. Positive values—that is, values above the dotted line—indicate that the measure is higher in the United States than in Canada. Figure A.3 summarizes the relationship between country and each of the three forms of mobility; Figure A.4 summarizes the relationship between country and policy aggressiveness.
Further Discussion of Latent Variable Model
Here, we describe in greater detail the results of the Item Response Theory model estimated in the article. In particular, we want to describe the distribution of coefficients for the indicators (i.e., the difficulty and discrimination parameters) as well as the distribution of the latent variable itself.
First, we look at the distribution of policy aggressiveness by month. Figure A.5 shows that policy aggressiveness increases from March to April and then stays quite similar from April to May, though you can see some of the lower end of the distribution starting to fill out the slightest bit. The seven Canadian cities in the sample tend to fall around or slightly above the mode of the distribution.
Next, we can evaluate the reliability of the indicators by looking at their item characteristic curves (ICCs). These show the ways that underlying policy aggressiveness maps on to policy decisions according to the model. Figure A.6 displays these curves. Closing parks, imposing face mask requirements, limiting transit, and closing daycares are among the best indicators of policy aggressiveness, as they tend to discriminate among places with different policy profiles. At the other end, things such as states of emergency are adopted by nearly all municipalities really early on. Closings of gyms and shelters also happened ubiquitously, and thus fail to help us discriminate between more and less aggressive cities.
Figure A.3:
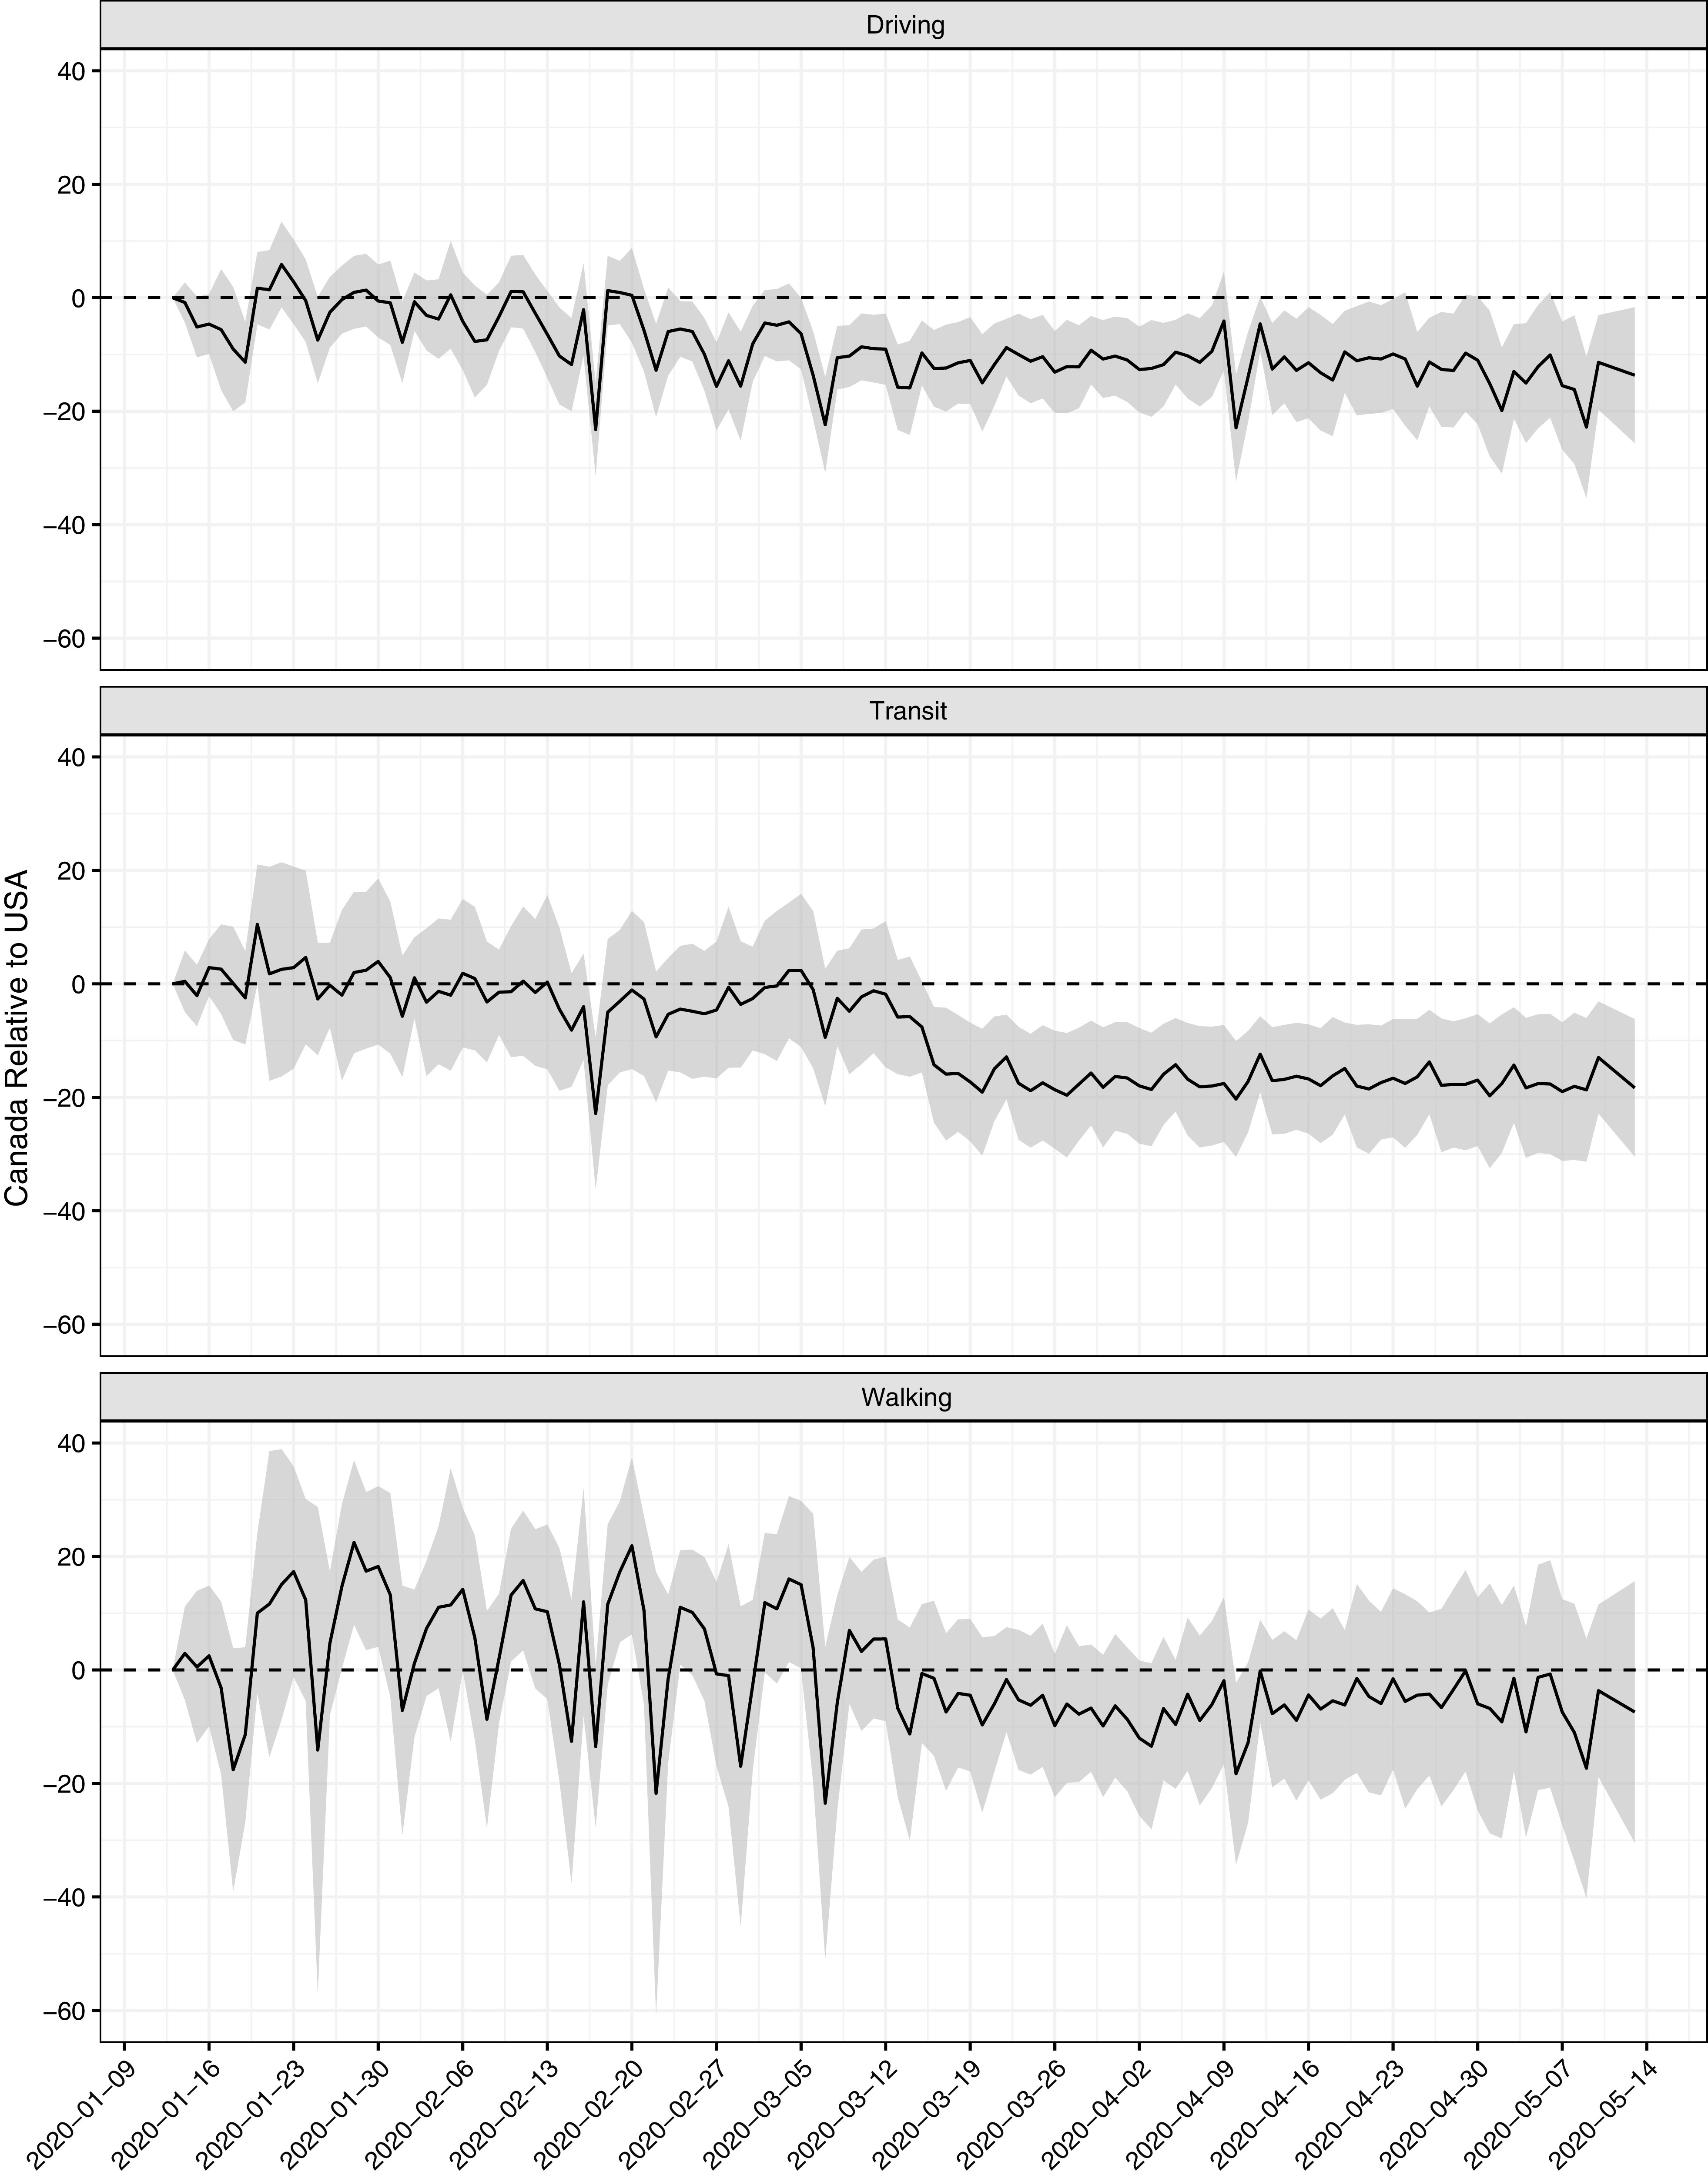
Daily Mobility, United States vs. Canada
Figure A.4:
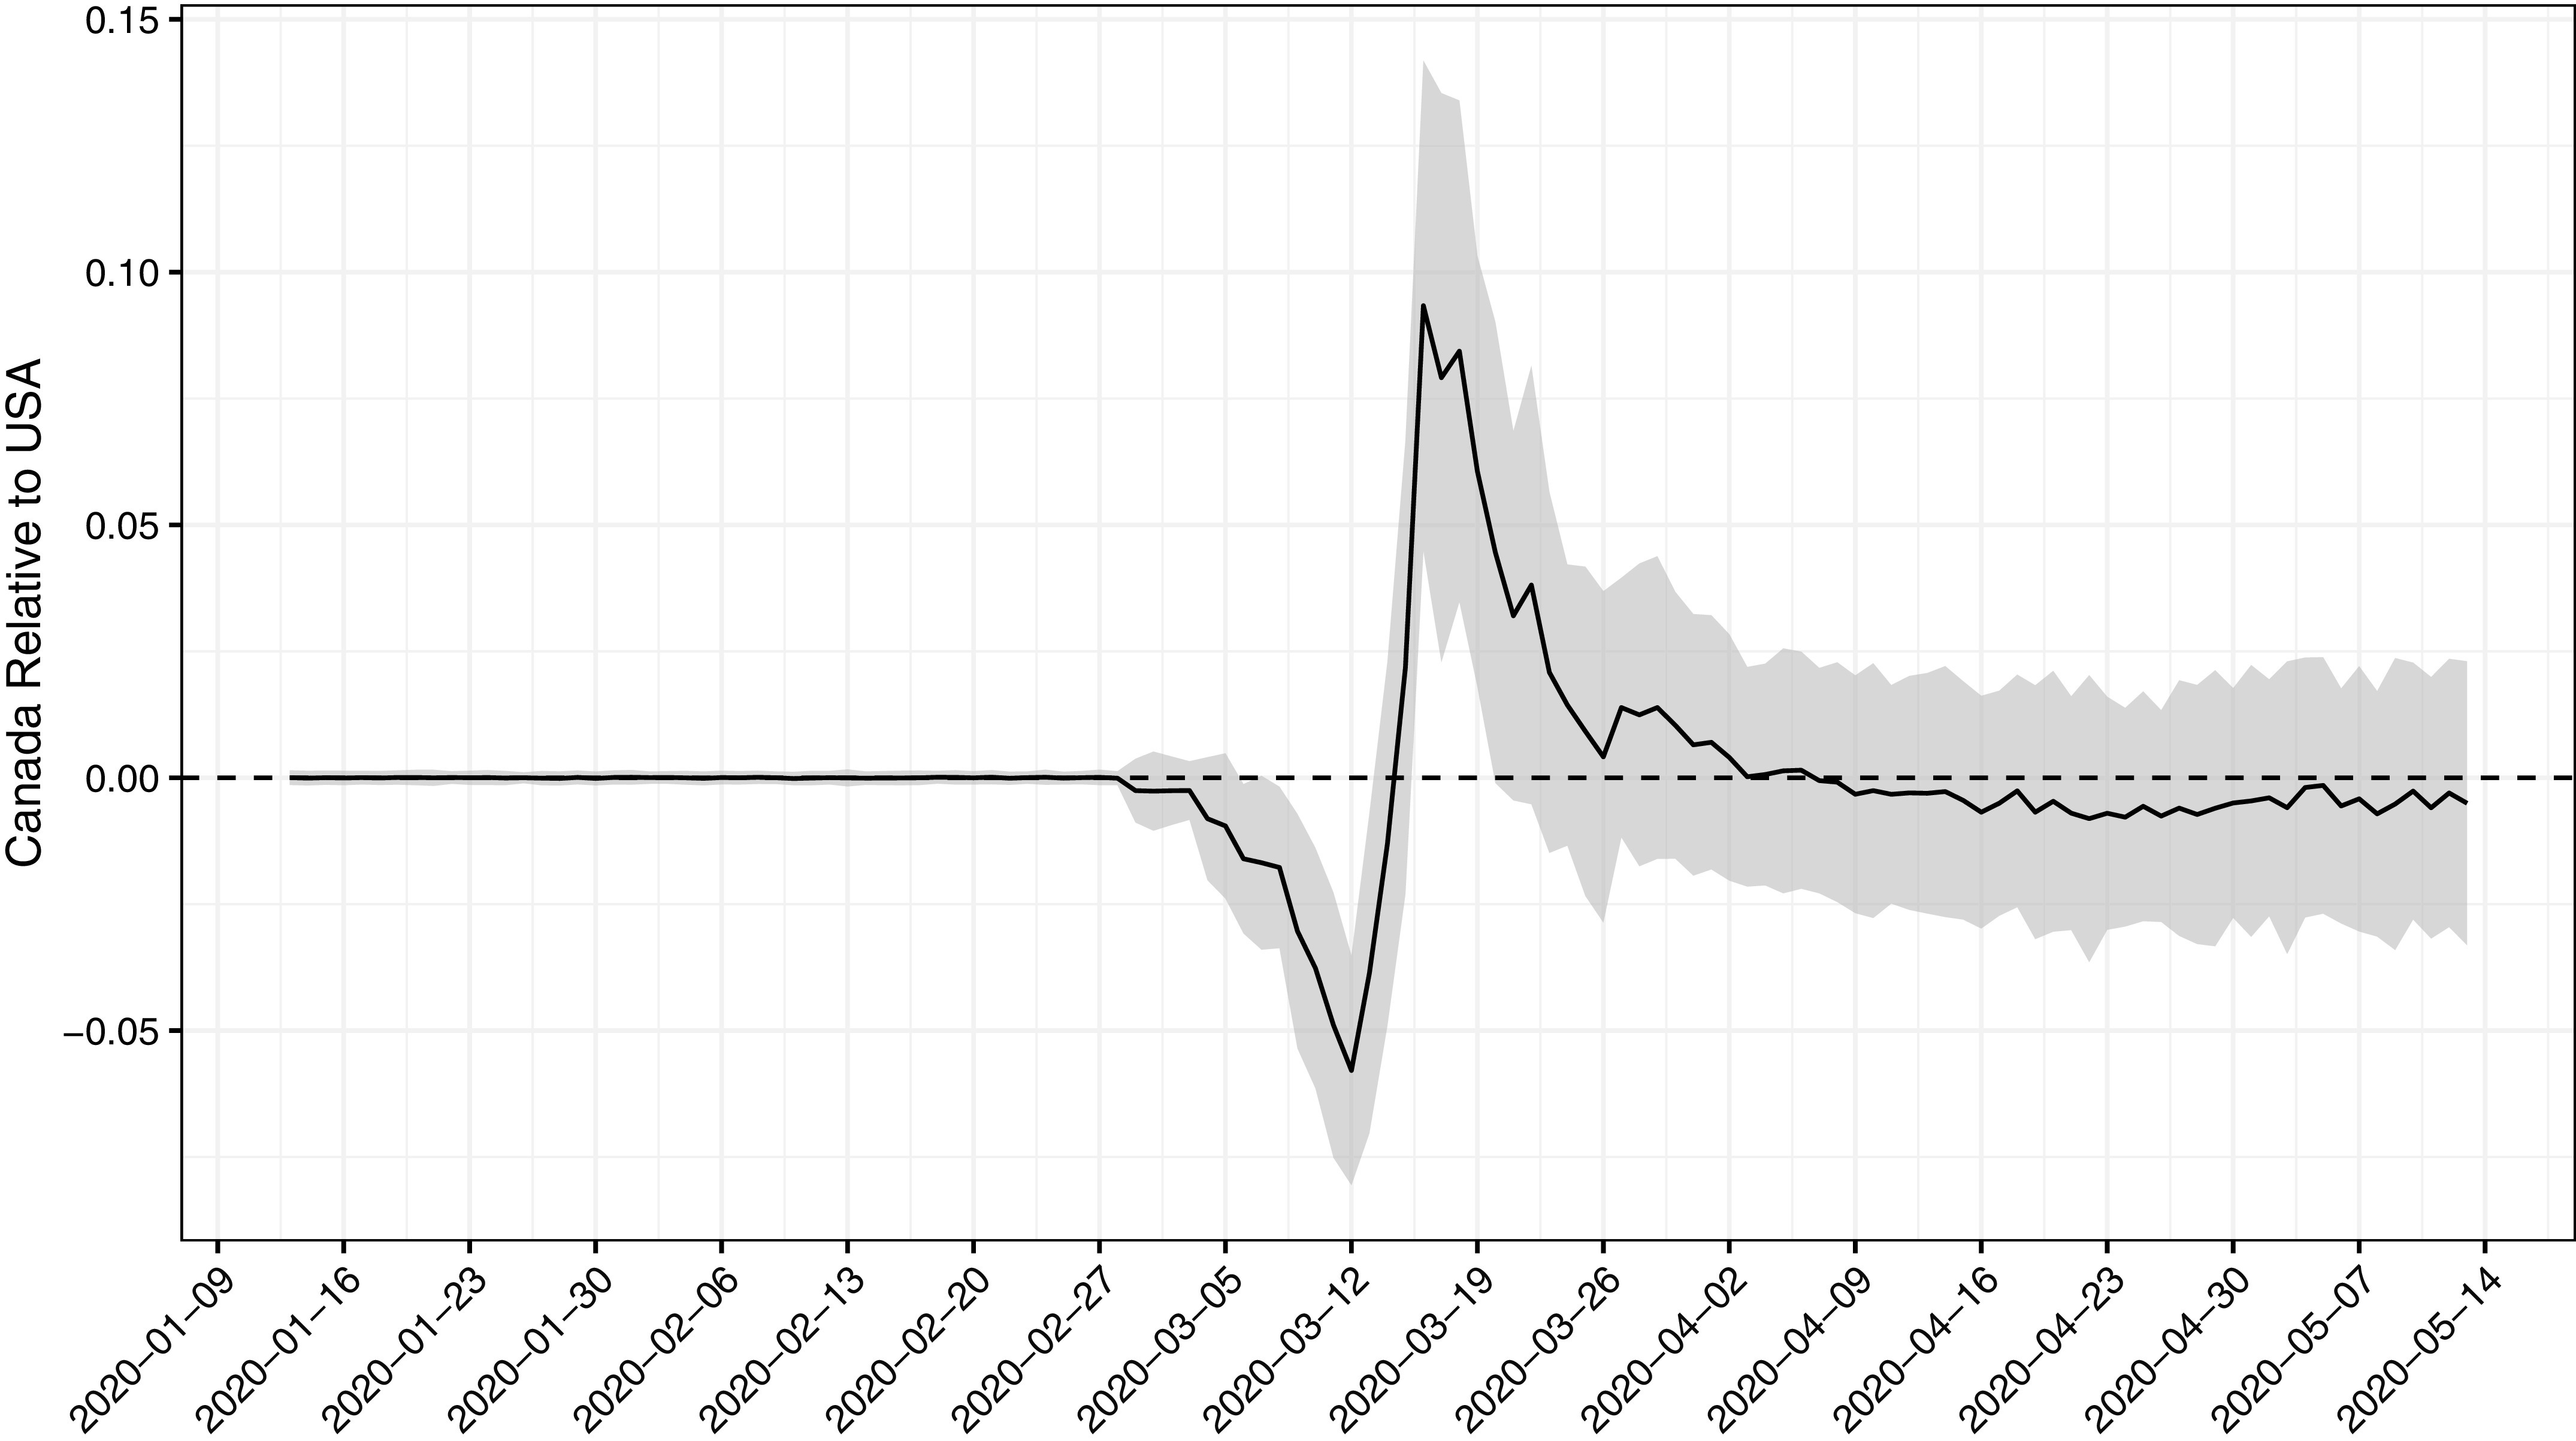
Policy, United States vs. Canada
Figure A.5:
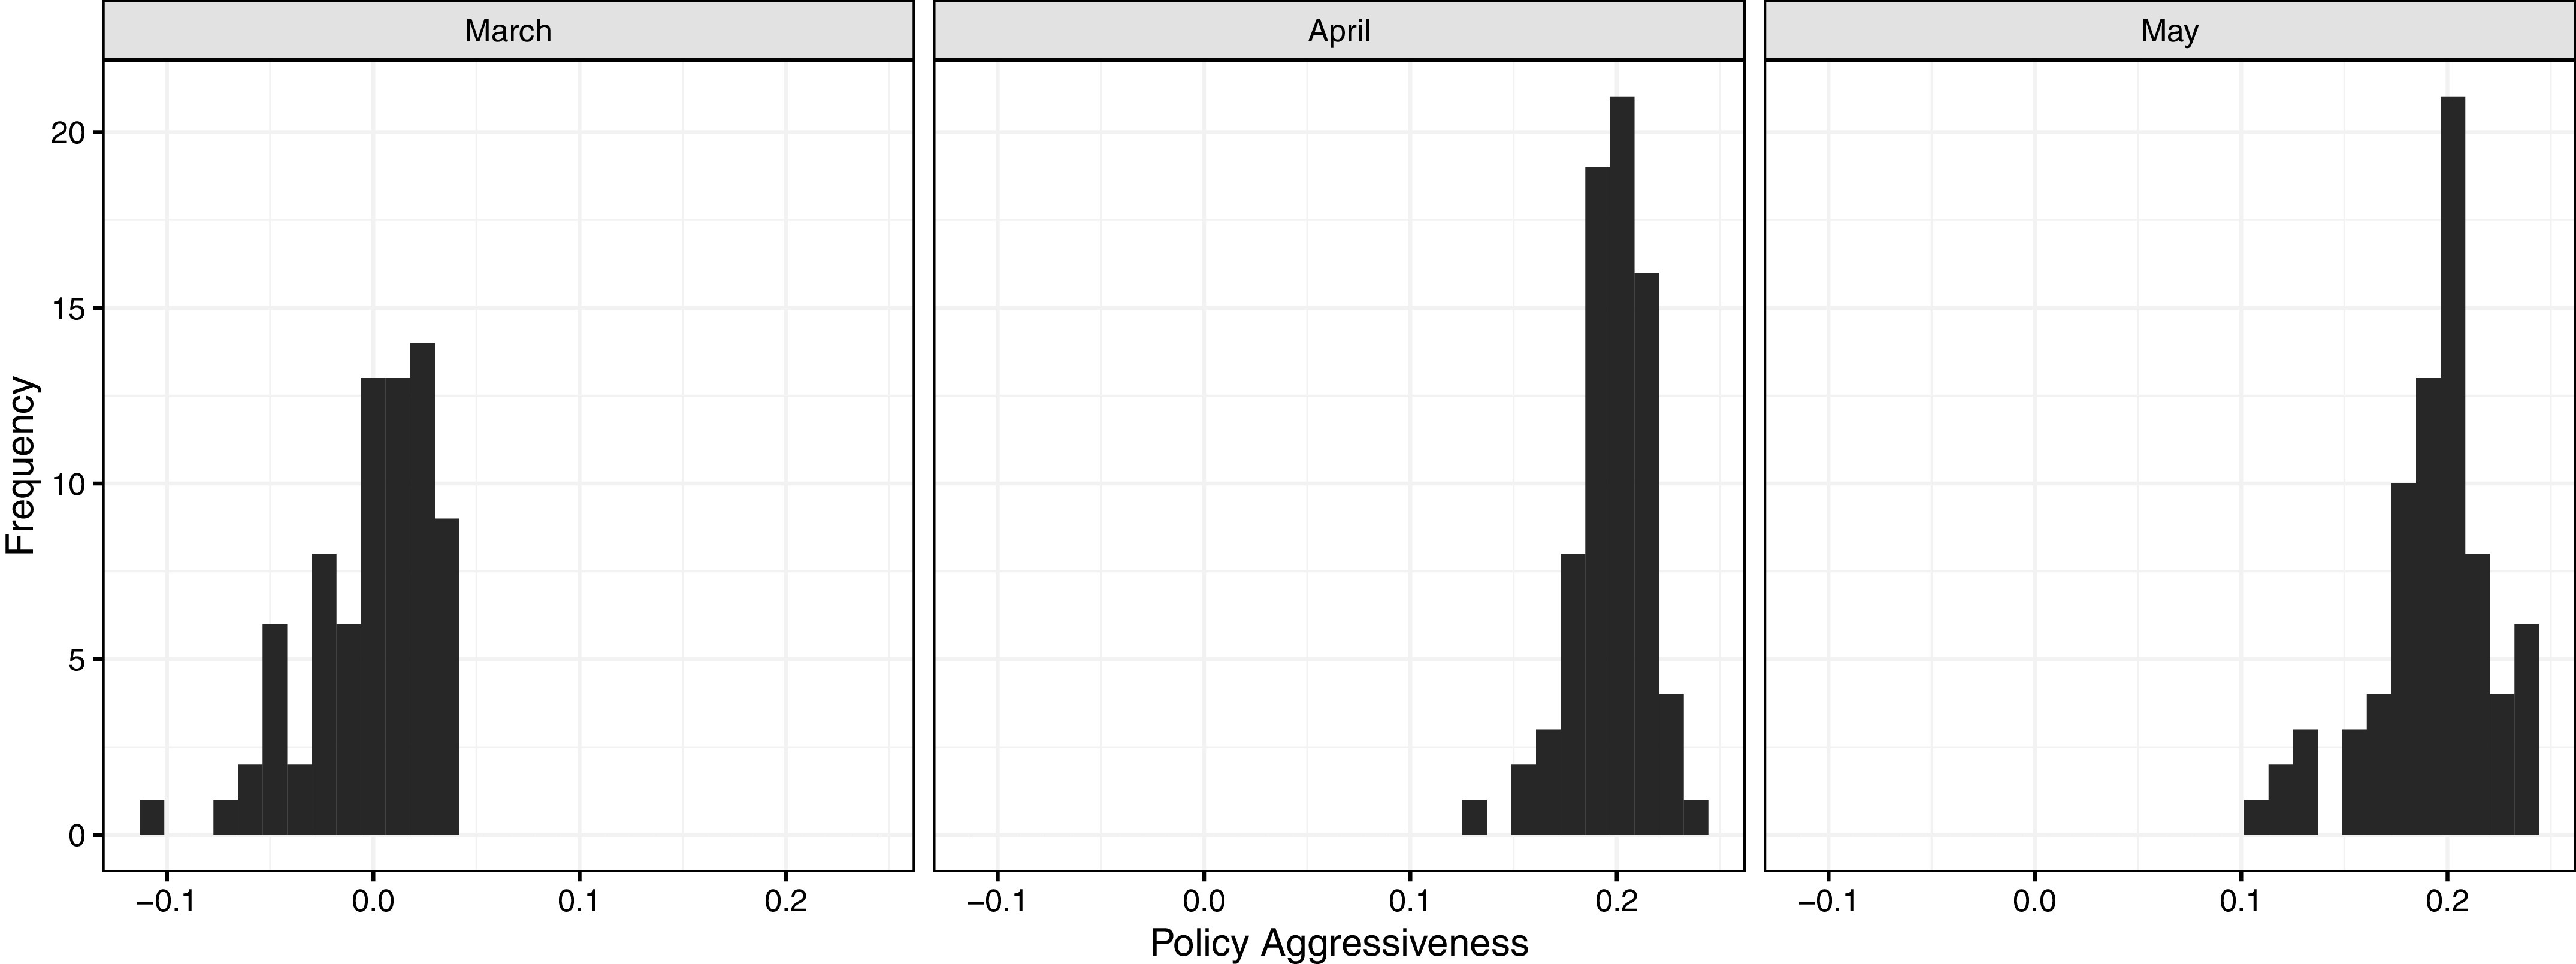
Policy Aggressiveness by Month
Figure A.6:
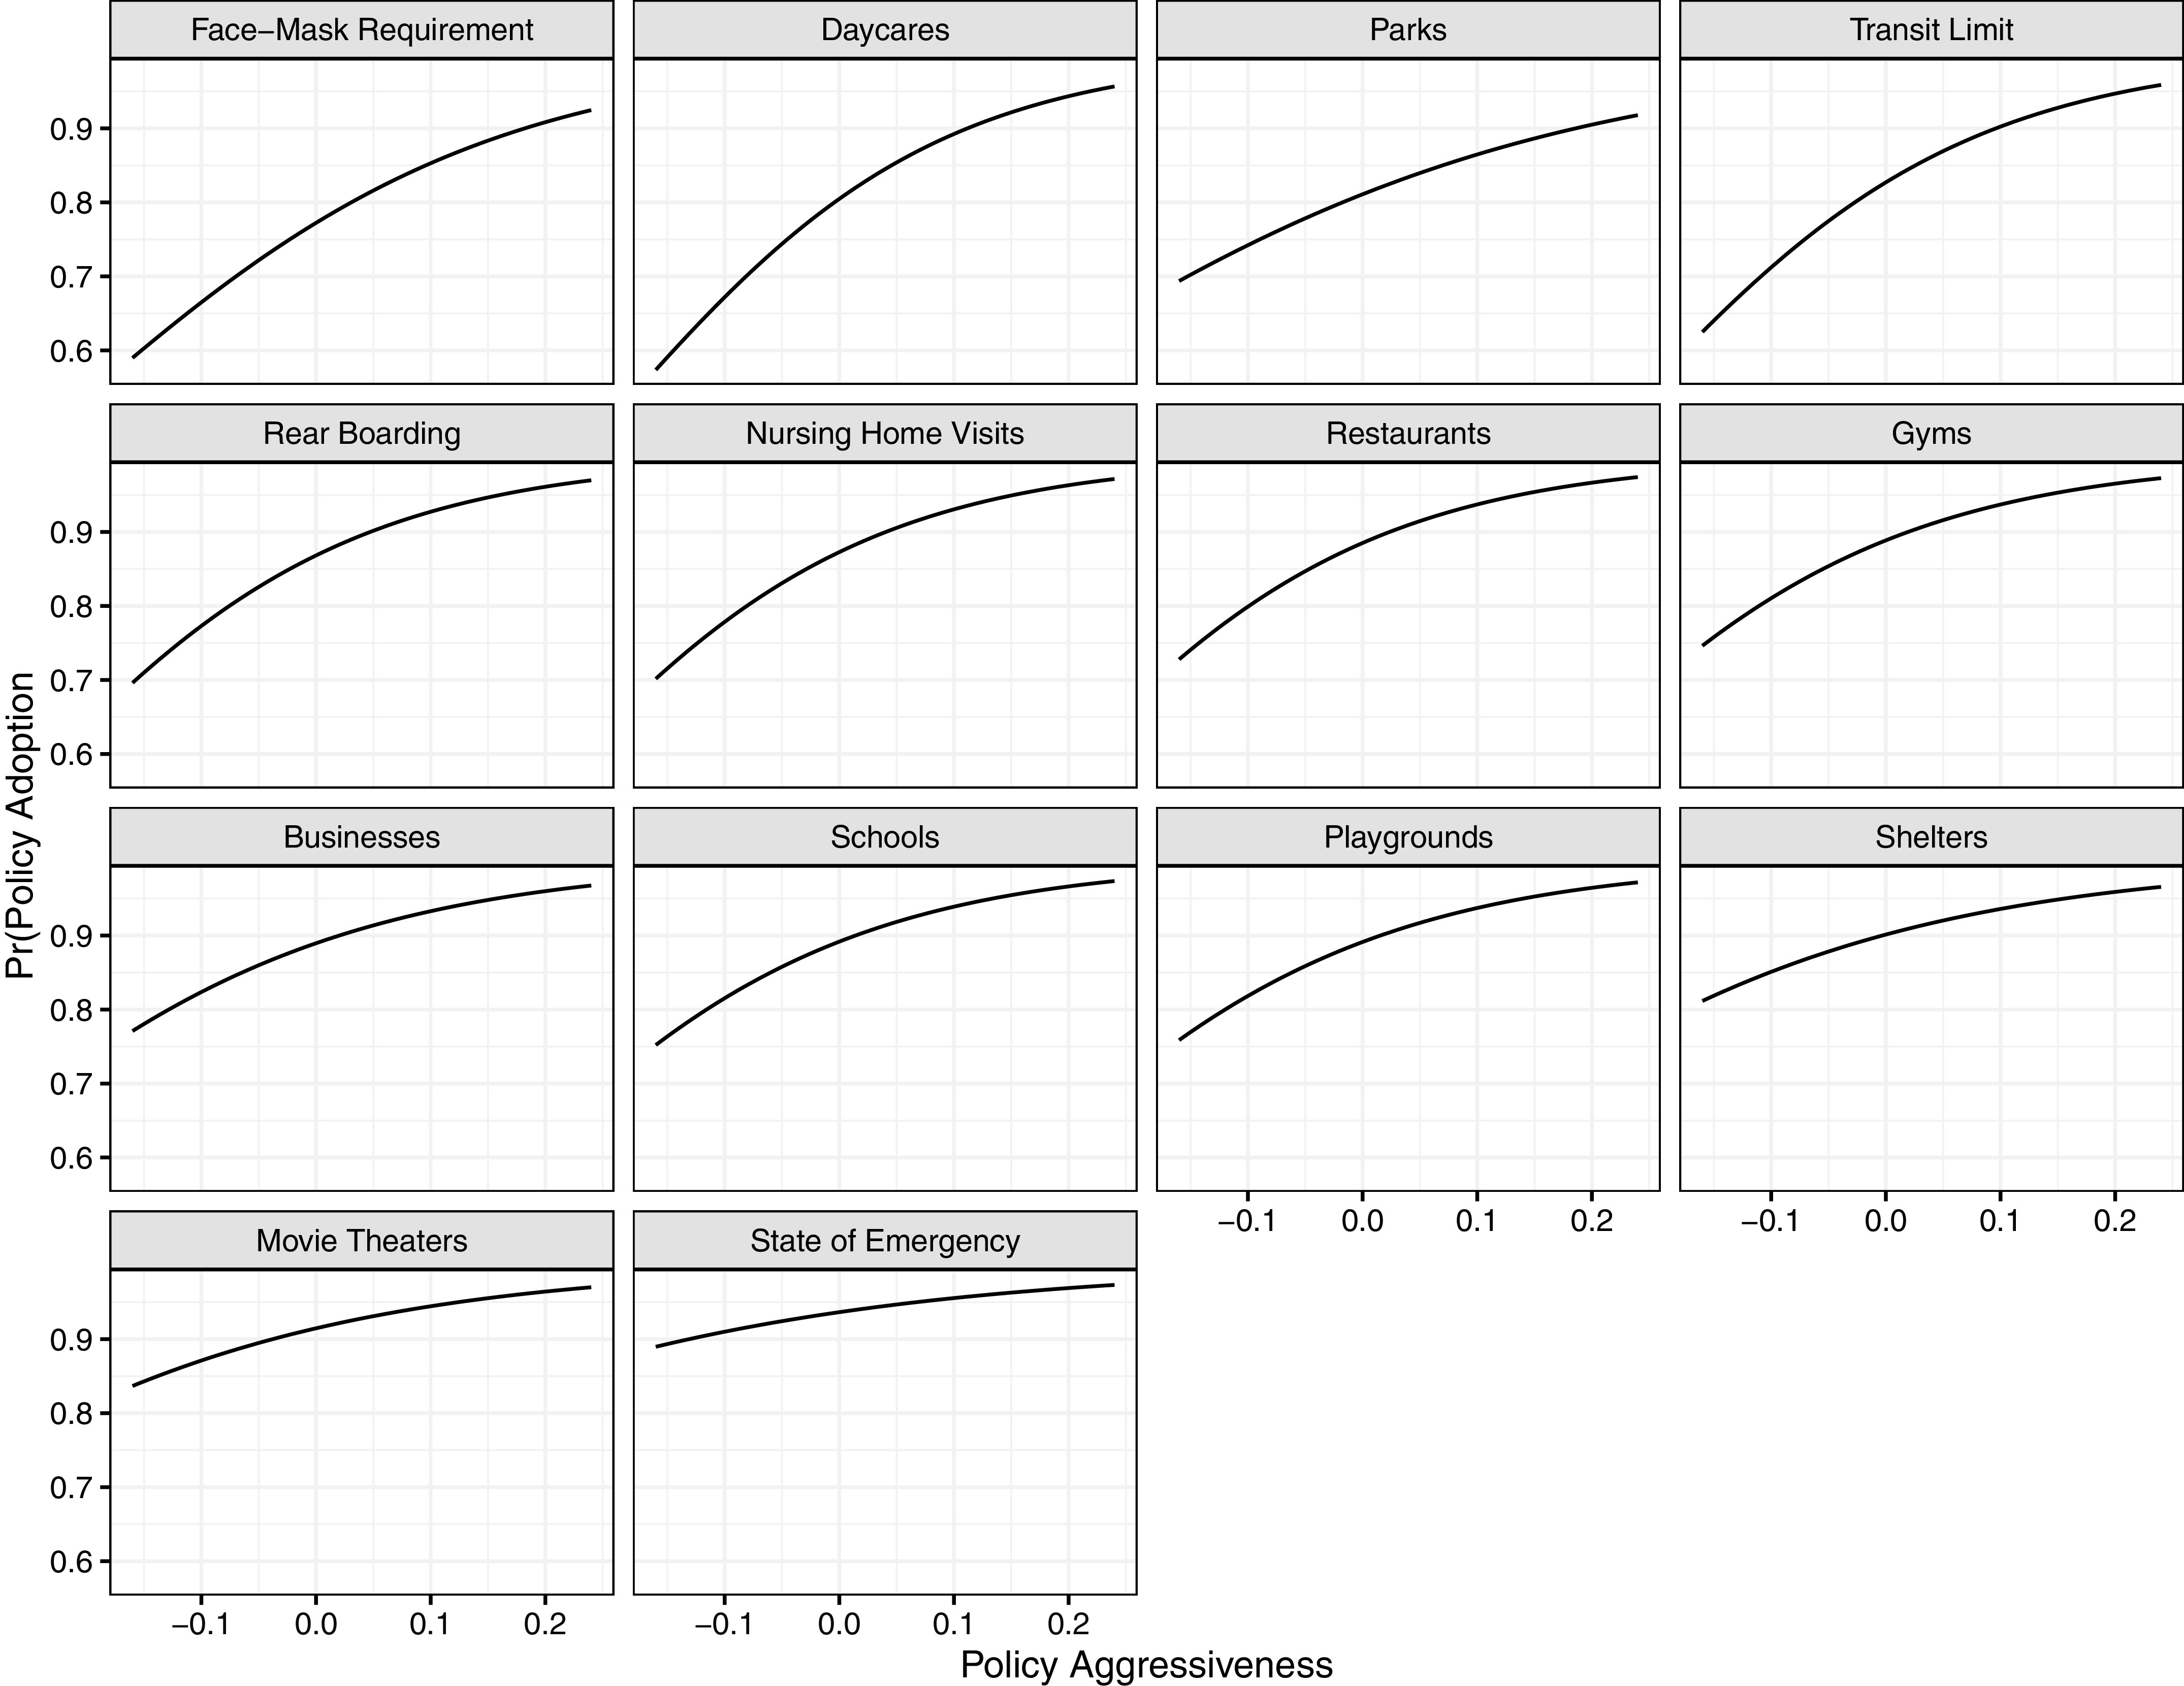
Item Characteristic Curves
Notes
We note that we do not measure differences in policy enforcement, another important dimension of COVID-19 policy. This would be a valuable next step for researchers who are interested in the connections between policy and behaviour, including mobility.
While these differences are modest, the pace and timing of policy change may be important for COVID-19 disease spread even if the start and end points of policy aggressiveness are identical. This pattern is robust to using subsamples of the American data, rather than the full sample. See the Appendix for more detail.
Note that the two slightly higher Canadian lines in the walking figure are Calgary and Edmonton; this is simply a function of both cities’ very cold weather in mid-January, the baseline date for the mobility measure.
See the Appendix for additional plots of the daily correlation between country and mobility and policy.
Walking mobility is a more difficult variable because changes in walking mobility are not simply a function of the COVID-19 context (policy and cases), but also a function of weather. We do not analyze walking in this section.
Contributor Information
David A. Armstrong, II, University of Western Ontario.
Matthew J. Lebo, University of Western Ontario
Jack Lucas, University of Calgary.
References
- Abouk, R., and Heydari B.. 2020. “The Immediate Effect of COVID-19 Policies on Social Distancing Behavior in the United States.” medRxiv. 10.2139/ssrn.3571421. [DOI] [PMC free article] [PubMed]
- Adolph, C., Amano K., Bang-Jensen B., Fullman N., and Wilkerson J.. 2020. “Pandemic Politics: Timing State-Level Social Distancing Responses to COVID-19.” medRxiv. 10.1101/2020.03.30.20046326. [DOI] [PubMed]
- Armstrong, D., Bakker R., Carroll R., Hare C., Poole K., and Rosenthal H.. 2014. Analyzing Spatial Models of Choice and Judgment with R. Boca Raton, FL: CRC Press. [Google Scholar]
- Armstrong, D.A. II, and Lucas J.. 2020. “Measuring and Comparing Municipal Policy Responses to COVID-19.” Canadian Journal of Political Science. 10.1017/s000842392000044x. [DOI] [Google Scholar]
- Barceló, J., Hartnett A.S., and Kubinec R.. 2020. “CoronaNet COVID-19 Government Response Event Dataset.” OSF Preprints. 10.31235/osf.io/dkvxy. [DOI] [PubMed]
- Berry, I., Soucy J.-P.R., Tuite A., and Fisman D.. 2020. “Open Access Epidemiologic Data and an Interactive Dashboard to Monitor the COVID-19 Outbreak in Canada.” Canadian Medical Association Journal 192(15). 10.1503/cmaj.75262. [DOI] [PMC free article] [PubMed] [Google Scholar]
- Breton, C. 2020. “How the Provinces Compare in Their COVID-19 Responses.” Policy Options, April. At https://policyoptions.irpp.org/magazines/april-2020/how-the-provinces-compare-in-their-covid-19-responses/.
- Cole, R.L., Kincaid J., and Whelan R.K.. 2014. “The Myth of the North American City Revisited: A Comparative Conceptual and Empirical Evaluation.” International Journal of Canadian Studies 49:31–52. 10.3138/ijcs.49.31. [DOI] [Google Scholar]
- DeMars, C. 2010. Item Response Theory. Oxford: Oxford University Press. [Google Scholar]
- Garber, J.A., and Imbroscio D.L.. 1996. “‘The Myth of the North American City’ Reconsidered.” Urban Affairs Review 31(5):595–624. 10.1177/107808749603100502. [DOI] [Google Scholar]
- Goldberg, M.A., and Mercer J.. 1986. The Myth of the North American City. Vancouver: UBC Press. 10.1017/CBO9781107415324.004. [DOI] [Google Scholar]
- Good, K.R. 2014. “Reopening the Myth of the North American City Debate: On Comparing Canadian and American Cities.” International Journal of Canadian Studies 49:7–30. 10.3138/ijcs.49.7. [DOI] [Google Scholar]
- Hackworth, J. 2020. “Manufacturing Decline: Ideas, Conservative Propaganda, and Urban Policy Framing.” In How Ideas Shape Urban Development. Philadelphia: University of Pennsylvania Press. [Google Scholar]
- Horak, M. 2012. “Conclusion: Understanding Multilevel Governance in Canada’s Cities.” In Sites of Governance: Multilevel Governance and Policy Making in Canada’s Big Cities, ed. Horak M. and Young R., 339–70. Montreal: McGill-Queen’s University Press. [Google Scholar]
- Imai, K., Lo J., and Olmsted J.. 2016. “Fast Estimation of Ideal Points with Massive Data.” American Political Science Review 110(4):631–56. 10.1017/s000305541600037x. [DOI] [Google Scholar]
- Imai, K., Lo J., and Olmsted J.. 2017. “EmIRT: EM Algorithms for Estimating Item Response Theory Models.” At http://cran.r-project.org/package=emIRT.
- Kraemer, M.U.G., Hung Yang C., Gutierrez B., Hsi Wu C., Klein B., Pigott D.M., Open COVID-29 Data Working Group, du Plessis L., Faria N.R., Li R., et al. 2020. “The Effect of Human Mobility and Control Measures on the COVID-19 Epidemic in China.” Science 497(May):493–97. 10.1126/science.abb4218. [DOI] [PMC free article] [PubMed] [Google Scholar]
- Lebo, M.J., and Grant T.. 2016. “Equation Balance and Dynamic Political Modeling.” Political Analysis 24(1):69–82. 10.1093/pan/mpv035. [DOI] [Google Scholar]
- Lebo, M.J., and Kraft P.W.. 2017. “The General Error Correction Model in Practice.” Research and Politics 4(2):1–13. 10.1177/2053168017713059. [DOI] [Google Scholar]
- Lucas, J. 2016. Fields of Authority: Special Purpose Governance in Ontario, 1815–2015. Toronto: University of Toronto Press. [Google Scholar]
- Merkley, E., Bridgman A., Loewen P.J., Owen T., Ruths D., and Zhilin O.. 2020. “A Rare Moment of Cross-Partisan Consensus: Elite and Public Response to the COVID-19 Pandemic in Canada.” Canadian Journal of Political Science, May:1–8. 10.1017/S0008423920000311. [DOI] [Google Scholar]
- Miller, A.C., Foti N.J., Lewnard J.A., Jewell N.P., Guestrin C., and Fox E.B.. 2020. “Mobility Trends Provide a Leading Indicator of Changes in SARS-CoV-2 Transmission.” medRxiv. 10.1101/2020.05.07.20094441. [DOI]
- Moore, A.A. 2014. “Comparing the Politics of Urban Development in American and Canadian Cities: The Myth of the North–South Divide.” International Journal of Canadian Studies 49:229–52. 10.3138/ijcs.49.229. [DOI] [Google Scholar]
- Nelles, J. 2014. “Myths and Legends: Exploring Differences in Regional Governance and Collective Action in the North American City.” International Journal of Canadian Studies 49:159–204. 10.3138/ijcs.49.159. [DOI] [Google Scholar]
- Nguyen, T.D., Gupta S., Andersen M., Bento A., Simon K.I., and Wing C.. 2020. “Impacts of State Reopening Policy on Human Mobility.” NBER Working Paper Series 27235. 10.1017/CBO9781107415324.004. [DOI] [PMC free article] [PubMed]
- Peseran, M.H. 2004. “General Diagnostic Tests for Cross Section Dependence in Panels.” CESifo Working Paper Series No. 1229; IZA Discussion Paper No. 1240. At https://ssrn.com/abstract=572504.
- Pickup, M., Stecula D., and van der Linden C.. 2020. “Novel Coronavirus, Old Partisanship: COVID-19 Attitudes and Behaviors in the United States and Canada.” Canadian Journal of Political Science. 10.1017/CBO9781107415324.004. [DOI] [Google Scholar]
- Raifman, J., Nocka K., Jones D., Bor J., Lipson S., Jay J., and Chan P.. 2020. COVID-19 US State Policy Database. Boston: Boston University School of Public Health. [Google Scholar]
- Sancton, A. 2008. The Limits of Boundaries: Why City-Regions Cannot Be Self-Governing. Montreal/Kingston: McGill-Queen’s University Press. [Google Scholar]
- Smith, M., Yourish K., Almukhtar S., Collins K., Ivory D., and Harmon A.. 2020. “COVID-19 Case Counts.” New York Times. At https://github.com/nytimes/covid-19-data. [Google Scholar]
- Taylor, Z. 2014. “If Different, Then Why? Explaining the Divergent Political Development of Canadian and American Local Governance.” International Journal of Canadian Studies 49:53–80. 10.3138/ijcs.49.53. [DOI] [Google Scholar]
- Taylor, Z. 2019. Shaping the Metropolis. Montreal/Kingston: McGill-Queen’s University Press. [Google Scholar]
- Van der Linden, C., and Savoie J.. 2020. “Does Collective Interest or Self-Interest Motivate Mask Usage as a Preventive Measure against COVID-19?” Canadian Journal of Political Science. 10.1017/s0008423920000475. [DOI] [Google Scholar]
- Webb, C., Linn S., and Lebo M.J.. 2020. “Beyond the Unit Root Question: Uncertainty and Inference.” American Journal of Political Science 64(2):275–92. 10.1111/ajps.12506. [DOI] [Google Scholar]
- Young, R. 2012. “Introduction: Multilevel Governance and Its Central Research Questions in Canadian Cities.” In Sites of Governance: Multilevel Governance and Policymaking in Canada’s Big Cities, ed. Horak M. and Young R., 3–25. Montreal: McGill-Queen’s University Press. [Google Scholar]


