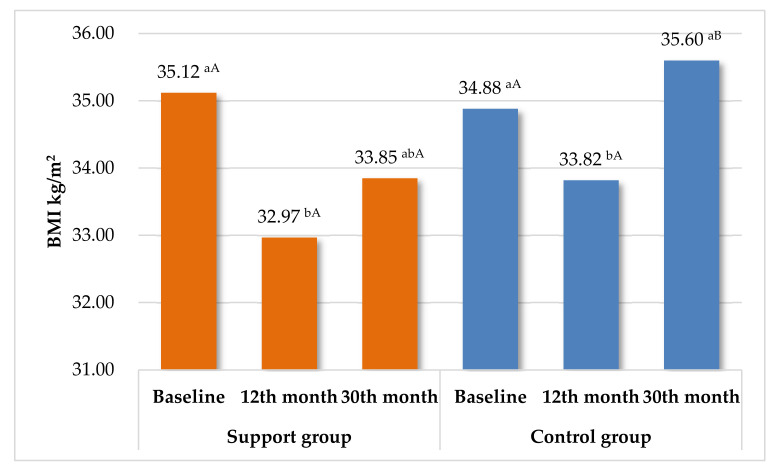
Figure 2.
Summary changes in BMI during the entire study in SG and CG. Means with different letters are significantly different at p < 0.05; ab—differences between the changes in BMI within each group separately (ANOVA with repeated measures—Tukey test). AB—significant differences between SG and CG in each checkpoint (Student’s t-test).

