Abstract
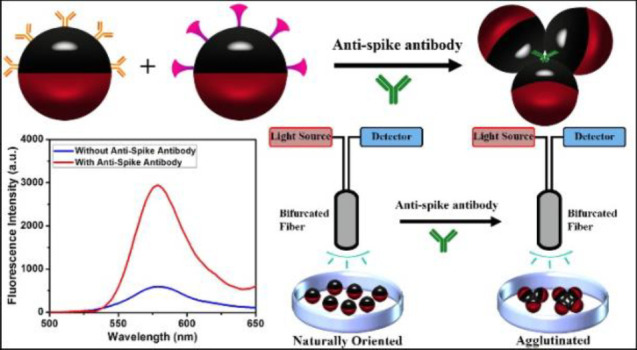
The spread of the COVID-19 pandemic around the world has revealed that it is urgently important to develop rapid and inexpensive assays for antibodies in general and anti-SARS-CoV-2 IgG antibody (anti-SARS-CoV-2 spike glycoprotein S1 antibody) in particular. Herein we report a method to detect the anti-SARS-CoV-2 spike antibody level by using Janus emulsions or Janus particles as biosensors. Janus emulsions are composed of two immiscible hydrocarbon and fluorocarbon oils. The hydrocarbon/water interfaces are functionalized with a secondary antibody of IgG protein and SARS-CoV-2 spike receptor binding domain (RBD), to produce two different Janus emulsions. Mixtures of these Janus droplets enable the detection of the anti-SARS-CoV-2 spike IgG antibody in an agglutination assay caused by the antibody’s binding to both the secondary antibody of IgG antibody and SARS-CoV-2 spike protein RBD. Both qualitative optical images and quantitative fluorescence spectra are able to detect the level of anti-SARS-CoV-2 spike antibody at concentrations as low as 0.2 μg/mL in 2 h. The detection results of clinical human serum samples using this agglutination assay confirm that this method is applicable to clinical samples with good sensitivity and specificity. The reported method is generalizable and can be used to detect other analytes by attaching different biomolecular recognition elements to the surface of the Janus droplets.
Short abstract
An efficient, sensitive and less expensive method of using Janus emulsions or Janus particles for the detection of the anti-SARS-CoV-2 spike IgG antibody in human serum is described.
Introduction
SARS-CoV-2 (severe acute respiratory syndrome coronavirus 2), is the novel coronavirus responsible for the global COVID-19 pandemic that began in 2019.1,2 Coronavirus disease has some common manifestations such as cough, fever, fatigue, and diarrhea. However, many patients are not receptive to treatments3−6 and develop breathing difficulties, multiple organ failure, cytokine storm syndromes and blood clots that can lead to long-term organ damage and mortality.7−11 Effective vaccination, which could prevent continuous or repeated pandemic has begun;12−14 however, there will be a continuing need for methods to evaluate immunity. As a result, rapid methods to detect the anti-SARS-CoV-2 antibody will be a key component of combating the pandemic. The spike protein of the novel coronavirus is a glycosylated protein that assembled on the surface of the virus SARS-CoV-2,15,16 and is essential for receptor recognition of the host cell’s membrane.17−21 The presence of anti-SARS-CoV-2 spike IgG antibody in human blood is a primary biomarker to evaluate immunity and diagnose SARS-CoV-2 infection.22 As a result, rapid, inexpensive, and uncomplicated methods are needed to test for the anti-SARS-CoV-2 spike IgG antibody.
Water dispersed droplets can be produced by a number of emulsification methods,23 and are important components of cosmetic,24,25 medicine,26−28 and food.29−31 Janus droplets or double emulsions have found applications in the development of pharmaceuticals,32,33 biosensing,34−38 and in dynamic optics.39,40 For example, complex emulsions behave as microlens systems that can be used to measure enzyme activity through catalytic processes modification of surfactants that cause changes in droplet morphology and hence the optical transmission.39 Changes in morphology can also produce sensing responses when measuring emissive signals from the interior of the droplets. In this case, the direction of the emission is highly sensitive to the morphology and can be used to detect the existence of carbohydrates or bacteria.36
We report herein, the application of bioconjugated Janus emulsions composed of equal amounts of fluorocarbon and hydrocarbon oils to detect the anti-SARS-CoV-2 spike IgG antibody. Functionalizing the hydrocarbon and continuous phase (water) interfaces of Janus droplets separately with SARS-CoV-2 spike RBD and Goat Anti-Human IgG antibody produces two complementary emulsions. Mixtures of these two droplet-bioconjugates in a 1:1 ratio are used to detect the anti-SARS-CoV-2 spike antibody. The Goat Anti-Human IgG antibody is a secondary antibody of IgG antibody and binds to the Fc domain of anti-SARS-CoV-2 spike IgG antibody. The SARS-CoV-2 spike RBD is the antigen and hence binds to the Fab domain of the anti-SARS-CoV-2 spike antibody.41 When not constrained, Janus emulsions orient with their densest phase on the bottom as a result of gravity. However, agglutination triggered by binding of the anti-SARS-CoV-2 spike antibody to the complementary droplets interrupts this ideal alignment. To quantify the degree of agglutination, we have labeled Janus emulsions with two different dyes. Specifically, we have designed dye pairs, one emissive and one nonemissive, that segregate into the two phases of each droplet. The nonemissive dye serves as a blocking element that absorbs both the excitation light and emitted light from the emissive dye. In a configuration wherein the path of the excitation and emitted light must both go through the blocker dye phase, a very low amount of fluorescence is observed because few photons reach the emissive dye, and any emission is further absorbed by the blocker dye prior to impinging on the detector. To achieve this blocking effect, excitation and detected wavelengths are matched to the Janus droplets such that there is minimal emission when they are in their density aligned state. However, when droplets are agglutinated around an anti-SARS-CoV-2 spike antibody the alignment is changed such that the blocker dye is not fully in the path of the excitation and emission light. As a result, the level of anti-SARS-CoV-2 spike antibody can be determined by the intensity of a fluorescence signal. We also demonstrate that this process can be applied to solidified (polymerized) Janus emulsions. The polymerized Janus particles offer an increase in stability that can extend the utility of this method to demanding applications that may cause breakdown of a pure liquid emulsion. Moreover, we perform the agglutination assay with clinical human sera from COVID-19 patients, and the results suggest that this method is applicable to the detection of anti-SARS-CoV-2 spike IgG antibody in clinical samples.
Results and Discussion
Bioconjugation and the Agglutination Assay
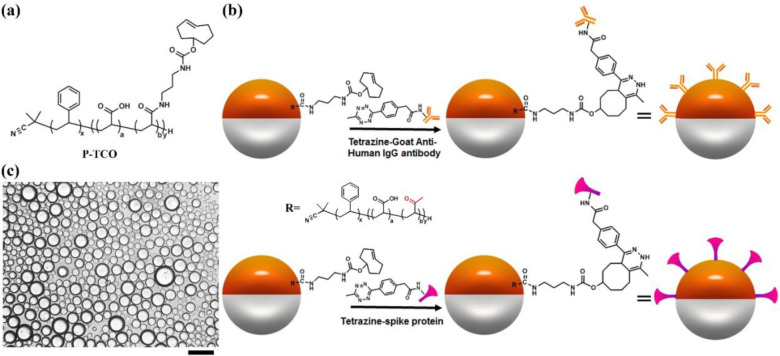
Figure 1a illustrates the chemical structure of the block copolymer surfactant P-TCO, which contains an acrylic acid block partially amidated with transcyclooctene (TCO) block, for bioconjugation in a click reaction with tetrazine.34,42−44 P-TCO (1 mg/mL) in dietheylbenzene (DEB) is mixed in a 1:1 ratio with fluorocarbon solvent (3-ethoxyperfluoro(2-methylhexane), HFE7500). The mixture is heated above the upper consolute temperature (40 °C) and dispersed into an aqueous continuous phase containing PBS buffer and surfactants (0.5 wt % Zonyl/0.5 wt % Tween 20, 1:1 (v/v)). Cooling of the emulsion results in phase separation to the Janus state and, as illustrated in Figure 1b, interfacial bioconjugation is performed in situ. In this process we add 60 μL of Tetrazine-Goat Anti-Human IgG antibody (1.0 mg/mL) into the continuous phase and allow it to react at room temperature overnight on a rocker. Similarly, 60 μL of Tetrazine-SARS-CoV-2 spike protein RBD (0.1 mg/mL) added to the continuous phase results in bioconjugation after overnight on a rocker at room temperature. After the quantification (Figure S1, see Supporting Information for details), we calculated the area per Goat Anti-Human IgG antibody and the area per SARS-CoV-2 spike protein RBD on the surface of Janus droplets, which are 4300 nm2/antibody and 6500 nm2/protein, respectively. Droplets are washed three times with 0.5 mL of 0.5 wt % Zonyl/0.5 wt % Tween 20 1:1 (v/v) solution to remove the unreacted reagents. As shown in Figure 1c, the optical image of the 1:1 mixture of the droplets with Goat Anti-Human IgG antibody or SARS-CoV-2 spike protein RBD reveals that all the droplets are gravity oriented when no anti-SARS-CoV-2 spike antibody is present in the continuous phase. This latter observation confirms there is no aggregation or nonspecific interactions between bioconjugated droplets. Control experiments are conducted to reveal there is no agglutination without the analyte anti-SARS-CoV-2 spike antibody and the Janus emulsions further do not agglutinate in serum solutions that also lack the antibody (Figure S2–S4).
Figure 1.
General scheme for interfacial bioconjugation of the Janus droplets’ hydrocarbon phase. (a) Chemical structure of polymer P-TCO. (b) Bioconjugation scheme of Tetrazine Goat Anti-Human IgG antibody and Tetrazine-SARS-CoV-2 spike protein receptor binding domain (RBD) to P-TCO at the hydrocarbon–water interface of Janus droplets. (c) Optical image of 1:1 mixture of P-TCO polydisperse Janus droplets after bioconjugation with SARS-CoV-2 spike RBD and P-TCO Janus droplets after bioconjugation with Goat Anti-Human IgG antibody. Scale bar = 50 μm.
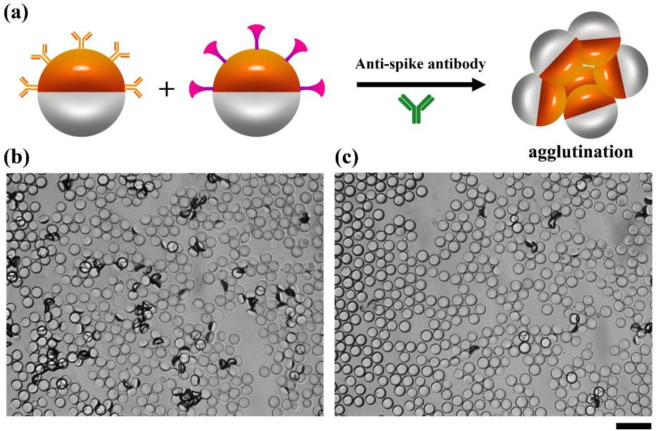
Two droplet variants bioconjugated with Goat Anti-Human IgG antibody and SARS-CoV-2 spike protein RBD are used in a 1:1 ratio in assays for the anti-SARS-CoV-2 spike antibody. The agglutination detection mechanism results in tipping of droplets from their equilibrium density (gravity) alignment. To allow for the anti-SARS-CoV-2 spike IgG antibody to optimally agglutinate, we have designed the system to have multiple interactions between the droplets and this target biomolecule. The Goat-Anti-Human IgG antibody, as a secondary antibody to IgG binds to the Fc domain, and does not prevent the SARS-CoV-2 spike protein RBD from binding to the Fab domains. To test this mechanism, we added anti-SARS-CoV-2 spike IgG antibody to the continuous phase of a mixture of the bioconjugated droplets for 2 h at room temperature on a rocker (Figure 2a). The microscope images in Figure 2b,c reveal the agglutinations formed by the monodispersed droplets after being treated with 60 μg/mL or 1 μg/mL of anti-SARS-CoV-2 spike antibody, respectively. We clearly observe the formation of agglutinations in the images and as expected there are more agglutinations at high concentrations of anti-SARS-CoV-2 spike antibody (Figure 2b) than at low concentrations (Figure 2c). We also added 60 μg/mL of anti-SARS-CoV-2 spike IgG antibody into the continuous phase of Janus droplets conjugated with SARS-CoV-2 spike protein RBD. We observed formation of agglutinations as shown in Figure S5, but the amount of agglutination is much less than adding the antibody to the 1:1 mixture since only the two arms of antibody are available for binding in this case.
Figure 2.
Agglutination assay achieved by adding anti-SARS-CoV-2 spike IgG antibody into the continuous phase of the mixture of Janus droplets. (a) Agglutination scheme with the addition of anti-SARS-CoV-2 spike antibody. (b) Bright field microscope image of a 1:1 mixture of Goat Anti-Human IgG antibody and SARS-CoV-2 spike protein RBD bioconjugated monodispersed droplets, 2 h after the addition of 60 μg/mL anti-SARS-CoV-2 spike antibody. The scatter light of the agglutinated droplets appears as dark objects. (c) The same assay as in panel b, but with 1 μg/mL anti-SARS-CoV-2 spike antibody. Scale bar = 50 μm.
Quantification of Agglutinations by Fluorescence Spectra
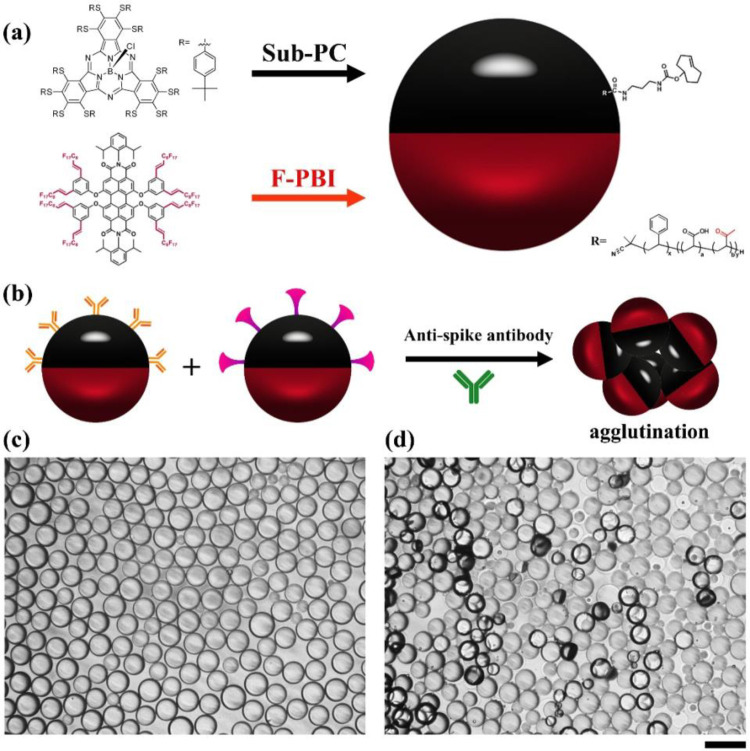
It is possible to quantify agglutination events using optical imaging and image processing software.37 However, a simplified method is to quantitatively measure the degree of agglutination using fluorescence signals under the conditions of directional excitation and emission detection. The emissive and blocker dyes have orthogonal solubility in the Janus droplets and are strictly partitioned between the fluorocarbon and hydrocarbon phases. As shown in Figure 3a, a nonemissive blocker dye sub-PC localizes in the hydrocarbon phase and a red emissive fluorescent dye F-PBI is only present in the fluorocarbon phase.45Figure 3b schematically represents the formation of agglutinations of 1:1 mixtures of Janus droplets bioconjugated with Goat anti-Human IgG antibody or SARS-CoV-2 spike RBD protein after the addition of anti-SARS-CoV-2 spike antibody. Figure 3c shows the optical image of droplets before the addition of anti-SARS-CoV-2 spike antibody indicating equilibrium droplet density alignment in the absence of agglutination. Adding 20 μg/mL of anti-SARS-CoV-2 spike IgG antibody to the continuous phase of the mixture of the bioconjugated droplets for 2 h reveals agglutination (Figure 3d).
Figure 3.
Illustration of the agglutination assay with Janus droplets containing blocker dye sub-PC in the hydrocarbon phase and emissive dye F-PBI in the fluorocarbon phase. (a) Scheme of a P-TCO functionalized Janus droplet with a blocker sub-PC dye in the hydrocarbon phase and the F-PBI red emissive dye in the fluorocarbon phase. (b) Agglutination scheme with the two-dye system. (c) Optical microscope image of the fully bioconjugated monodispersed droplets (1:1 mixture) that also contain the two dyes showing their aligned state without the addition of anti-SARS-CoV-2 spike antibody. (d) Optical microscope image of the same 1:1 mixture as in part c, but with the addition of anti-SARS-CoV-2 spike antibody at a concentration of 20 μg/mL after 2 h. Scale bar = 50 μm.
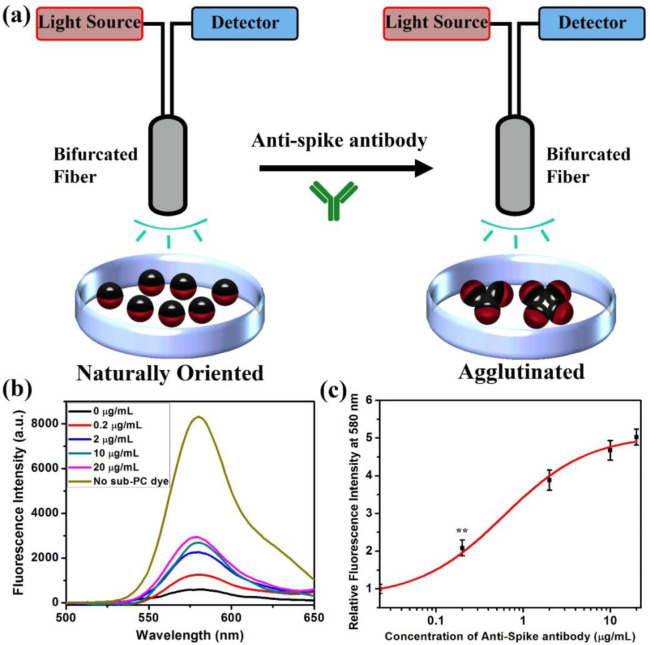
Agglutination assays with the Janus droplets containing F-PBI and sub-PC dyes provide a fluorescence emission intensity that correlates with the concentration of anti-SARS-CoV-2 spike antibody when measurements are performed as schematically shown in Figure 4a. A bifurcated fiber-optic probe is positioned over the droplets, allowing for directional excitation and emission. Droplets have an equilibrium vertical alignment as a result of the higher density of the fluorocarbon phase, and in this configuration the blocker dye sub-PC is on the top and in the optical path. The result is that the emissive dye F-PBI dissolved in the fluorocarbon phase is not excited efficiently because the blocker dye absorbs the 361 nm light. Additionally, if any stray light reaches F-PBI, the blocker dye absorbs the red emission (λmax = 580 nm) because it is in the light path to the fiber optic. However, with the addition of anti-SARS-CoV-2 spike antibody and the formation of agglutinations, some droplets are tilted, and the fluorocarbon phase will be exposed to the excitation light, thereby creating an emission that is easily detected. Figure 4b details the fluorescence spectra of an assay using droplets containing dyes that were incubated with anti-SARS-CoV-2 spike antibody at different concentrations. Figure 4c shows the correlation of the relative fluorescence intensity at 580 nm and the concentration of anti-SARS-CoV-2 spike antibody. The relative fluorescence intensity at 580 nm in Figure 4c is calculated by the fluorescence spectra shown in Figure 4b. The relative fluorescence intensity at 580 nm is the fluorescence intensity of the spectrum of the control group (treated with 0 μg/mL of anti-SARS-CoV-2 spike antibody) at 580 nm to be divided by the fluorescence intensity of other spectra at 580 nm. The data are fit to a sigmoidal modal to provide the general trend. The results are consistent with the optical images, and with increasing agglutination, the emission intensity grows. As revealed in Figure 4b,c, the limit of detection of anti-SARS-CoV-2 spike antibody is 0.2 μg/mL.
Figure 4.
Quantification of agglutination assay by measuring the fluorescence spectra. (a) Schematic of excitation and detection of fluorescence from the naturally oriented or agglutinated dye containing emulsions. Light is only able to reach the red dye when the droplets are tilted in the agglutinated structure. (b) Fluorescence spectra (λex = 361 nm) of 1:1 mixture of dye containing fully bioconjugated Janus droplets with the addition of anti-SARS-CoV-2 spike antibody at different concentrations. Note that the fluorescence intensity increases with concentration. (c) Correlation of concentration of anti-SARS-CoV-2 spike antibody and relative fluorescence intensity at 580 nm. All error bars are standard deviation calculated from three independent experiments (n = 3), and the asterisks (∗∗) represent statistical significance (**p ≤ 0.01).
Bottom Reading Scheme for Agglutination Quantification
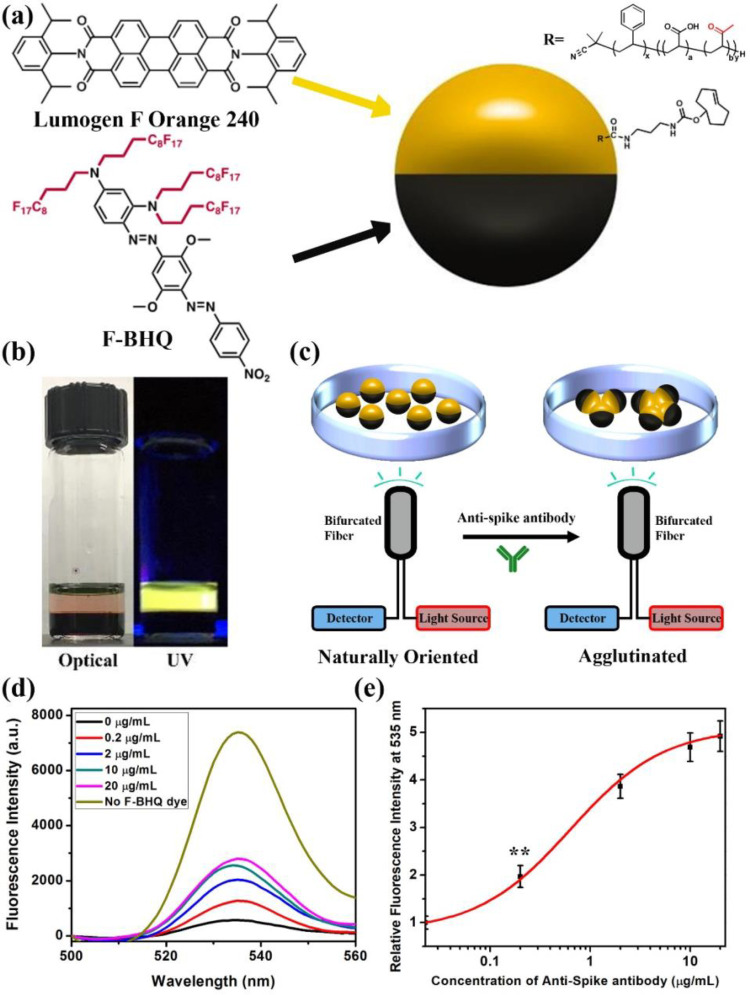
Many samples, such as whole blood, are highly scattering and can complicate the assay shown in Figure 4. As a result, we have developed a bottom reading scheme as shown in Figure 5. This scheme makes use of the same bioconjugation method but requires the inversion of the blocker dye and emissive dye positions. We chose commercial Lumogen F Orange 240 as the hydrocarbon soluble emissive dye. To create a suitable blocker dye, we synthesized a fluorous soluble, nonemissive blocker dye based on the black hole quencher (BHQ) family of dyes (Figure 5a). This material, F-BHQ, dissolves in HFE7500 and absorbs the 535 nm emission from Lumogen F Orange 240 (synthesis procedures and characterizations are shown in Figures S6–S14). Figure 5b shows the optical image of the two dyes in their respective phases under visible light or UV light. Simple visual inspection confirms the orthogonal solubility, and it should be noted that the F-BHQ in the bottom fluorocarbon phase is completely dark under visible light or UV light. A plot of the ratio of molar extinction coefficients of Lumogen F Orange 240 and F-BHQ reveals that 400 nm is the most efficient wavelength for blocking the excitation light (Figure S15). Figure 5c shows the bottom reading two-dye assay configuration. As mentioned before, in the droplets equilibrium configuration the denser fluorocarbon will normally be located at the bottom. As a result, in the nonagglutinated state the blocker dye F-BHQ will be at the bottom and the emissive dye Lumogen F Orange 240 will be on the top. Locating the detector and light source (the bifurcated fiber-optic) at the bottom of a glass analysis dish, reveals minimal emission with 400 nm excitation in the absence of anti-SARS-CoV-2 spike antibody. Agglutination with the addition of anti-SARS-CoV-2 spike antibody causes droplet tilting, and the hydrocarbon phase containing emissive dye is exposed to the light source and increased emissive signals are detected. Figure 5d shows the fluorescence spectra of the 1:1 mixture of the bioconjugated Janus droplets with this dye pair after being treated with different concentrations of anti-SARS-CoV-2 spike IgG antibody. With higher concentration of anti-SARS-CoV-2 spike antibody, the emissive signal at 535 nm increases. The correlation of concentration of anti-SARS-CoV-2 spike antibody and relative fluorescence intensity at 535 nm indicates a limit of detection of 0.2 μg/mL (Figure 5e).
Figure 5.
Illustrations of Janus droplets containing emissive Lumogen F Orange 240 dye in the hydrocarbon phase and blocker dye F-BHQ in the fluorocarbon phase and agglutination quantification. (a) A Janus droplet having an emissive perylene dye (Lumogen F Orange 240) in the hydrocarbon phase and a nonemissive dye (F-BHQ) in the fluorocarbon phase. (b) Optical image of Lumogen F Orange 240 in DEB and F-BHQ in HFE7500 under normal or UV light. (c) Bottom excitation and detection scheme of Janus droplets containing F-BHQ and Lumogen F Orange 240. (d) Fluorescence spectra (λex = 400 nm) of a 1:1 mixture of bioconjugated Janus droplets containing of F-BHQ dye in the fluorocarbon phase, P-TCO, and Lumogen F Orange 240 dye in the hydrocarbon phase, after the addition of anti-SARS-CoV-2 spike antibody at different concentrations. (e) Correlation of concentration of anti-SARS-CoV-2 spike antibody and relative fluorescence intensity at 535 nm. All error bars are standard deviations calculated from three independent experiments (n = 3), and the asterisks (∗∗) represent statistical significance (**p ≤ 0.01).
Agglutination Assay with Polymerized Janus Droplets
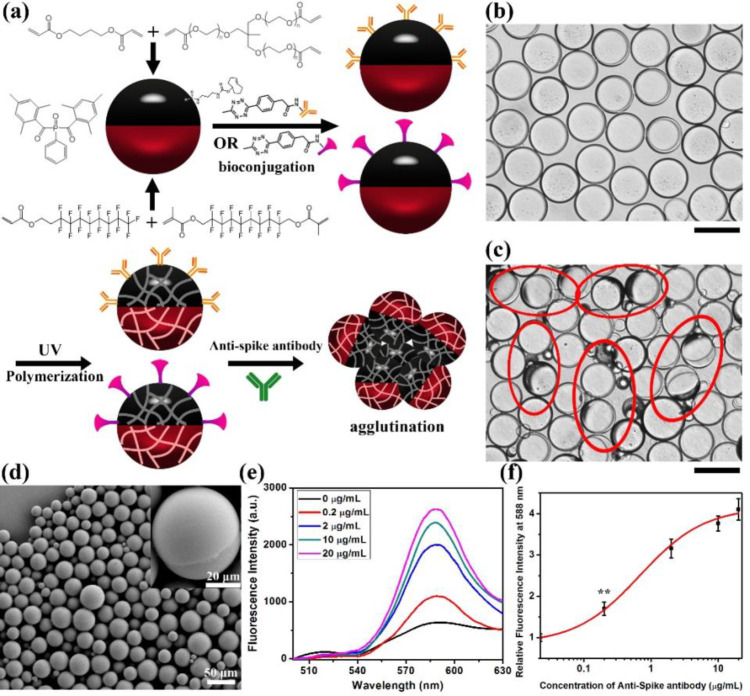
To create assays with additional robustness, we have created a polymerized version of our top-read assay. Figure 6a schematically illustrates the preparation, bioconjugation and polymerization of the Janus droplets. Polymerizable Janus droplets are created by replacing hydrocarbon/fluorocarbon oils in emulsion droplets with photopolymerizable liquid formulations that consist of hydrocarbon and fluorocarbon oligomers and cross-linkers. Specifically, fluorinated acrylate oligomer, fluorinated cross-linker, 1,4-butanediol diacrylate, and trimethylolpropane ethoxylate triacrylate are used as the dispersed phase, and 1 wt % of phenylbis(2,4,6-trimethylbenzoyl)phosphine oxide (BAPO) is used as the photo initiator. P-TCO is dissolved in the hydrocarbon phase as before, and its role as a surfactant allows for prepolymerization bioconjugation with Goat anti-Human IgG antibody or SARS-CoV-2 Spike protein RBD. To achieve comparable agglutination results, twice the protein concentration is required in the bioconjugation of the Janus droplets. After bioconjugation, the Janus droplets are cooled in ice and polymerization is photoinitiated by irradiating with 365 nm UV light (4.1 W) for 30 min. The cooling is required to ensure phase separation as maintained throughout the polymerization. The photopolymerized solid Janus particles are then evaluated in agglutination assays. Similar to the other assays, we added anti-SARS-CoV-2 spike antibody into the continuous phase of the 1:1 mixture of two bioconjugated and dyed Janus particles for 2 h. Figure 6b shows the optical image of the Janus particles before the addition of anti-SARS-CoV-2 spike antibody indicating that they are naturally aligned without anti-SARS-CoV-2 spike antibody. Figure 6c shows the formation of agglutinations after adding anti-SARS-CoV-2 spike antibody to the 1:1 mixture of polymerized Janus droplets (Janus particles). A SEM image of the Janus particles is presented in Figure 6d indicating the success of polymerization, and the particles are still round and Janus in nature. The photo-cross-linking process is also studied by ATR FTIR (Figure S16). Before UV irradiation, the IR spectrum of the photopolymerizable formulation presented the C=C stretching vibration band (at around 1625 cm–1) and the =CH2 in-plane deformation band (at around 1410 cm–1) of the acrylate units. After 30 min of UV light irradiation, complete polymerization of the emulsions was confirmed by the disappearance of the acrylate bands in the FTIR spectrum. Fluorescence spectra are measured to quantify the formation of agglutinations upon the exposure to different concentrations of anti-SARS-CoV-2 spike antibody as shown in Figure 6e,f. Similar to the Janus droplets systems, the fluorescence intensity increases with the increase of the concentration of anti-SARS-CoV-2 spike antibody, and we can detect anti-SARS-CoV-2 spike antibody at or above the concentrations of 0.2 μg/mL using the polymerized Janus particles.
Figure 6.
Polymerization of Janus droplets to form Janus particles. (a) Schematic illustration of the polymerization of Janus droplets and their agglutination. (b) Optical image of Janus particles before the addition of anti-SARS-CoV-2 spike antibody. Scale bar = 50 μm. (c) Optical image of 1:1 mixture of Janus particles 2 h after the addition of 20 μg/mL of anti-SARS-CoV-2 spike antibody. The red circles on the image signify the agglutinations of Janus particles. Note that some minor agglutinations are not circled to minimize clutter in the image. Scale bar = 50 μm. (d) SEM image of Janus particles after polymerization. (e) Fluorescence spectra (λex = 361 nm) of particles containing of F-PBI dye in the fluorocarbon phase, P-TCO, and sub-PC dye in the hydrocarbon phase, after addition of anti-SARS-CoV-2 spike antibody at different concentrations. (f) Correlation of concentration of anti-SARS-CoV-2 spike antibody and relative fluorescence intensity at 588 nm. All error bars are standard deviation calculated from three independent experiments (n = 3), the asterisks (∗∗) represent statistical significance (**p ≤ 0.01).
Agglutination Assay for Detection of Anti-SARS-CoV-2 Spike IgG Antibody in Clinical Human Sera
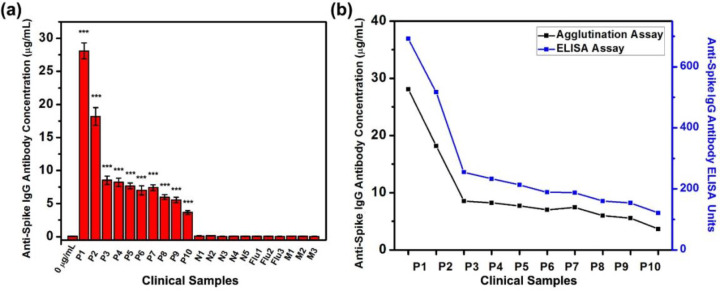
After verifying that the agglutination scheme could detect the anti-SARS-CoV-2 spike IgG antibody with a low limit of detection, we use the top-read agglutination assay for the sensing of the anti-SARS-CoV-2 spike IgG antibody in clinical human sera from COVID-19 patients. We choose a top-read scheme since it is more basic, and if a top-read scheme could achieve good sensitivity, the other two methods might achieve even better results. Figure 7a and Figure S17 summarize the calculated concentrations of anti-SARS-CoV-2 spike IgG antibody in human sera and the fluorescence spectra. The calculated antibody concentrations of the clinical samples are relative to the model antibody. We measured the anti-SARS-CoV-2 spike antibody concentration of 10 serum samples from COVID-19 patients which are known to have anti-SARS-CoV-2 spike IgG antibody, five serum samples from normal patients who are negative for SARS-CoV-2, three serum samples from normal patients who are negative for SARS-CoV-2 but have anti-Influenza IgG antibody, and three serum samples from patients who are negative for SARS-CoV-2 but have anti-MERS-CoV spike antibody. The known details about the positive clinical samples are shown in Table S1. Sera are added to the continuous phase of 1:1 mixture of two bioconjugated and dyed Janus droplets for 2 h. The fluorescence spectra indicate that all the COVID-19 patients’ serum samples have significantly higher levels of anti-SARS-CoV-2 spike IgG antibody than the control group (0 μg/mL) indicating the existence of anti-SARS-CoV-2 spike IgG antibody, which is consistent with the enzyme-linked immunosorbent assay (ELISA) results. In contrast, the SARS-CoV-2 negative samples, serum samples containing anti-Influenza IgG antibody, and serum samples containing anti-MERS-CoV spike antibody all show no statistical difference as compared with the control, indicating no anti-SARS-CoV-2 spike IgG antibody is detected in theses samples. The ELISA results for the negative samples and specificity panels are lower than 15 (cutoff) units and are determined as having no anti-SARS-CoV-2 spike IgG antibody in these serum samples, which is consistent with the agglutination assay results. The concentrations of anti-SARS-CoV-2 spike IgG antibody in sera are calculated from the relative fluorescence intensity at 580 nm and the correlation curve shown in Figure 4c. These results confirm that our agglutination detection assay has high sensitivity to the detection of anti-SARS-CoV-2 spike IgG antibody as well as good specificity in clinical samples (Table S2). Notably, both the sensitivity and specificity are 100%, which might be overestimating since our results are based on a limited number of tested samples. ELISA confirms that all the 10 COVID-19 patients’ serum samples have anti-SARS-CoV-2 spike IgG antibody (cut off value is 15 units) and the trend of the concentration of anti-SARS-CoV-2 spike IgG antibody detected by the top-read agglutination assay is similar to the data acquired from ELISA, which confirms the accuracy of our assay (Figure 7b).
Figure 7.
Detection of anti-SARS-CoV-2 spike IgG antibody concentrations by top-read agglutination assay in clinical human serum samples from COVID-19 and normal patients. (a) Summary of concentrations of anti-SARS-CoV-2 spike IgG antibody detected in human sera from COVID-19 patients (P1 to P10), patients who are negative for SARS-CoV-2 (N1 to N5), patients who are negative for SARS-CoV-2 but have anti-influenza IgG antibody (Flu1 to Flu 3), and patients who are negative for SARS-CoV-2 but have anti-MERS-CoV spike IgG antibody (M1 to M3), by adding sera into the continuous phase of 1:1 mixture of Janus droplets containing of F-PBI dye in the fluorocarbon phase, and P-TCO and sub-PC dye in the hydrocarbon phase. Sample 0 μg/mL is the control with no addition of anti-SARS-CoV-2 spike IgG antibody or serum into the continuous phase of Janus droplets. All error bars are standard deviation calculated from three independent experiments (n = 3), and the asterisks (∗∗∗) represent statistical significance (***p ≤ 0.001). (b) Comparation of agglutination assay (black) and ELISA (blue) on the quantification of anti-SARS-CoV-2 spike IgG antibody in human sera from COVID-19 patients.
Conclusions
In summary, we report a sensitive, rapid and inexpensive method of detection of anti-SARS-CoV-2 spike IgG antibody, which could be used in diagnosis of the SARS-CoV-2 infection, by using Janus emulsions or Janus particles polymerized from Janus droplets as biosensors. These systems utilize secondary IgG antibody (Goat Anti-Human IgG antibody) and SARS-CoV-2 spike protein RBD to recognize and detect the anti-SARS-CoV-2 spike antibody. Mixtures of Janus emulsions coated separately with secondary IgG antibody or SARS-CoV-2 spike protein RBD are exposed to different concentrations of anti-SARS-CoV-2 spike antibody, and agglutination is observed at or above antibody concentrations of 0.2 μg/mL. We designed both top-down or bottom-up optical measurement methods for quantitatively measuring the concentration of antibody by using two pairs of dyes. Finally, we polymerized the Janus emulsions to increase the long-term stability of the assay materials. We find that these Janus particles could also be used for the biosensing of anti-SARS-CoV-2 spike antibody with similarly high sensitivity. The detection limits of our assay are sufficient for the detection of anti-SARS-CoV-2 spike antibody in real world samples,46 which is proved by the agglutination experiment with serum samples from COVID-19 patients and normal patients. For some of the clinical samples that contain very high concentrations of anti-SARS-CoV-2 IgG, dilution might be needed before doing the measurements. As compared to the currently available serological test, our method demonstrates a new concept of tracking the tilting and formation of agglutination of Janus droplets or Janus particles for detection of the anti-SARS-CoV-2 spike IgG antibody levels in human sera with good sensitivity and specificity. Our method could rapidly detect the anti-SARS-CoV-2 spike IgG antibody level in 2 h with the LOD at 0.2 μg/mL without the requirement of expensive and complicated equipment. The inclusion of bottom-read scheme and polymerized droplet scheme largely improved the range of potential applications of our detection scheme, since the bottom-read scheme could minimize the influence of impurities in the liquid samples and the polymerized droplet scheme could improve the long-term stability of the droplets. Our system could not only be applied to the sensing of the anti-SARS-CoV-2 spike antibody but also can be extended to other antibodies or proteins in the future. For example, the method can be readily adapted to detect the anti-SARS-CoV-2 N protein antibody by conjugating the SARS-CoV-2 N protein to the Janus droplets and conducting an analogous assay for the detection of antibodies against the SARS-CoV-2 N protein.47 The anti-SARS-CoV-2 IgM antibody which is a pentamer in serum is also an ideal analyte for our agglutination sensing schemes.48 Overall, this biosensing method has considerable utility in the creation of future diverse bioassays.
Acknowledgments
This research was supported by a Vannevar Bush Faculty Fellowship to TMS (Grant No. N000141812878). K.Y. thanks Funai Overseas Scholarship for financial support.
Supporting Information Available
The Supporting Information is available free of charge at https://pubs.acs.org/doi/10.1021/acscentsci.1c00173.
Materials and instruments; experimental procedures; supplementary figures and tables (PDF)
The authors declare no competing financial interest.
Notes
A patent has been filed.
Supplementary Material
References
- Fauci A. S.; Lane H. C.; Redfield R. R. Covid-19 - Navigating the Uncharted. N. Engl. J. Med. 2020, 382 (13), 1268–1269. 10.1056/NEJMe2002387. [DOI] [PMC free article] [PubMed] [Google Scholar]
- He F.; Deng Y.; Li W. Coronavirus Disease 2019: What We Know?. J. Med. Virol. 2020, 92 (7), 719–725. 10.1002/jmv.25766. [DOI] [PMC free article] [PubMed] [Google Scholar]
- Duan K.; Liu B.; Li C.; Zhang H.; Yu T.; Qu J.; Zhou M.; Chen L.; Meng S.; Hu Y.; et al. Effectiveness of Convalescent Plasma Therapy in Severe COVID-19 Patients. Proc. Natl. Acad. Sci. U. S. A. 2020, 117 (17), 9490–9496. 10.1073/pnas.2004168117. [DOI] [PMC free article] [PubMed] [Google Scholar]
- Baden L. R.; Rubin E. J. Covid-19 - The Search for Effective Therapy. N. Engl. J. Med. 2020, 382 (19), 1851–1852. 10.1056/NEJMe2005477. [DOI] [PMC free article] [PubMed] [Google Scholar]
- Golchin A.; Seyedjafari E.; Ardeshirylajimi A. Mesenchymal Stem Cell Therapy for COVID-19: Present or Future. Stem Cell Rev. Rep. 2020, 16 (3), 427–433. 10.1007/s12015-020-09973-w. [DOI] [PMC free article] [PubMed] [Google Scholar]
- Cantini F.; Niccoli L.; Matarrese D.; Nicastri E.; Stobbione P.; Goletti D. Baricitinib Therapy in COVID-19: A Pilot Study on Safety and Clinical Impact. J. Infect. 2020, 81 (2), 318–356. 10.1016/j.jinf.2020.04.017. [DOI] [PMC free article] [PubMed] [Google Scholar]
- Carfì A.; Bernabei R.; Landi F.; Persistent Symptoms in Patients After Acute COVID-19. JAMA 2020, 324 (6), 603–605. 10.1001/jama.2020.12603. [DOI] [PMC free article] [PubMed] [Google Scholar]
- Han C.; Duan C.; Zhang S.; Spiegel B.; Shi H.; Wang W.; Zhang L.; Lin R.; Liu J.; Ding Z.; et al. Digestive Symptoms in COVID-19 Patients With Mild Disease Severity: Clinical Presentation, Stool Viral RNA Testing, and Outcomes. Am. J. Gastroenterol. 2020, 115 (6), 916–923. 10.14309/ajg.0000000000000664. [DOI] [PMC free article] [PubMed] [Google Scholar]
- Yan C. H.; Faraji F.; Prajapati D. P.; Boone C. E.; DeConde A. S. Association of Chemosensory Dysfunction and COVID-19 in Patients Presenting with Influenza-like Symptoms. Int. Forum Allergy Rhinol. 2020, 10 (7), 806–813. 10.1002/alr.22579. [DOI] [PMC free article] [PubMed] [Google Scholar]
- Mehta P.; McAuley D. F.; Brown M.; Sanchez E.; Tattersall R. S.; Manson J. J. U. K. COVID-19: Consider Cytokine Storm Syndromes and Immunosuppression. Lancet 2020, 395 (10229), 1033–1034. 10.1016/S0140-6736(20)30628-0. [DOI] [PMC free article] [PubMed] [Google Scholar]
- Song P.; Li W.; Xie J.; Hou Y.; You C. Cytokine Storm Induced by SARS-CoV-2. Clin. Chim. Acta 2020, 509, 280–287. 10.1016/j.cca.2020.06.017. [DOI] [PMC free article] [PubMed] [Google Scholar]
- Thanh Le T.; Andreadakis Z.; Kumar A.; Gómez Román R.; Tollefsen S.; Saville M.; Mayhew S. The COVID-19 Vaccine Development Landscape. Nat. Rev. Drug Discovery 2020, 19 (5), 305–306. 10.1038/d41573-020-00073-5. [DOI] [PubMed] [Google Scholar]
- Graham B. S. Rapid COVID-19 Caccine Development. Science 2020, 368 (6494), 945–946. 10.1126/science.abb8923. [DOI] [PubMed] [Google Scholar]
- Wu S.-C. Progress and Concept for COVID-19 Vaccine Development. Biotechnol. J. 2020, 15 (6), e2000147–e2000147. 10.1002/biot.202000147. [DOI] [PMC free article] [PubMed] [Google Scholar]
- Ibrahim I. M.; Abdelmalek D. H.; Elshahat M. E.; Elfiky A. A. COVID-19 Spike-Host Cell Receptor GRP78 Binding Site Prediction. J. Infect. 2020, 80 (5), 554–562. 10.1016/j.jinf.2020.02.026. [DOI] [PMC free article] [PubMed] [Google Scholar]
- Du L.; He Y.; Zhou Y.; Liu S.; Zheng B. J.; Jiang S. The Spike Protein of SARS-CoV--a Target for Vaccine and Therapeutic Development. Nat. Rev. Microbiol. 2009, 7 (3), 226–236. 10.1038/nrmicro2090. [DOI] [PMC free article] [PubMed] [Google Scholar]
- Huang Y.; Yang C.; Xu X.-F.; Xu W.; Liu S.-W. Structural and Functional Properties of SARS-CoV-2 Spike Protein: Potential Antivirus Drug Development for COVID-19. Acta Pharmacol. Sin. 2020, 41 (9), 1141–1149. 10.1038/s41401-020-0485-4. [DOI] [PMC free article] [PubMed] [Google Scholar]
- He Y.; Zhou Y.; Liu S.; Kou Z.; Li W.; Farzan M.; Jiang S. Receptor-Binding Domain of SARS-CoV Spike Protein Induces Highly Potent Neutralizing Antibodies: Implication for Developing Subunit Vaccine. Biochem. Biophys. Res. Commun. 2004, 324 (2), 773–781. 10.1016/j.bbrc.2004.09.106. [DOI] [PMC free article] [PubMed] [Google Scholar]
- Du L.; Zhao G.; He Y.; Guo Y.; Zheng B.-J.; Jiang S.; Zhou Y. Receptor-Binding Domain of SARS-CoV Spike Protein Induces Long-Term Protective Immunity in An Animal Model. Vaccine 2007, 25 (15), 2832–2838. 10.1016/j.vaccine.2006.10.031. [DOI] [PMC free article] [PubMed] [Google Scholar]
- Baker A. N.; Richards S.-J.; Guy C. S.; Congdon T. R.; Hasan M.; Zwetsloot A. J.; Gallo A.; Lewandowski J. R.; Stansfeld P. J.; Straube A.; et al. The SARS-COV-2 Spike Protein Binds Sialic Acids and Enables Rapid Detection in a Lateral Flow Point of Care Diagnostic Device. ACS Cent. Sci. 2020, 6 (11), 2046–2052. 10.1021/acscentsci.0c00855. [DOI] [PMC free article] [PubMed] [Google Scholar]
- Casalino L.; Gaieb Z.; Goldsmith J. A.; Hjorth C. K.; Dommer A. C.; Harbison A. M.; Fogarty C. A.; Barros E. P.; Taylor B. C.; McLellan J. S.; et al. Beyond Shielding: The Roles of Glycans in the SARS-CoV-2 Spike Protein. ACS Cent. Sci. 2020, 6 (10), 1722–1734. 10.1021/acscentsci.0c01056. [DOI] [PMC free article] [PubMed] [Google Scholar]
- Xiang F.; Wang X.; He X.; Peng Z.; Yang B.; Zhang J.; Zhou Q.; Ye H.; Ma Y.; Li H.; et al. Antibody Detection and Dynamic Characteristics in Patients With Coronavirus Disease 2019. Clin. Infect. Dis. 2020, 71 (8), 1930–1934. 10.1093/cid/ciaa461. [DOI] [PMC free article] [PubMed] [Google Scholar]
- Zarzar L. D.; Sresht V.; Sletten E. M.; Kalow J. A.; Blankschtein D.; Swager T. M. Dynamically Reconfigurable Complex Emulsions Via Tunable Interfacial Tensions. Nature 2015, 518 (7540), 520–524. 10.1038/nature14168. [DOI] [PMC free article] [PubMed] [Google Scholar]
- Zhang W.; Liu L. Study on the Formation and Properties of Liquid Crystal Emulsion in Cosmetic. J. Cosmet., Dermatol. Sci. Appl. 2013, 3 (2), 139–144. 10.4236/jcdsa.2013.32022. [DOI] [Google Scholar]
- Masmoudi H.; Dréau Y. L.; Piccerelle P.; Kister J. The Evaluation of Cosmetic and Pharmaceutical Emulsions Aging Process using Classical Techniques and A New Method: FTIR. Int. J. Pharm. 2005, 289 (1), 117–131. 10.1016/j.ijpharm.2004.10.020. [DOI] [PubMed] [Google Scholar]
- Weinberg G.; Ripper R.; Feinstein D. L.; Hoffman W. Lipid Emulsion Infusion Rescues Dogs from Bupivacaine-Induced Cardiac Toxicity. Reg. Anesth. Pain Med. 2003, 28 (3), 198–202. 10.1097/00115550-200305000-00005. [DOI] [PubMed] [Google Scholar]
- Cave G.; Harvey M. Intravenous Lipid Emulsion as Antidote Beyond Local Anesthetic Toxicity: A Systematic Review. Acad. Emerg. Med. 2009, 16 (9), 815–824. 10.1111/j.1553-2712.2009.00499.x. [DOI] [PubMed] [Google Scholar]
- Lu T.; Spruijt E. Multiphase Complex Coacervate Droplets. J. Am. Chem. Soc. 2020, 142 (6), 2905–2914. 10.1021/jacs.9b11468. [DOI] [PMC free article] [PubMed] [Google Scholar]
- Galus S.; Kadzińska J. Food Applications of Emulsion-Based Edible Films and Coatings. Trends Food Sci. Technol. 2015, 45 (2), 273–283. 10.1016/j.tifs.2015.07.011. [DOI] [Google Scholar]
- Tavernier I.; Wijaya W.; Van der Meeren P.; Dewettinck K.; Patel A. R. Food-Grade Particles for Emulsion Stabilization. Trends Food Sci. Technol. 2016, 50, 159–174. 10.1016/j.tifs.2016.01.023. [DOI] [Google Scholar]
- Lee D.; Weitz D. A. Double Emulsion-Templated Nanoparticle Colloidosomes with Selective Permeability. Adv. Mater. 2008, 20 (18), 3498–3503. 10.1002/adma.200800918. [DOI] [Google Scholar]
- Bouyer E.; Mekhloufi G.; Rosilio V.; Grossiord J.-L.; Agnely F. Proteins, Polysaccharides, and Their Complexes Used as Stabilizers for Emulsions: Alternatives to Synthetic Surfactants in the Pharmaceutical Field?. Int. J. Pharm. 2012, 436 (1), 359–378. 10.1016/j.ijpharm.2012.06.052. [DOI] [PubMed] [Google Scholar]
- Sadurní N.; Solans C.; Azemar N.; García-Celma M. J. Studies on the Formation of O/W Nano-Emulsions, by Low-Energy Emulsification Methods, Suitable for Pharmaceutical Applications. Eur. J. Pharm. Sci. 2005, 26 (5), 438–445. 10.1016/j.ejps.2005.08.001. [DOI] [PubMed] [Google Scholar]
- Li J.; Savagatrup S.; Nelson Z.; Yoshinaga K.; Swager T. M. Fluorescent Janus Emulsions for Biosensing of Listeria Monocytogenes. Proc. Natl. Acad. Sci. U. S. A. 2020, 117 (22), 11923–11930. 10.1073/pnas.2002623117. [DOI] [PMC free article] [PubMed] [Google Scholar]
- Zentner C. A.; Anson F.; Thayumanavan S.; Swager T. M. Dynamic Imine Chemistry at Complex Double Emulsion Interfaces. J. Am. Chem. Soc. 2019, 141 (45), 18048–18055. 10.1021/jacs.9b06852. [DOI] [PubMed] [Google Scholar]
- Zeininger L.; Nagelberg S.; Harvey K. S.; Savagatrup S.; Herbert M. B.; Yoshinaga K.; Capobianco J. A.; Kolle M.; Swager T. M. Rapid Detection of Salmonella enterica via Directional Emission from Carbohydrate-Functionalized Dynamic Double Emulsions. ACS Cent. Sci. 2019, 5 (5), 789–795. 10.1021/acscentsci.9b00059. [DOI] [PMC free article] [PubMed] [Google Scholar]
- Zhang Q.; Savagatrup S.; Kaplonek P.; Seeberger P. H.; Swager T. M. Janus Emulsions for the Detection of Bacteria. ACS Cent. Sci. 2017, 3 (4), 309–313. 10.1021/acscentsci.7b00021. [DOI] [PMC free article] [PubMed] [Google Scholar]
- Zhang Q.; Zeininger L.; Sung K.-J.; Miller E. A.; Yoshinaga K.; Sikes H. D.; Swager T. M. Emulsion Agglutination Assay for the Detection of Protein–Protein Interactions: An Optical Sensor for Zika Virus. ACS Sens. 2019, 4 (1), 180–184. 10.1021/acssensors.8b01202. [DOI] [PMC free article] [PubMed] [Google Scholar]
- Zarzar L. D.; Kalow J. A.; He X.; Walish J. J.; Swager T. M. Optical Visualization and Quantification of Enzyme Activity Using Dynamic Droplet Lenses. Proc. Natl. Acad. Sci. U. S. A. 2017, 114 (15), 3821–3825. 10.1073/pnas.1618807114. [DOI] [PMC free article] [PubMed] [Google Scholar]
- Nagelberg S.; Zarzar L. D.; Nicolas N.; Subramanian K.; Kalow J. A.; Sresht V.; Blankschtein D.; Barbastathis G.; Kreysing M.; Swager T. M.; et al. Reconfigurable and Responsive Droplet-Based Compound Micro-Lenses. Nat. Commun. 2017, 8 (1), 14673. 10.1038/ncomms14673. [DOI] [PMC free article] [PubMed] [Google Scholar]
- van Oss C. J.; Good R. J.; Chaudhury M. K. Nature of the Antigen-Antibody Interaction: Primary and Secondary Bonds: Optimal Conditions for Association and Dissociation. J. Chromatogr., Biomed. Appl. 1986, 376, 111–119. 10.1016/S0378-4347(00)80828-2. [DOI] [PubMed] [Google Scholar]
- Taylor M. T.; Blackman M. L.; Dmitrenko O.; Fox J. M. Design and Synthesis of Highly Reactive Dienophiles for the Tetrazine–trans-Cyclooctene Ligation. J. Am. Chem. Soc. 2011, 133 (25), 9646–9649. 10.1021/ja201844c. [DOI] [PMC free article] [PubMed] [Google Scholar]
- Stephanopoulos N.; Francis M. B. Choosing An Effective Protein Bioconjugation Strategy. Nat. Chem. Biol. 2011, 7 (12), 876–884. 10.1038/nchembio.720. [DOI] [PubMed] [Google Scholar]
- Czuban M.; Srinivasan S.; Yee N. A.; Agustin E.; Koliszak A.; Miller E.; Khan I.; Quinones I.; Noory H.; Motola C.; et al. Bio-Orthogonal Chemistry and Reloadable Biomaterial Enable Local Activation of Antibiotic Prodrugs and Enhance Treatments against Staphylococcus aureus Infections. ACS Cent. Sci. 2018, 4 (12), 1624–1632. 10.1021/acscentsci.8b00344. [DOI] [PMC free article] [PubMed] [Google Scholar]
- Yoshinaga K.; Swager T. M. Fluorofluorescent Perylene Bisimides. Synlett 2018, 29 (19), 2509–2514. 10.1055/s-0037-1610224. [DOI] [Google Scholar]
- Ibarrondo F. J.; Fulcher J. A.; Goodman-Meza D.; Elliott J.; Hofmann C.; Hausner M. A.; Ferbas K. G.; Tobin N. H.; Aldrovandi G. M.; Yang O. O. Rapid Decay of Anti-SARS-CoV-2 Antibodies in Persons with Mild Covid-19. N. Engl. J. Med. 2020, 383 (11), 1085–1087. 10.1056/NEJMc2025179. [DOI] [PMC free article] [PubMed] [Google Scholar]
- Dutta N. K.; Mazumdar K.; Gordy J. T. The Nucleocapsid Protein of SARS-CoV-2: A Target for Vaccine Development. J. Virol. 2020, 94 (13), e00647–00620. 10.1128/JVI.00647-20. [DOI] [PMC free article] [PubMed] [Google Scholar]
- Czajkowsky D. M.; Shao Z. The Human IgM Pentamer is A Mushroom-Shaped Molecule with A Flexural Bias. Proc. Natl. Acad. Sci. U. S. A. 2009, 106 (35), 14960–14965. 10.1073/pnas.0903805106. [DOI] [PMC free article] [PubMed] [Google Scholar]
Associated Data
This section collects any data citations, data availability statements, or supplementary materials included in this article.


