

Abstract
Objectives:
The purpose of this study was to estimate the radiation dose for a dental spectral cone-beam CT (SCBCT) unit at different scanning parameters.
Methods:
Radiation dose measurements were performed for a commercially available dental SCBCT. Scans were obtained at different exposure times and fields of view (FOV), both for non-spectral (25×18 cm, 14×18 cm, 14×12 cm, 9×9 cm, 6×6 cm) and spectral modes (14×18 cm, 14×12 cm, 9×9 cm, 6×6 cm) with the tube voltage alternating between 80 and 110 kV for spectral mode, and fixed at 110 kV for non-spectral mode. An ion chamber was used for air kerma and dose area product (DAP) measurements. The effective dose was estimated based on the mAs using previously published logarithmic curves for CBCT units with a similar X-ray spectrum.
Results:
The adult effective dose, in non-spectral mode, was 44-269 µSv for small FOVs, 131-336 µSv for the medium FOV, and 163-476 µSv for the large FOV. In spectral mode, the estimated adult effective doses were 96-206 µSv for small, 299 µSv for medium and 372 µSv for large FOV protocols. Paediatric effective doses were estimated to be 75% higher than corresponding adult doses.
Conclusion:
SCBCT showed comparable doses with other CBCT devices, but DAP values were generally above currently published DRLs. Spectral imaging might allow for artefact reduction at comparable dose levels, which should be assessed in further image quality studies at both a technical and diagnostic levels.
Keywords: Cone-beam computed tomography, Radiation dosimetry, Dentistry, Spectral computed tomography
Introduction
Because of technological advances in the field of dentistry, digital imaging techniques and three-dimensional scanning techniques have been introduced in the clinical set-up. The interest in 3D imaging increased rapidly in the last decade after the introduction of cone-beam CT (CBCT).1,2 These devices exhibit wide variability in terms of exposure parameters such as the X-ray spectrum (tube voltage and filtration), X-ray exposure (tube current and number of projections), and volume of the exposed field.3 All these parameters can affect the image quality as well as the radiation dose.4
Dual-energy CT (DECT) and spectral CT scanners have been developed in recent years, but are not specifically designed for dental imaging. The main advantage of spectral CT in dental imaging is the potential reduction of metal artefacts with virtual monochromatic imaging.5 The combination of virtual monochromatic imaging and projection completion methods can also further reduce metal artefacts with large metallic objects.6 Recently, a dental spectral cone-beam CT (SCBCT) has been introduced on the market (UEG Spectrum XL/L; UEG Medical Imaging Equipment Co. Ltd., Shanghai, China). The unit allows for scanning with a fixed tube voltage, and for spectral imaging with a tube voltage alternating between 80 and 110 kV. The main difference between SCBCT and DECT is the lower projection number and of signal-to-noise ratio (SNR) of SCBCT. A recent study for the UEG SCBCT showed a reduction of metal artefacts and improvement of the contrast-to-noise ratio around dental metallic fillings.5 However, no study has been performed to evaluate the radiation dose levels for SCBCT. Thus, the purpose of this study was to evaluate the dose measurements for all combinations of technical parameters of this newly introduced SCBCT unit.
Methods and materials
CBCT equipment and scanning protocols
All measurements were performed on the UEG Spectrum XL/L dental SCBCT scanner. This device provides a spectral scan mode in which X-ray beams with two different spectra are emitted alternately through a dynamic filtration technique, which uses a rotating copper plate placed in front of the X-ray source to generate the high-energy (110 kV) and low-energy (80 kV) X-ray spectrum. Then, a virtual monochromatic image can be produced by an enhanced frequency split algorithm. The unit also allows for traditional (single-energy) scanning using the Feldkamp algorithm (a.k.a. Feldkamp-Davis-Kress or FDK), which is a conventional reconstruction algorithm for single-energy CBCT.5
CBCT image acquisition
Spectral scans and traditional scans were performed using 21 scanning protocols for a range of exposure settings. The X-ray tube voltage alternated between 80 and 110 kV for spectral and was fixed at 110 kV for non-spectral modes. The tube current values were 4–8 mA. Full-rotation (360°) scans were used. Exposure time, field of view (FOV), and voxel size were varied as shown in Table 1. The flat-panel detector (C12821DK-40 flat panel sensor, Hamamatsu Photonics, Hamamatsu, Japan) has a pixel size of 0.12×0.12 mm; 2×2 binning mode was used to improve the reading speed and reduce read-out noise. The rotation times were 30 s for spectral scanning and 17 s for traditional scanning.
Table 1.
Technical specifications, fields of view (FOV) and voxels sizes for spectral and non-spectral modes of the SCBCT unit
| FOV D × H |
Voxel | Voltage (kV) | Tube current (mA) | Exposure time per view (s) | mAs | Angle | Total exposure time (ms) | Scan time (s) | Number of projections | |
|---|---|---|---|---|---|---|---|---|---|---|
| Non-Spectral mode | 6 × 6 | 0.075 | 110 | 9 | 14.4 | 129.6 | 360 | 14400 | 27 | 800 |
| 0.1 | 110 | 9 | 7.2 | 64.8 | 360 | 7200 | 20 | 600 | ||
| 0.2 | 110 | 9 | 6 | 54 | 360 | 6000 | 17 | 500 | ||
| 0.25 | 110 | 9 | 4.5 | 40.5 | 360 | 4500 | 8.5 | 250 | ||
| 0.3 | 110 | 9 | 2.34 | 21.6 | 360 | 2340 | 4.4 | 130 | ||
| 9 × 9 | 0.1 | 110 | 9 | 7.2 | 64.8 | 360 | 7200 | 20 | 600 | |
| 0.2 | 110 | 9 | 6 | 54 | 360 | 6000 | 17 | 500 | ||
| 0.25 | 110 | 9 | 4.5 | 40.5 | 360 | 4500 | 8.5 | 250 | ||
| 0.3 | 110 | 9 | 2.34 | 21.6 | 360 | 2340 | 4.4 | 130 | ||
| 14 × 12 | 0.2 | 110 | 9 | 6 | 54 | 360 | 6000 | 4.4 | 500 | |
| 0.25 | 110 | 9 | 4.5 | 40.5 | 360 | 4500 | 8.5 | 250 | ||
| 0.3 | 110 | 9 | 2.34 | 21.6 | 360 | 2340 | 17 | 130 | ||
| 14 × 18 | 0.2 | 110 | 9 | 6 | 54 | 360 | 6000 | 4.4 | 500 | |
| 0.25 | 110 | 9 | 4.5 | 40.5 | 360 | 4500 | 8.5 | 250 | ||
| 0.3 | 110 | 9 | 2.34 | 21.6 | 360 | 2340 | 17 | 130 | ||
| 25 × 18 | 0.25 | 110 | 9 | 6 | 54 | 360 | 6000 | 8,5 | 500 | |
| 0.3 | 110 | 9 | 4.5 | 40.5 | 360 | 4500 | 17 | 250 | ||
| Spectral | 6 × 6 | 0.2 | 80/110 | 9 | 8.25 | 74.25 | 360 | 8250 | 35 | 750 |
| 9 × 9 | 0.2 | 80/110 | 9 | 8.25 | 74.25 | 360 | 8250 | 35 | 750 | |
| 14 × 12 | 0.2 | 80/110 | 9 | 8.25 | 74.25 | 360 | 8250 | 35 | 750 | |
| 14 × 18 | 0.2 | 80/110 | 9 | 8.25 | 74.25 | 360 | 8250 | 35 | 750 |
D, diameter; H, height.
Dose measurements
The experimental dose measurements included air kerma (Ka, mGy) and dose-area product (DAP; mGycm),2 which were obtained with a dosemeter (MagicMax Universal, IBA Dosimetry GmbH, Schwarzenbruck, Germany). The dosemeter was calibrated and certified recently (22 March, 2019) by the Shanghai Institute of Measurement and Testing Technology (National Center of Measurement and Testing for East-China). The dosemeter was placed on the detector where a horizontal laser index line and vertical laser index line intersects, as shown in Figures 1–2, and connected to a computer. During scanning, the Ka was measured. DAP was derived from the Ka taking into account the active detector area. As the dose distribution on the detector is not homogeneous, the detector readout was used to estimate the 2D dose distribution, according to:
Figure 1.

Experimental set-up for measuring dose.
Figure 2.
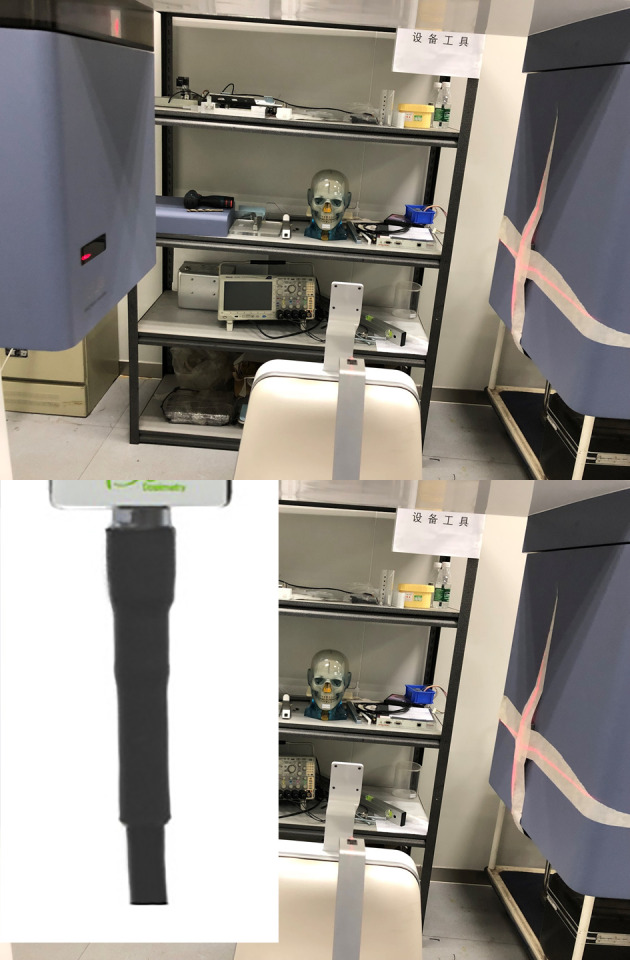
Placement of dosemeter on the detector.
| (1) |
where is the Ka at the sample point, is the detector readout in the sample point, is the detector readout at an arbitrary point, and is the Ka at an arbitrary point. The detector readout was first corrected by the dark signal and was averaged over 100 projections to reduce the noise. The detector readout measurement was performed once for each FOVwith the same kV and mAs/frame. For non-spectral mode, the detector readout was measured at the following conditions: 6×6cm2 0.075mm, 9×9cm2 0.1mm, 14×12 cm2 0.2mm, 25×18 cm2 0.25mm. For spectral mode,the detector readout was measured for each FOV. DAP was then calculated by integration of the Ka over the reception area:
| (2) |
Estimation of effective dose
The effective dose (E) per mAs was calculated using the logarithmic curves determined by Stratis et al7:
| (3) |
where A is the patient age in years, and a and b are factors specific to the CBCT model, FOV size and FOV position. These factors were determined by Stratis et al7 for several CBCT models, based on customized Monte-Carlo simulations. In order to apply the factors for a given simulated CBCT model to a different CBCT model, it is paramount that the X-ray spectrum is as similar as possible, because the relation between tube output and patient dose is energy-dependent. Therefore, to estimate the effective dose of the SCBCT in non-spectral mode, a and b values established for the NewTom VGi evo (Quantitative Radiology, Cefla Dental Group, Verona, Italy) were used due to its similar X-ray spectrum.7 For spectral mode, for the high-kV contribution, the same factors as for non-spectral mode were used, whereas the low-kV contribution to the effective dose was estimated using a and b values estimated for the CS 9300 (Carestream, Rochester, NY, USA) due to the lower beam energy of this CBCT model.7
Seeing that the a and b values in Eq. 3 are also dependent on the FOV size and position, an additional correction was needed to apply the values published by Stratis et al7 to the specific FOV sizes of the SCBCT. First, effective doses were calculated for a 10-year-old gender-averaged patient for all FOVs of the NewTom VGi evo and CS 9300, using their published a and b coefficients.7 To estimate the effective dose for the FOVs of the SCBCT, a logarithmic fit between the FOV dimensions and E/mAs values was derived for the NewTom VGi evo and CS 9300, adhering to the formula determined by Pauwels et al.8:
| (4) |
With D and H the diameter and height of the FOV in cm. Next, Eq. 4 was applied to the specific FOV dimensions (D and H) of the SCBCT to calculate the E/mAs for spectral and non-spectral modes. The E/mAs was then multiplied with the mAs of a given scan protocol to estimate the effective dose for that protocol for a 10 y.o. gender-averaged patient.
To estimate the dose for an adult patient, the curves derived from Eq. 3 could not be applied directly, because it was found that the ratio between the effective dose for a 10 y.o. and an adult (≥18 y.o.) patient was inconsistent between FOVs and CBCT units. Therefore, a fixed conversion from paediatric to adult dose was found to be more suitable. To determine this conversion, Eq. 3 was used to estimate the effective dose per mAs for 18-year-old patients for the different FOVs of the NewTom VGi evo and CS 9300. It was assumed that, since head size stabilizes around the age of 18 years, the effective dose for an 18-year-old represents that of an adult. The adult dose estimates were compared with doses for 10-year-old patients for the same exposure protocols. The average ratio between pediatric and adult effective dose (E10y.o./Eadult) was 1.75; this ratio was applied to the aforementioned paediatric dose estimates of the SCBCT to determine the corresponding adult dose.
Results
DAP measurements
Table 2 shows the dose measurement results according to various FOVs and scan modes. There was an increase in DAP values in spectral mode scanning with an average of approximately 50%. High-resolution protocols showed a higher DAP, commensurate to the increase in mAs.
Table 2.
Dose measurement results according to various FOVs and voxels sizes of the SCBCT unit
| FOV (D × H) | Voxel | Air kerma at sample point (mGy) | DAP (mGycm²) | Readout value of detector at sample pointb | Average readout value of detector in total areab | Area of X-ray beam on the detector (cm2)a | |
|---|---|---|---|---|---|---|---|
| Non-Spectral mode | 6 × 6 | 0.075 | 6.58 | 625.8 | 16520 | 2807 | 80.3 |
| 0.1 | 3.00 | 285.6 | 16520 | 2807 | 80.3 | ||
| 0.2 | 2.50 | 238.2 | 16520 | 2807 | 80.3 | ||
| 0.25 | 2.05 | 195.4 | 16520 | 2807 | 80.3 | ||
| 0.3 | 1.03 | 98.2 | 16520 | 2807 | 80.3 | ||
| 9 × 9 | 0.1 | 3.05 | 555.2 | 12030 | 3908 | 181.0 | |
| 0.2 | 2.55 | 464.6 | 12030 | 3908 | 181.0 | ||
| 0.25 | 2.09 | 380.6 | 12030 | 3908 | 181.0 | ||
| 0.3 | 1.05 | 191.6 | 12030 | 3908 | 181.0 | ||
| 14 × 12 | 0.2 | 2.59 | 938.5 | 12130 | 7840 | 377.8 | |
| 0.25 | 2.12 | 767.7 | 12130 | 7840 | 377.8 | ||
| 0.3 | 1.07 | 388.4 | 12130 | 7840 | 377.8 | ||
| 14 × 18 | 0.2 | 2.61 | 1335.7 | 12610 | 11528 | 554.6 | |
| 0.25 | 2.14 | 1096.6 | 12610 | 11528 | 554.6 | ||
| 0.3 | 1.07 | 549.8 | 12610 | 11528 | 554.6 | ||
| 25 × 18 | 0,.5 | 2.70 | 1322.8 | 12260 | 10718 | 559.8 | |
| 0.3 | 2.19 | 1069.7 | 12260 | 10718 | 559.8 | ||
| Spectral | 6 × 6 | 0.2 | 4.28 | 407.3 | 16520 | 2807 | 80.3 |
| 9 × 9 | 0.2 | 4.33 | 786.8 | 12030 | 3908 | 181.0 | |
| 14 × 12 | 0.2 | 4.35 | 1575.2 | 12130 | 7840 | 377.8 | |
| 14 × 18 | 0.2 | 4.36 | 2233.6 | 12610 | 11528 | 554.6 |
Area of X-ray beam on the detector (In cm2).
Values determined for a given FOV apply to all protocols with the same FOV
Comparison of dose area product (DAP) with diagnostic reference levels (DRLs)
DAP values of the SCBCT were compared with published DRLs from the UK9 and Finland.10
For placement of a single implant
Non-spectral mode: Scanning protocols with a FOV of 6×6 cm and a voxel size of 0.2 mm or above showed a DAP of 92–238 mGy.cm2, which is below both the UK9 (265 mGy.cm2) and Finnish10 (360 mGy.cm2) DRL. The DAP of the ‘6×6 cm, 0.1 mm voxel size’ protocol (286 mGy.cm2) was above the UK9 DRL but below that of Finland,10 whereas the protocol 0.075 mm voxel size showed a DAP of 625, 8 mGy.cm2, which is well above both DRLs.
Spectral mode: The DAP of the 6×6 cm FOV was 13% higher than the Finnish10 DRL and 54% higher than the UK9 DRL.
For wisdom tooth evaluation
Non-spectral mode: The Finnish10 DRL is 380 mGy.cm2. All but one protocols for the 6×6 cm FOV were below this DRL; furthermore for the 9×9 cm FOV, DAP values for protocols with 0.25 mm and 0.3 mm voxel were equal to and below this DRL, respectively.
Spectral mode: The DAP for the 6×6 cm FOV was slightly above the DRL value.
For periapical/root canal evaluation
Non-spectral mode: The DAP for the 6×6 cm protocol with the highest resolution was slightly (14%) above the Finnish10 DRL.
Spectral mode: The DAP was below this DRL for the 6×6 cm FOV, but its voxel size (0.2 mm) may be too large for certain endodontic applications requiring high spatial resolution.
For imaging of paranasal sinuses
Non-spectral mode: All protocols for the 14×12 cm FOV showed a DAP below the Finnish10 DRL of 1150 mGy.cm2.
Spectral mode: The DAP for the 14×12 cm FOV was 37% above the DRL.
For paediatric indications
Only the UK9 DRL for scanning of an impacted maxillary canine is available (170 mGy.cm2). Only the 6×6 cm FOV in non-spectral mode at the lowest resolution (0.3 mm) was below this DRL; two other protocols were within 20% of this DRL value. In spectral mode, the DAP for the 6×6 cm FOV was more than double the UK9 DRL value.
Effective dose
Table 3 shows the estimated effective dose for each protocol. To allow comparison of the effective dose estimates with previously published data, protocols are classified according to the height of the FOV as ‘small’ (<10 cm) ‘medium’ (10–15 cm) and ‘large’ (>15 cm).11 The adult effective dose in non-spectral mode was 44–269 µSv for small FOVs, 131–336 µSv for the medium FOV, and 163–476 µSv for the large FOV. In spectral mode, adult effective doses were 96–206 µSv for small, 299 µSv for medium and 372 µSv for large FOV protocols. Paediatric (10 y.o.) effective doses in non-spectral mode ranged between 77 and 493 µSv for small FOV protocols, 230 and 589 µSv for medium FOVs and 625 and 834 µSv for large FOVs. In spectral mode, paediatric effective doses were 168–362 µSv for small FOVs, 523 µSv for the medium FOV, and 652 µSv for the large FOV.
Table 3.
Exposure settings, dose-area product and estimated effective dose for the SCBCT
| FOV | Voxel size (mm) | DAP (mGycm²) | Tube current (mA) | mAs | Effective dose (10 y.o.) | Effective dose (adult) | |
|---|---|---|---|---|---|---|---|
| Non-Spectral mode | Small | 0.075 | 626 | 9 | 129.6 | 472 | 269 |
| 0.1 | 286 | 9 | 64.8 | 236 | 135 | ||
| 0.2 | 238 | 9 | 54 | 197 | 112 | ||
| 0.25 | 195 | 9 | 40.5 | 148 | 84 | ||
| 0.3 | 98 | 9 | 21.06 | 77 | 44 | ||
| Small | 0.1 | 555 | 9 | 64.8 | 493 | 281 | |
| 0.2 | 465 | 9 | 54 | 411 | 234 | ||
| 0.25 | 381 | 9 | 40.5 | 308 | 176 | ||
| 0.3 | 192 | 9 | 21.06 | 160 | 91 | ||
| Medium | 0.2 | 939 | 9 | 54 | 589 | 336 | |
| 0.25 | 768 | 9 | 40.5 | 442 | 252 | ||
| 0.3 | 388 | 9 | 21.06 | 230 | 131 | ||
| Large | 0.2 | 1336 | 9 | 54 | 732 | 418 | |
| 0.25 | 1097 | 9 | 40.5 | 549 | 313 | ||
| 0.3 | 550 | 9 | 21.06 | 285 | 163 | ||
| Large | 0.25 | 1323 | 9 | 54 | 834 | 476 | |
| 0.3 | 1070 | 9 | 40.5 | 625 | 357 | ||
| Spectral | Small | 0.2 | 407 | 9 | 74.25 | 168 | 96 |
| Small | 0.2 | 787 | 9 | 74.25 | 362 | 206 | |
| Medium | 0.2 | 1575 | 9 | 74.25 | 523 | 299 | |
| Large | 0.2 | 2234 | 9 | 74.25 | 652 | 372 |
Discussion
Evaluation of patient dose exposed during the CBCT examination has been of increasing interest due to the profound dissemination of CBCT equipment in dental practice. The introduction of SCBCT in dental practice warrants an initial evaluation of its radiation dose vs other CBCT units and DRLs.
The DAP was proposed as a dose index for dental CBCT as early as 2010,12 due to the limited applicability of the traditional CT dose index (CTDI) for wide beams.13 This study showed that the DAP values of the SCBCT unit in this study ranged considerably in accordance to the resolution mode, more specifically the mAs, and FOV size. This result is in line with a previous study.14 It is essential for a CBCT unit to offer an array of exposure protocols, allowing for optimized use that takes into account the clinical indication and patient size. Optimization should ideally comprise a combination of radiation dosimetry, technical image quality measurements, and clinical image quality evaluation.15
The effective dose estimates provide complementary information to the DAP values. Whereas the latter is essentially a measurement of tube output, the effective dose is affected by the irradiated organs and areas of the body. As a result, two protocols with the same DAP value can result in highly different organ and effective doses.
When comparing the estimated effective doses with the dose range for CBCT reported in the literature,11 for the adult dose in non-spectral mode, 2 out of 9 small-FOV protocols were below the mean effective dose (84 µSv) reported for that category, whereas 1/3 of medium-FOV protocols and 1/5 large-FOV protocols were below their respective mean reported effective dose (177 and 212, respectively). In spectral mode, the estimated adult effective doses were well above mean doses found in the literature. Paediatric effective doses for small FOVs were above the mean effective dose reported in the literature (i.e. 103 µSv) for all but one protocol.11 For medium/large FOVs, all protocols were above the mean effective dose of 175 µSv. In spectral mode, doses were 63–273% higher than the aforementioned means. These findings point out that, as for any new CBCT model, indication- and patient-specific exposure protocols need to be defined in order to use the available range in exposure settings optimally. When operating in non-spectral mode, low-dose protocols should be applied when possible, and high-dose (i.e. high-resolution) protocols when required for diagnosis. Furthermore, large FOVs should be used judiciously due to the commensurate increase in patient dose. As for spectral mode, it can be expected that its dose is somewhat higher than currently published DRLs and effective dose due to the need for a dual exposure. However, this increased dose needs to be balanced by the potentially increased diagnostic yield, e.g. owing to artefact reduction.
Although CBCT has promoted changes especially for difficult assessment conditions, such as complex and unclear cases,16 the quality of CBCT reconstructed images can be jeopardized in the presence of metal artefacts. Shadows and streaks mask the metal objects and the anatomical structures in the vicinity, thus impairing or even invalidating the diagnosis. When these artefacts were compared on different CBCT units, the results showed a significant variation of artefact expression amongst CBCTs, with some systems yielding significantly inferior results than others.17,18 The use of hardware and software-based artefact correction might be of great value for artefact reduction in dentomaxillofacial CBCT imaging, since this approach has shown good results for thoracic and abdominal areas.19 Recently, this strategy was applied to establish a dental SCBCT. For DECTs, numerous studies were published regarding dose measurements and image optimization.20 However, no study has been performed to evaluate the radiation dose levels for dental SCBCT.
Several limitations exist in this study. First and foremost, the effective dose estimates are prone to several sources of uncertainty. The logarithmic curves developed by Stratis et al7 were customized to specific CBCT units based on Monte-Carlo simulation of the X-ray spectrum as well as exposure geometry. To mitigate the error of using these curves on a different CBCT unit, we opted to apply curves for CBCT units that matched the effective beam energy of the SCBCT as closely as possible, and corrected for discrepancies in FOV sizes between the SCBCT and CBCT units that the curves were developed for. In addition, the aforementioned curves were developed based on pediatric voxel models representing patients up to the age of 14 years. Hence, there is a degree in uncertainty in applying Eq. 3 to adults, which is why a fixed ratio was calculated to derive adult effective doses based on 10-year-old doses. Furthermore, as mentioned above, no image quality assessments were made in this study connected to different radiation dose levels of the SCBCT unit. Further studies are required to examine the image quality on a technical and diagnostic level. By investigating technical image quality, the relation between the exposure from CBCT devices and the image quality performance in terms of noise, sharpness, contrast, and artefacts can be quantified; diagnostic quality studies should link all quantifications of dose of image quality to performance evaluation on a clinical level, with a special focus on metal artefact reduction of SCBCT.
Conclusions
In conclusion, SCBCT showed comparable effective doses with other CBCT devices, but DAP values were generally above currently published DRLs. Spectral imaging might allow for artefact reduction at comparable dose levels and should be assessed in further image quality studies at both a technical and diagnostic level.
Footnotes
Competing interests: Dr. Yi Chen is an employee of UEG Medical Imaging Equipment Co. Ltd.
Funding: Ruben Pauwels is supported by the European Union Horizon 2020 Research and Innovation Programme under the Marie Skłodowska-Curie grant agreement number 754513 and by the Aarhus University Research Foundation (AIAS-COFUND). Kaan Orhan was supported by The Scientific and Technological Research Council of Turkey (TÜBİTAK) with grant no:115S237. Yi Chen was supported by Shanghai science and technology innovation plan (Grant No. 19441914100) and Shanghai Artificial Intelligence innovation and development project (Grant No. 2018 RGZN-02012).
Contributor Information
Kaan Orhan, Email: call53@yahoo.com.
Ruben Pauwels, Email: pauwelsruben@hotmail.com.
Yi Chen, Email: yichen@ueg.com.cn.
Dandan Song, Email: dandansong9015@gmail.com.
Reinhilde Jacobs, Email: reinhilde.jacobs@uzleuven.be.
REFERENCES
- 1.Shah N, Bansal N, Logani A. Recent advances in imaging technologies in dentistry. World J Radiol 2014; 6: 794–807. doi: 10.4329/wjr.v6.i10.794 [DOI] [PMC free article] [PubMed] [Google Scholar]
- 2.Suomalainen A, Pakbaznejad Esmaeili E, Robinson S. Dentomaxillofacial imaging with panoramic views and cone beam CT. Insights Imaging 2015; 6: 1–16. doi: 10.1007/s13244-014-0379-4 [DOI] [PMC free article] [PubMed] [Google Scholar]
- 3.Pauwels R, Beinsberger J, Collaert B, Theodorakou C, Rogers J, Walker A, et al. Effective dose range for dental cone beam computed tomography scanners. Eur J Radiol 2012; 81: 267–71. doi: 10.1016/j.ejrad.2010.11.028 [DOI] [PubMed] [Google Scholar]
- 4.Panmekiate S, Rungwittayathon P, Suptaweeponboon W, Tangtraitham N, Pauwels R. Optimization of exposure parameters in dental cone beam computed tomography using a 3-step approach. Oral Surg Oral Med Oral Pathol Oral Radiol 2018; 126: 545–52. doi: 10.1016/j.oooo.2018.08.004 [DOI] [PubMed] [Google Scholar]
- 5.Zhu L, Chen Y, Yang J, Tao X, Xi Y. Evaluation of the dental spectral cone beam CT for metal artefact reduction. Dentomaxillofac Radiol 2019; 48: 20180044. doi: 10.1259/dmfr.20180044 [DOI] [PMC free article] [PubMed] [Google Scholar]
- 6.Xi Y, Jin Y, De Man B, Wang G. High-kVp assisted metal artifact reduction for X-ray computed tomography. IEEE Access 2016; 4: 4769–76. doi: 10.1109/ACCESS.2016.2602854 [DOI] [PMC free article] [PubMed] [Google Scholar]
- 7.Stratis A, Zhang G, Jacobs R, Bogaerts R, Bosmans H. The growing concern of radiation dose in paediatric dental and maxillofacial CBCT: an easy guide for daily practice. Eur Radiol 2019; 29: 7009–18. doi: 10.1007/s00330-019-06287-5 [DOI] [PubMed] [Google Scholar]
- 8.Pauwels R, Zhang G, Theodorakou C, Walker A, Bosmans H, Jacobs R, et al. Effective radiation dose and eye lens dose in dental cone beam CT: effect of field of view and angle of rotation. Br J Radiol 2014; 87: 20130654. doi: 10.1259/bjr.20130654 [DOI] [PMC free article] [PubMed] [Google Scholar]
- 9.Holroyd JR, Smith JR, Edyvean S. PHE-CRCE-51: dose to patients from dental radiographic X-ray imaging procedures in the UK 2017
- 10.Strålsäkerhetscentralen Stuk Reference levels for patient radiation exposure in cone-beam computed tomography examinations of adults’ head region. [Decision 12/3020];STUK. 2016
- 11.Ludlow JB, Timothy R, Walker C, Hunter R, Benavides E, Samuelson DB, et al. Effective dose of dental CBCT-a meta analysis of published data and additional data for nine CBCT units. Dentomaxillofac Radiol 2015; 44: 20140197. doi: 10.1259/dmfr.20140197 [DOI] [PMC free article] [PubMed] [Google Scholar]
- 12.Holroyd JR, Walker A. HPA-RPD-065. Recommendations for the design of X-ray facilities and quality assurance of dental Cone Beam CT (Computed Tomography) systems. Chilton: Health Protection Agency; 2010. [Google Scholar]
- 13.Pauwels R, Theodorakou C, Walker A, Bosmans H, Jacobs R, Horner K, et al. Dose distribution for dental cone beam CT and its implication for defining a dose index. Dentomaxillofac Radiol 2012; 41: 583–93. doi: 10.1259/dmfr/20920453 [DOI] [PMC free article] [PubMed] [Google Scholar]
- 14.Kim D-S, Rashsuren O, Kim E-K. Conversion coefficients for the estimation of effective dose in cone-beam CT. Imaging Sci Dent 2014; 44: 21–9. doi: 10.5624/isd.2014.44.1.21 [DOI] [PMC free article] [PubMed] [Google Scholar]
- 15.Brasil DM, Pauwels R, Coucke W, Haiter-Neto F, Jacobs R. Image quality optimization using a narrow vertical detector dental cone-beam CT. Dentomaxillofac Radiol 2019; 48: 20180357. doi: 10.1259/dmfr.20180357 [DOI] [PMC free article] [PubMed] [Google Scholar]
- 16.Radiation protection No. 172 .Evidence based guidelines on cone beam CT for dental and maxillofacial radiology. Luxemburg: European Commission; 2012. https://ec.europa.eu/energy/sites/ener/files/documents/172.pdf. [Google Scholar]
- 17.Pauwels R, Stamatakis H, Bosmans H, Bogaerts R, Jacobs R, Horner K, et al. Quantification of metal artifacts on cone beam computed tomography images. Clin Oral Implants Res 2013; 24 Suppl A100: 94–9. doi: 10.1111/j.1600-0501.2011.02382.x [DOI] [PubMed] [Google Scholar]
- 18.Vasconcelos KdeF, Codari M, Queiroz PM, Nicolielo LFP, Freitas DQ, Sforza C, et al. The performance of metal artifact reduction algorithms in cone beam computed tomography images considering the effects of materials, metal positions, and fields of view. Oral Surg Oral Med Oral Pathol Oral Radiol 2019; 127: 71–6. doi: 10.1016/j.oooo.2018.09.004 [DOI] [PubMed] [Google Scholar]
- 19.Marchant TE, Price GJ, Matuszewski BJ, Moore CJ. Reduction of motion artefacts in on-board cone beam CT by warping of projection images. Br J Radiol 2011; 84: 251–64. doi: 10.1259/bjr/90983944 [DOI] [PMC free article] [PubMed] [Google Scholar]
- 20.Megibow AJ, Kambadakone A, Ananthakrishnan L. Dual-Energy computed tomography: image acquisition, processing, and workflow. Radiol Clin North Am 2018; 56: 507–20. doi: 10.1016/j.rcl.2018.03.001 [DOI] [PubMed] [Google Scholar]